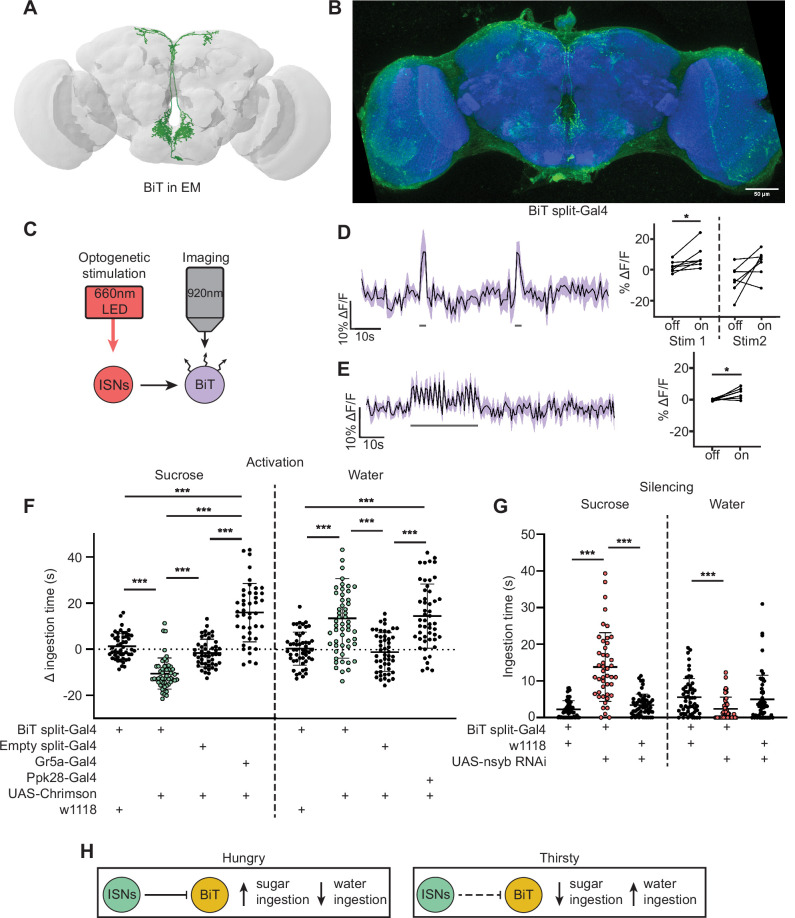
Figure 2. Interoceptive subesophageal zone neurons (ISNs) inhibit bilateral T-shaped neuron (BiT), which oppositely regulates sugar and water ingestion.
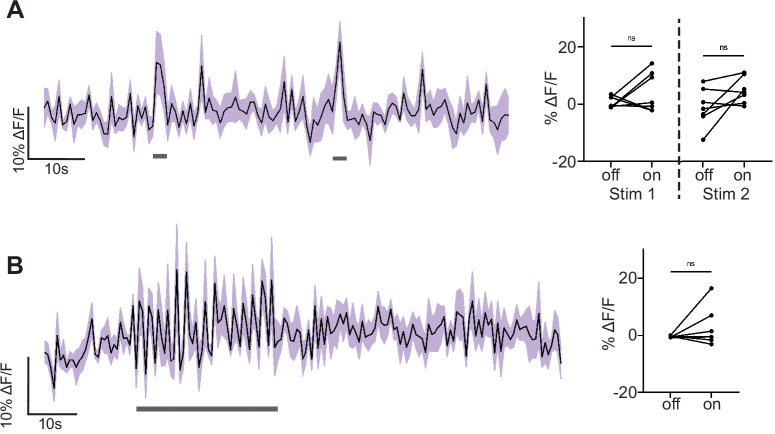
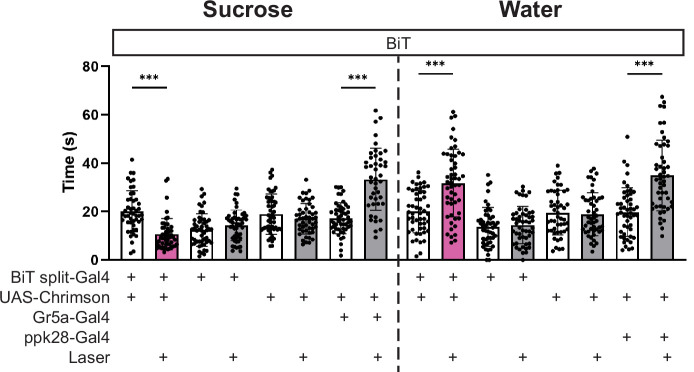
(A) BiT neuron reconstruction from full adult fly brain (FAFB) dataset. (B) Light microscopy image of BiT split-Gal4. (C) Experimental setup for in vivo voltage imaging. We expressed the light-sensitive ion channel Chrimson in the ISNs and optogenetically stimulated them with 660 nm LED. We expressed the voltage sensor ArcLight in BiT and imaged it with a two-photon microscope. (D) ArcLight response of BiT soma to 2 s optogenetic stimulation of the ISNs or (E) 30 s optogenetic stimulation of the ISNs. Left: Scatter plot shows mean ± SEM of all flies imaged, gray bars represent LED stimulation. Right: Quantification of mean fluorescence intensity before stim (off) and during stim (on), each dot represents one fly. Paired Wilcoxon and paired t-test (Stim 2, p=0.07). n=7 flies. (F) Temporal consumption assay for 1 M sucrose or water during acute optogenetic activation of BiT with Chrimson. Ingestion time of females exposed to light normalized to dark controls of indicated genotype. Sucrose: Kruskal-Wallis test with Dunn’s multiple comparison test. Water: One-way ANOVA with Holm-Šídák multiple comparison test. n=44–54 animals/genotype. (G) Temporal consumption assay for 1 M sucrose or water using RNAi targeting nSyb in BiT. Kruskal-Wallis with Dunn’s multiple comparison test. n=45–57 animals/genotype. (H) Neural model for BiT coordination of sucrose and water intake. Dashed lines indicate inactive synapses. *p<0.05, ***p<0.001.


