

Significance
Cancers acquire multiple mutations that cooperate to drive carcinogenesis. One could imagine that each new alteration would increase fitness. However, many previous studies across diverse evolutionary systems have found that fitness landscapes are rugged, where a mutation is advantageous only in specific genetic contexts. Characterizing cancer fitness landscapes would aid our understanding of tumorigenesis. By coupling tumor barcoding with genome editing, we describe the fitness landscapes of combinatorial inactivation of three tumor suppressor genes that lead to oncogene-negative lung adenocarcinoma. We find that the fitness landscape of Nf1;Rasa1;Pten is fully accessible, with each mutation increasing fitness in any order. Fully accessible landscapes make evolution to complex genotypes more probable while hindering our ability to predict the order of adaptive mutations.
Keywords: cancer evolution, mouse models, quantitative, fitness landscapes
Abstract
Cancer genomes are almost invariably complex with genomic alterations cooperating during each step of carcinogenesis. In cancers that lack a single dominant oncogene mutation, cooperation between the inactivation of multiple tumor suppressor genes can drive tumor initiation and growth. Here, we shed light on how the sequential acquisition of genomic alterations generates oncogene-negative lung tumors. We couple tumor barcoding with combinatorial and multiplexed somatic genome editing to characterize the fitness landscapes of three tumor suppressor genes NF1, RASA1, and PTEN, the inactivation of which jointly drives oncogene-negative lung adenocarcinoma initiation and growth. The fitness landscape was surprisingly accessible, with each additional mutation leading to growth advantage. Furthermore, the fitness landscapes remained fully accessible across backgrounds with the inactivation of additional tumor suppressor genes. These results suggest that while predicting cancer evolution will be challenging, acquiring the multiple alterations that drive the growth of oncogene-negative tumors can be facilitated by the lack of constraints on mutational order.
Fitness landscapes are a helpful conceptual aid in understanding evolutionary processes (1). In a fitness landscape, genotypes are represented as nodes on a graph such that two genotypes are connected by an edge if they differ by a single allele and thus each genotype can be reached from the other by a single alteration (2). Fitness values of each genotype are shown as an extra (height) dimension with adaptation represented as a hill-climbing adaptive walk. The key properties of evolutionary adaptation, such as its predictability and the ability of adaptation to reach the fittest genotype in a deterministic walk, are determined by the shape of the landscape, specifically by its ruggedness (3). The ruggedness of the fitness landscape is defined by the frequency of sign epistasis, a phenomenon where a mutation is advantageous in one genetic context but disadvantageous in another. Sign epistasis determines whether an adaptive walk can end up stalled on a local fitness peak and whether only some combinations of mutations are sequentially adaptive. Intriguingly, many previous studies found that rugged fitness landscapes are common across diverse evolutionary systems (3–7). This suggests that early adaptive mutations can strongly affect the direction of the adaptive process and limit the accessible adaptive paths (SI Appendix, Fig. S1) (8).
Cancers are driven by the sequential acquisition of genetic driver mutations and thus are canonical examples of adaptive walks on a fitness landscape. Nonetheless, full fitness landscapes for cancer remain poorly understood due to the difficulty of inferring the fitness of growing tumors, the combinatorially large numbers of intermediate genotypes for even moderately genetically complex tumors, and the fact that tumors are generally analyzed once they have accumulated a large number of mutations with the order of the early steps hidden from the study. Despite the importance of defining the properties of cancer fitness landscapes for understanding tumorigenesis, we currently lack experimental systems to quantify the fitness of nascent tumors of diverse sequential genotypes growing in vivo. Defining cancer fitness landscapes could help to determine cancer progression and its therapeutic vulnerabilities. Human cancer genomics has uncovered genomic alterations that are mutually exclusive with one another, and we and others have found sign epistasis between oncogene and tumor suppressor mutations that suggests that cancer fitness landscapes might be rugged and not fully accessible (9–11).
Oncogene-negative tumors represent ~20% of lung adenocarcinoma cases and affect ~150,000 patients each year worldwide (12–15). These tumors lack oncogene mutations, and a large fraction of them could be driven by the combinatorial inactivation of tumor-suppressive genes (15, 16). We recently identified combinatorial inactivation of Nf1 (neurofibromatosis 1), Rasa1 (RAS p21 protein activator 1), and Pten (phosphatase and tensin homolog) and activation of MAP Kinase (MAPK) and PI3 Kinase (PI3K) pathway as a potent driver of a subset of oncogene-negative lung tumors (15). While oncogene-negative tumors represent a large fraction of lung cancer, they likely require the coincident inactivation of multiple tumor suppressor genes to drive growth comparably to a single oncogene alteration. This raises the question of the extent to which genetic interactions among individual tumor suppressor mutations affect fitness during cancer evolution. Does inactivation of each gene confer a growth benefit regardless of genetic context, and hence form a fully accessible fitness landscape, or do they form a rugged fitness landscape where only certain orders of mutations are favored by selection?
Here, we characterized the full fitness landscape of autochthonous oncogene-negative lung tumors with combinatorial inactivation of the NF1, RASA1, and PTEN tumor suppressor genes. We used combinatorial and multiplexed somatic CRISPR/Cas9 genome editing and tumor barcoding to quantify the accessibility of the Nf1, Rasa1, and Pten triple-mutant genotype via all possible single steps. We further investigated how the shape of the fitness landscape is affected by the inactivation of other tumor suppressor genes. We uncover an unexpectedly smooth landscape that remains accessible even in the presence of additional tumor suppressor alterations.
Results
Quantitative Analysis of the Size and Number of Tumors of Each Stepwise Genotype toward Nf1;Rasa1;Pten Triple-Mutant Lung Tumors.
To quantify the impact of diverse genotypes on tumor initiation and growth, we developed a method based on tumor barcoding coupled with high-throughput barcode sequencing (Tuba-seq) (17–19). Tuba-seq uses lentiviral-based DNA barcoding coupled with CRISPR-Cas9 genome editing and genetically engineered mouse alleles to generate and quantify the number and size of tumors of many different genotypes in parallel (SI Appendix, Fig. S2A). Each lentiviral vector encodes Cre recombinase, a single guide RNA (sgRNA), as well as a two-component barcode region with a fixed sgRNA identifier (sgID) that labels the vector and a random barcode (BC) that uniquely tags each clonal tumor that arises from the initial transduced cell.
We previously used Tuba-seq to identify combinations of tumor suppressor genes whose inactivation is capable of driving lung adenocarcinoma in the absence of oncogene mutations. Specifically, we identified that coincident inactivation of Nf1, Rasa1, and Pten is a potent driver of oncogene-negative lung adenocarcinoma (15). To investigate the contribution of single, double, and triple mutations of Nf1, Rasa1, and Pten to the genesis of oncogene-negative lung adenocarcinomas, we previously initiated tumors in R26LSL-Tomato;H11LSL-Cas9 (TC) and Trp53f/f;TC mice with a pool of eight uniquely dual barcoded lentiviral vectors with sgRNAs targeting Nf1, Rasa1, and Pten (Fig. 1A). This pool contains lentiviral triple sgRNA vectors that target each gene alone, in pairwise combinations, and all three together (Lenti-sgTSTriple-pool/Cre, Fig. 1A) (15). These mice developed thousands of clonal tumors of different genotypes (SI Appendix, Fig. S2 B and C). Our previous Tuba-seq analysis indicated that most of the tumor burden in TC and Trp53f/f;TC mice was from tumors with concomitant inactivation of all three tumor suppressor genes (15). However, we had not previously used our high-resolution tumor barcoding data to build a fitness landscape to understand the potential evolutionary paths to the triple-mutant state, nor had we compared the tumorigenic potential between the p53-proficient and -deficient backgrounds.
Fig. 1.
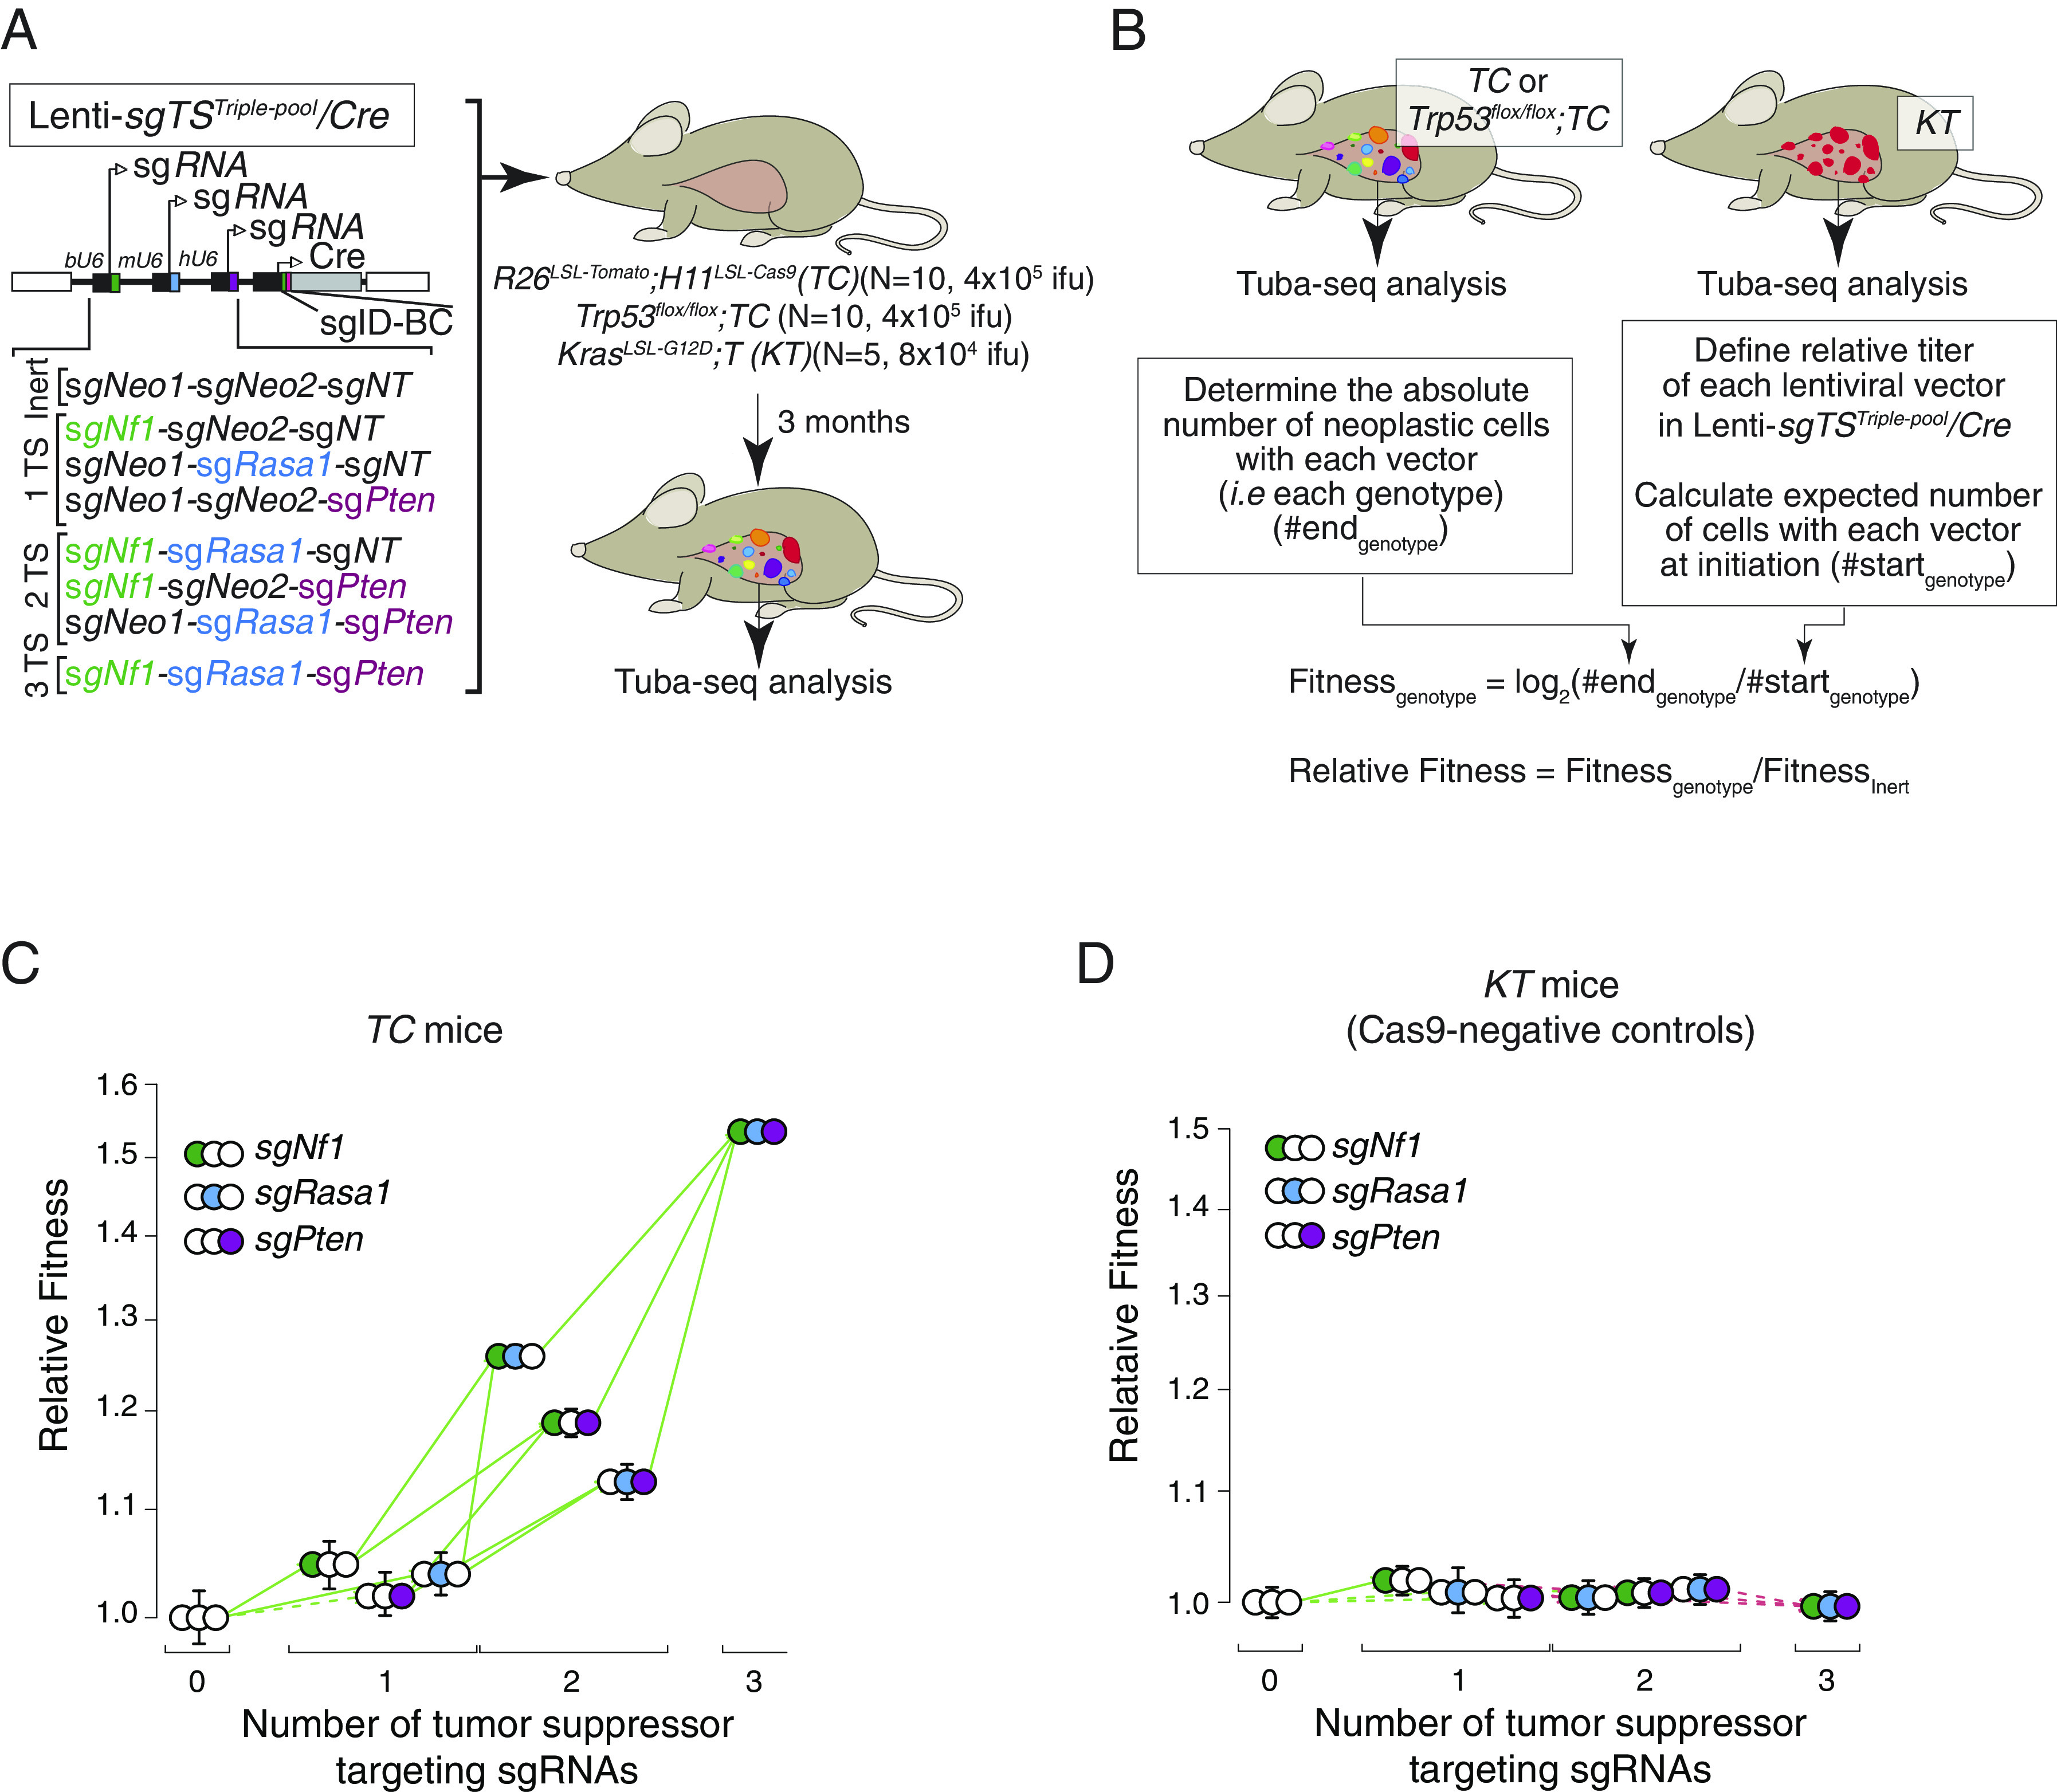
The fitness landscape of Nf1;Rasa1;Pten oncogene-negative lung adenocarcinoma is fully accessible. (A) Schematic of barcoded triple sgRNA vectors in the Lenti-sgTSTriple-pool/Cre pool for CRISPR/Cas9-mediated inactivation of all combinations of Nf1, Rasa1, and Pten in R26LSL-Tomato;H11LSL-Cas9 (TC), Trp53flox/flox;TC mice, and Cas9-negative KrasLSL-G12D;T (KT) mice. sgNeo1, sgNeo2, and sgNT are inert sgRNAs. The number and size of tumors initiated with each vector can be quantified by tumor barcoding coupled with high-throughput barcode sequencing (Tuba-seq). Mouse genotype, mouse number, and viral titer (ifu; infectious units) are indicated. Tuba-seq was performed on bulk tumor-bearing lungs 3 mo after tumor initiation. Data were generated in Yousefi, Boross et al., Cancer Research 2022. (B) Overview of our method to calculate the relative fitness of each cancer genotype (Methods). (C and D) Fitness landscape for TC (C) and KrasLSL-G12D;T (Cas9-negative control) (D) mice. Fitness for tumors of each single and double-mutant genotype, as well as those with all three tumor suppressor gene targeting sgRNAs are shown relative to the triple inert vector. Green arrows indicate increased fitness, red arrows indicate reduced fitness, and the solid lines indicate significance (P value < 0.05). Whiskers show 95% CIs from bootstrap resampling of tumors.
The Fitness Landscape of Nf1;Rasa1;Pten Triple-Deficient Lung Tumors is Completely Accessible.
Generating Tuba-seq data on tumors initiated with lentiviral vectors that create all possible combinatorial mutations of Nf1, Rasa1, and Pten should enable the generation of a complete fitness landscape across all genotypes. We approximated the relative fitness of each genotype by calculating the growth rate using data on tumor number and size (Fig. 1B and Methods). Across these three tumor suppressor genes, there are six possible paths on the landscape, i.e., six possible routes from the genotype with the lowest fitness to the one with the highest fitness (SI Appendix, Fig. S3A). As anticipated, we found that Nf1;Rasa1;Pten triple-mutant tumors had the highest relative fitness in TC mice (Fig. 1C). Interestingly, all mutational routes leading to the Nf1;Rasa1;Pten triple-mutant genotype were accessible, with each additional mutation increasing fitness beyond the fitness of the less complex genotypes of origin (Fig. 1C). These results are consistent with a model in which inactivation of each tumor suppressor gene is advantageous on all backgrounds regardless of whether the other two tumor suppressor genes are wild-type or mutant.
To assess the robustness of our relative fitness estimates, we performed a series of additional experiments. As an initial negative control for our method, we analyzed the tumors initiated with Lenti-sgTSTriple-pool/Cre in control Kras (Kirsten rat sarcoma virus)LSL-G12D;T (KT) mice, which lack Cas9 (Fig. 1A). In these mice, all sgRNAs are inert, and tumors with different sgIDs have the same genotype. As anticipated, our method uncovered a fitness landscape that was not accessible and that lacked the gains in fitness for tumors initiated with vectors with sgRNA targeting increasing numbers of tumor suppressor genes (Fig. 1D). Next, we performed a different method in which we used bootstrap resamples of mice as well as tumors, which had minimal impact on the overall significance of the fitness differences across the landscape in TC mice (SI Appendix, Fig. S3B).
In lung cancer models using lentiviral vectors, a small percent of tumors arise from cells that were transduced by more than one vector (15, 17). In the context of our experiments to map fitness, these multiple transduction events could impact tumor growth (except for tumors with the Nf1;Rasa1;Pten triple vector as they have the maximum numbers of possible mutations). We know that multiple infections must occur as we observe a small number of tumors containing the triple sgInert vector. These tumors are certainly the result of this vector cotransducing an initial cell with a vector that encodes one or more tumor suppressor gene targeting sgRNAs. We performed a series of analyses that take into account the expected rates of multiple transduction events and corrected our data to account for this effect. The number of sgInert tumors in TC mice was used to calculate the rate of coinfection in our experiments. We then used the rate of coinfection to remove a fraction of tumors of each genotype, picking the tumors to remove based on the size distribution of Nf1;Rasa1;Pten triple-mutant size distribution (Methods). Importantly, the landscape remained accessible regardless of correction for multiple transduction events (SI Appendix, Fig. S3C) as well as when we used an alternate method to correct for the impact of multiple transduction events (SI Appendix, Fig. S3D, see Methods). Our results show that the observed accessibility of the fitness landscape is robust to different methods that correct for multiple transduction events. These results are also consistent with experimental evidence from our previous study in which single- and double-mutant genotypes lead to some neoplastic growths in vivo (15).
Trp53-Deficiency Reduced Tumor Initiation without Impacting the Fully Accessible Landscape.
In oncogenic KRAS, EGFR (Epidermal growth factor receptor), and BRAF (B-Raf proto-oncogene, serine/threonine kinase)-driven lung cancer models, Trp53 inactivation increases tumor initiation/early tumor growth and tumor size (10, 18, 20). Our data allowed us to test whether Trp53 inactivation has a similar effect on the growth of oncogene-negative tumors, especially in case of the potent Nf1;Rasa1;Pten triple-deficient tumors. Similarly to the effects in the oncogene-driven tumors, multiple metrics of tumor size indicated that all tumors, as well as the Nf1;Rasa1;Pten triple-deficient tumors, were larger in Trp53f/f;TC mice relative to TC mice (Fig. 2 A, B, and F and SI Appendix, Fig. S4 A–D and F). In contrast, Trp53 inactivation reduced overall tumor number (i.e., number of tumors estimated to have >50 neoplastic cells), as well as Nf1;Rasa1;Pten triple-deficient tumor number (Fig. 2 C, D, and F and SI Appendix, Fig. S4F). These results agree with our previous visual analysis of surface tumor number in these mice (15) (Fig. 2E and SI Appendix, Fig. S4E). However, the reduction in tumor initiation is the opposite of the effect of Trp53-deficiency in oncogenic KRAS, BRAF, and EGFR-driven lung cancer models (9, 10, 18). Thus, Trp53 inactivation has a uniquely divergent effect on tumor initiation and tumor size in oncogene-negative tumors.
Fig. 2.
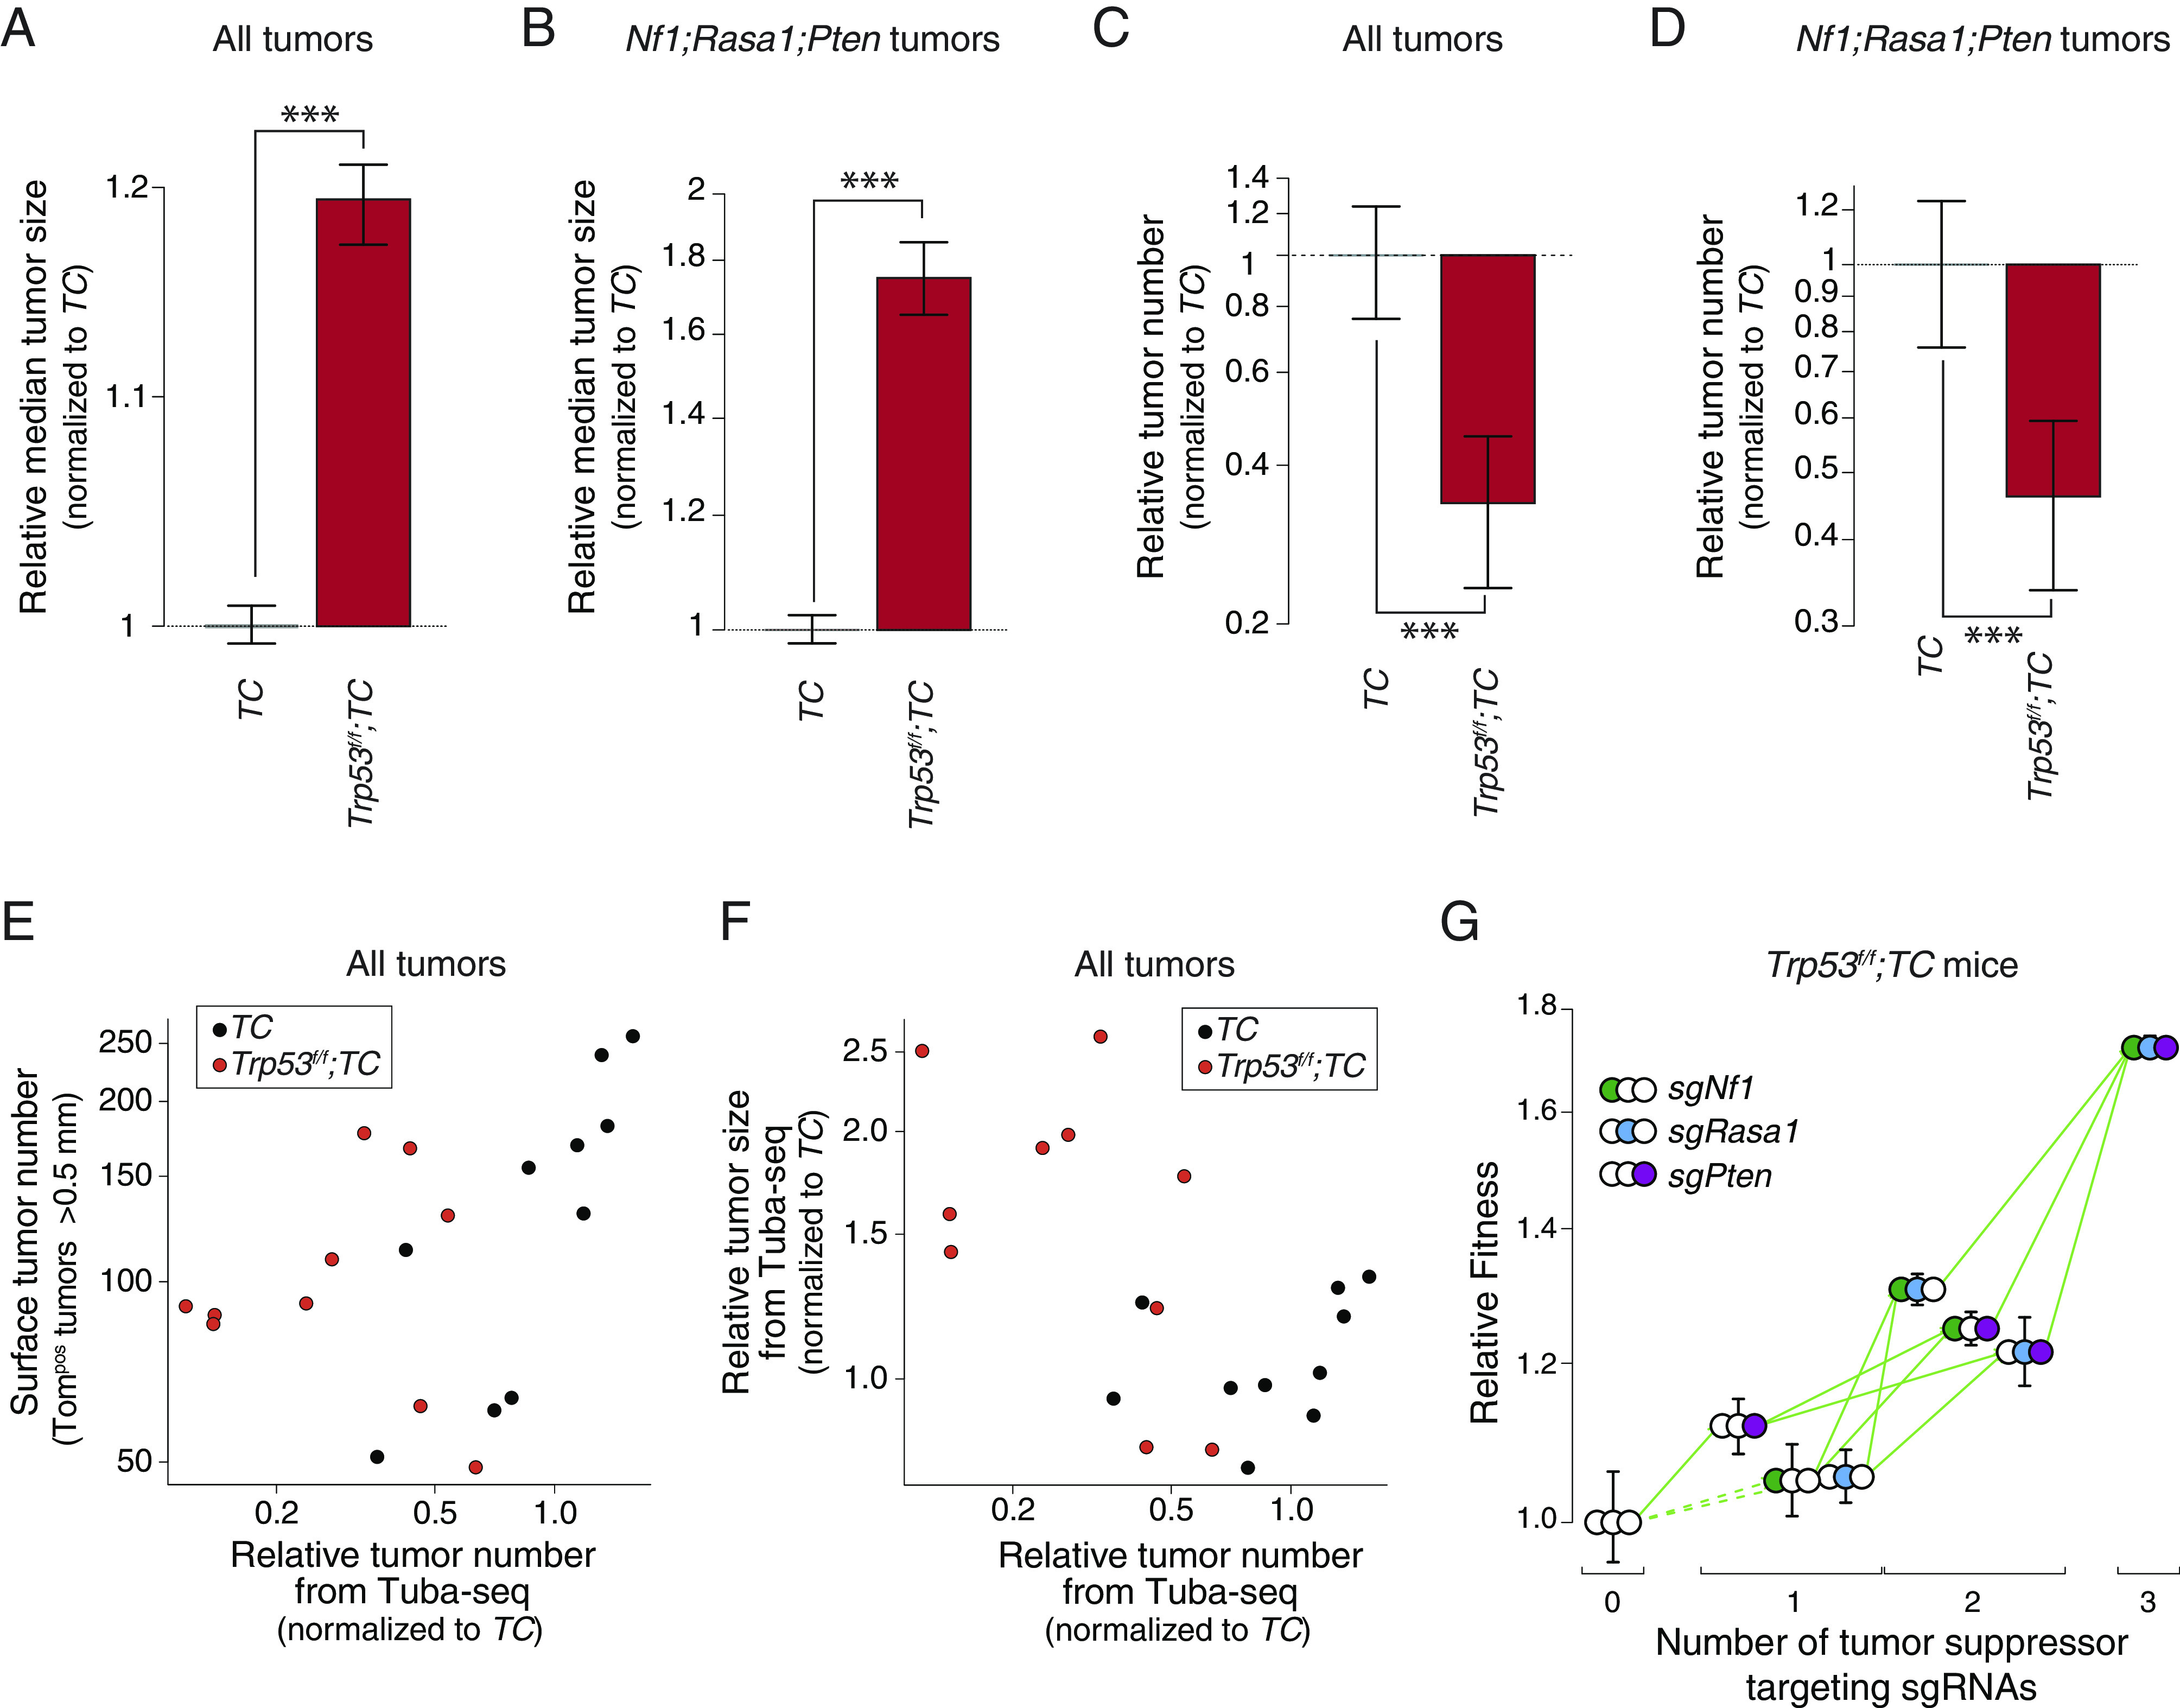
The fitness landscape of Nf1;Rasa1;Pten oncogene-negative lung adenocarcinoma remains fully accessible despite otherwise strong impacts of Trp53-deficiency. (A and B) Effect of Trp53 inactivation on the median size of all tumors (A) and of Nf1;Rasa1;Pten tumors (B). Effects are shown relative to TC mice. Whiskers show 95% CIs from bootstrap resampling. ***P < 0.001 based on a bootstrap resampling. (C and D) Effect of Trp53 inactivation on the number of all tumors (C) and of Nf1;Rasa1;Pten tumors (D). Effects are shown relative to TC mice. Whiskers show 95% CIs from bootstrap resampling. ***P < 0.001 based on a bootstrap resampling. (E) Comparison of surface tumor number (from direct counting of Tomatopositive tumors >0.5 mm in diameter) with the relative tumor number from Tuba-seq (the number of clonal expansions with >50 neoplastic cells relative to the median of TC values). Each dot represents a mouse. Data from all tumors are shown. (F) Comparison of the relative tumor size determined from Tuba-seq (the median number of neoplastic cells relative to the median of TC values) with the relative tumor number from Tuba-seq (the number of clonal expansions with >50 neoplastic cells relative to the median of TC values). Each dot represents a mouse. Data from all tumors are shown. (G) Fitness landscape for Trp53f/f;TC mice. Fitness for tumors of each single and double-mutant genotype, as well as those with all three tumor suppressor targeting sgRNAs are shown relative to the triple inert vector. Green arrows indicate increased fitness, red arrows indicate reduced fitness, and the solid line indicates significance (P-value < 0.05). Whiskers show 95% CIs from bootstrap resampling of tumors.
Next, we mapped the fitness landscape of Nf1, Rasa1, and Pten mutations on the background of Trp53 deficiency in Trp53f/f;TC mice. Similar to our observations in Trp53-proficient TC mice, the Nf1;Rasa1;Pten triple-mutant genotype had the highest relative fitness. Importantly, despite the overall effects of Trp53 deficiency on tumor number and size, the landscape remained fully accessible (Fig. 2G and SI Appendix, Fig. S5 A–C).
Quantification of the Overall Tumorigenicity of the Nf1;Rasa1;Pten Triple-Mutant Genotype across Lkb1- and Keap1-Deficient Backgrounds.
While the fitness landscape of Nf1;Rasa1;Pten lung tumors was fully accessible in Trp53-proficient and -deficient backgrounds, changes in the genetic background often influence epistatic interactions and thus change landscape accessibility. Therefore, we next quantified whether the effects of combinatorial Nf1, Rasa1, and Pten inactivation change on other genetic backgrounds. We chose loss-of-function mutations in Keap1 and Lkb1(Stk11) which are known tumor suppressor genes that are frequently mutated in human lung cancer and have been shown to suppress growth in models of oncogenic KRAS-driven lung adenocarcinoma (17, 18, 21–23). We initiated tumors with Lenti-sgTSTriple-pool/Cre in TC, Keap1f/f;TC, Lkb1f/f;TC and control KrasLSL-G12D;T mice (Fig. 3A). After 3 mo of tumor growth, we first analyzed tumor burden by direct fluorescent imaging and histology. Unexpectedly, Keap1f/f;TC mice developed many fewer tumors than TC mice as assessed by direct fluorescence and histology (Fig. 3 B and C). Conversely, Lkb1f/f;TC mice visually had many tumors that appeared somewhat larger than those in TC mice (Fig. 3 B and C).
Fig. 3.
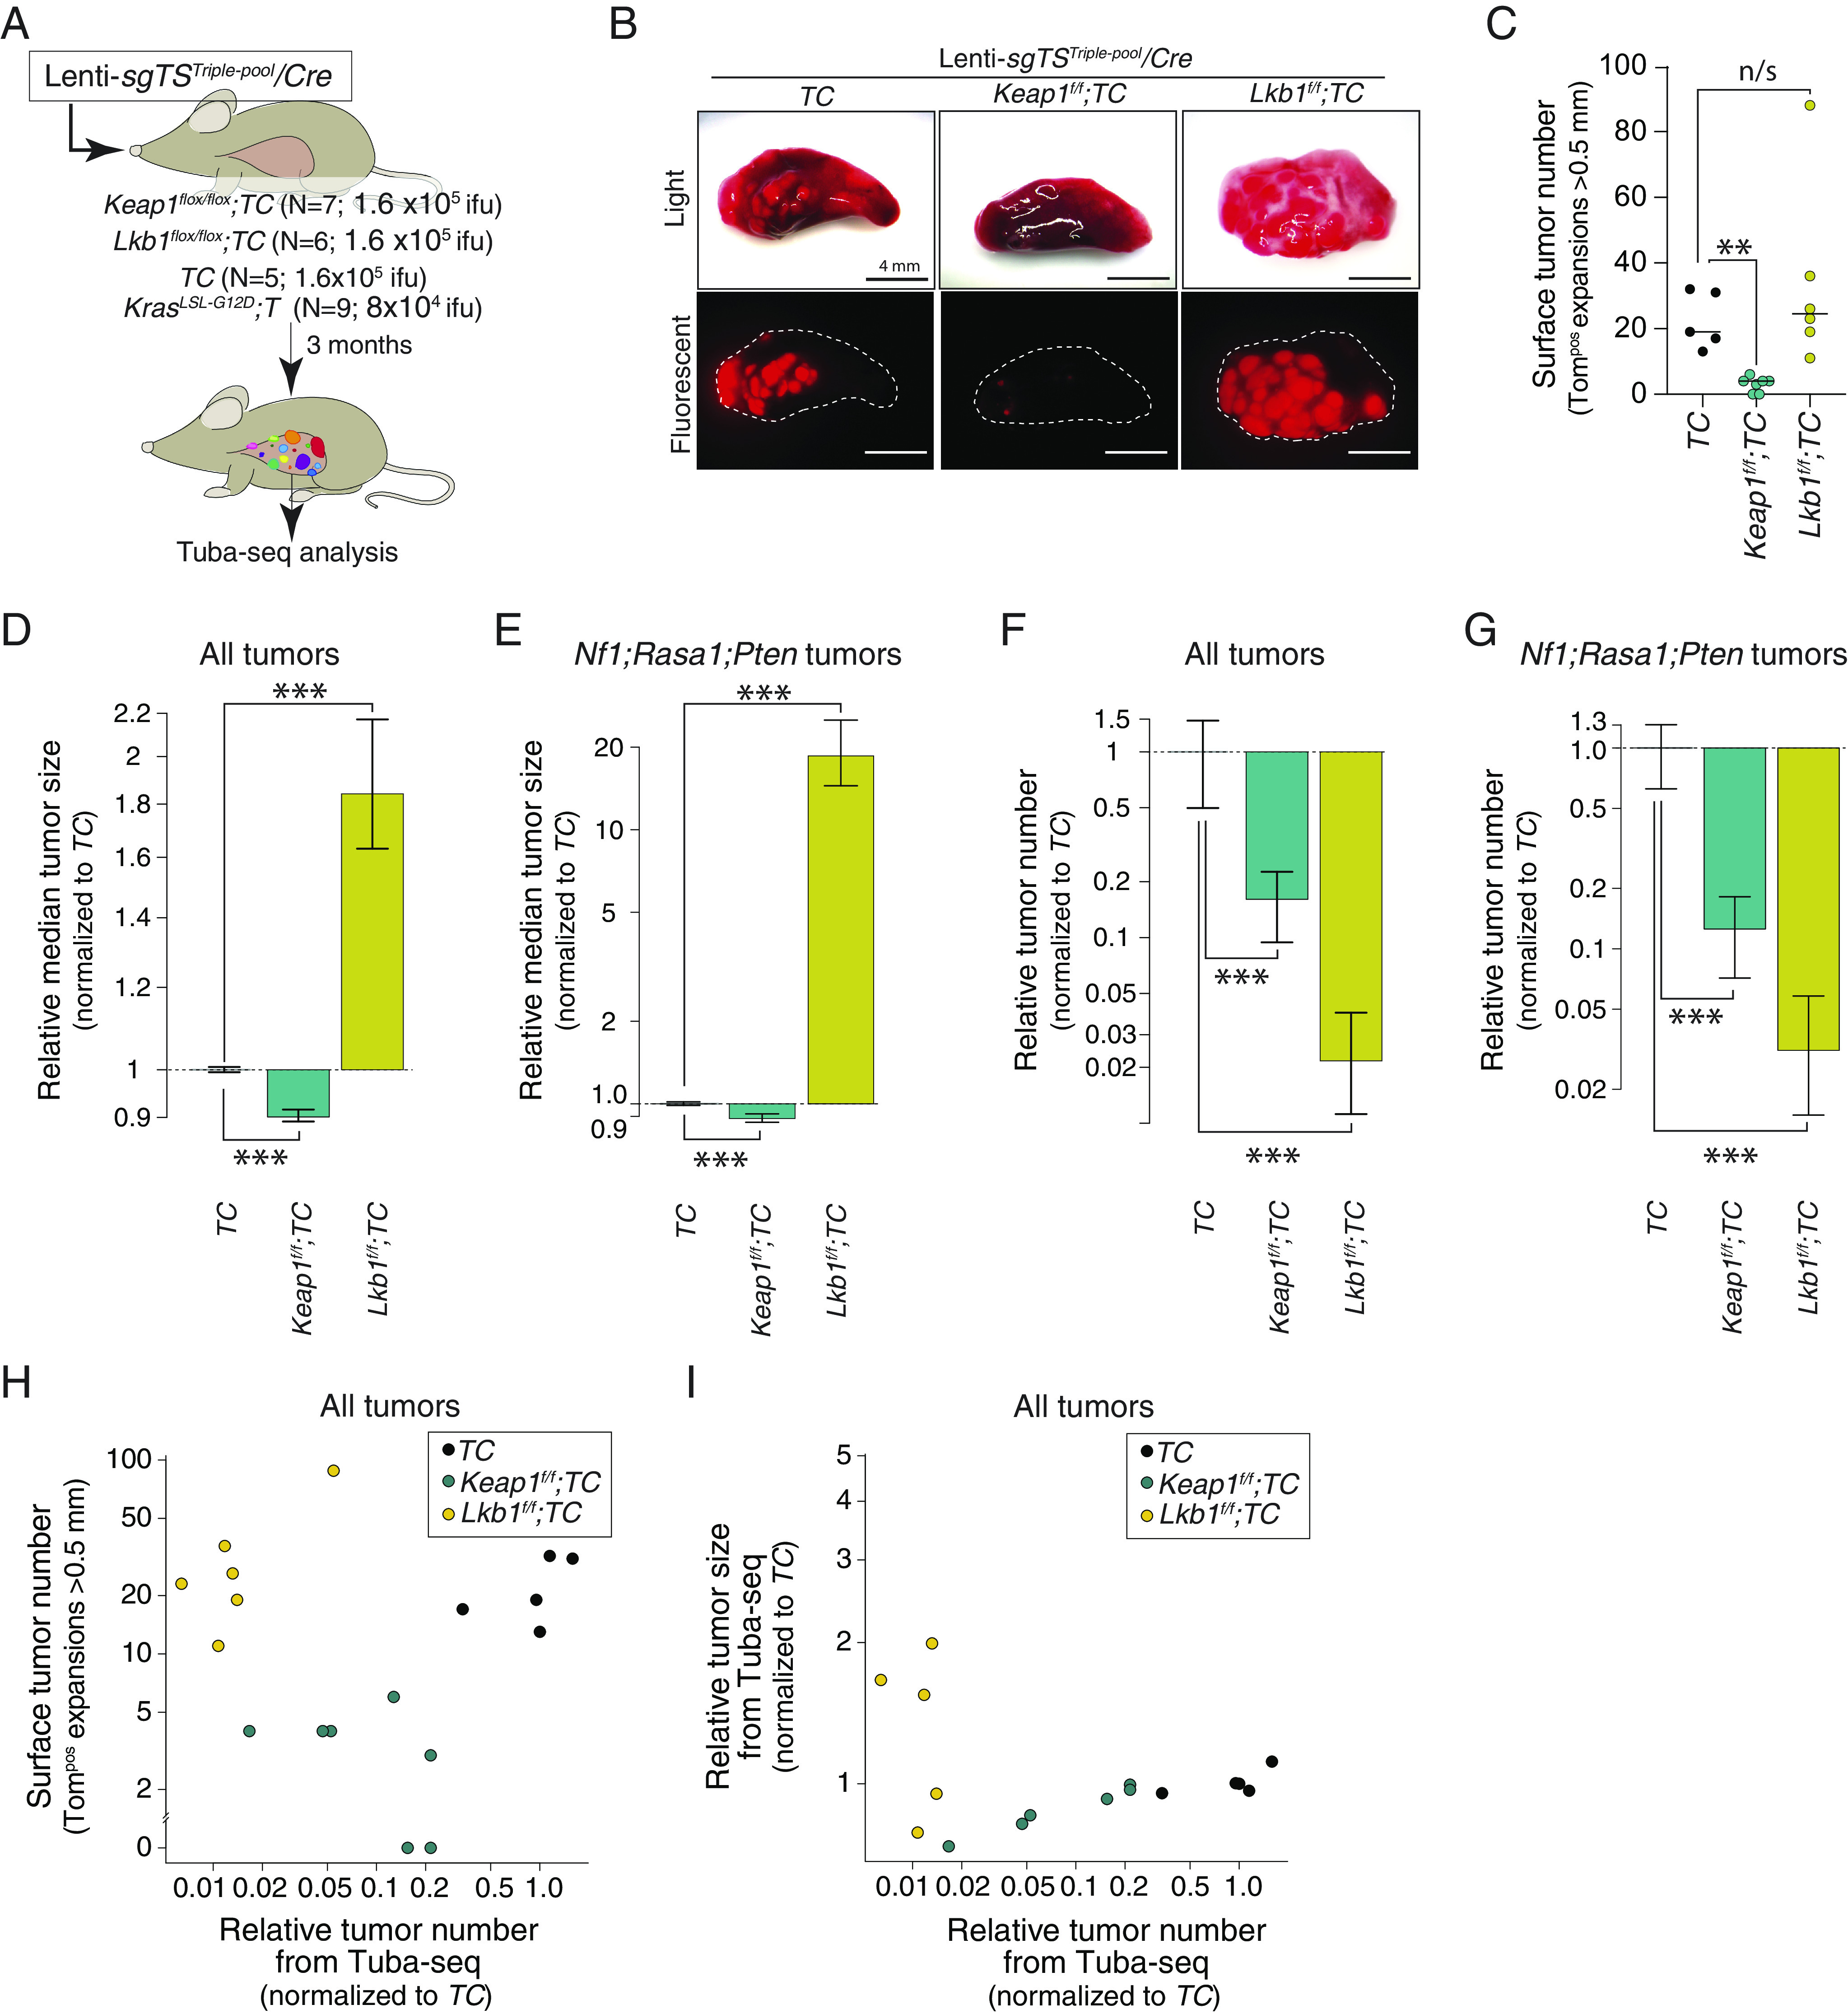
Inactivation of the KEAP1 or LKB1 “tumor suppressors” reduces Nf1;Rasa1;Pten oncogene-negative tumor initiation with divergent effects on tumor size. (A) Schematic of experiments to assess the effect of Keap1 and Lkb1 inactivating background mutations on combinations of Nf1;Rasa1;Pten inactivation. Mouse genotype, mouse number, and viral titer (ifu; infectious units) are indicated. Tuba-seq was performed on bulk tumor-bearing lungs 3 mo after tumor initiation. (B) Representative light and fluorescence images of lung lobes from the indicated genotypes of mice. Lung lobes are outlined with white dotted lines. (Scale bars, 4 mm.) (C) The number of tumors (Tomatopositive tumors > 0.5 mm in diameter) quantified by direct counting. Each dot represents a mouse, and the bar is the median. The genotypes of the mice are indicated. **P < 0.01; and n/s, P > 0.05 (not significant) based on a bootstrap resampling. (D and E) Effect of Keap1 or Lkb1 inactivation on the median size of all tumors (D) and of Nf1;Rasa1;Pten tumors (E). Effects are shown relative to TC mice. Whiskers show 95% CIs from bootstrap resampling. ***P < 0.001 based on a bootstrap resampling. (F and G) Effect of Keap1 or Lkb1 inactivation on the number of all tumors (F) and of Nf1;Rasa1;Pten tumors (G). Effects are shown relative to TC mice. Whiskers show 95% CIs from bootstrap resampling. ***P < 0.001 based on a bootstrap resampling. (H) Comparison of surface tumor number (from direct counting of Tomatopositive tumors >0.5 mm in diameter) with the relative tumor number from Tuba-seq (the number of clonal expansions with >50 neoplastic cells relative to the median of TC values). Each dot represents a mouse. Data from all tumors are shown. (I) Comparison of the relative tumor size determined from Tuba-seq (the median number of neoplastic cells relative to the median of TC values) with the relative tumor number from Tuba-seq (the number of clonal expansions with >50 neoplastic cells relative to the median of TC values). Each dot represents a mouse. Data from all tumors are shown.
Next, we performed Tuba-seq on tumor-bearing lungs and quantified the effect of Keap1 and Lkb1 deficiency on overall tumor initiation and size. Keap1 inactivation decreased overall tumor number by ~80%, while modestly reducing tumor size (Fig. 3 D–G and SI Appendix, Fig. S6 B and C). The impact of Keap1 inactivation on tumor number and size was consistent across all tumors, as well as when we assessed only Nf1;Rasa1;Pten triple-deficient tumors (Fig. 3 D–G). Thus, Keap1 inactivation has an overall negative effect on tumorigenesis driven by inactivation of Nf1, Rasa1, and/or Pten with the greatest impact on tumor initiation and/or very early tumor growth.
The impact of Lkb1 inactivation was even more interesting. Lkb1 inactivation decreased overall tumor number by >95% (Fig. 3 F and G), which seemed at odds with the gross examination of the tumor-bearing lung. However, the small number of tumors that did form were much larger than those in TC mice, with Nf1;Rasa1;Pten triple-mutant tumors in Lkb1;TC having >15-fold greater median tumor size than in TC mice (Fig. 3 D and E). This dramatic increase in size reconciles the visual observation of similar numbers of tumors in Lkb1;TC and TC mice, while quantitative analysis by Tuba-seq data indicated that Lkb1;TC mice had many fewer tumors (Fig. 3 H and I and SI Appendix, Fig. S6 D and E).
Landscape Accessibility Is Largely Robust to Changes in the Genetic Background.
As the Lkb1- and Keap1-deficient backgrounds had substantial effects on overall oncogene-negative lung tumor growth in our experimental model, we next characterized their impacts on the fitness landscapes. Due to the very low number of tumors for less complex (inert, single and double mutant) genotypes on the Lkb1f/f;TC background, we could not construct a fitness landscape (SI Appendix, Fig. S7 A and B). However, our method allowed us to generate fitness landscapes for the tumors in TC, Keap1;TC, and control KT mice. The landscape in TC mice was similar to that generated from our initial cohort of TC mice and the landscape in the control KT Cas9-negative mice was again very flat (Fig. 4A and SI Appendix, Fig. S8D). Interestingly, in the Keap1-deficient background, the landscape remained fully accessible (Fig. 4B). These effects were consistent across our different analysis methods (SI Appendix, Fig. S8 A–C). Thus, despite greatly reducing tumor initiation, the ability of each additional mutation to increase fitness on the path to the Nf1;Rasa1;Pten triple-deficient state was maintained.
Fig. 4.
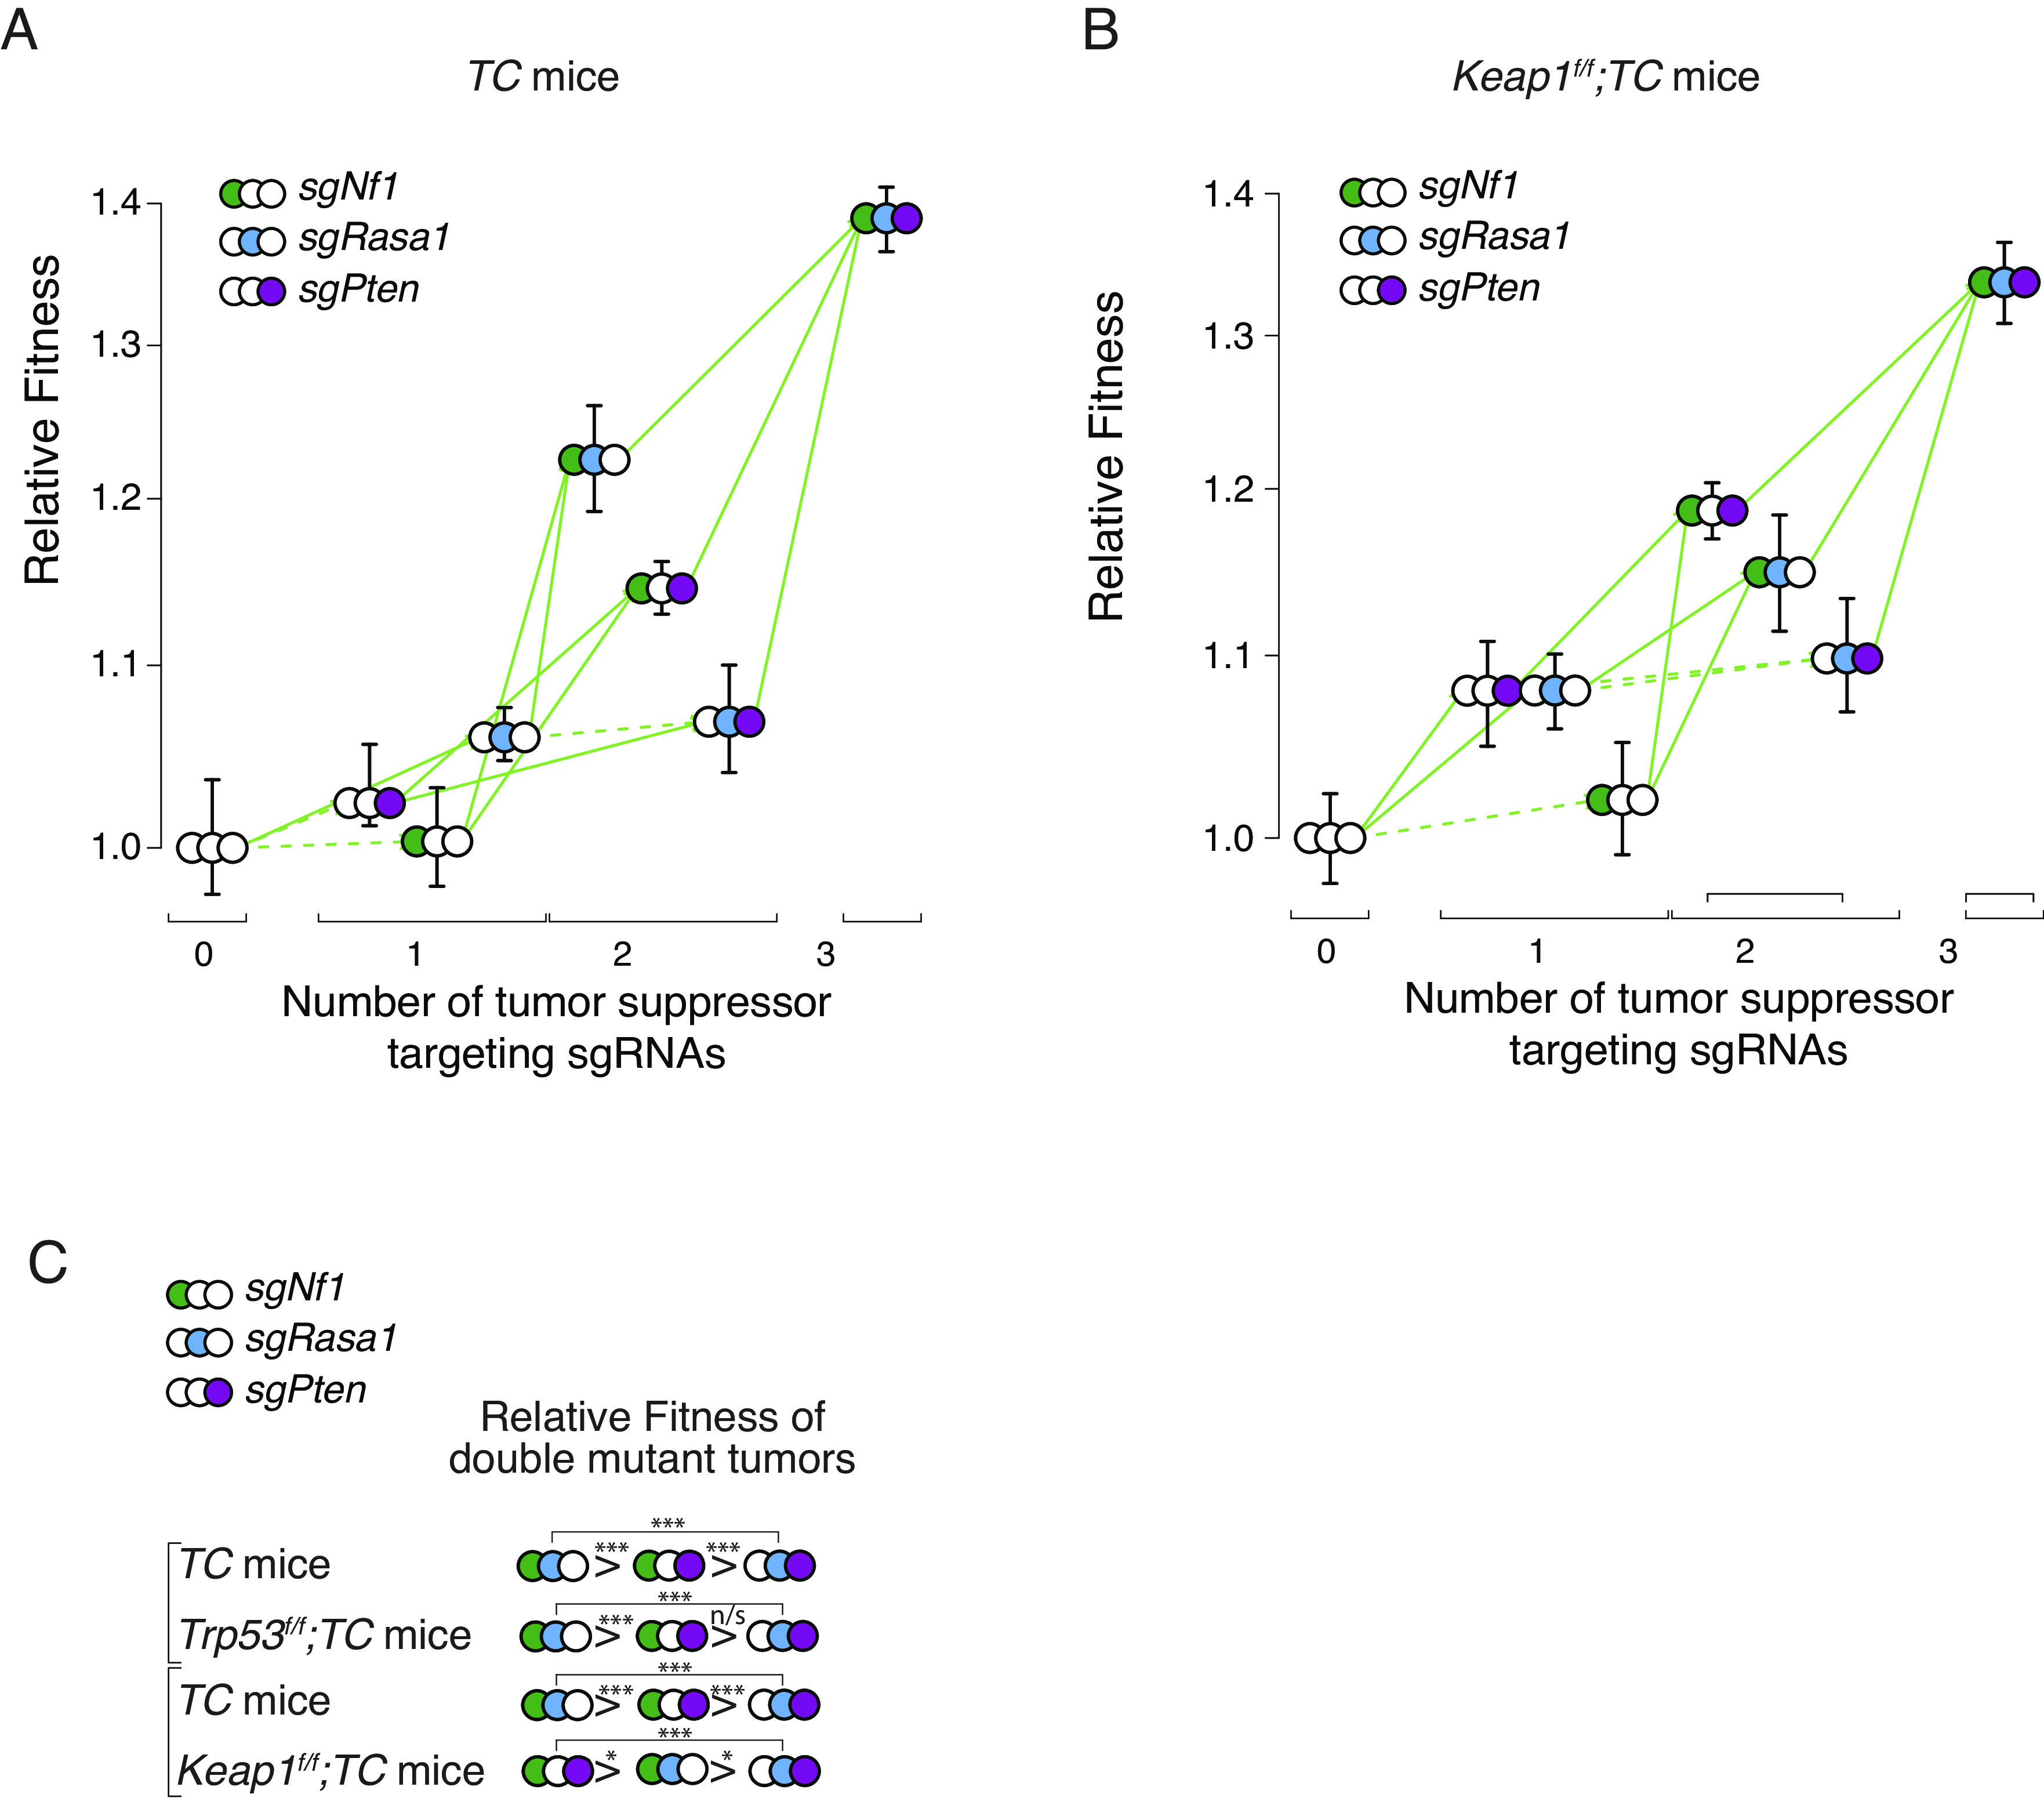
KEAP1 inactivation changes the topology of the fitness landscape of Nf1;Rasa1;Pten oncogene-negative lung adenocarcinoma. (A and B) Fitness landscape for TC (A) and Keap1flox/flox;TC (B) mice. Fitness for tumors of each single and double-mutant genotype, as well as triple-mutant genotype, is shown relative to the triple inert vector. Green arrows indicate increased fitness, red arrows indicate reduced fitness, and the solid lines indicate significance (P value < 0.05). Whiskers show 95% CIs from bootstrap resampling of tumors. (C) Relative fitness of the double-mutant genotypes from the TC and Trp53f/f;TC mice from Figs. 1 and 2 and from TC and Keap1f/f;TC mice from Fig. 4. *P < 0.05; ***P < 0.001; and n/s, P > 0.05 (not significant), based on a bootstrap resampling.
Despite the overall accessibility of the fitness landscape in both Keap1-proficient and -deficient backgrounds, the impact of additional mutation was not identical. In particular, the relative fitness of tumors of the different double-mutant genotypes was different, with Nf1;Rasa1 being the most fit in the TC and Trp53;TC background and Nf1;Pten being the most fit in the Keap1;TC background (Fig. 4C). Thus, changes in the genetic background did impact the topology of the landscape, but it remained fully accessible.
Discussion
Our results suggest that the combinatorial inactivation of Nf1, Rasa1, and Pten forms a fully accessible fitness landscape. Thus, any of the six evolutionary routes is possible, with the inactivation of each gene increasing fitness beyond the preceding genotype. The overall lack of sign epistasis makes predicting cancer evolution challenging. On the other hand, while oncogene-negative tumors require the inactivation of multiple tumor suppressor genes to substitute for the lack of a strong oncogene alteration, gaining fitness advantage from each additional alteration increases the probability of acquiring all of the required mutations. Human genomics data suggest that oncogene-negative lung adenocarcinoma with high MAPK and PI3K pathway activation is likely generated from combinatorial mutations in diverse components of these pathways further expanding the available paths to the tumorigenic state (15).
Contrary to the fitness landscapes we mapped in this study, the landscapes of many other evolutionary systems are rugged and exhibit sign epistasis between mutations (3–7). Mutations often have pleiotropic effects, with some effects being advantageous and other effects being detrimental. In one genetic context the beneficial effects can outweigh the detrimental effects, while in a different genetic context, this can be reversed. This leads to sign epistasis and a rugged fitness landscape. Why is the oncogene-negative fitness landscape smooth and thus fully accessible? We speculate that this could be because somatic cells and neoplastic cells in vivo are far from the highest possible fitness and individual tumor suppressor gene mutations have relatively weak effects. The combined effect could create sufficiently linear behavior of all the individual tumor suppressor mutations without encountering any significant curvature of the fitness function. This is often not the case for the large effect mutations observed in experimental evolution of microorganisms or in the tumor suppressor effects on the oncogene-driven tumors. Further studies assessing more extensive cancer fitness landscapes across multiple backgrounds will be required to determine whether our landscapes are flat patches in a much larger and conceivably rugged landscape or if the lack of sign epistasis is a more general aspect of cancer fitness landscapes.
While the fitness landscape of combinatorial Nf1, Rasa1, and Pten inactivation remained fully accessible and robust to inactivation of Trp53, Keap1, or Lkb1, those alterations dramatically changed overall tumor initiation and growth. Comparing the effects of Trp53, Keap1, and Lkb1 inactivation on Nf1;Rasa1;Pten mutant tumors with their impact on various oncogene-driven tumors underscores the context-dependency of these effects (9, 10, 18). Trp53 inactivation increased tumor size but had a negative effect on the initiation of oncogene-negative tumors. This observation is in contrast to the universally positive effect of Trp53 deficiency on multiple models of oncogene-driven lung cancer (9, 10, 18, 20). Interestingly, while LKB1 and KEAP1 are generally regarded as tumor suppressors, several lines of evidence suggest that their role in cancer is more complex and context dependent (24). Lkb1 and Keap1 inactivation has been shown to have detrimental effects on in vivo lung tumor initiation and growth across different genetic contexts (9, 10, 25, 26). Thus, while the detrimental effect of Lkb1 and Keap1 inactivation on initiation/early growth and the positive effect of Lkb1 inactivation on the growth of oncogene-negative tumors could not have been predicted, it is consistent with these “tumor suppressors” having highly context-dependent effects. The cell type of origin could also change how genetic interactions impact carcinogenesis, and while the majority of lung tumors initiated by lentiviral vectors arise from surfactant protein C expressing cells, it is conceivable that the rare large tumors that form in Lkb1f/f;TC mice could arise from another cell type. The interactions between genotype-specific effects and cell type of origin will be an area of interesting future work.
Human tumors likely evolve through states in which tumor suppressor genes are heterozygously inactivated. However, as CRISPR/Cas9-genome editing generally generates homozygous gene inactivation, we could only study homozygous mutations in tumor suppressor genes. In the future, deciphering where the multiple middle steps of heterozygous mutants fall within cancer fitness landscapes will improve the resolution. The effects of heterozygous genotypes are likely to fall within the range of their homozygous counterpart and therefore are unlikely to render the fitness landscape inaccessible. Additionally, studies on the temporal dynamics of tumor growth could lead to an even better understanding of the dynamic process of early-stage cancer growth in vivo.
Similar analyses of human lung cancer tumorigenesis will require large numbers of genotyped samples from early oncogene-negative lesions, preferably with longitudinal sampling. Most human tumors have complex genotypes, often including multiple inactivating alterations. While human cancer genomics data can be leveraged to find interactions among genotypes, finding statistical enrichment/depletion becomes extremely challenging with higher-order interactions (8). Modeling complex cancer genotypes in genetically engineered mouse models has been greatly facilitated by somatic CRISPR/Cas9 genome editing; however, broad-scale quantitative analysis of complex cancer genotypes remains limited (15, 20). Generating defined combinatorial alterations in vivo allows not only the analysis of tumorigenesis driven by these complex genotypes but also the assessment of contribution of each stepwise genomic alteration to tumor fitness and evolution. Quantitative and comprehensive fitness maps of other genotypes (within and beyond lung cancer) could uncover general rules of how driver alterations interact and affect cancer evolution by creating rugged and smooth cancer fitness landscapes. While libraries of vectors with pairs of sgRNAs have been broadly employed (27–31), generating large pools of vectors to inactivate greater numbers of genes while maintaining the ability to perform highly-quantitative clonal-level analysis will require additional methods. In the future, the analysis of tumors with a comprehensive combination of many other genotypes coupled with molecular profiling and external interventions like therapies should illuminate the underlying biology of adaptation and uncover exploitable vulnerabilities.
Methods
Animal Studies.
The use of mice for the current study has been approved by the Institutional Animal Care and Use Committee at Stanford University, protocol number 26696. KrasLSL-G12D/+ [Jax # 008179 (K)], R26LSL-tdTomato(ai9) [Jax # 007909 (T)], and H11LSL-Cas9 (Jax # 026816), Keap1flox, Lkb1 flox (Jax # 014143), and Trp53flox (Jax # 008462) mice have been previously described (32–38). All mice were on a C57BL/6:129 mixed background. Tumors were initiated by intratracheal delivery of Lenti-Triple-sgRNA/Cre vectors. Mice were allowed to develop tumors for 3 mo after viral delivery.
Tumor Barcode Sequencing and Analysis.
Tuba-seq libraries were generated as described previously (15). Briefly, genomic DNA was isolated from bulk tumor-bearing lung tissue followed by PCR amplification of the sgID-BC region from 32 μg of bulk lung genomic DNA using Q5 Ultra II High-Fidelity 2× Master Mix (New England Biolabs, M0494X). Unique dual-indexed primers were used to amplify each sample followed by purification using Agencourt AMPure XP beads (Beckman Coulter, A63881). The libraries were pooled based on lung weights to ensure even reading depth and sequenced (read length 2 × 150 bp) on the Illumina HiSeq 2500 or NextSeq 500 platform (Admera Health Biopharma Services). Tuba-seq analysis of tumor barcode reads was performed as previously described (37, 39).
Histology and Immunohistochemistry (IHC).
Lung lobes were inflated with 4% formalin and fixed for 24 h, stored in 70% ethanol, and then paraffin-embedded. We used 4-μm-thick sections for hematoxylin and eosin staining and IHC. Anti-RFP (Rockland, 600-401-379), anti-TTF1(Abcam, ab76013), anti-UCHL1(Sigma, HPA005993), and anti-TP63 (Cell Signaling Technology, 13109) IHC was performed using the Avidin/Biotin Blocking Kit (Vector Laboratories, SP-2001), Avidin-Biotin Complex kit (Vector Laboratories, PK-4001), and DAB (3,3’-diaminobenzidine) Peroxidase Substrate Kit (Vector Laboratories, SK-4100) following standard protocols.
Calculation of Relative Fitness of Each Genotype of Tumors.
Fitness of each tumor genotype was approximated by the growth rate of tumors. Fitness was calculated for each tumor genotype in a given mouse strain by considering the expected number of cells with each lentiviral vector at the start of the experiment (#startgenotypemouse—strain) and the number of neoplastic cells with each lentiviral vector after tumor growth at the end of the experiment (#endgenotypemouse—strain).
#endgenotype_mouse—strain is the sum of all neoplastic cells in all tumors of that genotype at the end of the experiment from all mice of a given strain (for example TC mice in Fig. 1).
#startgenotype_mouse—strain is the expected number of cells of that genotype at the start of the experiment. #startgenotype_mouse—strain was determined from the number of tumors with each viral vector (titergenotype) from KT Cas9-negative control mice. In KT mice, the number of tumors with each vector (number of unique BCs associated with each sgID) represents the exact titer of each vector (titergenotype) in the Lenti-sgTSTriple-pool/Cre pool. Data from KT mice were used to calculate the relative titer across genotypes. To put #startgenotype in the context of the most potent genotype in the given mouse strain, we normalized the number of tumors with each lentiviral vector in KT mice (titergenotype) to the number of Nf1;Rasa1;Pten triple-mutant tumors in KT mice (titerNf1;Rasa1;Pten) and then multiplied this by the total number of Nf1;Rasa1;Pten triple-mutant tumors across all mice of a given strain (TumorNumberNf1;Rasa1;Pten_mouse—strain). Thus, #startgenotype_mouse—strain represents the titer-corrected expected number of tumors of that genotype if that genotype was as potent as triple Nf1:Rasa1;Pten mutation in that strain. As an example, #start for single mutant genotype Nf1 in TC mice (#start Nf1_TC) was calculated as
Finally, we calculated “Relative Fitness” within each mouse strain by normalizing the fitness of each genotype to the fitness of tumors with the lentiviral vector with three Inert sgRNAs (Lenti-sgNeo1-sgNeo2-sgNT/Cre; inert tumors).
The above defined measure is a commonly used fitness definition (31, 39–42) that integrates tumor number and tumor size in a manner that translates into how different genotypes of tumors grow and get selected for during tumor growth. Additionally, we generate landscapes using other approximations of fitness which generally reproduce our main results by showing fully accessible landscapes (SI Appendix, Fig. S9).
To test our fitness measure’s ability to identify sign epistasis, we used as a positive control our previous finding of Lkb1 inactivation having a positive effect in KRAS-G12D-driven lung cancer but a negative effect in EGFR-L858R-driven lung cancer (9). We reanalyzed the data using our fitness measure and find significant sign epistasis (SI Appendix, Fig. S10)
Methods to Control for Multiple Transductions.
The most potent genotype in our experiments was the Nf1;Rasa1;Pten triple-mutant generated by transduction with the Lenti-sgNf1-sgRasa1-sgPten/Cre vector. We found in our in vivo experiments that a small percent of tumors arise from lung epithelial cells that were initially transduced by more than one lentiviral vector (15). We refer to these as multiple transductions. Multiple transductions hinder our ability to estimate fitness because a subset of tumors identified as a given genotype (e.g., Nf1 single-mutant tumors which arise from a cell transduced with the Lenti-sgNf1/Cre vector) are in fact double mutants or even Nf1;Rasa1;Pten triple-mutant due to multiple transduction of the initial cells with a vector with complementary sgRNAs (e.g., with the Lenti-sgNf1-sgRasa1-sgPten/Cre vector). To quantify the fraction of tumors that arise from multiple transductions (multiple transduction rate), we calculated the ratio of the number of tumors with greater than a given number of neoplastic cells (minimum cell number cutoff, X) for a given genotype versus the number of tumors with greater than the same minimum cell number cutoff for triple mutants:
As we increase the minimum cell number cutoff (X), the ratio will decrease and asymptotically approach the true multiple transduction rate. The reason behind this is that as we increase the minimum cell number cutoff, the proportion of tumors cotransduced with the most potent triple-mutant genotype among all our tumors increases, as the larger the tumor, the less likely it is to be from a genotype other than the Nf1;Rasa1;Pten triple mutant. Therefore, the minimum ratio across all minimum cell number cutoff (X) values was used as the multiple transduction rate. The multiple transduction rate provides us the expected number of tumors (n) for any given genotype that are the result of multiple transductions. Next, to control for the effect of multiples transduction, we used the distribution of Nf1;Rasa1;Pten triple-mutant tumors to remove the n tumors from the data for each other genotype. For the n tumors to remove, we took the n-quantiles of the Nf1;Rasa1;Pten triple-mutant tumor size distribution. For each of these quantile values, we chose the tumor of the given genotype that was closest to the quantile in size and remove that tumor from the dataset for the given genotype. We used the sgInert multiple transduction rate in TC mice for all genotypes and all mouse strains in all analysis and figures except Figs. 2 E and F and 3 H and I and SI Appendix, Figs. S2 B and C, S3 C and D, S4 E and F, S5 A and B, S6 D and E, S7 A and B, and S8 A and B. This is logical, as multiple transductions should not be influenced by the sgIDs, sgRNA sequences, or mouse genotypes. Furthermore, we do not expect growth of tumors with Lenti-sgInert/vectors in TC mice, unless those initial cells have multiple transductions that occur with vectors with tumor suppressor gene targeting lentiviral vectors.
As an alternative method, we also quantified the multiple transduction rate for all genotypes of tumors separately and used that for multiple transduction correction (multiple transduction correction Method #2, see SI Appendix, Figs. S3C, S5B, and S8B). The results and conclusions were unchanged when we used this alternate multiple transduction correction method.
Statistical Analysis.
All statistical analyses were performed using the R software environment. For all bar plots showing relative tumor size and tumor number and for fitness landscape plots, P values and 95% CIs (represented by whiskers) were calculated using bootstrap resampling (10,000 repetitions). Bootstrapping was done by random resampling with replacement of all the tumors in all of the mice of a given strain. When indicated in the figure legend and in cases of barplots showing tumor number, a nested bootstrap approach was used where first all the mice from a given strain were resampled with replacement, and then, all tumors in this virtual mouse cohort were resampled again with replacement.
Supplementary Material
Appendix 01 (PDF)
Acknowledgments
We thank the Stanford Veterinary Animal Care Staff for expert animal care; Leo Chen and Min K. Tsai for technical assistance; and Chuan Li, Paloma Ruiz, and other members of the Winslow and Petrov laboratories for helpful discussions and reviewing the manuscript. M.Y. was supported by a Stanford University School of Medicine Dean’s fellowship, an American Lung Association grant, and an NIH Ruth L. Kirschstein National Research Service Award (F32-CA236311). G.B. was supported by Tobacco-Related Disease Research Program Postdoctoral Fellowships (T31FT-1619). This work was supported by NIH R01-CA231253 (to M.M.W. and D.A.P.), NIH R01-CA230919 (to M.M.W.), and NIH R01-CA234349 (to M.M.W. and D.A.P.), as well as by the Stanford Cancer Institute, an National Cancer Institute designated Comprehensive Cancer Center.
Author contributions
M.Y., M.M.W., D.A.P., and G.B. designed research; M.Y., L.A., M.S., and G.B. performed research; M.Y. and G.B. contributed new reagents/analytic tools; M.Y., M.S., and G.B. analyzed data; and M.Y., M.M.W., D.A.P., and G.B. wrote the paper.
Competing interests
M.M.W. and D.A.P. are cofounders of and advisors to D2G Oncology, Inc. M.M.W. and D.A.P. hold equity in D2G Oncology, Inc. M.Y., M.M.W., D.A.P., G.B., and Stanford University have filed patent applications related to aspects of this work.
Footnotes
This article is a PNAS Direct Submission.
Contributor Information
Monte M. Winslow, Email: mwinslow@stanford.edu.
Dmitri A. Petrov, Email: dpetrov@stanford.edu.
Gábor Boross, Email: gaboross@stanford.edu.
Data, Materials, and Software Availability
Tuba-seq barcode sequencing data from the experiment in Figs. 1 and 2 have been previously deposited in NCBI’s Gene Expression Omnibus (https://www.ncbi.nlm.nih.gov/geo/) (GSE174393) (43). Tuba-seq barcode sequencing data from the experiment in Figs. 3 and 4 have been deposited in NCBI’s Gene Expression Omnibus (GSE223678) (44).
Supporting Information
References
- 1.Fragata I., Blanckaert A., Dias Louro M. A., Liberles D. A., Bank C., Evolution in the light of fitness landscape theory. Trends Ecol. Evol. 34, 69–82 (2019). [DOI] [PubMed] [Google Scholar]
- 2.Wright S., “The roles of mutation, inbreeding, crossbreeding, and selection in evolution” in Proceedings of the Sixth International Congress on Genetics (1932), vol. 1, pp. 356–366. [Google Scholar]
- 3.de Visser J. A. G. M., Krug J., Empirical fitness landscapes and the predictability of evolution. Nat. Rev. Genet. 15, 480–490 (2014). [DOI] [PubMed] [Google Scholar]
- 4.Bank C., Hietpas R. T., Jensen J. D., Bolon D. N. A., A systematic survey of an intragenic epistatic landscape. Mol. Biol. Evol. 32, 229–238 (2015). [DOI] [PMC free article] [PubMed] [Google Scholar]
- 5.Karageorgi M., et al. , Genome editing retraces the evolution of toxin resistance in the monarch butterfly. Nature 574, 409–412 (2019). [DOI] [PMC free article] [PubMed] [Google Scholar]
- 6.Weinreich D. M., Delaney N. F., DePristo M. A., Hartl D. L., Darwinian evolution can follow only very few mutational paths to fitter proteins. Science 312, 111–114 (2006). [DOI] [PubMed] [Google Scholar]
- 7.Szendro I. G., Schenk M. F., Franke J., Krug J., de Visser J. A. G. M., Quantitative analyses of empirical fitness landscapes. J. Stat. Mech. Theory Exp. 2013, P01005 (2013). [Google Scholar]
- 8.Iranzo J., Gruenhagen G., Calle-Espinosa J., Koonin E. V., Pervasive conditional selection of driver mutations and modular epistasis networks in cancer. Cell Rep. 40, 111272 (2022). [DOI] [PubMed] [Google Scholar]
- 9.Foggetti G., et al. , Genetic determinants of EGFR-driven lung cancer growth and therapeutic response in vivo. Cancer Discov. 11, 1736–1753 (2021). [DOI] [PMC free article] [PubMed] [Google Scholar]
- 10.Blair L. M., et al. Oncogenic context shapes the fitness landscape of tumor suppression. bioRxiv [Preprint] (2022). 10.1101/2022.10.24.511787 (Accessed 26 October 2022). [DOI] [PMC free article] [PubMed]
- 11.van de Haar J., et al. , Identifying epistasis in cancer genomes: A delicate affair. Cell 177, 1375–1383 (2019). [DOI] [PMC free article] [PubMed] [Google Scholar]
- 12.Jorge S. E. D. C., Kobayashi S. S., Costa D. B., Epidermal growth factor receptor (EGFR) mutations in lung cancer: Preclinical and clinical data. Braz. J. Med. Biol. Res. 47, 929–939 (2014). [DOI] [PMC free article] [PubMed] [Google Scholar]
- 13.Saito M., et al. , Gene aberrations for precision medicine against lung adenocarcinoma. Cancer Sci. 107, 713–720 (2016). [DOI] [PMC free article] [PubMed] [Google Scholar]
- 14.Skoulidis F., Heymach J. V., Co-occurring genomic alterations in non-small-cell lung cancer biology and therapy. Nat. Rev. Cancer 19, 495–509 (2019). [DOI] [PMC free article] [PubMed] [Google Scholar]
- 15.Yousefi M., et al. , Combinatorial inactivation of tumor suppressors efficiently initiates lung adenocarcinoma with therapeutic vulnerabilities. Cancer Res. 82, 1589–1602 (2022). [DOI] [PMC free article] [PubMed] [Google Scholar]
- 16.Carrot-Zhang J., et al. , Whole-genome characterization of lung adenocarcinomas lacking alterations in the RTK/RAS/RAF pathway. Cell Rep. 34, 108784 (2021). [DOI] [PMC free article] [PubMed] [Google Scholar]
- 17.Rogers Z. N., et al. , A quantitative and multiplexed approach to uncover the fitness landscape of tumor suppression in vivo. Nat. Methods 14, 737–742 (2017). [DOI] [PMC free article] [PubMed] [Google Scholar]
- 18.Cai H., et al. , A functional taxonomy of tumor suppression in oncogenic KRAS-driven lung cancer. Cancer Discov. 11, 1754–1773 (2021), 10.1158/2159-8290.CD-20-1325 (26 March 2021). [DOI] [PMC free article] [PubMed] [Google Scholar]
- 19.Li C., et al. , Quantitative in vivo analyses reveal a complex pharmacogenomic landscape in lung adenocarcinoma. Cancer Res. 81, 4570–4580 (2021). [DOI] [PMC free article] [PubMed] [Google Scholar]
- 20.Rogers Z. N., et al. , Mapping the in vivo fitness landscape of lung adenocarcinoma tumor suppression in mice. Nat. Genet. 50, 483 (2018). [DOI] [PMC free article] [PubMed] [Google Scholar]
- 21.Collisson E. A., et al. , Comprehensive molecular profiling of lung adenocarcinoma. Nature 511, 543–550 (2014). [DOI] [PMC free article] [PubMed] [Google Scholar]
- 22.Romero R., et al. , Keap1 loss promotes Kras-driven lung cancer and results in dependence on glutaminolysis. Nat. Med. 23, 1362–1368 (2017). [DOI] [PMC free article] [PubMed] [Google Scholar]
- 23.Ji H., et al. , LKB1 modulates lung cancer differentiation and metastasis. Nature 448, 807–810 (2007). [DOI] [PubMed] [Google Scholar]
- 24.Bourouh M., Marignani P. A., The tumor suppressor kinase LKB1: Metabolic nexus. Front. Cell Dev. Biol. 10, 881297 (2022). [DOI] [PMC free article] [PubMed] [Google Scholar]
- 25.Schabath M. B., et al. , Differential association of STK11 and TP53 with KRAS mutation-associated gene expression, proliferation and immune surveillance in lung adenocarcinoma. Oncogene 35, 3209–3216 (2016). [DOI] [PMC free article] [PubMed] [Google Scholar]
- 26.Kang Y. P., et al. , Cysteine dioxygenase 1 is a metabolic liability for non-small cell lung cancer. Elife 8, e45572 (2019). [DOI] [PMC free article] [PubMed] [Google Scholar]
- 27.Najm F. J., et al. , Orthologous CRISPR–Cas9 enzymes for combinatorial genetic screens. Nat. Biotechnol. 36, 179–189 (2018). [DOI] [PMC free article] [PubMed] [Google Scholar]
- 28.Murray C. W., et al. , An Lkb1-Sik axis suppresses lung tumor growth and controls differentiation. Cancer Discov. 9, 1590–1605 (2019), 10.1158/2159-8290.CD-18-1237 (30 April 2020). [DOI] [PMC free article] [PubMed] [Google Scholar]
- 29.Adamson B., et al. , A multiplexed single-cell CRISPR screening platform enables systematic dissection of the unfolded protein response. Cell 167, 1867–1882.e21 (2016). [DOI] [PMC free article] [PubMed] [Google Scholar]
- 30.Zetsche B., et al. , Multiplex gene editing by CRISPR-Cpf1 using a single crRNA array. Nat. Biotechnol. 35, 31–34 (2017). [DOI] [PMC free article] [PubMed] [Google Scholar]
- 31.Han K., et al. , Synergistic drug combinations for cancer identified in a CRISPR screen for pairwise genetic interactions. Nat. Biotechnol. 35, 463–474 (2017). [DOI] [PMC free article] [PubMed] [Google Scholar]
- 32.Liu C., et al. , Mosaic analysis with double markers reveals tumor cell of origin in glioma. Cell 146, 209–221 (2011). [DOI] [PMC free article] [PubMed] [Google Scholar]
- 33.Jackson E. L., et al. , Analysis of lung tumor initiation and progression using conditional expression of oncogenic K-ras. Genes Dev. 15, 3243–3248 (2001). [DOI] [PMC free article] [PubMed] [Google Scholar]
- 34.Madisen L., et al. , A robust and high-throughput Cre reporting and characterization system for the whole mouse brain. Nat. Neurosci. 13, 133–140 (2010). [DOI] [PMC free article] [PubMed] [Google Scholar]
- 35.Chiou S.-H., et al. , Pancreatic cancer modeling using retrograde viral vector delivery and in vivo CRISPR/Cas9-mediated somatic genome editing. Genes Dev. 29, 1576–1585 (2015). [DOI] [PMC free article] [PubMed] [Google Scholar]
- 36.Okawa H., et al. , Hepatocyte-specific deletion of the keap1 gene activates Nrf2 and confers potent resistance against acute drug toxicity. Biochem. Biophys. Res. Commun. 339, 79–88 (2006). [DOI] [PubMed] [Google Scholar]
- 37.Bardeesy N., et al. , Loss of the Lkb1 tumour suppressor provokes intestinal polyposis but resistance to transformation. Nature 419, 162–167 (2002). [DOI] [PubMed] [Google Scholar]
- 38.Jonkers J., et al. , Synergistic tumor suppressor activity of BRCA2 and p53 in a conditional mouse model for breast cancer. Nat. Genet. 29, 418–425 (2001). [DOI] [PubMed] [Google Scholar]
- 39.Remold S. K., Lenski R. E., Contribution of individual random mutations to genotype-by-environment interactions in Escherichia coli. Proc. Natl. Acad. Sci. U.S.A. 98, 11388–11393 (2001). [DOI] [PMC free article] [PubMed] [Google Scholar]
- 40.Lenski R. E., Rose M. R., Simpson S. C., Tadler S. C., Long-term experimental evolution in Escherichia coli. I. Adaptation and divergence during 2,000 generations. Am. Nat. 138, 1315–1341 (1991). [Google Scholar]
- 41.Melnyk A. H., Wong A., Kassen R., The fitness costs of antibiotic resistance mutations. Evol. Appl. 8, 273–283 (2015). [DOI] [PMC free article] [PubMed] [Google Scholar]
- 42.Alonso-del Valle A., et al. , Variability of plasmid fitness effects contributes to plasmid persistence in bacterial communities. Nat. Commun. 12, 2653 (2021). [DOI] [PMC free article] [PubMed] [Google Scholar]
- 43.Yousefi M., et al. , Combinatorial tumor suppressor inactivation efficiently initiates lung adenocarcinoma with therapeutic vulnerabilities. NCBI Gene Expression Omnibus. https://www.ncbi.nlm.nih.gov/geo/query/acc.cgi?acc=GSE174393. Accessed 13 May 2021.
- 44.Yousefi M., et al. , Fully accessible fitness landscape of oncogene negative lung adenocarcinoma. NCBI Gene Expression Omnibus. https://www.ncbi.nlm.nih.gov/geo/query/acc.cgi?acc=GSE223678. Accessed 25 January 2023. [DOI] [PMC free article] [PubMed]
Associated Data
This section collects any data citations, data availability statements, or supplementary materials included in this article.
Supplementary Materials
Appendix 01 (PDF)
Data Availability Statement
Tuba-seq barcode sequencing data from the experiment in Figs. 1 and 2 have been previously deposited in NCBI’s Gene Expression Omnibus (https://www.ncbi.nlm.nih.gov/geo/) (GSE174393) (43). Tuba-seq barcode sequencing data from the experiment in Figs. 3 and 4 have been deposited in NCBI’s Gene Expression Omnibus (GSE223678) (44).