

The recognition of a need for repeatable and accurate measures in pulmonary medicine goes back to at least the time of Hutchinson, who emphasized that mechanical precision and adequate participant preparation and coaching were critical to obtaining repeatable and accurate measures of the vital capacity (1). Contemporary American Thoracic Society/European Respiratory Society standards for pulmonary function testing provide expert guidance on steps to ensure repeatability and accuracy of these effort-dependent, easily repeated tests (2).
Quantitative computed tomography (QCT) has been used to subphenotype lung disease in many multicenter studies, including NETT (National Emphysema Treatment Trial) (3), the MESA (Multi-Ethnic Study of Atherosclerosis Lung) Lung Study (4), SPIROMICS (Subpopulations and Intermediate Outcomes Measures in COPD [chronic obstructive pulmonary disease] Study) (5), COPDGene (COPD Genetic Epidemiology Study) (6), SARP (7), CanCOLD (Canadian Cohort Obstructive Lung Disease) (8), and the Lung Health Study (9). QCT has provided multiple insights into chronic lung disease (10–12) and has also been used as an endpoint in clinical trials (13, 14).
Barriers to Widespread Adoption of Quantitative Chest CT Measures
To date, no QCT measure is currently accepted as an intermediate outcome biomarker by the U.S. Food and Drug Administration (FDA) (11), despite multiple efforts by the respiratory community. Most QCT measures are affected by multiple mechanical factors, including CT scanner make and model, scan acquisition protocol, reconstruction parameters, and kernels (15). And, similar to pulmonary function testing, the quality of coaching by technologists, participant effort, and ability of the participant to follow instructions during the test may impact the repeatability and accuracy of QCT measures (16). The mechanical factors and effort dependence affecting QCT measures present challenges, because CT images are reconstructed by manufacturers’ proprietary “black boxes,” and CT scans are not as easily repeated as pulmonary function tests.
Recognition of these issues has led to various efforts to standardize QCT acquisition protocols, including statements by the Quantitative Imaging Biomarkers Alliance of the Radiologic Society of North America (17–22), the Fleischner Society, and the American Thoracic Society. One such effort was the standardized imaging protocol developed in SPIROMICS (15). This protocol was adopted by the MESA Lung Study (4), SARP (7), and others and was the starting point of a broader protocol recommendation by the Quantitative Imaging Biomarkers Alliance (23). One key knowledge gap has been the lack of short-term, scan–rescan repeatability of comprehensive lung QCT measures, which is a key criterion for biomarker acceptance by the FDA (11).
Development of Key Repeatability Data through the NIH-funded SPIROMICS Cohort
To address this problem, the SPIROMICS investigators, with the encouragement of the FDA, conducted a repeatability study of the SPIROMICS imaging protocol to rescan SPIROMICS participants within 6 weeks, specifically to assess the repeatability of QCT endpoints (24). The SPIROMICS (5) study was designed as a multicenter, prospective study that enrolled 2,983 patients with COPD and control subjects with ⩾20 pack-year smoking history and nonsmoking control subjects, 40–80 years old, at seven main sites and five subsites in 2009–2016. The repeatability study targeted an enrollment of 100 participants at the main sites between 2012 and 2015 (25).
All participants in SPIROMICS underwent CT scanning at TLC and residual volume (RV) during their baseline visit. All repeatability study participants underwent repeat CT scanning 2–6 weeks after the baseline CT scan (15). (Instructions for coaching to TLC and RV can be found at: https://www.spiromics.org/spiromics/node/4176). Importantly, participants were scanned with an alternative study ID at the repeatability study visit, such that images were transferred to the central Radiology Center at the University of Iowa in a fully blinded fashion.
Quantitative parameters were assessed at the Radiology Center using Apollo 2.0 (VIDA Diagnostics) software.
Multiple QCT measures were applied to the baseline and repeat scans, providing information on a wide variety of density and airway measurements. Standard density metrics included emphysema measures of percentage emphysema/LAA−950 and LAA−910 (low attenuation area: percentage of lung voxels falling below −950 or −910 Hounsfield units [HU]) at TLC, the 15th percentile point of the lung HU histogram (Perc15), and the lung volume–adjusted Perc15, using the baseline lung volume as the reference to adjust both measurements. Air trapping was assessed as LAA−856 (percentage of lung voxels falling below −856 HU) at RV. Lung volumes were assessed at TLC or RV; the total pulmonary vascular volume (TPVV) was assessed as previously described (26). On coregistered (TLC and RV) scans, we assessed the disease probability measure (DPM)-classified functional small airway disease (fSAD), emphysema, and normal regions (27). Biomechanics-based QCT measurements, including Jacobians, anisotropic deformation indices (ADIs) (28), and their SDs, were also measured. Regional Jacobians are a measure of local volume change; ADI serves to assess how uniformly or nonuniformly the volume change occurs along the orthogonal lung dimensions. fSAD represents air trapping within regions not defined, at TLC, as emphysema. It has recently been demonstrated that fSAD is better assessed at RV than functional residual capacity (29).
For airway measurements, the central airway tree was selected using automatic detection with visual verification from the trachea to two generations beyond the segmental airways along five standardized paths (RB1, RB4, RB10, LB1, and LB10) (15). Texture-based, machine learned measures were also applied to lung parenchyma including the CT emphysema subtypes (30, 31) and the adaptive multiple feature method (AMFM) (32, 33).
Because the Radiology Center was blinded to repeat scans, standard quality control (QC) to ensure within-subject longitudinal comparability of scanning parameters could not be performed. Therefore, in addition to differences due to varying degrees of inspiration on repeat scanning, the display field of view (DFOV) and CT scanner model changed for some participants. Hence participant deviations fell into three nonexclusive QC categories:
-
1.
Lung volume: participants with >10% change in lung volume for TLC-based measurements, >20% volume change for RV-based measurements, and >50% change (found to eliminate 10 extreme values) in TLC − RV volume difference for metrics from image warping.
-
2.
DFOV defines voxel size of the 512 × 512 reconstruction matrix: participants with >5% change in DFOV.
-
3.
Scanner: participants scanned, at the return visit, on a different scanner than the one used at baseline.
Participants not falling into any of these categories formed the QC sample. Subjects falling into one of the above three deviation categories allowed for a demonstration of how such deviations affect measurement repeatability. Repeatability was defined as the variability of measurements within the same participant under equal but separated conditions (34) and assessed as the repeatability coefficient (RDC), which is 1.96 times the SD of differences. Reliability was measured by intraclass correlation coefficient (ICC) (35) using the third case with single measurement (36), considering that target variables were measured by the same raters once per visit (37). Of the 100 participants (200 CT scans), 2 participants withdrew consent, and 2 scans were unusable because of incomplete imaging data and excessive motion artifact, leaving 96 participants with paired scans for evaluation.
The 96 participants had a mean age of 61.5 ± 9 years; 64.5% were men, 44% currently smoked, and 79% had COPD (18, 16, 20, 22, and 9: GOLD stages 0–4, respectively) (see Table E1 in the online supplement). Repeat scans were taken a mean of 29 ± 9 days after the baseline visit (range, 14–43 d). Scans were acquired across seven clinical centers on a range of scanners manufactured by GE and Siemens. There were no differences in the CT volumetric dose indices between baseline and the repeat visit. The TLC CT volumetric dose mean and range were 8.27 (5.83–11.33) and 8.18 (5.83–11.33) for baseline and the repeat visits, respectively. For RV, this was 4.67 (3.84–6.42) and 4.62 (3.83–6.42), respectively.
Of the 96 participants,12 failed the lung volume QC criterion, 22 failed the DFOV QC criterion, and 11 failed the scanner QC criterion, leaving 58 in the QC sample. The demographic and clinical characteristics of the participants in the QC samples were similar to the overall sample (Table E1).
Lessons Learned about Repeatability
Emphysema Measures
In the SPIROMICS repeatability sample, LAA−950 had the highest reliability of the emphysema measures, with ICC > 0.99 (Table 1). Its nonparametric repeatability coefficient was <1.3%. Other standard emphysema measures of LAA−910 and Perc15 also had good reliability, which improved in the QC sample. These data are represented graphically in Figures 1A–1C. Perc15TLC was more sensitive to volume differences but improved after adjustment for baseline lung volume to an ICC of 0.99 and RDC of 6.0 HU.
Table 1.
Repeatability and Reliability of Standard Densitometry and Volume Parameters
| Measure | Units | Mean (Baseline CT) | SD (Baseline CT) | Mean Difference | SD Difference | RDC (All)* | RDC (QC Sample)* | ICC (All) | ICC (QC Sample) | |
|---|---|---|---|---|---|---|---|---|---|---|
| Emphysema measures | ||||||||||
| LAA−950TLC | Percent of voxels < −950 HU at TLC (severe emphysema-like lung) | % | 8.36 | 10.49 | −0.11 | 1.36 | 1.24 | 1.09 | 0.99 | 0.99 |
| LAA−910TLC | Percent of voxels < −910 HU at TLC (mild emphysema-like lung) | % | 29.00 | 18.25 | −0.05 | 6.37 | 6.30 | 5.61 | 0.94 | 0.97 |
| Perc15 | Attenuation value of 15th percentile | HU | −926 | 29.77 | −0.39 | 11.72 | 8.82 | 9.30 | 0.92 | 0.98 |
| Perc15 volume adjusted† | Attenuation value of 15th percentile adjusted for volume difference | HU | −926 | 29.77 | −0.07 | 3.98 | 7.01 | 6.01 | 0.99 | 0.99 |
| Air trapping | ||||||||||
| LAA−856RV | Percent of voxels < −856 HU at RV (air trapping) | % | 26.61 | 23.63 | 0.30 | 9.38 | 7.80 | 9.15 | 0.92 | 0.98 |
| Tissue volumes | ||||||||||
| Tissue volumeTLC | Tissue volume (tissue + blood) at TLC | ml | 913 | 195 | −1.78 | 30.28 | 59.35 | 55.05 | 0.99 | 0.99 |
| Tissue volumeRV | Tissue volume at RV | ml | 872 | 177 | −1.20 | 34.16 | 66.94 | 56.53 | 0.98 | 0.99 |
| Lung volumes | ||||||||||
| TLV | Total lung volume at TLC | ml | 6,178 | 1,417 | 4.61 | 524 | 494 | 434 | 0.93 | 0.99 |
| RV | Total lung volume at RV | ml | 3,825 | 1,368 | 11.17 | 620 | 703 | 645 | 0.89 | 0.97 |
| Vascular volume | ||||||||||
| TPVV | Total pulmonary vessel volume at TLC | ml | 157 | 36.10 | 0.28 | 17.92 | 20.16 | 15.95 | 0.88 | 0.97 |
Definition of abbreviations: CT = computed tomography; HU = Hounsfield units; ICC = intraclass correlation coefficient; LAA = low attenuation area; QC = subgroup of subjects meeting quality control criteria; RDC = repeatability coefficient (1.96 × difference SD); RV = residual volume; TLV = total lung volume.
Differences are follow-up minus baseline.
RDC or, if not normal, nonparametric repeatability coefficient used.
Volume adjusted based on baseline lung volume in this sample.
Figure 1.
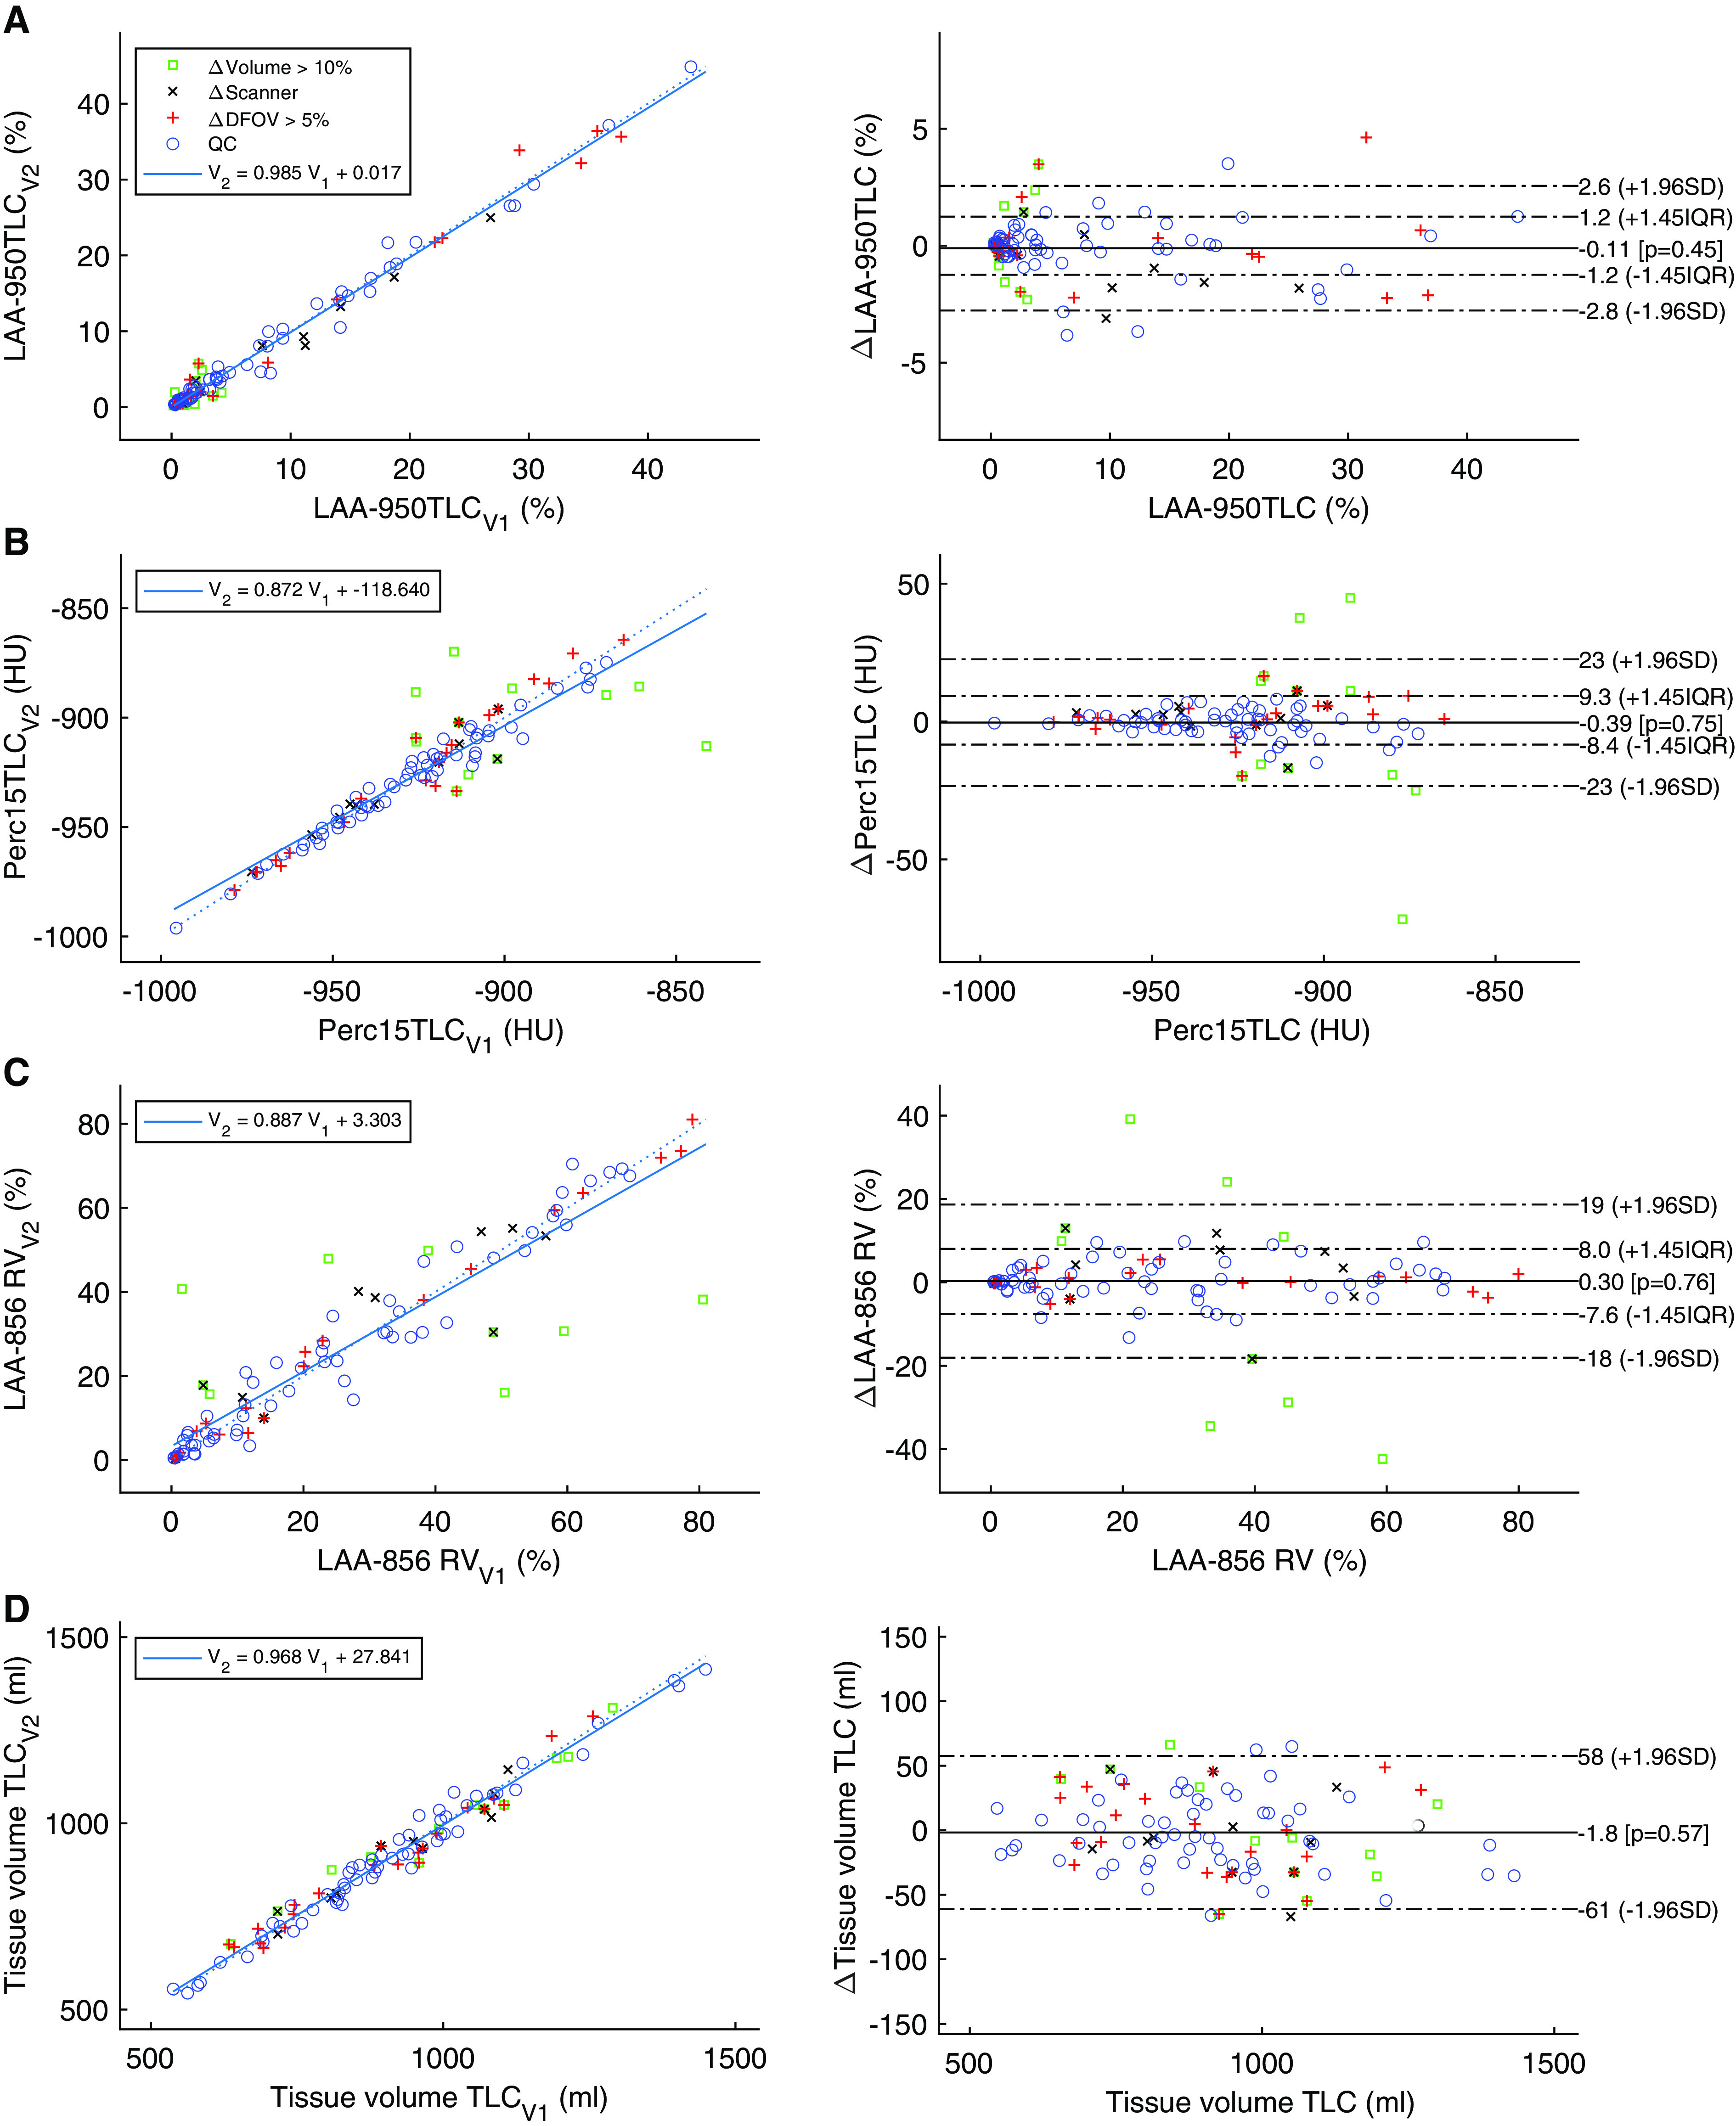
Bland-Altman and regression plots. The open green squares show subjects with lung volume change of >10%, the black X marks show subjects imaged on two different scanners, and the red plus symbols represent subjects who were imaged with DFOV > 5% differences. Blue circles demonstrate the subjects falling in the QC group for which scanners matched, fields of view were within 5%, and lung volumes were within 10% of each other. (A) Percentage of voxels below −950 Hounsfield units (HU) at TLC; (B) attenuation value (Hounsfield unit) below which 15% of the lung falls; (C) percentage of voxels below −856 HU at RV; (D) tissue volume at TLC in milliliters. Left plots show the second visit versus first visit results, together with regression line and its coefficient and bias. Plots on the right show the Bland-Altman plots of the visits, with the horizontal axis showing the average measurement and the vertical axis showing their differences (visit 2 measurement minus visit 1 measurement). DFOV = display field of view; LAA = low attenuation area; QC = quality control; RV = residual volume.
Air Trapping
LAA−856 had some extreme values due to differences in lung volume (Figure 1C). When considering QC subjects, ICC improved from 0.92 to 0.98, with a reduction in RDC from 18.4% to 9.1% (Table 1).
Tissue Volume
Tissue volumes were very stable regardless of changes in lung volume at TLC and RV, with ICCs and RDCs of >0.98 and <57 ml, respectively (Table 1 and Figure 1D).
Lung Volumes
Lung volumes were reproducible, but less so than for LAA−950, particularly for lung volume at RV (Table 1). Unsurprisingly, these improved in the QC sample.
TPVV
TPVV improved with the QC process, resulting in an increase in ICC from 0.88 to 0.97 (Table 1).
Coregistered DPM Measures
Similar to LAA−950, DPM-based emphysema was highly reliable (ICC, 0.99) (Table 2). DPM-fSAD and DPM–normal lung were less reproducible but acceptable (Table 2) and showed noticeable improvement in reliability when 10 subjects having >50% change in volume difference (TLC − RV) were removed (e.g., ICC, 0.74–0.88 for DPM-fSAD).
Table 2.
Repeatability and Reliability of Coreregistered Measures
| Measurement | Units | Mean (Baseline CT) | SD (Baseline CT) | Mean Difference | SD Difference | RDC (All)* | RDC (QC Sample)* | ICC (All) | ICC (QC Sample) | |
|---|---|---|---|---|---|---|---|---|---|---|
| DPM | ||||||||||
| DPM normal | Disease probability measure normal percentage | % | 56.67 | 27.79 | −0.56 | 14.25 | 16.34 | 12.43 | 0.86 | 0.93 |
| DPM airtrap | Disease probability measure functional small airway disease | % | 31.98 | 20.13 | 0.38 | 13.89 | 15.05 | 13.51 | 0.74 | 0.88 |
| DPM emphysema | Disease probability measure emphysema percentage | % | 11.35 | 15.05 | 0.17 | 2.58 | 1.87 | 1.47 | 0.99 | 0.99 |
| Biomechanics | ||||||||||
| Jacobian mean | Mean of the Jacobian determinant from TLC to RV registration | Ratio | 1.68 | 0.45 | −0.02 | 0.25 | 0.35 | 0.41 | 0.84 | 0.87 |
| Jacobian SD | SD of Jacobian determinant from TLC to RV registration | Ratio | 0.43 | 0.26 | −0.01 | 0.14 | 0.23 | 0.21 | 0.84 | 0.85 |
| ADI mean | Mean of the ADI from TLC to RV registration | Index | 0.38 | 0.16 | 0.00 | 0.11 | 0.22 | 0.14 | 0.75 | 0.81 |
| ADI SD | SD of ADI from TLC to RV registration | Index | 0.21 | 0.10 | 0.00 | 0.07 | 0.10 | 0.09 | 0.76 | 0.81 |
Definition of abbreviations: ADI = anisotropic deformation index; CT = computed tomography; DPM = disease probability measure; ICC = intraclass correlation coefficient; QC = subgroup of subjects meeting quality control criteria; RDC = repeatability coefficient (1.96 × difference SD).
Differences are follow-up minus baseline.
RDC or, if not normal, nonparametric repeatability coefficient used.
Biomechanics
Jacobian mean and SD were less reliable than emphysema measures, with an ICC of 0.84 even. ADI and its SD demonstrate an ICC of 0.76, but the QC steps improve the achieved reliability to >0.81 (Table 2).
Airways
The algorithm used for airway assessment used an optimal surface graph algorithm (38) to simultaneously identify the inner and outer airway walls with subvoxel resolution at all airway sizes. By incorporating a size-dependent cost function, the algorithm provides accurate measurements of airways of all sizes, in contrast to the full-width half-max algorithm, which overestimates wall thicknesses in small airways (39).
Airway Lumen Measures
Airway lumen area assessed by anatomic location was generally highly reproducible and did not vary much by QC status (Table 3). Findings were consistent for airway lumen diameter. Airway lumen–to–lung volume ratio (an index of dysanapsis) was also highly reproducible (ICC, 0.92), improving further in the QC subgroup (ICC, 0.96) (Table 3).
Table 3.
Repeatability and Reliability of Airway-associated Metrics
| Measurement | Mean (Baseline CT) | SD (Baseline CT) | Mean Difference | SD Difference | IQR | RDC (All)* | RDC (QC Sample)* | ICC (All) | ICC (QC Sample) |
|---|---|---|---|---|---|---|---|---|---|
| Airway lumen areas | |||||||||
| Trachea lumen area, mm2 | 283.0 | 78.5 | −2.0 | 24.4 | 24.8 | 36.0 | 35.8 | 0.95 | 0.95 |
| Mainstem lumen area, mm2 | 160.4 | 38.3 | −0.7 | 13.2 | 10.1 | 14.6 | 16.3 | 0.94 | 0.96 |
| Lobar lumen area, mm2 | 70.5 | 21.9 | 1.4 | 9.4 | 7.4 | 10.8 | 8.9 | 0.90 | 0.91 |
| Segmental lumen area, mm2 | 22.5 | 6.1 | −0.3 | 3.5 | 2.5 | 3.7 | 3.3 | 0.84 | 0.86 |
| Dysanapsis | |||||||||
| Airway-to-lung ratio, unitless | 0.032 | 0.004 | 0.000 | 0.001 | 0.001 | 0.001 | 0.001 | 0.92 | 0.96 |
| Airway wall areas, mm2 | |||||||||
| Trachea wall area | 183.5 | 35.3 | −2.0 | 16.6 | 10.1 | 14.7 | 10.0 | 0.89 | 0.95 |
| Mainstems wall area | 122.1 | 29.4 | −1.1 | 14.4 | 9.4 | 13.7 | 10.9 | 0.89 | 0.89 |
| Lobar wall area | 66.4 | 14.4 | 0.0 | 8.4 | 7.0 | 10.2 | 7.9 | 0.83 | 0.82 |
| Segmental wall area | 32.8 | 5.7 | −0.3 | 2.6 | 2.7 | 3.9 | 3.5 | 0.90 | 0.91 |
| Wall:lumen measures | |||||||||
| Trachea wall area fraction, % | 39.8 | 3.5 | −0.1 | 2.3 | 2.2 | 3.1 | 2.9 | 0.77 | 0.77 |
| Mainstems wall area fraction, % | 43.3 | 2.3 | 0.0 | 2.1 | 2.1 | 3.1 | 2.3 | 0.54 | 0.50 |
| Lobar wall area fraction, % | 50.3 | 3.0 | −0.2 | 2.2 | 2.9 | 4.2 | 3.4 | 0.72 | 0.76 |
| Segmental wall area fraction, % | 60.4 | 3.2 | 0.2 | 2.0 | 2.1 | 3.0 | 2.6 | 0.81 | 0.87 |
| Pi10 whole tree ⩽20 | 3.71 | 0.08 | 0.00 | 0.05 | 0.07 | 0.10 | 0.07 | 0.83 | 0.86 |
| Pi10 mean of 5 bronchial paths | 3.72 | 0.09 | 0.00 | 0.06 | 0.08 | 0.11 | 0.10 | 0.79 | 0.81 |
Definition of abbreviations: CT = computed tomography; ICC = intraclass correlation coefficient; IQR = interquartile range; Pi10 = Wall thickness at a virtual airway with an inner perimeter of 10 mm; QC = subgroup of subjects meeting quality control criteria; RDC = repeatability coefficient (1.96 × difference SD).
Differences are follow-up minus baseline.
RDC or, if not normal, nonparametric repeatability coefficient used.
Airway Wall Measures
Airway wall area assessed by anatomic location was also highly reproducible and did not vary much by QC status (Table 3). For example, the overall ICC of 0.90 for segmental airway wall area improved only marginally to 0.91 in the QC sample.
Airway wall:lumen measures, including the wall area percentage assessed by anatomic location and the Pi10 (the wall thickness at a theoretical airway with an inner perimeter of 10 mm derived from the wall to lumen area relationship sampled across generations of the airway tree) of the whole airway tree and five bronchi that underwent QC, were considerably less reproducible (ICC, 0.54–0.83) than the airway wall area and lumen area, with variable improvement in the QC sample (Table 3).
Machine Learned, Texture-based Measures
Similar to LAA−950, the main smoking-related CT emphysema subtypes of the apical-bronchitic, restrictive combined pulmonary fibrosis and emphysema and vanishing lung subtypes had high reliability (ICC, 0.99) in the overall and QC samples and the smallest RDCs of any percentile-based measure of emphysema (Table 4).
Table 4.
Repeatability and Reliability of Machine Learning–derived Measures of Parenchymal Characteristics Assessed via the Adaptive Multiple Feature Method and Computed Tomography Emphysema Subtypes Method
| Measurement | Mean (Baseline CT) | SD (Baseline CT) | Mean Difference | SD Difference | IQR | RDC (All)* | RDC (QC Sample)* | ICC (All) | ICC (QC Sample) |
|---|---|---|---|---|---|---|---|---|---|
| CTES, % | |||||||||
| Combined bronchitic-apical emphysema | 8.3 | 14.4 | −0.2 | 1.6 | 0.5 | 0.7 | 0.9 | 0.99 | 0.99 |
| Diffuse | 8.3 | 10.7 | 0.2 | 3.6 | 1.2 | 1.7 | 1.6 | 0.94 | 0.96 |
| Senile | 4.9 | 5.8 | 3.8 | 3.2 | 0.7 | 1 | 0.8 | 0.84 | 0.93 |
| Obstructive CPFE | 2.2 | 4.1 | 4.8 | 2.4 | 0.3 | 0.5 | 0.5 | 0.74 | 0.88 |
| Restrictive CPFE | 2.5 | 4.7 | 0 | 1.2 | 0.3 | 0.4 | 0.4 | 0.97 | 0.97 |
| Vanishing lung | 2 | 5.8 | 0 | 0.7 | 0 | 0 | 0 | 0.99 | 0.99 |
| AMFM texture, % | |||||||||
| Normal | 57.82 | 22.46 | 0.72 | 5.90 | 3.71 | 5.38 | 4.55 | 0.97 | 0.98 |
| Emphysema | 23.83 | 21.38 | −0.01 | 5.67 | 3.87 | 5.61 | 5.41 | 0.96 | 0.97 |
| Bronchovascular | 11.77 | 2.53 | 0.00 | 1.16 | 1.56 | 2.26 | 1.85 | 0.89 | 0.93 |
| Ground glass + ground glass reticular | 4.09 | 7.14 | −0.65 | 5.22 | 0.74 | 1.07 | 0.94 | 0.62 | 0.98 |
| Honeycomb | 2.46 | 2.33 | −0.07 | 0.41 | 0.25 | 0.37 | 0.35 | 0.98 | 0.99 |
| Consolidated | 0.01 | 0.01 | 0.00 | 0.01 | 0.00 | 0.01 | 0.01 | 0.80 | 0.84 |
Definition of abbreviations: AMFM = adaptive multiple feature method; CPFE = combined pulmonary fibrosis and emphysema; CTES = CT emphysema subtypes; CT = computed tomography; ICC = intraclass correlation coefficient; IQR = interquartile range; Pi10 = Wall thickness at a virtual airway with an inner perimeter of 10 mm; QC = subgroup of subjects meeting quality control criteria; RDC = repeatability coefficient (1.96 × difference SD).
Differences are follow-up minus baseline.
RDC or, if not normal, nonparametric repeatability coefficient used.
AMFM texture measures are also seen in Table 4. ICCs for the assessed texture classifications were mostly in the 0.93–0.99 range, with ground glass + ground glass reticular (GG/GGR) dipping down to 0.62. ICCs for all tissue types improved when limiting the assessment to the QC group. Most notably, GG/GGR moved from 0.62 to 0.98. It is notable that visually the GG/GGR tissue type becomes difficult to identify when the lungs are not fully inflated.
The Path Forward
The SPIROMICS repeatability study provides the respiratory community with an important opportunity to evaluate the short-term repeatability and reliability of QCT measurements conducted on a range of scanner types across multiple clinical centers. These data demonstrate that standard measures of emphysema, such as percentage emphysema/LAA−950, as well as texture-based approaches to CT emphysema classification, have excellent short-term repeatability and reliability. In fact, percentage emphysema/LAA−950 and volume-corrected Perc15 had the highest reliability (ICC, 0.99) of any measure and were robust to QC deviations, including by volume of inspiration, altered FOV, and change of scanner. This degree of reliability is even better than previously observed for the scan–rescan reliability of percent emphysema/LAA−950 on cardiac CT scans (40) and similar to the test–retest reliability of the FEV1 (ICC, 0.99) and the QCT measure of coronary artery calcium (ICC, 0.99) (41).
It is important to note that, unlike the percentage emphysema/LAA−950, the high degree of repeatability for volume-corrected Perc15 was only attained upon volume correction by the baseline scan. This suggests that for studies assessing change in Perc15 over time, volume correction must be applied. It is of note that the Perc15 metric does not provide an anatomical context for the measurement. Hence, percentage emphysema/LAA−950 may be the simpler and preferred measure for longitudinal studies, although its distribution can pose statistical challenges. It is important to note that volume correction in this study used baseline lung volume instead of normative volumes from a general population sample (4), as has previously been proposed (42), because the normative volumes are not expected to predict full inspiratory volume among patients with COPD, given that many patients with COPD are hyperinflated. Indeed, the measured total lung volume in the present sample was considerably higher (95% confidence interval, 500–869 ml) than the predicted total lung volume, presumably due to participant disease severity.
Interestingly, texture-based, smoking-related CT emphysema subtypes (31) had excellent reliability and even better repeatability than percentage emphysema/LAA−950. Of the other density measures, tissue volume (43) was also reproducible, with minimal effect of QC measures. Tissue volume correlates well with DLCO (43) and should be considered a parameter of interest (44, 45).
Overall, the high degree of reliability of percentage emphysema/LAA−950, provides strong support for this metric to be incorporated more routinely both into clinical practice to assess for disease progression and into clinical trials as an imaging biomarker, both at baseline as well as in longitudinal follow-up. Texture-based assessments also have significant promise, particularly given their potentially stronger biological basis than percentage emphysema/LAA−950 (30).
With respect to airway measures, coregistered measures of fSAD, and lung mechanics (33, 34), the SPIROMICS data suggested good short-term repeatability that improved with QC approaches but not to the same degree as the density measures. LAA−856 was more reliable (ICC, 0.92) in the full sample. All demonstrated improved reliability in the QC subgroup (ICC, 0.98). The small airway disease parameters, including LAA−856 and DPM-fSAD in particular, are sensitive to the degree to which patients successfully achieve similar expiratory volumes, which are more coaching and patient dependent than measures that rely on inspiration alone. Hence it is perhaps not surprising that increased noise was present, given that data really depend on comparing two inspiratory–expiratory pairs of scans.
Direct QCT measures of the larger airways are also of importance, particularly airway wall thickness and dysanapsis (46, 47). Prior work in MESA and SPIROMICS has demonstrated the importance of spatial matching in airway analyses (47). Furthermore, ratio measures in general (and wall area percentage and Pi10, specifically) may be less reproducible and less precise, taking into account their use of two measures. Given the large number of airways in the human lung, consideration of these factors and standardization of analyses of the airways is critical. Using spatially matched airway measures (by anatomic location or generation), the present study demonstrated very good reliability for airway lumen and wall areas, whereas wall area percentage was less reliable.
In the SPIROMICS repeatability study, the reliability of airway measures at various anatomic locations, as well as airway-to-lung ratio, airway count, and Pi10, was high, whereas measures at single anatomic locations were lower and sensitive to QC. This likely reflected the influence of outlier measures that are diminished when averaged across airways from matched spatial locations. Moreover, lower repeatability of some specific segments may be caused by the obliquity of the airway center line relative to the axial slice orientation (48).
Moving forward, it is clear that with careful selection of outcome measure and protocol design, excellent repeatability of QCT metrics can be achieved, on par with pulmonary function data that are currently widely accepted both in clinical practice and by the FDA. This is particularly true for density-based measures. The SPIROMICS protocol, which has served as a gold standard for several other studies (49, 50), also demonstrates that these high QC standards can be achieved with even lower radiation doses than have previously been used. With scanner technology rapidly evolving, it is anticipated that radiation dose will continue to drop even further in the future, while still preserving image quality, although newer reconstruction algorithms and dose modulation may introduce new errors. As with lung function, protocol adherence and attention to QC, in this case coaching to TLC or RV, standardization to baseline DFOV, and CT scanner model, are key considerations to improving repeatability of multiple QCT metrics. It is time that imaging biomarkers be more routinely used, both for clinical purposes as well as endpoints for clinical trials, particularly if the methodologies presented here for protocol standardization become commonplace.
Acknowledgments
Acknowledgment
The authors thank the SPIROMICS participants and participating physicians, investigators, study coordinators, and staff for making this research possible. More information about the study and how to access SPIROMICS data is available at www.spiromics.org. The authors also thank Elsa Angelini, Ph.D., Andrew Laine, Ph.D., and Artur Wysoczanski for the CT emphysema subtypes work.
Current and former investigators of the SPIROMICS sites and reading centers: Neil E. Alexis, Wayne H. Anderson, Mehrdad Arjomandi, Igor Barjaktarevic, R. Graham Barr, Patricia Basta, Lori A. Bateman, Christina Bellinger, Surya P. Bhatt, Eugene R. Bleecker, Richard C. Boucher, Russell P. Bowler, Russell G. Buhr, Stephanie A. Christenson, Alejandro P. Comellas, Christopher B. Cooper, David J. Couper, Gerard J. Criner, Ronald G. Crystal, Jeffrey L. Curtis, Claire M. Doerschuk, Mark T. Dransfield, M. Bradley Drummond, Christine M. Freeman, Craig Galban, Katherine Gershner, MeiLan K. Han, Nadia N. Hansel, Annette T. Hastie, Eric A. Hoffman, Yvonne J. Huang, Robert J. Kaner, Richard E. Kanner, Mehmet Kesimer, Eric C. Kleerup, Jerry A. Krishnan, Wassim W. Labaki, Lisa M. LaVange, Stephen C. Lazarus, Fernando J. Martinez, Merry-Lynn McDonald, Deborah A. Meyers, Wendy C. Moore, John D. Newell, Jr., Elizabeth C. Oelsner, Jill Ohar, Wanda K. O’Neal, Victor E. Ortega, Robert Paine III, Laura Paulin, Stephen P. Peters, Cheryl Pirozzi, Nirupama Putcha, Sanjeev Raman, Stephen I. Rennard, Donald P. Tashkin, J. Michael Wells, Robert A. Wise, and Prescott G. Woodruff. The project officers from the Lung Division of the National Heart, Lung, and Blood Institute were Lisa Postow and Lisa Viviano.
A complete list of current and former SPIROMICS group members may be found before the beginning of the References.
Footnotes
Supported by NIH/NHLBI contracts HHSN268200900013C, HHSN268200900014C, HHSN268200900015C, HHSN268200900016C, HHSN268200900017C, HHSN268200900018C, HHSN268200900019C, and HHSN268200900020C; NIH/NHLBI grants U01 HL137880, U24 HL141762, R01 HL182622, and R01 HL144718; and supplemented by contributions made through the Foundation for the NIH and the COPD Foundation from Amgen; AstraZeneca/MedImmune; Bayer; Bellerophon Therapeutics; Boehringer-Ingelheim Pharmaceuticals, Inc.; Chiesi Farmaceutici S.p.A.; Forest Research Institute, Inc.; Genentech; GlaxoSmithKline; Grifols Therapeutics, Inc.; Ikaria, Inc.; MGC Diagnostics; Novartis Pharmaceuticals Corporation; Nycomed GmbH; Polarean; ProterixBio; Regeneron Pharmaceuticals, Inc.; Sanofi; Sunovion; Takeda Pharmaceutical Co.; and Theravance Biopharma and Mylan/Viatris. The CT emphysema subtypes work was supported by grant R01 HL121270.
Author Contributions: Study concept and design: All authors. Acquisition, analysis, or interpretation of data: All authors. Drafting of the manuscript: A.M., E.A.H., B.M.S., J.D.N., M.K.H., E.A.K., R.G.B., and D.A.L. Critical revision of the manuscript for important intellectual content: All authors. Statistical analysis: A.M., E.A.H., B.M.S., J.D.N., D.J.C., M.K.H., and C.B.C. Study supervision: E.A.H., M.K.H., P.G.W., D.J.C., and R.G.B.
This article has an online supplement, which is accessible from this issue’s table of contents at www.atsjournals.org.
Originally Published in Press as DOI: 10.1164/rccm.202209-1698PP on July 25, 2023
Author disclosures are available with the text of this article at www.atsjournals.org.
Contributor Information
for the SPIROMICS Group:
Neil E. Alexis, Wayne H. Anderson, Mehrdad Arjomandi, Igor Barjaktarevic, R. Graham Barr, Patricia Basta, Lori A. Bateman, Christina Bellinger, Surya P. Bhatt, Eugene R. Bleecker, Richard C. Boucher, Russell P. Bowler, Russell G. Buhr, Stephanie A. Christenson, Alejandro P. Comellas, Christopher B. Cooper, David J. Couper, Gerard J. Criner, Ronald G. Crystal, Jeffrey L. Curtis, Claire M. Doerschuk, Mark T. Dransfield, M. Bradley Drummond, Christine M. Freeman, Craig Galban, Katherine Gershner, MeiLan K. Han, Nadia N. Hansel, Annette T. Hastie, Eric A. Hoffman, Yvonne J. Huang, Robert J. Kaner, Richard E. Kanner, Mehmet Kesimer, Eric C. Kleerup, Jerry A. Krishnan, Wassim W. Labaki, Lisa M. LaVange, Stephen C. Lazarus, Fernando J. Martinez, Merry-Lynn McDonald, Deborah A. Meyers, Wendy C. Moore, John D. Newell, Jr., Elizabeth C. Oelsner, Jill Ohar, Wanda K. O’Neal, Victor E. Ortega, Robert Paine, III, Laura Paulin, Stephen P. Peters, Cheryl Pirozzi, Nirupama Putcha, Sanjeev Raman, Stephen I. Rennard, Donald P. Tashkin, J. Michael Wells, Robert A. Wise, Prescott G. Woodruff, Lisa Postow, and Lisa Viviano
References
- 1. Hutchinson J. On the capacity of the lungs, and on the respiratory functions, with a view of establishing a precise and easy method of detecting disease by the spirometer. Med Chir Trans . 1846;29:137–252. doi: 10.1177/095952874602900113. [DOI] [PMC free article] [PubMed] [Google Scholar]
- 2. Graham BL, Steenbruggen I, Miller MR, Barjaktarevic IZ, Cooper BG, Hall GL, et al. Standardization of spirometry 2019 update: an official American Thoracic Society and European Respiratory Society technical statement. Am J Respir Crit Care Med . 2019;200:e70–e88. doi: 10.1164/rccm.201908-1590ST. [DOI] [PMC free article] [PubMed] [Google Scholar]
- 3. Fishman A, Martinez F, Naunheim K, Piantadosi S, Wise R, Ries A, et al. National Emphysema Treatment Trial Research Group A randomized trial comparing lung-volume-reduction surgery with medical therapy for severe emphysema. N Engl J Med . 2003;348:2059–2073. doi: 10.1056/NEJMoa030287. [DOI] [PubMed] [Google Scholar]
- 4. Hoffman EA, Ahmed FS, Baumhauer H, Budoff M, Carr JJ, Kronmal R, et al. Variation in the percent of emphysema-like lung in a healthy, nonsmoking multiethnic sample: the MESA lung study. Ann Am Thorac Soc . 2014;11:898–907. doi: 10.1513/AnnalsATS.201310-364OC. [DOI] [PMC free article] [PubMed] [Google Scholar]
- 5. Couper D, LaVange LM, Han M, Barr RG, Bleecker E, Hoffman EA, et al. SPIROMICS Research Group Design of the Subpopulations and Intermediate Outcomes in COPD Study (SPIROMICS) Thorax . 2014;69:491–494. doi: 10.1136/thoraxjnl-2013-203897. [DOI] [PMC free article] [PubMed] [Google Scholar]
- 6. Regan EA, Hokanson JE, Murphy JR, Make B, Lynch DA, Beaty TH, et al. Genetic epidemiology of COPD (COPDGene) study design. COPD . 2010;7:32–43. doi: 10.3109/15412550903499522. [DOI] [PMC free article] [PubMed] [Google Scholar]
- 7. Moore WC, Bleecker ER, Curran-Everett D, Erzurum SC, Ameredes BT, Bacharier L, et al. National Heart, Lung, Blood Institute’s Severe Asthma Research Program Characterization of the severe asthma phenotype by the National Heart, Lung, and Blood Institute’s Severe Asthma Research Program. J Allergy Clin Immunol . 2007;119:405–413. doi: 10.1016/j.jaci.2006.11.639. [DOI] [PMC free article] [PubMed] [Google Scholar]
- 8. Bourbeau J, Tan WC, Benedetti A, Aaron SD, Chapman KR, Coxson HO, et al. CanCOLD Study Group Canadian Cohort Obstructive Lung Disease (CanCOLD): fulfilling the need for longitudinal observational studies in COPD. COPD . 2014;11:125–132. doi: 10.3109/15412555.2012.665520. [DOI] [PubMed] [Google Scholar]
- 9. Reyfman PA, Sugar E, Hazucha H, Hixon J, Reynolds C, Bose S, et al. American Lung Association Airways Clinical Research Network; American Lung Association Airway’s Clinical Research Network Study protocol for a national cohort of adults focused on respiratory health: the American Lung Association Lung Health Cohort (ALA-LHC) Study. BMJ Open . 2021;11:e053342. doi: 10.1136/bmjopen-2021-053342. [DOI] [PMC free article] [PubMed] [Google Scholar]
- 10. Raoof S, Shah M, Make B, Allaqaband H, Bowler R, Fernando S, et al. Lung imaging in COPD part 1: clinical usefulness. Chest . 2023;164:69–84. doi: 10.1016/j.chest.2023.03.007. [DOI] [PMC free article] [PubMed] [Google Scholar]
- 11. Raoof S, Shah M, Braman S, Agrawal A, Allaqaband H, Bowler R, et al. Lung imaging of COPD part 2: emerging concepts. Chest . 2023;164:339–354. doi: 10.1016/j.chest.2023.02.049. [DOI] [PMC free article] [PubMed] [Google Scholar]
- 12. Hoffman EA. Origins of and lessons from quantitative functional X-ray computed tomography of the lung. Br J Radiol . 2022;95:20211364. doi: 10.1259/bjr.20211364. [DOI] [PMC free article] [PubMed] [Google Scholar]
- 13. Dirksen A, Piitulainen E, Parr DG, Deng C, Wencker M, Shaker SB, et al. Exploring the role of CT densitometry: a randomised study of augmentation therapy in α1-antitrypsin deficiency. Eur Respir J . 2009;33:1345–1353. doi: 10.1183/09031936.00159408. [DOI] [PubMed] [Google Scholar]
- 14. Chapman KR, Burdon JGW, Piitulainen E, Sandhaus RA, Seersholm N, Stocks JM, et al. RAPID Trial Study Group Intravenous augmentation treatment and lung density in severe α1 antitrypsin deficiency (RAPID): a randomised, double-blind, placebo-controlled trial. Lancet . 2015;386:360–368. doi: 10.1016/S0140-6736(15)60860-1. [DOI] [PubMed] [Google Scholar]
- 15. Sieren JP, Newell JD, Jr, Barr RG, Bleecker ER, Burnette N, Carretta EE, et al. SPIROMICS Research Group SPIROMICS protocol for multicenter quantitative computed tomography to phenotype the lungs. Am J Respir Crit Care Med . 2016;194:794–806. doi: 10.1164/rccm.201506-1208PP. [DOI] [PMC free article] [PubMed] [Google Scholar]
- 16. Iyer KS, Grout RW, Zamba GK, Hoffman EA. Repeatability and sample size assessment associated with computed tomography-based lung density metrics. Chronic Obstr Pulm Dis (Miami) . 2014;1:97–104. doi: 10.15326/jcopdf.1.1.2014.0111. [DOI] [PMC free article] [PubMed] [Google Scholar]
- 17. Park SH, Han K. Methodologic guide for evaluating clinical performance and effect of artificial intelligence technology for medical diagnosis and prediction. Radiology . 2018;286:800–809. doi: 10.1148/radiol.2017171920. [DOI] [PubMed] [Google Scholar]
- 18. Chong D, Brown MS, Kim HJ, van Rikxoort EM, Guzman L, McNitt-Gray MF, et al. Reproducibility of volume and densitometric measures of emphysema on repeat computed tomography with an interval of 1 week. Eur Radiol . 2012;22:287–294. doi: 10.1007/s00330-011-2277-1. [DOI] [PubMed] [Google Scholar]
- 19. Keller BM, Reeves AP, Henschke CI, Yankelevitz DF. Multivariate compensation of quantitative pulmonary emphysema metric variation from low-dose, whole-lung CT scans. AJR Am J Roentgenol . 2011;197:W495-502. doi: 10.2214/AJR.11.6444. [DOI] [PubMed] [Google Scholar]
- 20. Hochhegger B, Irion KL, Marchiori E, Moreira JS. Reconstruction algorithms influence the follow-up variability in the longitudinal CT emphysema index measurements. Korean J Radiol . 2011;12:169–175. doi: 10.3348/kjr.2011.12.2.169. [DOI] [PMC free article] [PubMed] [Google Scholar]
- 21. Diciotti S, Sverzellati N, Kauczor HU, Lombardo S, Falchini M, Favilli G, et al. Defining the intra-subject variability of whole-lung CT densitometry in two lung cancer screening trials. Acad Radiol . 2011;18:1403–1411. doi: 10.1016/j.acra.2011.08.001. [DOI] [PubMed] [Google Scholar]
- 22. Gietema HA, Schilham AM, van Ginneken B, van Klaveren RJ, Lammers JWJ, Prokop M. Monitoring of smoking-induced emphysema with CT in a lung cancer screening setting: detection of real increase in extent of emphysema. Radiology . 2007;244:890–897. doi: 10.1148/radiol.2443061330. [DOI] [PubMed] [Google Scholar]
- 23.Radiological Society of North America. https://www.rsna.org/en/research/quantitative-imaging-biomarkers-alliance
- 24. Motahari A, Newell JD, Han MK, Bleecker ER, Carretta EE, Couper DJ, et al. Short term repeatability of CT-derived pulmonary airway and density measures: role of quality control measures in assuring measurement reliability. Am J Respir Crit Care Med . 2017;195:A6505. [Google Scholar]
- 25. Anderson WH, Ha JW, Couper DJ, O’Neal WK, Barr RG, Bleecker ER, et al. Variability in objective and subjective measures affects baseline values in studies of patients with COPD. PLoS One . 2017;12 doi: 10.1371/journal.pone.0184606. [DOI] [PMC free article] [PubMed] [Google Scholar]
- 26. Shikata H, McLennan G, Hoffman EA, Sonka M. Segmentation of pulmonary vascular trees from thoracic 3D CT images. Int J Biomed Imaging . 2009;2009:636240. doi: 10.1155/2009/636240. [DOI] [PMC free article] [PubMed] [Google Scholar]
- 27. Kirby M, Yin Y, Tschirren J, Tan WC, Leipsic J, Hague CJ, et al. CanCOLD Collaborative Research Group and the Canadian Respiratory Research Network A novel method of estimating small airway disease using inspiratory-to-expiratory computed tomography. Respiration . 2017;94:336–345. doi: 10.1159/000478865. [DOI] [PubMed] [Google Scholar]
- 28. Amelon R, Cao K, Ding K, Christensen GE, Reinhardt JM, Raghavan ML. Three-dimensional characterization of regional lung deformation. J Biomech . 2011;44:2489–2495. doi: 10.1016/j.jbiomech.2011.06.009. [DOI] [PMC free article] [PubMed] [Google Scholar]
- 29. Comellas AP, Newell JD, Jr, Kirby M, Sieren JP, Peterson S, Hatt C, et al. Residual volume versus FRC computed tomography assessment of functional small airway disease in smokers with and without chronic obstructive pulmonary disease. Am J Respir Crit Care Med . 2023;207:1536–1539. doi: 10.1164/rccm.202210-1852LE. [DOI] [PubMed] [Google Scholar]
- 30. Yang J, Angelini ED, Balte PP, Hoffman EA, Austin JHM, Smith BM, et al. Novel subtypes of pulmonary emphysema based on spatially-informed lung texture learning: the Multi-Ethnic Study of Atherosclerosis (MESA) COPD study. IEEE Trans Med Imaging . 2021;40:3652–3662. doi: 10.1109/TMI.2021.3094660. [DOI] [PMC free article] [PubMed] [Google Scholar]
- 31.Angelini ED, Yang J, Balte PP, Hoffman EA, Manichaikul AW, Sun Y, et al. 2023. [DOI]
- 32. Uppaluri R, Hoffman EA, Sonka M, Hartley PG, Hunninghake GW, McLennan G. Computer recognition of regional lung disease patterns. Am J Respir Crit Care Med . 1999;160:648–654. doi: 10.1164/ajrccm.160.2.9804094. [DOI] [PubMed] [Google Scholar]
- 33. Xu Y, Sonka M, McLennan G, Guo J, Hoffman EA. MDCT-based 3-D texture classification of emphysema and early smoking related lung pathologies. IEEE Trans Med Imaging . 2006;25:464–475. doi: 10.1109/TMI.2006.870889. [DOI] [PubMed] [Google Scholar]
- 34. Taylor BN, Kuyatt CE. Guidelines for evaluating and expressing the uncertainty of NIST measurement results. NIST Tech Note . 1994;1297:20. [Google Scholar]
- 35. Weir JP. Quantifying test-retest reliability using the intraclass correlation coefficient and the SEM. J Strength Cond Res . 2005;19:231–240. doi: 10.1519/15184.1. [DOI] [PubMed] [Google Scholar]
- 36. Rousson V, Gasser T, Seifert B. Assessing intrarater, interrater and test-retest reliability of continuous measurements. Stat Med . 2002;21:3431–3446. doi: 10.1002/sim.1253. [DOI] [PubMed] [Google Scholar]
- 37. Shrout PE, Fleiss JL. Intraclass correlations: uses in assessing rater reliability. Psychol Bull . 1979;86:420–428. doi: 10.1037//0033-2909.86.2.420. [DOI] [PubMed] [Google Scholar]
- 38. Li K, Wu X, Chen DZ, Sonka M. Optimal surface segmentation in volumetric images: a graph-theoretic approach. IEEE Trans Pattern Anal Mach Intell . 2006;28:119–134. doi: 10.1109/TPAMI.2006.19. [DOI] [PMC free article] [PubMed] [Google Scholar]
- 39. Reinhardt JM, D’Souza ND, Hoffman EA. Accurate measurement of intrathoracic airways. IEEE Trans Med Imaging . 1997;16:820–827. doi: 10.1109/42.650878. [DOI] [PubMed] [Google Scholar]
- 40. Hoffman EA, Jiang R, Baumhauer H, Brooks MA, Carr JJ, Detrano R, et al. Reproducibility and validity of lung density measures from cardiac CT scans: the Multi-Ethnic Study of Atherosclerosis (MESA) lung study. Acad Radiol . 2009;16:689–699. doi: 10.1016/j.acra.2008.12.024. [DOI] [PMC free article] [PubMed] [Google Scholar]
- 41. Chung H, McClelland RL, Katz R, Carr JJ, Budoff MJ. Repeatability limits for measurement of coronary artery calcified plaque with cardiac CT in the Multi-Ethnic Study of Atherosclerosis. AJR Am J Roentgenol . 2008;190:W87–W92. doi: 10.2214/AJR.07.2726. [DOI] [PubMed] [Google Scholar]
- 42. Hatt CR, Oh AS, Obuchowski NA, Charbonnier J-P, Lynch DA, Humphries SM. Comparison of CT lung density measurements between standard full-dose and reduced-dose protocols. Radiol Cardiothorac Imaging . 2021;3:e200503. doi: 10.1148/ryct.2021200503. [DOI] [PMC free article] [PubMed] [Google Scholar]
- 43. Barjaktarevic I, Springmeyer S, Gonzalez X, Sirokman W, Coxson HO, Cooper CB. Diffusing capacity for carbon monoxide correlates best with tissue volume from quantitative CT scanning analysis. Chest . 2015;147:1485–1493. doi: 10.1378/chest.14-1693. [DOI] [PubMed] [Google Scholar]
- 44. Washko GR, Kinney GL, Ross JC, San José Estépar R, Han MK, Dransfield MT, et al. COPDGene Investigators Lung mass in smokers. Acad Radiol . 2017;24:386–392. doi: 10.1016/j.acra.2016.10.011. [DOI] [PMC free article] [PubMed] [Google Scholar]
- 45. Hoffman EA, Newell JD., Jr Lung mass as the complement to lung air content in quantitative CT of the COPD lung. Acad Radiol . 2017;24:383–385. doi: 10.1016/j.acra.2017.01.016. [DOI] [PubMed] [Google Scholar]
- 46. Smith BM, Kirby M, Hoffman EA, Kronmal RA, Aaron SD, Allen NB, et al. MESA Lung, CanCOLD, and SPIROMICS Investigators Association of dysanapsis with chronic obstructive pulmonary disease among older adults. JAMA . 2020;323:2268–2280. doi: 10.1001/jama.2020.6918. [DOI] [PMC free article] [PubMed] [Google Scholar]
- 47. Smith BM, Hoffman EA, Rabinowitz D, Bleecker E, Christenson S, Couper D, et al. The Multi-Ethnic Study of Atherosclerosis (MESA) COPD Study and the Subpopulations and Intermediate Outcomes in COPD Study (SPIROMICS) Comparison of spatially matched airways reveals thinner airway walls in COPD. Thorax . 2014;69:987–996. doi: 10.1136/thoraxjnl-2014-205160. [DOI] [PMC free article] [PubMed] [Google Scholar]
- 48. Wood SA, Zerhouni EA, Hoford JD, Hoffman EA, Mitzner W. Measurement of three-dimensional lung tree structures by using computed tomography. J Appl Physiol (1985) . 1995;79:1687–1697. doi: 10.1152/jappl.1995.79.5.1687. [DOI] [PubMed] [Google Scholar]
- 49. Hammond E, Chan KS, Ames JC, Stoyles N, Sloan CM, Guo J, et al. Impact of advanced detector technology and iterative reconstruction on low-dose quantitative assessment of lung computed tomography density in a biological lung model. Med Phys . 2018;45:3657–3670. doi: 10.1002/mp.13057. [DOI] [PMC free article] [PubMed] [Google Scholar]
- 50. Hammond E, Sloan C, Newell JD, Jr, Sieren JP, Saylor M, Vidal C, et al. Comparison of low- and ultralow-dose computed tomography protocols for quantitative lung and airway assessment. Med Phys . 2017;44:4747–4757. doi: 10.1002/mp.12436. [DOI] [PMC free article] [PubMed] [Google Scholar]