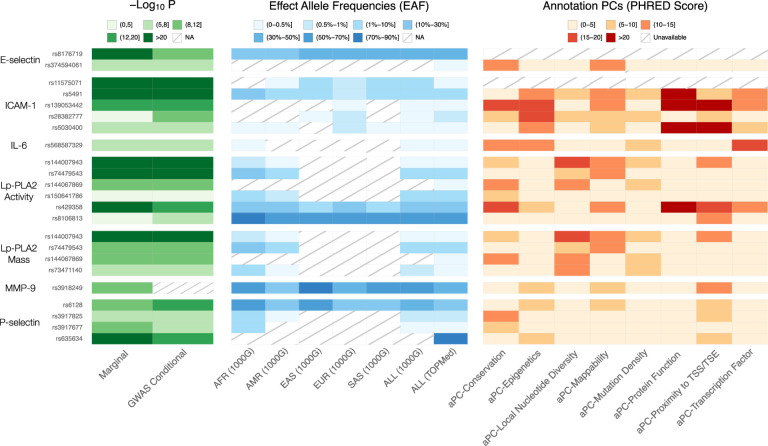
Figure 1. Single variant findings conditionally distinct from GWAS catalog variants.
We report p-values for association for marginal and conditional results, reference population effect allele frequencies (EAF) by continental ancestry group as defined by 1000 Genomes Project (1000G) (19) – African (AFR), Admixed American (AMR), East Asian (EAS), European (EUR), South Asian (SAS), as well as all participants in 1000G (ALL) – and the overall effect allele frequency for all participants included in our TOPMed analyses, and annotation principal components (aPCs) from FAVOR (20). NA means the variant is not reported in the reference panel. We note that this information is available for all variants in close linkage disequilibrium with these lead variants in Table S8.

