Abstract
Clostridioides difficile is the leading cause of healthcare associated infections. The Pathogenicity Locus (PaLoc) toxins TcdA and TcdB promote host disease. These toxins lack canonical N-terminal signal sequences for translocation across the bacterial membrane, suggesting alternate mechanisms of release, which have included targeted secretion and passive release from cell lysis. While the holin TcdE has been implicated in TcdA and TcdB release, its role in vivo remains unknown. Here, we show profound reductions in toxin secretion in ΔtcdE mutants in the highly virulent strains UK1 (epidemic ribotype 027, Clade 3) and VPI10463 (ribotype 087, Clade 1). Notably, tcdE deletion in either strain rescued highly susceptible gnotobiotic mice from lethal infection by reducing acute extracellular toxin to undetectable levels, limiting mucosal damage, and enabling long-term survival, in spite of continued toxin gene expression in ΔtcdE mutants. Our findings confirm TcdE’s critical functions in vivo for toxin secretion and C. difficile virulence.
Toxigenic bacteria possess diverse secretion systems to facilitate toxin release1. Structural aspects of these systems relate to the differing membrane and cell wall structures between Gram positive and Gram negative species, which need to be traversed in facilitating the release of cytoplasmically synthesized toxins. Gram-positive bacteria, which lack the Gram negative outer membrane, leverage two main pathways for protein secretion, namely the general secretory (Sec) pathway and the twin-arginine translocation (Tat) pathway2. Proteins using these systems contain an N-terminal secretion signal recognition sequence for membrane passage and release3.
In contrast to other bacterial toxins, large clostridial toxins (LCTs) lack identifiable secretion signals. LCTs form a family of bacterial exotoxins that exceed 200 kDa in size, and that inactivate host small GTPases to disrupt the actin cytoskeleton and promote host cell death4,5. In addition to C. difficile toxins TcdA and TcdB, members of the LCT family include Clostridium novyi toxin TcnA, Clostridium perfringens toxin TpeL and Paeniclostridium sordellii toxins TcsL and TcsH. Recent studies in C. difficile, P. sordellii and C. perfringens, suggest that LCT toxin secretion requires a conserved non-lytic holin-mediated transport mechanism6–9.
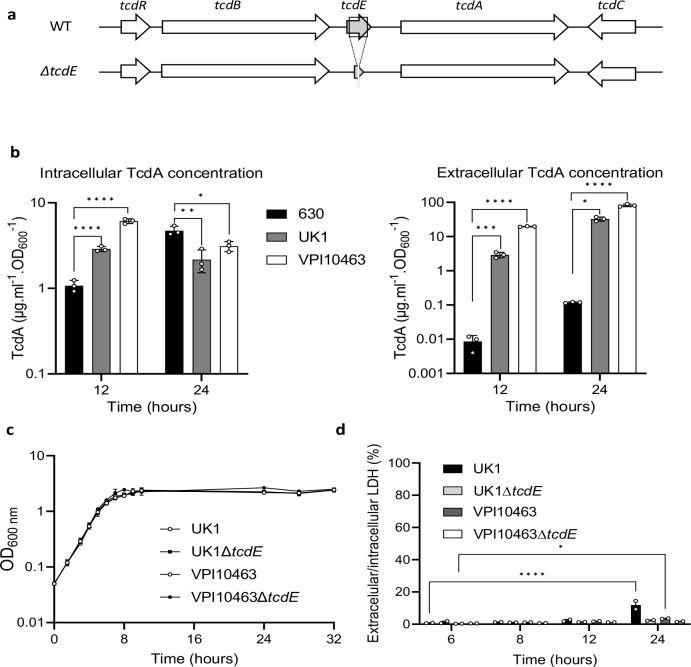
C. difficile’s Pathogenicity Locus (PaLoc) encodes the tcdA and tcdB genes and three accessory genes: tcdR, tcdE and tcdC (Fig. 1a)10. TcdR is an alternative sigma factor required for PaLoc gene expression, while TcdC has been proposed to negatively regulate transcription as an anti-sigma factor11–15. TcdE shares homology with bacteriophage holins and has been shown to promote toxin release8,16. Holins are small, bacteriophage-encoded membrane proteins that promote bacteriophage release. They oligomerize to form pores in the cytoplasmic membrane, supporting the export of bacteriophage-encoded endolysins which digest the peptidoglycan cell envelope and lead to cell lysis17.
Fig. 1. Toxin release independently of cell lysis in C. difficile VPI10463 and UK1.
a. Schematic representation of the tcdE genetic environment and tcdE deletion (ΔtcdE). b. TcdA titers in extracellular and intracellular fractions of 630Δerm, VPI10463 and UK1 strains after 12 and 24 hours of growth. The strains were grown in TY medium and TcdA was quantified using TcdA-ELISA. Means and SD are shown; n=3 independent experiments. *P ≤ 0.05, **P ≤ 0.01, ***P ≤ 0.001 and *** P ≤ 0.0001 by a one-way ANOVA. c. Growth curves of VPI10463 and UK1 strains, and their respective ΔtcdE mutants in TY medium. Means and SD are shown; n=3 independent experiments. d. Ratio of the lactate dehydrogenase (LDH) activity in the supernatants and the cell lysates of VPI10463 and UK1 strains and their respective ΔtcdE mutants used as an indicator of autolysis. LDH activity was measured using the CytoTox 96 Non-Radioactive Cytotoxicity Assay (Promega). Means and SD are shown; n=2 independent experiments. *P ≤ 0.05 and *** P ≤ 0.0001 by a two-way ANOVA followed by a Dunnett’s multiple comparison test.
In C. difficile, non-lytic TcdE-dependent translocation of the PaLoc toxins8, in addition to lytic release in stationary phase via activity of the Cwp19 lytic peptidoglycan transglycosylase18, suggested that lytic and non-lytic mechanisms may coexist, and may function during different phases of cell growth and relative to stresses encountered in vivo19. Both systems occur in other toxigenic Clostridia that use holin-like proteins for LCT release, such as TpeL in C. perfringens and TcsL in P. sordellii6–9, and that also harbor Cwp19 homologs, further supporting functions of these systems in Clostridial toxin release. Within this framework, we hypothesized that the TcdE holin may mediate efficient release during periods of high-toxin expression, including in epidemic strains prone to producing high levels, with lytic mechanisms providing a default pathway integrated with physiologic and stress responses that induce pathogen cell lysis16.
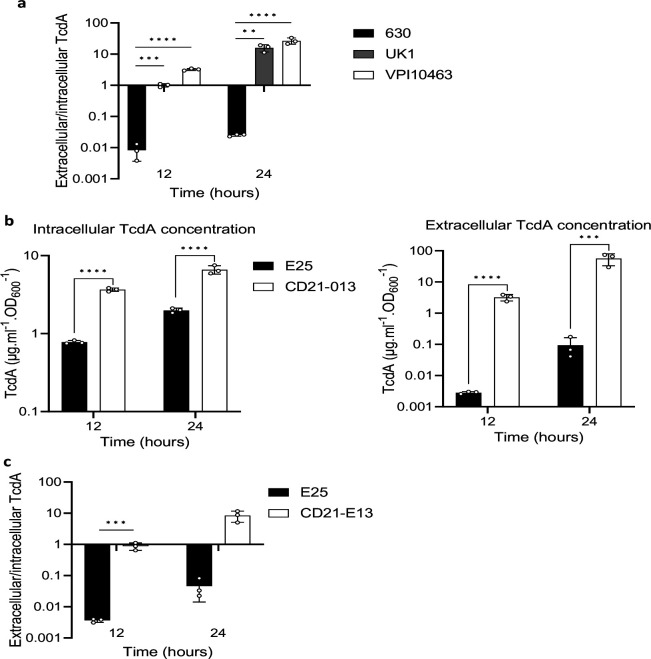
We evaluated TcdE’s functions on toxin release in-vitro and in-vivo in the high-toxin producing and clinical strains VPI10463 and ribotype 027 epidemic strain UK120,21. Both strains cause symptomatic infections in conventional and defined-association mouse models, resulting in severe disease and death22,23. We first compared intracellular and extracellular concentrations of TcdA in these strains and in the laboratory strain 630 at 12 and 24h of growth in tryptone yeast extract (TY) broth, a medium that supports high toxin expression24, 25. As expected, VPI10463 and UK1 produced higher toxins level of toxin than the 630 strain (Fig. 1b). Intracellular concentrations of TcdA were slightly lower at 12h in strain 630 but attained a comparable concentration with VPI10463 and UK1 by 24h. In contrast, extracellular concentrations of TcdA were 330 and 2,200-fold higher in UK1 and VPI10463, respectively at 12h, when compared to strain 630 (Fig. 1b). These findings illustrate that the highly virulent strains VPI10463 and UK1 release the majority of toxins produced, while toxin remained in the intracellular compartment of the less virulent and low toxin-producing 630 strain (Extended Data Fig. 1a). Comparable phenotypes in additional clinical strains were identified in the known high producer CD21–013 and low producer E25 (Extended Data Table 1; Extended Data Figs. 1B–C). These finding suggest that toxins first accumulate in the cytosol and are then secreted only upon reaching a certain threshold.
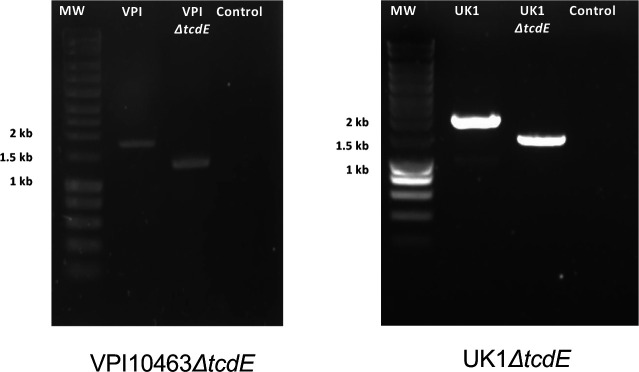
We generated in-frame tcdE deletion mutants to further evaluate TcdE’s functions in toxin secretion in VPI10463 and UK1 (Fig.1a, Extended data Fig.2). The wild-type and isogenic mutant strains grew similarly in TY media (Fig. 1c). Extracellular and intracellular lactate dehydrogenase (LDH) activity, a cytoplasmic enzyme used to monitor cell lysis, confirmed nominal cellular lysis between the wild-type and tcdE mutant strains in the first 12 hours of growth (Fig. 1d). However, the extracellular/intracellular ratio of LDH increased significantly at 24h in the parent UK1 strain, and to a lesser extent for VPI10463, but not in the tcdE mutants suggesting that TcdE activity contributed to cell lysis during late stationary phase.
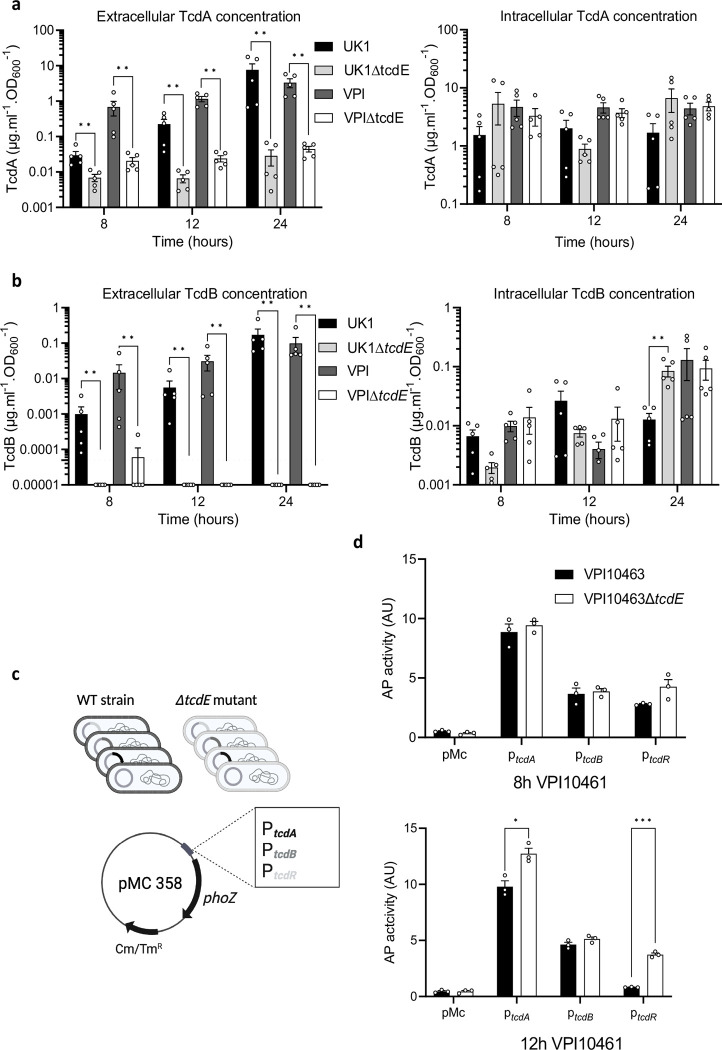
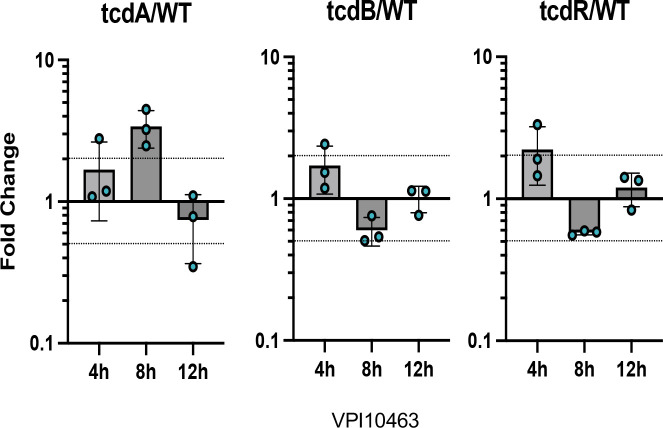
Extracellular and intracellular toxin levels measured at 8, 12 and 24 h of growth showed dramatic reductions in extracellular TcdA and TcdB in the ΔtcdE mutants of UK1 and VPI10463 (Fig. 2a and 2b). Strikingly, extracellular TcdB levels fell below the limit of detection in the ΔtcdE mutants. Conversely, intracellular TcdA and TcdB accumulation remained comparable between the ΔtcdE and the wild-type strains (Fig. 2a and 2b). To evaluate if tcdE deletion affected toxin gene transcription, plasmids carrying transcriptional fusions of the tcdA, tcdB and tcdR promoter regions with the alkaline phosphatase (AP) gene phoZ26 were transferred into the tcdE mutant and wild-type strains (Fig.2c). AP activities at 8h and 12h of growth were comparable in the VPI10463ΔtcdE and the isogenic wild-type strain, with a slight increase in tcdR and tcdA transcription at 12 h (Fig. 2c). The same findings occured with AP levels in the wild-type and isogenic ΔtcdE strains of UK1 carrying the transcriptional fusions (Extended data Fig. 4). qRT-PCR analyses of tcdA, tcdB and tcdR transcription in VPI10463 further showed no significant changes in PaLoc gene expression (Extended data Fig.3), confirming that tcdE deletion had no effects on toxin gene expression. These data highlight TcdE’s crucial role in toxin secretion in clinical epidemic strains, and to facilitate toxin release in a mechanism independent of cell-lysis (Fig. 1d).
Fig. 2. TcdE mediates TcdA and TcdB release in VPI10463 and UK1 strains in vitro.
a. and b. TcdA (a) and TcdB (b) titers in extracellular (left panel) and intracellular (right panel) fractions of VPI10463 and UK1strains and their respective ΔtcdE mutants, after 8, 12 and 24 hours of growth. Strains were grown in TY medium, and toxins were quantified using TcdA- and TcdB-ELISA. Means and SEM are shown; n=5 independent experiments. ** p<0,01 by a Mann-Whitney test. Horizontal dotted line shows thresholds of detection. c. Schematic representation of transcriptional fusions constructions. Transcriptional fusions of promoter regions of approximately 500 bp of tcdA, tcdB or tcdR genes fused to the reporter gene phoZ, were introduced by conjugation into the VPI10463 wild type strain and the isogenic ΔtcdE mutants. d. Alkaline phosphatase (AP) activity of PtcdA::phoZ, PtcdB::phoZ and PtcdR::phoZ fusions expressed from pMC358 in VPI10463 and VPI10463ΔtcdE. Strains were grown in TY medium and samples assayed for AP activity were collected at 8 and 12 hours of growth. Means and SEM are shown; n=3 independent experiments. *P ≤ 0.05 and ***P ≤ 0.001 by an unpaired t test.
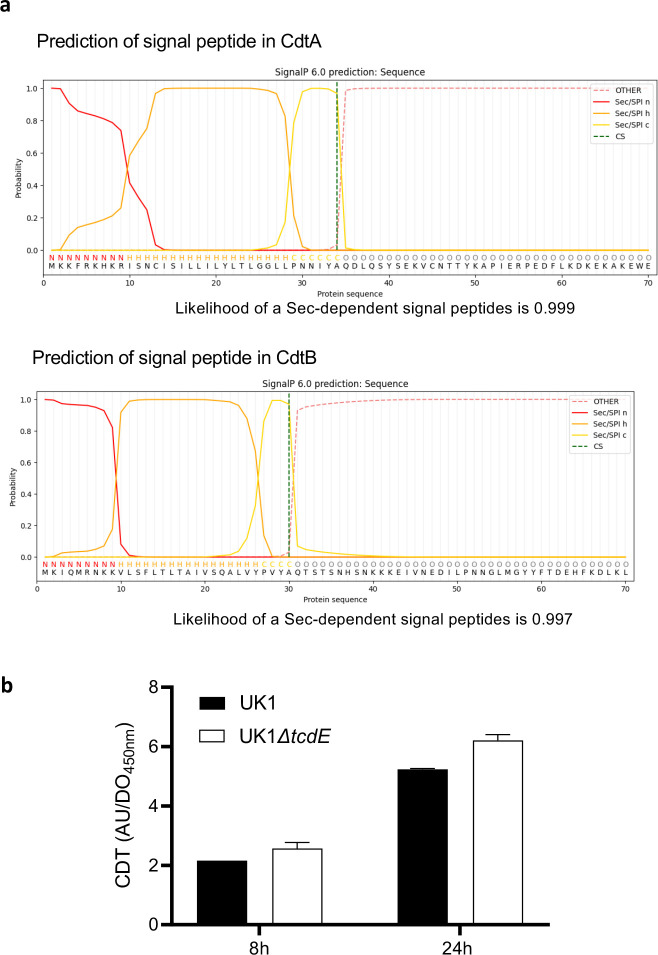
The ribotype 027 strain UK1 produces an additional toxin, binary cytolethal distending toxin (CDT), encoded by unlinked genes in the Cdt toxin locus, or CdtLoc 27. SignalP28 analyses identified putative Sec signal peptides in the N-terminus of the CDT subunits CdtA and CdtB, suggesting release by a holin-independent manner (Extended data Fig. 5a). We confirmed this finding in the UK1 ΔtcdE strain which showed no impact on CDT secretion (Extended data Fig. 5b), indicating specificity of TcdE-dependent release for the TcdA and TcdB toxins.
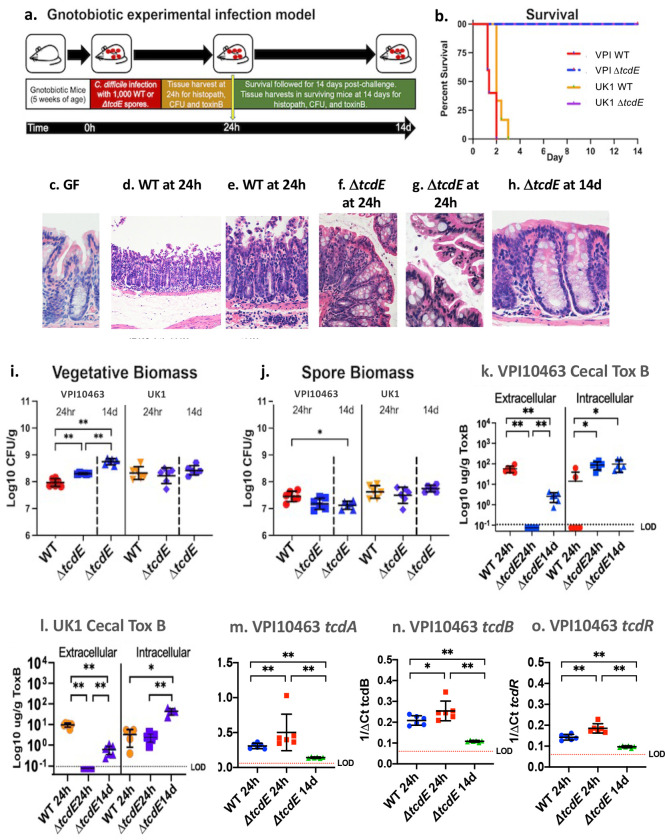
To evaluate the impact of tcdE deletion on C. difficile’s virulence in vivo, 5-week-old germ-free mice were infected with the ΔtcdE mutants or the wild type strains (Fig. 3a). Mice infected with 1000 spores of wild-type VPI10463 rapidly succumbed to infection over 48–72 hours (Fig. 3b) with symptoms of lethargy, weight loss (extended data Fig. 6a), and diarrhea developing at 20 hours post-challenge. By 24 hours, infected mice demonstrated transmural inflammation with pseudomembrane formation and substantive mucosal edema when compared to the colon of germ-free mice (compare Fig 3c, with 3d–e). In contrast, all mice infected with the isogenic ΔtcdE strain survived infection (Fig 3b). ΔtcdE-infected mice demonstrated mild to sub-clinical symptoms of infection with no loss of weight (extended Fig. 6a). The colonic mucosa of ΔtcdE-infected mice demonstrated focal areas of mild apical epithelial ruffling at 24 hours post-challenge but without broad epithelial destruction and associated transmural inflammation (Fig 3f–g). By 14 days post-challenge, ΔtcdE-infected mice demonstrated intact colonic epithelium with mild lymphocytic infiltrates in the mucosa (Fig.3h). Mice infected with the wild-type and ΔtcdE mutant strains of UK1 similarly showed 100% rescue from lethal infection with the ΔtcdE mutant strain (Fig 3b). Clinically, mice infected with the ΔtcdE mutant of UK1 showed no weight loss (extended data Fig. 6b) and demonstrated comparable histopathologic findings in the colonic mucosa to mice infected with ΔtcdE mutant of VPI10463 (data not shown).
Fig. 3. TcdE deletion rescues gnotobiotic mice from lethal C. difficile infection.:
a. Experimental overview of the gnotobiotic infection model. b. Survival of mice challenged with wild-type VPI10463 (red), VPI10463ΔtcdE (blue), UK1 (orange) or UK1ΔtcdE (purple), n=8 mice per strain. c-h. Hematoxylin and eosin (H&E) sections of the colonic mucosa. c. Germ-free GF mouse at 400X magnification showing intact epithelium and normal lamina propria cellularity. d. Representative GF mouse infected with wild-type VPI10463 at 24h post-challenge, 100X magnification showing severe mucosal damage with transmural inflammation, tissue edema (asterix) and formation of pseudomembranes above the surface epithelium. e. Inset from panel d. at 200X magnification showing transmural neutrophilic infiltrates as well as immune cells in sub-mucosal blood vessels, at the bottom. f. Colon at 200X magnification of ΔtcdE-infected mouse showing limited surface epithelial ruffling but intact epithelium and with nominal inflammatory infiltrates at 24 hours post-challenge, in contrast to mice infected with the wild-type strain (panels d-e). g. 400X magnification of surface colonic epithelium from ΔtcdE-infected mouse showing focal ruffling of surface colonocytes but without formation of pseudomembranes. h. 400X magnification of colonic mucosa at 14 days in a surviving ΔtcdE-infected mouse showing intact colonic epithelium and limited lymphocytic infiltrates in the lamina propria. i. C. difficile vegetative biomass in cecal contents from mice infected with VPI10463 and UK1 or the isogenic ΔtcdE-mutant strains at 24h and from the ΔtcdE-infected mice at 14 days. Significance values for non-parametric Kruskal-Wallis test shown are **p=0.0022. j. C. difficile spore biomass in cecal contents from mice infected with VPI10463 and UK1 or the isogenic ΔtcdE-mutant strains at 24h and from the ΔtcdE-infected mice at 14 days. Significance values for non-parametric Kruskal-Wallis test shown are *p=0.012. k. Cecal extracellular and intracellular toxin B levels from mice infected with wild-type VPI10463 or the isogenic ΔtcdE-mutant strains at 24h and from the ΔtcdE-infected mice at 14 days. Dotted line with LOD indicates limit of detection. Significance values for non-parametric Kruskal-Wallis test shown are **p=0.0022 and *p=0.012. l. data comparable to panel k. for strain UK1. m-o. q rtPCR of cecal tcdA, tcdB and tcdR expression in mice infected with the wild-type or ΔtcdE VPI10463 strains at 24 hours and surviving ΔtcdE strain-infected mice at 14 days. Bars show mean and standard deviation. Kruskal-Wallis significance values as in panels k and l.
The vegetative biomass of VPI10463 ΔtcdE was 2-fold higher than that of the wild-type VPI10463 at 24 hours post-challenge and increased 5-fold from 24 hours to 14 days (Fig. 3i). In contrast, spore biomass remained equivalent between the strains, including at 14 days in the tcdE mutant (Fig.3j). In UK1-infected mice, vegetative and spore biomass remained comparable between the wild-type and the ΔtcdE strain over time (Fig. 3i and 3j). These data indicate that the ΔtcdE strains have comparable or slightly better fitness to colonize the gnotobiotic mouse intestine than the corresponding wild-type strains.
At 24h of infection, while VPI10463-infected mice demonstrated high levels of TcdB toxin, levels fell below detectable thresholds in mice infected with the isogenic tcdE mutant (Fig. 3k). By 14 days post-infection, low toxin B levels were detectable in surviving ΔtcdE-infected mice, suggesting release by a TcdE-independent mechanisms such as via cellular lysis, but remained 20-fold lower than the acute levels seen at 24h in mice infected with the wild-type strain (Fig. 3k). In contrast, intracellular TcdB levels were slightly increased in VPI10463 ΔtcdE at 24h post-infection when compared to the isogenic wild-type and remained constant over time in the mutant strain (Fig. 3k). Intra- and extracellular levels of TcdB in mice infected with the UK1 and UK1 ΔtcdE strains were comparable (Fig. 3l). To rule out effects of tcdE deletion in vivo on toxin gene expression, qRT-PCR of tcdA, tcdB and tcdR transcripts in VPI10463 (Fig 3m–o, respectively) showed elevated expression in the ΔtcdE mutant at 24h of infection, as compared to the wild-type strain. Expression levels in the ΔtcdE mutant fell 2 to 5-fold by 14 days in surviving ΔtcdE mutant-infected mice (Fig. 3o).
Our findings demonstrate the profound effects of C. difficile’s TcdE on host outcomes from infection, per its dominant role in facilitating extracellular toxin release. In contrast, release from alternate mechanisms, including cellular lysis via Cwp19 or other lytic mechanisms, was nominal per undetectable levels of extracellular toxin acutely in ΔtcdE mutant-infected mice, and limited mucosal damage. By 14 days post-challenge, while extracellular toxin was detectable, it remained at levels 20-fold lower than seen at 24h in infection with the wild-type strains, suggesting that alternate mechanisms of toxin release play a limited role in vivo, for high toxin-producing strains18.
While the TcdE holin’s role in toxin release is clear, how it facilitates release remains an interesting question. In other systems, such as type 10 secretion systems (T10SS), holins have been shown to promote protein secretion through novel mechanisms that use a holin/endolysin pair29. In Gram negative species, the T10SS holins oligomerize to form pores in the cytoplasmic membrane, enabling the transport and release of a cytosolic endolysin into the periplasm. The peptidoglycan hydrolase activity of the endolysin locally permeabilizes the cell wall to allow specific protein substrates to be transported through the peptidoglycan layer and secreted29. The Serratia marcescens chitinases leverages this mechanism, via translocation of the endopeptidase endolysin ChiX into the periplasmic space via the holin ChiW30. Similarly, the secretion of the unusual typhoid AB-toxin of Salmonella enterica typhi requires peptidoglycan remodeling by muramidase activity of endolysin TtsA, which is believed to be translocated across the internal membrane by an as yet unidentified holin31. Similar to the Clostridial LCT loci, the Gram negative T10SS loci encode their secreted targets within the same genetic locus as the holin/endolysin pair32, suggesting potential for the TcdE holin to act in a comparable manner. Within the C. difficile PaLoc, most strains produce an endolysin remnant, designated TcdL33. However, an intact version of the endolysin has been identified in cryptic clades of C. difficile that carry a “Mono-Toxin B Paloc” 34,35. These findings raise the interesting question if C. difficile may use the TcdL remnant endolysin, or other endolysins located elsewhere in the genome, with TcdE to facilitate PaLoc toxin release.
Though LCTs use a holin/endolysin pair to traverse the peptidoglycan layer in Clostridia, how they cross the cell membrane remains ill-defined, given their lack of an N-terminal signal sequence. Recent studies by Saadat and Melville suggest that C. perfringens’ LCT toxin TpeL can be directly transported by its TpeE holin using a charge zipper mechanism. After insertion into the membrane, TpeL induces folding and oligomerization of TpeE around it, to form a pore that facilitates subsequent secretion7. In the case of C. difficile, elucidation of the essential function of the TcdE holin in PaLoc toxin release opens opportunities to further resolve mechanisms of toxins transport through the cellular membrane and peptidoglycan layers, including requirements for local peptidoglycan remodeling by other PaLoc or chromosomal genes. Our findings also identify TcdE as a central target of vulnerability in C. difficile’s PaLoc toxin release, particularly during acute infections with high toxin-producing and epidemic strains, and support therapeutic interventions that reduce its expression and function in vivo.
Methods
Bacterial strains and cultures conditions.
C. difficile and Escherichia coli strains used in this study are described in Extended DataTable 1. C. difficile strains were grown in a Freiter’s chamber (Jacomex) under anaerobic atmosphere (5% H2, 5% CO2, and 90% N2) in TY24 or Brain Heart Infusion (BHI, Difco) media. When appropriate, cefoxitin (Cfx, 25μg/ml) and D-cycloserine (Cs, 250 μg/ml) and thiamphenicol (Tm, 7.5 μg/ml) were added to the culture medium. E. coli strains were grown in LB broth, and when necessary, ampicillin (100 μg/ml) or chloramphenicol (15 μg/ml) was added to the culture medium. Growth curves were obtained by monitoring OD600 at each time point from an overnight culture diluted to a starting OD600 of 0.05. For quantitation of total biomass of C. difficile, mouse cecal contents were collected into pre-weighed Eppendorf tubes with 0.5mL of pre-reduced PBS with 40mM cysteine (Millipore-Sigma) as a reducing agent. Tubes were weighed after adding material and transferred into a Coy anaerobic chamber (Coy Labs) at 37°C for serial dilutions with plating to selective C. difficile CHROMID agar (Biomérieux) or Brucella agar (Becton Dickinson) for commensal quantitation. C. difficile colonies were counted at 48 hours of incubation. C. difficile spore preparations and counts were defined by exposing pre-weighed material to 50% ethanol for 60 minutes followed, by serial dilution and plating to C. difficile CHROMID agar. Vegetative cell biomass was calculated by subtracting the spore biomass from the total biomass and normalizing to the cecal mass.
Plasmid and strain construction.
All primers and plasmids used are listed in Extended Data Table 1 and 2. The ΔtcdE mutants in the C. difficile VPI10463 and UK1 backgrounds were obtained by allele-coupled exchange using the pMSR0 pseudo-suicide plasmid36. Briefly, homology arms of both up- and downstream locations of the target gene were amplified by PCR from genomic DNA of C. difficile VPI10463 and UK1 strains and purified PCR products were directly cloned into the pMSR0 vector using NEBuilder HiFi DNA Assembly (New England Biolabs). The pMSR0-derived plasmids containing the allele exchange cassettes of the target genes were transformed into E. coli strain NEB10β (New England Biolabs) and verified by sequencing. Plasmids were then transformed into E. coli HB101 (RP4) and transferred by conjugation into appropriate C. difficile strains. C. difficile transconjugants were selected on BHI agar supplemented with cefoxitin, D-cycloserine and thiamphenicol. Single cross-over integrants were selected based on the size of the colonies after restreak of the transconjugants on BHI with thiamphenicol. Colonies that underwent the second recombination event were then selected on BHI plates containing anhydrotetracycline (ATc: 100 ng/ml). Growing colonies were then tested by PCR for the presence of the expected deletion. For construction of promoter::phoZ constructs, promoter regions of tcdA, tcdB and tcdR of approximately 500 bp were amplified by PCR and cloned into the linearized pMC358 vector26.
Alkaline phosphatase activity assays.
C. difficile strains containing the phoZ reporter fusions were grown in TY medium at 37 °C in anaerobic conditions from an overnight culture diluted to a starting OD600 of 0.05 and harvested at 8 and 12hrs growth after inoculation. Cell pellets were washed with 0.5 ml of cold Wash buffer (10 mM Tris-HCl, pH 8.0, 10 mM MgSO4), centrifuged and resuspended in 750 μl Assay buffer (1 M Tris-HCl, pH 8.0, 0.1 mM ZnCl2). 500 μl of the cell suspensions were transferred into separate tubes and mixed with 350 μl of Assay buffer and 50 μl of 0.1% SDS, before vortexing for 1 min. Sample tubes were incubated at 37 °C for 5 min and then cooled on ice for at least 5 min. The assay starts by addition of 100 μl of 0.4% pNP (pnitrophenyl phosphate in 1 M Tris-HCl, pH 8.0; Sigma-Aldrich) to each sample and incubation at 37 °C. A sample without cell was prepared as a negative control. Upon development of a light-yellow color, the alkaline phosphatase reaction was stopped by addition of 100 μl of stop solution (1 M KH2PO4) and placing the tubes on ice. Time elapsed (min) for the assay was recorded. Samples were then centrifuged at max speed for 5 min and absorbance for each sample was read at both OD420 and OD550. Units of activity were calculated and normalized to cell volume by using the following formula: (OD420 − (1.75 × OD550) × 1000)/(t (min) × OD600 × vol. cells (ml)).
RNA extraction.
Total RNAs were extracted from C. difficile strains grown in TY medium at 37 °C in anaerobic conditions up to 8, 12 and 24 hours. 10 ml of cultures were harvested and centrifuged (5000 rpm at 4°C) for 10 minutes. Supernatants were discarded and pellets immediately frozen and stored at −80°C. Pellets were then resuspended in 1mL of RNApro (MP biomedicals) and transferred into Matrix B tubes for lysis by FastPrep (MP biomedicals) with 3× 40” shaking cycle at speed 6.5, separated by 2 min incubation in ice. Tubes were then centrifuged 10 min at 13000 rpm at 4°C (conditions used for the entire procedure). Half a volume of chloroform was thereafter added to the cell lysates and were vortexed for 5 sec. After 10 min centrifugation the upper phases were collected, and nucleic acids were precipitated by addition of 500μl of cold ethanol and stored at −20°C for at least 30 min. After a 15 min centrifugation, pellets were washed 3 times with 500μl of cold 75% ethanol following by 5 min centrifugation. Ethanol was carefully removed and pellets air dried at room temperature and resuspended in 60 μl of RNase free water. RNAs were then treated by DNase (Turbo DNA free Kit) according to the manufacturer’s recommendations.
Reverse transcription and Real-time quantitative PCR.
RNA (1μg) was incubated 10 min at 70°C with 1μg of hexamer oligonucleotide primers (p(DN)6, Roche) before adding 10 μl of 5X AMV RT buffer, 4 μl of dNTP (25mM), 1μl of RNasine (Promega) and 1μl of AMV RT enzyme (Promega) for a 50μl reaction volume. After 2h incubation at 37°C, the reaction was stopped by heat treatment (85°C) during 5 min. Real-time quantitative PCR was performed in 20μl reaction containing 20 ng of cDNAs, 10 μl of the SYBR PCR master mix (Life Technologies, Fisher) and 400 nM of tcdA, tcdB, or tcdR gene-specific primers (Extended Data Table 2). Amplification and detection were performed using a StepOne™ instrument (Applied Biosystem). For each sample, the quantity of cDNAs of target genes was normalized to the quantity of cDNAs of the DNA polymerase III gene (dnaF). The relative change in gene expression was recorded as the ratio of normalized target concentrations (threshold cycle [ΔΔCT] method)37
Toxin ELISA.
Overnight cultures of C. difficile strains were diluted in TY medium to a starting OD600 of 0.05 and grown at 37°C. 1 ml of culture was harvested after 8, 12 and 24 hours growth and centrifuged (5000 rpm at 4°C) for 5 min. Supernatants were collected and kept at −20°C. Cell pellets were washed in PBS 1X and kept at −20°C. For the Toxin A ELISA, PCG4.1 polyclonal antibodies (Bio-techne) were diluted at 4ng/ml in PBS and coated overnight on a Maxisorp plate to use as capture antibodies. The wells were then blocked with Superblock blocking buffer (Thermo Fisher Scientific). A range of purified toxin A (Merck) from 0 to 1 μg/ml used to perform a standard curve and dilutions of the samples were added to the wells. Detection antibodies anti-C. difficile toxin A coupled to HRP (LS-Bio) were then added at a 1:10000 dilution. The plate was developed by addition of TMB (Thermo Fisher Scientific) followed by a 30 min incubation and the reaction was stopped by addition of a 0.2M H2SO4 solution into the wells. The plate was read at a wavelength of 450nm with a Glomax plate reader (Promega). Toxin concentration in each sample was calculated using the standard curve and normalized by the optical density of the culture. The amount of toxin was normalized by the optical density of the culture. The same procedure is used for the Toxin B ELISA but N4A8 monoclonal antibodies (BBI solution) diluted at 4ng/ml in PBS was used for the capture antibodies and the T4G1 monoclonal antibodies previously coupled to biotin were used as detection antibodies (BBI solution, 1:10000 dilution) with streptavidin HRP (Thermo Fisher Scientific). For the CDT ELISA, chicken C. difficile binary toxin subunit B capture and detection antibodies (MyBiosource) were used following the supplier’s instructions.
Lactate deshydrogenase (LDH) assays.
1ml of culture aliquots were taken and pelleted at indicated time points by centrifugation for 5 min at 5000 rpm at 4°C. Supernatants were collected and cell pellets were resuspended in 1 ml of PBS. Resuspended pellets were transferred in Matrix B tubes for lysis by FastPrep (MP biomedicals) with 2×40”shaking cycles at speed 6.5, separated by 2 min incubation in ice. LDH activity in the supernatants and the cell lysates was then assessed using the CytoTox 96 Non-Radioactive Cytotoxicity Assay (Promega) by following the manufacturer’s recommendations. Optical density was read at 490nm on a Glomax plate reader (Promega). The ratio of supernatant to total LDH activity normalized by the cell density of the samples was used as an indicator of autolysis.
Germ-free mouse infection studies.
Animal studies were conducted in negative pressure BL-2 gnotobiotic isolators (Class Biologically Clean, Madison, WI)38 under an approved institutional IACUC protocol. Equal ratios of 6 week-old male and female gnotobiotic mice were singly housed and challenged with 1×10³ of wild-type or ΔtcdE C. difficile spores. Progression of disease was assessed via body condition scoring39. Mice were sacrificed at a BCS of 2-, or at defined timepoints at either 24 hours or 14 days post-C. difficile challenge. Cecal contents were collected for functional studies including CFU enumeration, toxin ELISA, and qRT-PCR. The gastrointestinal tract and internal organs were fixed in zinc-buffered formalin (Z-FIX, Thermo-Fisher, Waltham, MA) for histopathologic assessment.
Histopathological analyses.
Formalin-fixed gut segments from germ-free or infected mice were paraffin embedded and 5mm sections cut for staining with hematoxylin and eosin (H&E; Thermo-Fisher, Waltham, MA) as described40. Slides were visualized under a Nikon Eclipse E600 microscope (Nikon, Melville, NY) to assess epithelial damage per cellular stranding and vacuolation, the nature of Inflammatory infiltrates, mucosal erosions, and tissue edema. Lumenal neutrophils were quantified by a Pathologist by evaluating ten 400X high powered fields (HPFs) across at least 3 colonic sections per mouse. Neutrophils were identified by presence of segmented nuclei and pale to finely granular cytoplasm.
Statistical analysis:
All statistical tests were performed in GraphPad Prism. A p value <0.05 was considered significant. For gnotobiotic mouse studies, survival studies were evaluated in Prism 9.0 (GraphPad, San Diego, CA) using the Mantel-Cox for assessment of significant differences between wild-type and ΔtcdE mutant strains. Vegetative and spore biomass, and toxin B levels from mice were analyzed in Prism 9.0 (GraphPad, San Diego, CA) for visualization. Significant differences among groups were evaluated by non-parametric Kruskal-Wallis ANOVA and Dunn’s post-test. A p value ≤0.05 was considered significant.
Extended Data
Extended data Fig 1:
TcdA is actively secreted in high toxin producer strains. a. extracellular/intracellular ratio of TcdA from 630Δerm, UK1 and VPI10463 strains. The strains were grown in TY medium and TcdA concentrations from the supernatant and the intracellular content were quantified using a TcdA-ELISA. Means and SD are shown; n=3 independent experiments. **P ≤ 0.01, ***P ≤ 0.001 and *** P ≤ 0.0001 by a one-way ANOVA. b. TcdA titers in extracellular and intracellular fractions of E25 and CD21–013 strains after 12 and 24 hours of growth. The strains were grown in TY medium and TcdA was quantified using TcdA-ELISA. Means and SD are shown; n=3 independent experiments. ***P ≤ 0.001 and *** P ≤ 0.0001 by a one-way ANOVA. c. extracellular/intracellular ratio of TcdA from E25 and CD21–013 strains. The strains were grown in TY medium and TcdA concentrations from the supernatant and the intracellular content were quantified using a TcdA-ELISA. Means and SD are shown; n=3 independent experiments. ***P ≤ 0.001 by a one-way ANOVA.
Extended data Fig.2:
PCR verification of the tcdE deletion mutants in both C. difficile VPI10463 and UK1 strains
Extended data Fig 3:
Transcript abundance of tcdA, tcdB and tcdR quantified by qRT-qPCR. C. difficile strains were grown in TY medium. Samples were collected after 4, 8 and 12 hours of growth. Means and SD are shown; n=3 independent experiments.
Extended data Fig 4:
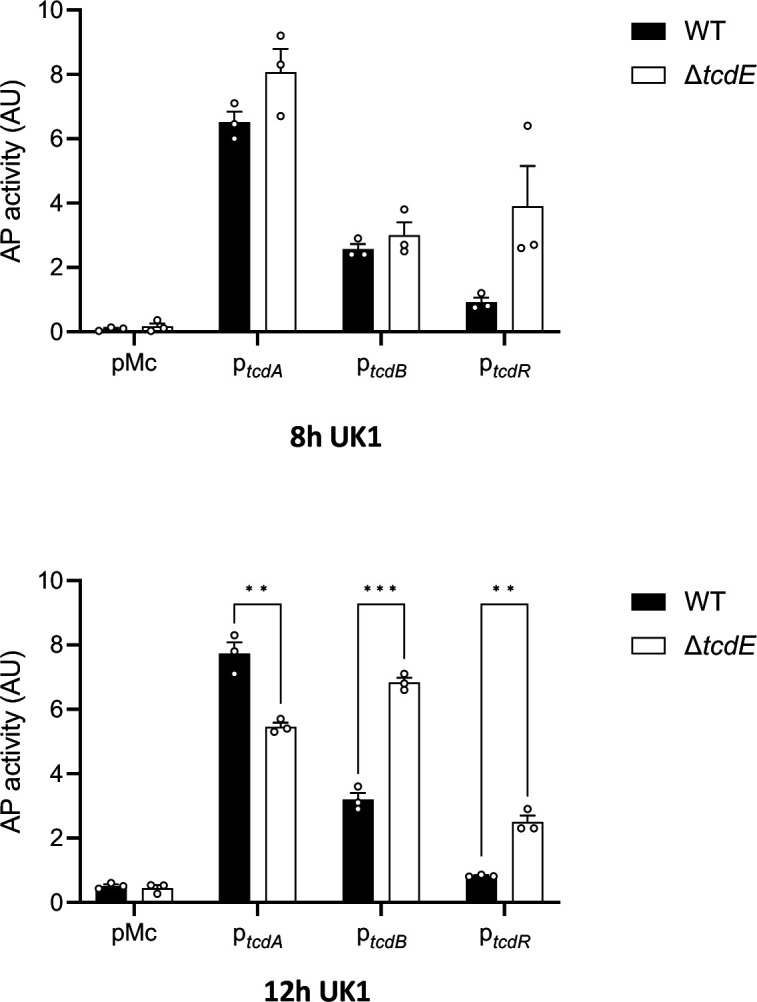
Alkaline phosphatase (AP) activity of PtcdA::phoZ, PtcdB::phoZ and PtcdR::phoZ, expressed from a plasmid in UK1 and UK1ΔtcdE. Strains were grown in TY medium and samples assayed for AP activity were collected at 8 and 12 hours of growth. Means and SEM are shown; n=3 independent experiments. **P ≤ 0.01 and ***P ≤ 0.001 by an unpaired t test.
Extended data Fig 5:
a. Prediction of a signal peptide from CdtA and CdtB amino acid sequences using SignalP 6.028. b. Binary toxin (CDT) levels in extracellular fractions of the UK1 and UK1 ΔtcdE strains after 8 and 24h of growth. Strains were grown in TY medium, and CDT was quantified using CDT-ELISA. Means and SD are shown; n=3 independent experiments.
Extended data Fig 6:
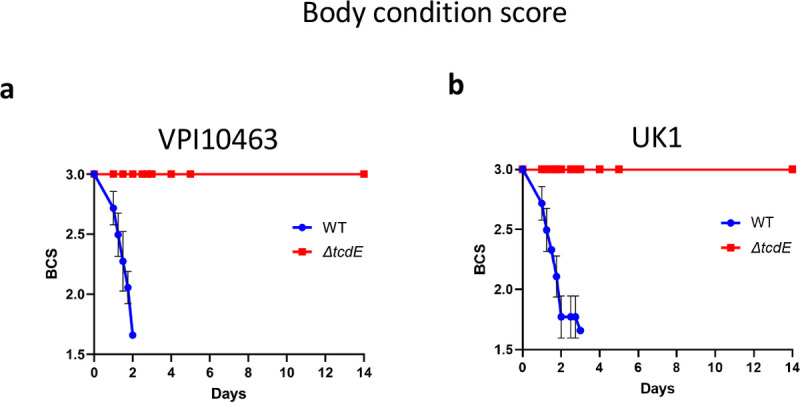
a. Body condition scores of mice infected with VPI10463 strain and its respective tcdE mutant. b. Body condition scores of mice infected with UK1 strain and its respective tcdE mutant.
Extended data Table 1.
Strains and plasmids used in this study.
| Strain | Genotype | Origin |
|---|---|---|
|
| ||
| E. coli | ||
|
| ||
| NEB-10 beta | Δ(ara-leu) 7697 araD139 fhuA ΔlacX74 galK16 galE15 | New England Biolabs |
| e14- ϕ80dlacZΔM15 recA1 relA1 endA1 nupG rpsL (StrR) rph spoT1 Δ(mrr-hsdRMS-mcrBC) | ||
| HB101 (RP4) | supE44 aa14 galK2 lacY1 Δ(gpt-proA) 62 rpsL20 (StrR)xyl-5 mtl-1 recA13 Δ(mcrC-mrr) hsdSB (rB-mB-) RP4 (Tra+ IncP ApR KmR TcR) | Laboratory stock |
| EC1370 | HB101(RP4) carrying pDIA7080 | This work |
| EC1384 | HB101(RP4) carrying pDIA7090 | This work |
| C. difficile | ||
| 630Δerm | 630 ΔermB | Laboratory stock1 |
| UK1 | Laboratory stock2 | |
| VPI10463 | Laboratory stock3 | |
| E25 | Laboratory stock4 | |
| CD21–013 | Laboratory stock5 | |
| CDIP1688 | VPI10463 ΔtcdE | This work |
| CDIP1855 | VPI10463 carrying pMC358 | This work |
| CDIP1920 | VPI10463 ΔtcdE carrying pMC358 | This work |
| CDIP1753 | UK1 ΔtcdE | This work |
| CDIP1838 | UK1 carrying pMC358 | This work |
| CDIP1854 | UK1 ΔtcdE carrying pMC358 | This work |
| CNRS_CD166 | VPI10463 carrying p112 | This work |
| CNRS_CD170 | VPI10463 ΔtcdE carrying p112 | This work |
| CNRS_CD167 | VPI10463 carrying p113 | This work |
| CNRS_CD171 | VPI10463 ΔtcdE carrying p113 | This work |
| CNRS_CD169 | VPI10463 carrying p115 | This work |
| CNRS_CD172 | VPI10463 ΔtcdE carrying p115 | This work |
| CDIP1834 | UK1 carrying p112 | This work |
| CDIP1850 | UK1 ΔtcdE carrying p112 | This work |
| CDIP1837 | UK1 carrying p113 | This work |
| CDIP1853 | UK1 ΔtcdE carrying p113 | This work |
| CDIP1836 | UK1 carrying p115 | This work |
| CDIP1852 | UK1 ΔtcdE carrying p115 | This work |
|
| ||
| Plasmid | ||
| pMSR0 | Allele exchange in C. difficile UK1 and VPI10463 | Peltier et al6 |
| pMC358 | Promoterless phoZ | Edwards et al7 |
| pDIA7080 | pMSR0 derivative for tcdE deletion in VPI10463 | This work |
| pDIA7090 | pMSR0 derivative for tcdE deletion in UK1 | This work |
| p112 | pMC358 derivative for PtcdR-phoZ fusion | This work |
| p113 | pMC358 derivative for PtcdB-phoZ fusion | This work |
| p115 | pMC358 derivative for PtcdA-phoZ fusion | This work |
Hussain, H.A., et al. (2005). J Med Microbiol 54, 137–41.
Killgore GTA, et al. (2008). C. J Clin Microbiol 46:431–437.
Hammond G.A and Johnson JL. (1995 ).Micro. Patho. 19:4, 203–213
Kurka H et al., (2014). PloS One 9:1, e86535
Anjou C et al., in preparation
Peltier, J. et al. (2020) Commun Biol 3, 718.
Edwards, A.N. et al. (2015). Anaerobe 32, 98–104.
Extended data Table 2.
Oligonucleotides used in this study.
| Name | Sequence (5'–3')1 | Description |
|---|---|---|
|
| ||
| pMSR cloning | ||
| JP449 | CGTTTTGTAAACGAATTGC | 5’ pMSR0 insert screening |
| JP450 | CTCACGTTAAGGGATTTTG | 3’ pMSR0 insert screening |
| MO-008 | TTTTTTGTTACCCTAAGTTTCTCTGACTCTGG AATTATAGAATC | 5’ left arm ΔtcdE VPI10463 |
| MO-018 | CTTTTCATCCAGGTGAACTACTGTGCATTC | 3’ left arm ΔtcdE VPI10463 |
| MO-019 | TAGTTCACCTGGATGAAAAGTAAGTAATGGTAG | 5’ right arm ΔtcdE VPI10463 |
| MO-020 | AGATTATCAAAAAGGAGTTTCTCATTTTCTCT TGGTCTAATG | 3’ right arm ΔtcdE VPI10463 |
| MO-011 | GAATTATGCAAGTTGGATTTG | 5’ ΔtcdE screening VPI10463 |
| MO-006 | CTTTATATATTTTTCCTATAACTTTTAAACTAT C | 3’ ΔtcdE screening VPI10463 |
| MO-021 | TTTTTTGTTACCCTAAGTTTGGAATGCAAAAT ATAGATGATAATTATTTC | 5’ left arm ΔtcdE UK1 |
| MO-022 | CTTACTTTTCGTGCATTCATCATAGTTCAC | 3’ left arm ΔtcdE UK1 |
| MO-023 | ATGAATGCACGAAAAGTAAGTAATGGTAGAT ATAATAAAAATATTAAC | 5’ left arm ΔtcdE UK1 |
| MO-024 | AGATTATCAAAAAGGAGTTTCGTCTAAATTAG TTAGTATAGTTTTATAC | 3’ left arm ΔtcdE UK1 |
| MO-025 | GGATGGAAGGATTTAGAAGATG | 5’ ΔtcdE screening UK1 |
| MO-006 | CTTTATATATTTTTCCTATAACTTTTAAACTATC | 3’ ΔtcdE screening UK1 |
|
| ||
| pMC358 cloning | ||
| JP725 | CGTCAATGTATGGGTAGATATG | 5’ pMC358 linearization for cloning with Hifi DNA assembly |
| JP726 | CAACGTCGTGACTGGG | 3’ pMC358 linearization for cloning with Hifi DNA assembly |
| JP733 | CTATTACGCCAGCTGGC | 5’ pMC358-screening |
| JP734 | GGTAACCCCTAGCAAAGC | 3’ pMC358-screening |
| JP758 | ttttcccagtcacgacgttgGGTTTCTAGATTTCATAAA AGATAC | 5’ tcdR promoter |
| JP759 | tatctacccatacattgacgCTCTTATATTTATAATGAT GCTTTATTTG | 3’ tcdR promoter |
| JP760 | ttttcccagtcacgacgttgGTCTGTTTTTGAGGAAGAT ATTTG | 5’ tcdB promoter |
| JP761 | tatctacccatacattgacgCTTTACTATAATATTTTTA CATCTAAATGC | 3’ tcdB promoter |
| JP764 | tatctacccatacattgacgCTTTTTATTGGTAAATCTT CATATTAG | 5’ tcdA promoter |
| JP765 | ttttcccagtcacgacgttgCATGGTCAGTTGGTAAAAT C | 3’ tcdA promoter |
|
| ||
| qRT-PCR | ||
| RT_polIII-F_Cdiff | TCCATCTATTGCAGGGTGGT | 5' CD1305 |
| RT_polIII-R_Cdiff | CCCAACTCTTCGCTAAGCAC | 3' CD1305 |
| QRTBD013-tcdA | TAATAAAAATACTGCCCTCGACAAA | 5’ tcdA |
| QRTBD014-tcdA | ATAAATTGCATGTTGCTTCATAACT | 3’ tcdA |
| QRT_DL_TcdB_F (JRP4055) | ACCATATAGCTTTGTAGATAGTGAAGGAAA | 5’ tcdB |
| QRT_DL_TcdB_R (JRP4056) | AAGAACTACATCAGGTAATTCAGATACAAA | 3’ tcdB |
| QRTBD35-tcdR | AAATAACTCAGTAGATGATTT GCAAGAA | 5’ tcdR |
| QRTBD36-tcdR | GTTTCTCCCTCTTCATAATGTAAA CT C | 3’ tcdR |
Lowercase bases indicate overlapping sequences
Acknowledgments:
This work was funded by the Institut Pasteur and the “Integrative Biology of Emerging Infectious Diseases” (LabEX IBEID) funded in the framework of the French Government’s “Programme Investissements d’Avenir” to B.D, the ANR-20-CE15–0003 (Difficross) to J.P, and grants R01AI153605, R03AI174158, and P30DK34854 from the National Institute of Health in the United States, and a capital grant from the Massachusetts Life Science Center (MLSC) to LB.
Footnotes
Ethics declaration: All studies were conducted under an approved institutional IACUC protocol. Mice were singly housed for all studies and fed ad libitum autoclaved LabDiet 5021 Autoclavable Mouse Breeder Diet (PMI Nutrition International, St. Louis, MO).
References:
- 1.Rapisarda C. and Fronzes R.. Secretion Systems Used by Bacteria to Subvert Host Functions. Curr Issues Mol Biol, 2018. 25: p. 1–42 DOI: 10.21775/cimb.025.001. [DOI] [PubMed] [Google Scholar]
- 2.Natale P., et al. Sec- and Tat-mediated protein secretion across the bacterial cytoplasmic membrane--distinct translocases and mechanisms. Biochim Biophys Acta, 2008. 1778(9): p. 1735–56 DOI: 10.1016/j.bbamem.2007.07.015. [DOI] [PubMed] [Google Scholar]
- 3.Green E.R. and Mecsas J.. Bacterial Secretion Systems: An Overview. Microbiol Spectr, 2016. 4(1) DOI: 10.1128/microbiolspec.VMBF-0012-2015. [DOI] [PMC free article] [PubMed] [Google Scholar]
- 4.Di Bella S., et al. Clostridium difficile Toxins A and B: Insights into Pathogenic Properties and Extraintestinal Effects. Toxins (Basel), 2016. 8(5) DOI: 10.3390/toxins8050134. [DOI] [PMC free article] [PubMed] [Google Scholar]
- 5.Just I. and Gerhard R.. Large clostridial cytotoxins. Rev Physiol Biochem Pharmacol, 2004. 152: p. 23–47. [DOI] [PubMed] [Google Scholar]
- 6.Tan K.S., et al. Evidence for holin function of tcdE gene in the pathogenicity of Clostridium difficile. J Med Microbiol, 2001. 50(7): p. 613–9. [DOI] [PubMed] [Google Scholar]
- 7.Saadat A. and Melville S.B.. Holin-Dependent Secretion of the Large Clostridial Toxin TpeL by Clostridium perfringens. J Bacteriol, 2021. 203(8) DOI: 10.1128/JB.00580-20. [DOI] [PMC free article] [PubMed] [Google Scholar]
- 8.Govind R. and Dupuy B.. Secretion of Clostridium difficile Toxins A and B Requires the Holin-like Protein TcdE. PLoS Pathog, 2012. 8(6): p. e1002727. [DOI] [PMC free article] [PubMed] [Google Scholar]
- 9.Vidor C.J., et al. A Highly Specific Holin-Mediated Mechanism Facilitates the Secretion of Lethal Toxin TcsL in Paeniclostridium sordellii. Toxins (Basel), 2022. 14(2) DOI: 10.3390/toxins14020124. [DOI] [PMC free article] [PubMed] [Google Scholar]
- 10.Braun V., et al. Definition of the single integration site of the pathogenicity locus in Clostridium difficile. Gene, 1996. 181(1–2): p. 29–38 DOI: 10.1016/s0378-1119(96)00398-8. [DOI] [PubMed] [Google Scholar]
- 11.Mani N. and Dupuy B.. Regulation of toxin synthesis in Clostridium difficile by an alternative RNA polymerase sigma factor. Proc Natl Acad Sci U S A, 2001. 98(10): p. 5844–9. [DOI] [PMC free article] [PubMed] [Google Scholar]
- 12.Matamouros S., et al. Clostridium difficile toxin expression is inhibited by the novel regulator TcdC. Mol Microbiol, 2007. 64(5): p. 1274–88. [DOI] [PubMed] [Google Scholar]
- 13.Carter G.P., et al. The anti-sigma factor TcdC modulates hypervirulence in an epidemic BI/NAP1/027 clinical isolate of Clostridium difficile. PLoS Pathog, 2011. 7(10): p. e1002317. [DOI] [PMC free article] [PubMed] [Google Scholar]
- 14.Cartman S.T., et al. Precise manipulation of the Clostridium difficile chromosome reveals a lack of association between the tcdC genotype and toxin production. Appl Environ Microbiol, 2012. 78(13): p. 4683–90. [DOI] [PMC free article] [PubMed] [Google Scholar]
- 15.Oliveira Paiva A.M., et al. The C-Terminal Domain of Clostridioides difficile TcdC Is Exposed on the Bacterial Cell Surface. J Bacteriol, 2020. 202(22) DOI: 10.1128/JB.00771-19. [DOI] [PMC free article] [PubMed] [Google Scholar]
- 16.Govind R., et al. Observations on the Role of TcdE Isoforms in Clostridium difficile Toxin Secretion. J Bacteriol, 2015. 197(15): p. 2600–9 DOI: 10.1128/JB.00224-15. [DOI] [PMC free article] [PubMed] [Google Scholar]
- 17.Wang I.N., et al. Holins: the protein clocks of bacteriophage infections. Annu Rev Microbiol, 2000. 54: p. 799–825. [DOI] [PubMed] [Google Scholar]
- 18.Wydau-Dematteis S., et al. Cwp19 Is a Novel Lytic Transglycosylase Involved in Stationary-Phase Autolysis Resulting in Toxin Release in Clostridium difficile. MBio, 2018. 9(3) DOI: 10.1128/mBio.00648-18. [DOI] [PMC free article] [PubMed] [Google Scholar]
- 19.Girinathan B.P., et al. In vivo commensal control of Clostridioides difficile virulence. Cell Host Microbe, 2021. 29(11): p. 1693–1708 e7 DOI: 10.1016/j.chom.2021.09.007. [DOI] [PMC free article] [PubMed] [Google Scholar]
- 20.Hammond G.A. and Johnson J.L.. The toxigenic element of Clostridium difficile strain VPI 10463. Microb Pathog, 1995. 19(4): p. 203–13 DOI: 10.1016/s0882-4010(95)90263-5. [DOI] [PubMed] [Google Scholar]
- 21.Killgore G., et al. Comparison of seven techniques for typing international epidemic strains of Clostridium difficile: restriction endonuclease analysis, pulsed-field gel electrophoresis, PCR-ribotyping, multilocus sequence typing, multilocus variable-number tandem-repeat analysis, amplified fragment length polymorphism, and surface layer protein A gene sequence typing. J Clin Microbiol, 2008. 46(2): p. 431–7 DOI: 10.1128/JCM.01484-07. [DOI] [PMC free article] [PubMed] [Google Scholar]
- 22.Sun X., et al. Mouse relapse model of Clostridium difficile infection. Infect Immun, 2011. 79(7): p. 2856–64 DOI: 10.1128/IAI.01336-10. [DOI] [PMC free article] [PubMed] [Google Scholar]
- 23.Chen X., et al. A mouse model of Clostridium difficile-associated disease. Gastroenterology, 2008. 135(6): p. 1984–92 DOI: 10.1053/j.gastro.2008.09.002. [DOI] [PubMed] [Google Scholar]
- 24.Dupuy B. and Sonenshein A.L.. Regulated transcription of Clostridium difficile toxin genes. Mol Microbiol, 1998. 27(1): p. 107–20. [DOI] [PubMed] [Google Scholar]
- 25.Antunes A., et al. Global transcriptional control by glucose and carbon regulator CcpA in Clostridium difficile. Nucleic Acids Res, 2012. 40(21): p. 10701–18 DOI: 10.1093/nar/gks864. [DOI] [PMC free article] [PubMed] [Google Scholar]
- 26.Edwards A.N., et al. An alkaline phosphatase reporter for use in Clostridium difficile. Anaerobe, 2015. 32: p. 98–104 DOI: 10.1016/j.anaerobe.2015.01.002. [DOI] [PMC free article] [PubMed] [Google Scholar]
- 27.Carter G.P., et al. Binary toxin production in Clostridium difficile is regulated by CdtR, a LytTR family response regulator. J Bacteriol, 2007. 189(20): p. 7290–301 DOI: 10.1128/JB.00731-07. [DOI] [PMC free article] [PubMed] [Google Scholar]
- 28.Teufel F., et al. SignalP 6.0 predicts all five types of signal peptides using protein language models. Nat Biotechnol, 2022. 40(7): p. 1023–1025 DOI: 10.1038/s41587-021-01156-3. [DOI] [PMC free article] [PubMed] [Google Scholar]
- 29.Palmer T., et al. A holin/peptidoglycan hydrolase-dependent protein secretion system. Mol Microbiol, 2021. 115(3): p. 345–355 DOI: 10.1111/mmi.14599. [DOI] [PubMed] [Google Scholar]
- 30.Hamilton J.J., et al. A holin and an endopeptidase are essential for chitinolytic protein secretion in Serratia marcescens. J Cell Biol, 2014. 207(5): p. 615–26 DOI: 10.1083/jcb.201404127. [DOI] [PMC free article] [PubMed] [Google Scholar]
- 31.Geiger T., et al. Peptidoglycan editing by a specific LD-transpeptidase controls the muramidase-dependent secretion of typhoid toxin. Nat Microbiol, 2018. 3(11): p. 1243–1254 DOI: 10.1038/s41564-018-0248-x. [DOI] [PMC free article] [PubMed] [Google Scholar]
- 32.Bruser T. and Mehner-Breitfeld D.. Occurrence and potential mechanism of holin-mediated non-lytic protein translocation in bacteria. Microb Cell, 2022. 9(10): p. 159–173 DOI: 10.15698/mic2022.10.785. [DOI] [PMC free article] [PubMed] [Google Scholar]
- 33.Mehner-Breitfeld D., et al. Evidence for an Adaptation of a Phage-Derived Holin/Endolysin System to Toxin Transport in Clostridioides difficile. Front Microbiol, 2018. 9: p. 2446 DOI: 10.3389/fmicb.2018.02446. [DOI] [PMC free article] [PubMed] [Google Scholar]
- 34.Monot M., et al. Clostridium difficile: New Insights into the Evolution of the Pathogenicity Locus. Sci Rep, 2015. 5: p. 15023 DOI: 10.1038/srep15023. [DOI] [PMC free article] [PubMed] [Google Scholar]
- 35.Knight D.R., et al. Major genetic discontinuity and novel toxigenic species in Clostridioides difficile taxonomy. Elife, 2021. 10 DOI: 10.7554/eLife.64325. [DOI] [PMC free article] [PubMed] [Google Scholar]
- 36.Peltier J., et al. Type I toxin-antitoxin systems contribute to the maintenance of mobile genetic elements in Clostridioides difficile. Commun Biol, 2020. 3(1): p. 718 DOI: 10.1038/s42003-020-01448-5. [DOI] [PMC free article] [PubMed] [Google Scholar]
- 37.Livak K.J. and Schmittgen T.D.. Analysis of relative gene expression data using real-time quantitative PCR and the 2(-Delta Delta C(T)) Method. Methods, 2001. 25(4): p. 402–8 DOI: 10.1006/meth.2001.1262. [DOI] [PubMed] [Google Scholar]
- 38.Lavin R., et al. Gnotobiotic and Conventional Mouse Systems to Support Microbiota Based Studies. Curr Protoc Immunol, 2018. 121(1): p. e48 DOI: 10.1002/cpim.48. [DOI] [PMC free article] [PubMed] [Google Scholar]
- 39.Fekete S., et al. Body composition of mice of different body condition score and sex. Acta Vet Hung, 1996. 44(4): p. 399–410. [PubMed] [Google Scholar]
- 40.Bry L. and Brenner M.B.. Critical role of T cell-dependent serum antibody, but not the gut-associated lymphoid tissue, for surviving acute mucosal infection with Citrobacter rodentium, an attaching and effacing pathogen. J Immunol, 2004. 172(1): p. 433–41 DOI: 10.4049/jimmunol.172.1.433. [DOI] [PubMed] [Google Scholar]


