Abstract
Purpose
To explore the association between red cell distribution width (RDW)-to-platelet ratio (RPR) and in-hospital mortality of acute exacerbations of chronic obstructive pulmonary disease (AECOPD) patients and establish a prediction model based on RPR and other predictors.
Material and Methods
This cohort study included 1922 AECOPD patients aged ≥18 years in the Medical Information Mart for Intensive Care (MIMIC)-III and MIMIC-IV as well as 1738 AECOPD patients from eICU Collaborative Research Database (eICU-CRD). Possible confounding factors were screened out by univariate logistic regression, and multivariable logistic regression was applied to evaluate the association between RPR and in-hospital mortality of AECOPD patients. The area under the curve (AUC), calibration curve and decision curve analysis (DCA) curve were plotted to evaluate the predictive value of the model. The median follow-up time was 3.14 (1.87, 6.25) day.
Results
At the end of follow-up, there were 1660 patients survived and 262 subjects died. After adjusting for confounders, we found that Log (RPR×1000) was linked with elevated risk of in-hospital mortality of AECOPD patients [odds ratio (OR)=1.36, 95% confidence interval (CI): 1.01–1.84]. The prediction model was constructed using predictors including Log (RPR×1000), age, malignant cancer, atrial fibrillation, ventilation, renal failure, diastolic blood pressure (DBP), temperature, Glasgow Coma Scale (GCS) score, white blood cell (WBC), creatinine, blood urea nitrogen (BUN), hemoglobin, infectious diseases and anion gap. The AUC of the prediction model was 0.785 (95% CI: 0.751–0.820) in the training set, 0.721 (95% CI: 0.662–0.780) in the testing set, and 0.795 (95% CI: 0.762–0.827) in the validation set.
Conclusion
RPR was associated with the in-hospital mortality of AECOPD patients. The prediction model for the in-hospital mortality of AECOPD patients based on RPR and other predictors presented good predictive performance, which might help the clinicians to quickly identify AECOPD patients at high risk of in-hospital mortality.
Keywords: red cell distribution width-to-platelet ratio, acute exacerbations of chronic obstructive pulmonary disease, red cell distribution width, platelet ratio
Introduction
Chronic obstructive pulmonary disease (COPD) is a common chronic airway inflammatory disease characterized by persistent respiratory symptoms and airflow limitation.1 Acute exacerbation of COPD (AECOPD) is a condition with worsening of COPD symptoms characterized by a change in the patient’s baseline dyspnea, cough or sputum, or both, beyond day-to-day variability sufficient to warrant a change in management.2 AECOPD increases the frequency of further severe exacerbations, reduces health status, speeds the decline of lung function, and leads to deterioration of comorbidities.3 AECOPD has a negative influence on the prognosis of patients with COPD, which is the main cause of hospitalization in COPD patients and increases the mortality in patients with COPD.4,5 Identifying more reliable biomarkers associated with the mortality of AECOPD was essential for the management of this disease.
AECOPD is associated with increased airway and systemic inflammatory responses.6 Red blood cell distribution width (RDW) is an indicator for the range of red blood cell (RBC) size and volume, and higher RDW indicates greater the RBC heterogeneity.7 RDW was reported to be involved in oxidative stress, endothelial disorders, inflammation and other mechanisms, and is associated with poor prognosis of AECOPD patients.8,9 More and more evidence showed that platelets play a significant regulatory role in inflammation and immune-mediated pathways.10 Currently, RDW-to-platelet ratio (RPR) is a novel marker reflecting inflammation, which has been found to be associated with the prognosis of inflammation-related diseases such as cerebral hemorrhage and acute myocardial infarction.11,12 Whether RPR is associated with poor prognosis of AECOPD patients and the prognostic value of RPR for the mortality of AECOPD patients were not reported.
In the present study, the association between RPR and the in-hospital mortality of AECOPD patients was explored based on the data from the Medical Information Mart for Intensive Care (MIMIC)-III and MIMIC-IV database. The data from eICU Collaborative Research Database (eICU-CRD) were extracted to verify the findings of our study. Additionally, a prediction model for the in-hospital mortality of AECOPD was established based on RPR.
Methods
Study Design and Population
This cohort study included 2045 AECOPD patients aged ≥18 years in MIMIC-III and MIMIC-IV. The MIMIC database was developed and is maintained by the Laboratory for Computational Physiology at the Massachusetts Institute of Technology (Cambridge, MA, USA). MIMIC-III included data from the patients in the intensive care unit (ICU) and contained physiologic information from bedside monitors in the ICUs of Beth Israel Deaconess Medical Center, a tertiary-care university hospital in Boston (MA, USA). The database includes information from 2002 to 2011.13 MIMIC-IV is the latest version, which contains data from 2008 to 2019.14 The eICU-CRD is a publicly accessible multicenter database, including deidentified data (demographics, vital sign measurements, diagnosis information, and treatment details) of more than 200,000 admissions to ICUs at 208 hospitals across the United States between 2014 and 2015.15 In our study, AECOPD was diagnosed at ICU admission within 24 hours based on the International Classification of Diseases (ICD) codes: 49121, and J441 in MIMIC-III and MIMIC-IV databases. Those who had incomplete data on blood urea nitrogen (BUN), red cell distribution width (RDW), platelet, Glasgow Coma Scale (GCS) score, systolic blood pressure (SBP) or diastolic blood pressure (DBP) or respiratory rate were excluded. Finally, 1922 participants were included. Additionally, 1738 participants from eICU-CRD were included as to verify the results. AECOPD was also diagnosed at ICU admission within 24 hours according to ICD codes: 49121, and J441 in eICU-CRD. The project was approved by the Institutional Review Boards of Beth Israel Deaconess Medical Center (Boston, MA) (2001-P-001699/14) and the Massachusetts Institute of Technology (Cambridge, MA) (No.0403000206).16 Requirement for individual patient consent was waived by the Institutional Review Boards of Beth Israel Deaconess Medical Center and the Massachusetts Institute of Technology because the project did not impact clinical care and all protected health information was deidentified. As the patient data were not from Shanghai Xuhui Central Hospital, Zhongshan-Xuhui Hospital, Fudan University, the requirement of ethical approval for this was waived by the Institutional Review Board of Shanghai Xuhui Central Hospital, Zhongshan-Xuhui Hospital, Fudan University. The need for written informed consent was waived by the Institutional Review Board of Shanghai Xuhui Central Hospital, Zhongshan-Xuhui Hospital, Fudan University due to retrospective nature of the study. All the data accessed in this study were in accordance with relevant USA data protection and privacy regulations.
Potential Confounding Factors
Gender, age (year), ventilation (yes or no), congestive heart failure (yes or no), atrial fibrillation (yes or no), renal failure (yes or no), malignant cancer (yes or no), heart rate (beat/min), SBP (mmHg), DBP (mmHg), temperature (°C), oxygen saturation (SPO2, %), respiratory rate (beat/min), white blood cell (WBC), hemoglobin (g/dL), creatinine (mg/dL), BUN (mg/dL), glucose (mg/dL), GCS score, steroid therapy, infectious diseases, and anion gap were potential confounding factors analyzed in our study.
Main and Outcome Variables
RPR was the main variable in this study. RPR was defined as RDW-to-platelet ratio (RDW/platelet count). RDW and platelet level were evaluated within 24 h after the first time ICU admission. In the present study, RDW/platelet was non-normally distributed, and Log (RDW/platelet×1000) was analyzed.
In-hospital survival or mortality were considered as outcomes. The median follow-up time was 3.14 (1.87, 6.25) day.
Statistical Analysis
The continuous variables of normal distribution were represented by Mean±standard deviation (SD) and the t-test was used to compare differences. The continuous data of non-normal distribution were displayed by M (Q1, Q3) and the Wilcoxon rank sum test were applied for different comparisons between groups. The categorical data were shown by n (%), and the chi-square test was used for comparing differences between groups. All the data from MIMIC-III and MIMIC-IV were randomly divided into the training set and testing set at a ratio of 7:3, and the data from eICU-CRD were used as a validation set. Possible confounding factors were screened out by univariate logistic regression, and multivariable logistic regression was applied to evaluate the association between RPR and in-hospital mortality of AECOPD patients. Model 1 was the unadjusted univariate model, Model 2 was the multivariable model adjusted for age, malignant cancer, atrial fibrillation, ventilation, renal failure, DBP, temperature, GCS, WBC, hemoglobin, creatinine, BUN, infectious diseases and anion gap. The prediction model for in-hospital mortality of AECOPD patients was constructed based on RPR, age, malignant cancer, atrial fibrillation, ventilation, renal failure, DBP, temperature, GCS, WBC, creatinine, BUN, hemoglobin, infectious diseases and anion gap in the training set, and verified in the testing set and the validation set. DeLong test was employed to compare the predictive values of the models. Odds ratio [95% confidence interval (CI)] was applied to evaluate the association between RPR and the in-hospital mortality of AECOPD patients. The area under the curve (AUC), calibration curve and decision curve analysis (DCA) curve were plotted. Alpha was set as 0.05 and SAS 9.4 (SAS Institute Inc., Cary, NC, USA) were used for data analysis.
Results
Comparisons of the Baseline Characteristics of AECOPD Patients Between Training Set and Testing Set
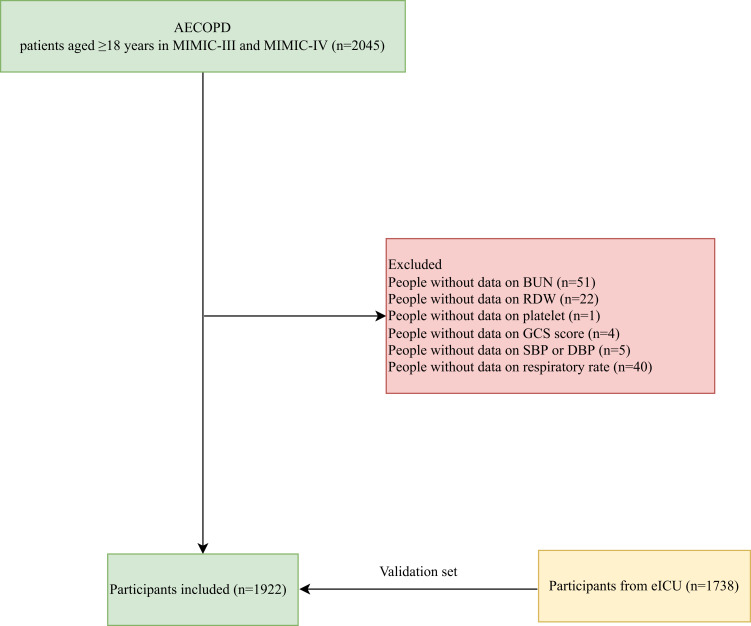
In total, 2045 AECOPD patients aged ≥18 years were identified in MIMIC-III and MIMIC-IV. Among them, people with incomplete data on BUN (n=51), RDW (n=22), platelet (n=1), GCS score (n=4), SBP or DBP (n=5) or respiratory rate (n=40) were excluded. Finally, 1922 participants were included. The data of 1738 participants from eICU-CRD were extracted as a validation set, and the flow chart of the screen process of participants is shown in Figure 1.
Figure 1.
The screen process of the participants in our study.
There were 979 females, accounting for 50.94%. The mean age of all participants was 71.16 years. The percentage of patients receiving ventilation was 82.36%. The mean RDW was 15.33%. The median platelet was 219.00 K/uL. The median RPR of all subjects was 0.07. The sequential organ failure assessment (SOFA) score of all subjects was 4.00. The Confusion, Urea, Respiratory Rate, Blood Pressure and Age (CURB-65) score was 3.00. The median length of stay (LOS) of all people was 3.14 days. At the end of follow-up, there were 1660 patients survived, which accounted for 86.37%, and 262 subjects died, accounting for 13.63%. All the data were divided into the training set and testing set at a ratio of 7:3, and no significant difference was found in the baseline characteristics of AECOPD patients between training set and testing set (Table 1).
Table 1.
Comparisons of Characteristics of Participants in the Training Set and Testing Set
| Variables | Total (n=1922) | Testing (n=576) | Training (n=1346) | Statistics | P |
|---|---|---|---|---|---|
| Gender, n (%) | χ2=3.813 | 0.051 | |||
| Female | 979 (50.94) | 313 (54.34) | 666 (49.48) | ||
| Male | 943 (49.06) | 263 (45.66) | 680 (50.52) | ||
| Age, Year, Mean ± SD | 71.16 ± 10.87 | 70.95 ± 11.07 | 71.26 ± 10.79 | t=−0.57 | 0.569 |
| Ventilation, n (%) | χ2=0.220 | 0.639 | |||
| No | 339 (17.64) | 98 (17.01) | 241 (17.90) | ||
| Yes | 1583 (82.36) | 478 (82.99) | 1105 (82.10) | ||
| Congestive heart failure, n (%) | χ2=2.985 | 0.084 | |||
| No | 870 (45.27) | 278 (48.26) | 592 (43.98) | ||
| Yes | 1052 (54.73) | 298 (51.74) | 754 (56.02) | ||
| Atrial fibrillation, n (%) | χ2=0.453 | 0.501 | |||
| No | 1270 (66.08) | 387 (67.19) | 883 (65.60) | ||
| Yes | 652 (33.92) | 189 (32.81) | 463 (34.40) | ||
| Renal failure, n (%) | χ2=2.241 | 0.134 | |||
| No | 1629 (84.76) | 499 (86.63) | 1130 (83.95) | ||
| Yes | 293 (15.24) | 77 (13.37) | 216 (16.05) | ||
| Malignant cancer, n (%) | χ2=0.169 | 0.681 | |||
| No | 1648 (85.74) | 491 (85.24) | 1157 (85.96) | ||
| Yes | 274 (14.26) | 85 (14.76) | 189 (14.04) | ||
| Heart rate, beat/min, Mean ± SD | 93.95 ± 19.41 | 94.14 ± 18.71 | 93.87 ± 19.71 | t=0.27 | 0.783 |
| SBP, mmHg, Mean ± SD | 126.35 ± 24.76 | 126.85 ± 24.56 | 126.13 ± 24.85 | t=0.58 | 0.562 |
| DBP, mmHg, Mean ± SD | 68.09 ± 18.28 | 68.65 ± 18.26 | 67.85 ± 18.29 | t=0.88 | 0.380 |
| Temperature, °C, Mean ± SD | 36.67 ± 0.73 | 36.68 ± 0.75 | 36.67 ± 0.72 | t=0.07 | 0.947 |
| SPO2, %, Mean ± SD | 95.59 ± 4.88 | 95.57 ± 4.58 | 95.60 ± 5.01 | t=−0.10 | 0.920 |
| Respiratory rate, beat/min, Mean ± SD | 21.48 ± 6.20 | 21.63 ± 6.20 | 21.41 ± 6.21 | t=0.72 | 0.469 |
| SOFA score, M (Q1, Q3) | 4.00 (2.00, 7.00) | 4.00 (2.00, 7.00) | 4.00 (2.00, 7.00) | Z=−1.559 | 0.119 |
| GCS score, n (%) | χ2=0.003 | 0.959 | |||
| <13 | 469 (24.40) | 141 (24.48) | 328 (24.37) | ||
| ≥13 | 1453 (75.60) | 435 (75.52) | 1018 (75.63) | ||
| CURB-65, M (Q1, Q3) | 3.00 (2.00, 3.00) | 2.00 (2.00, 3.00) | 3.00 (2.00, 3.00) | Z=−0.538 | 0.590 |
| WBC, K/uL, M (Q1, Q3) | 10.60 (7.60, 14.90) | 10.55 (7.40, 14.60) | 10.60 (7.60, 15.00) | Z=−0.918 | 0.359 |
| Platelet, K/uL, M (Q1, Q3) | 219.00 (163.00, 285.00) | 214.00 (159.00, 287.00) | 220.00 (163.00, 282.00) | Z=−0.640 | 0.522 |
| Hemoglobin, g/dL, Mean ± SD | 10.97 ± 2.13 | 11.04 ± 2.08 | 10.95 ± 2.15 | t=0.87 | 0.383 |
| RDW, %, Mean ± SD | 15.33 ± 2.09 | 15.32 ± 2.09 | 15.34 ± 2.10 | t=−0.23 | 0.816 |
| Creatinine, mg/dL, M (Q1, Q3) | 1.00 (0.70, 1.50) | 1.00 (0.70, 1.50) | 1.00 (0.70, 1.50) | Z=−1.541 | 0.123 |
| BUN, mg/dL, M (Q1, Q3) | 24.00 (17.00, 37.00) | 23.00 (17.00, 35.00) | 24.00 (17.00, 37.00) | Z=−0.444 | 0.657 |
| Glucose, mg/dL, M (Q1, Q3) | 142.00 (114.00, 180.00) | 142.50 (114.00, 176.50) | 141.00 (115.00, 180.00) | Z=−0.003 | 0.997 |
| Anion gap, Mean ± SD | 216.97 ± 13.64 | 216.76 ± 13.43 | 217.05 ± 13.74 | t=−0.43 | 0.670 |
| Steroid therapy, n (%) | χ2=0.269 | 0.604 | |||
| No | 1463 (76.12) | 434 (75.35) | 1029 (76.45) | ||
| Yes | 459 (23.88) | 142 (24.65) | 317 (23.55) | ||
| Infectious diseases, n (%) | χ2=0.868 | 0.351 | |||
| No | 1482 (77.11) | 452 (78.47) | 1030 (76.52) | ||
| Yes | 440 (22.89) | 124 (21.53) | 316 (23.48) | ||
| RPR, M (Q1, Q3) | 0.07 (0.05, 0.09) | 0.07 (0.05, 0.10) | 0.07 (0.05, 0.09) | Z=0.745 | 0.457 |
| Log (RPR×1000), Mean ± SD | 4.29 ± 0.53 | 4.29 ± 0.51 | 4.28 ± 0.55 | t=0.27 | 0.787 |
| LOS, day, M (Q1, Q3) | 3.14 (1.87, 6.25) | 3.23 (1.95, 6.18) | 3.13 (1.82, 6.31) | Z=0.711 | 0.477 |
| Outcome, n (%) | χ2=0.049 | 0.826 | |||
| Alive | 1660 (86.37) | 499 (86.63) | 1161 (86.26) | ||
| Dead | 262 (13.63) | 77 (13.37) | 185 (13.74) |
Abbreviations: SD, standard deviation; M, median; Q1, 1st Quartile; Q3, 3st Quartile; SBP, systolic blood pressure; DBP, diastolic blood pressure; SPO2, oxygen saturation; SOFA, the sequential organ failure assessment; CURB-65, the Confusion; Urea; Respiratory Rate; Blood Pressure and Age; GCS, Glasgow Coma Scale; WBC, white blood cell; RDW, red blood cell distribution width; BUN, blood urea nitrogen; RPR, RDW to platelet ratio; LOS, length of stay.
Potential Confounding Factors for In-Hospital Mortality of AECOPD Patients
The potential confounding factors were identified in the training set. As presented in Table 2, age (OR=1.06, 95% CI: 1.04–1.08), ventilation (OR=1.94, 95% CI: 1.19–3.16), atrial fibrillation (OR=2.59, 95% CI: 1.89–3.54), renal failure (OR=1.60, 95% CI: 1.09–2.35), malignant cancer (OR=2.11, 95% CI: 1.44–3.09), DBP (OR=0.98, 95% CI: 0.98–0.99), temperature (OR=0.67, 95% CI: 0.54–0.83), GCS≥13 (OR=0.30, 95% CI: 0.22–0.42), WBC (OR=1.03, 95% CI: 1.01–1.05), hemoglobin (OR=0.88, 95% CI: 0.81–0.95), creatinine (OR=1.14, 95% CI: 1.02–1.27), BUN (OR=1.02, 95% CI: 1.01–1.03), anion gap (OR=1.02, 95% CI: 1.01–1.03) and infectious diseases (OR=1.75, 95% CI: 1.25–2.45) were confounding factors for in-hospital mortality of AECOPD patients.
Table 2.
Potential Confounding Factors for in-Hospital Mortality of AECOPD Patients
| Variables | β | S. E | Wald | OR (95% CI) | P |
|---|---|---|---|---|---|
| Gender | |||||
| Female | Ref | ||||
| Male | −0.137 | 0.158 | 0.747 | 0.87 (0.64–1.19) | 0.387 |
| Age, Year | 0.056 | 0.008 | 45.320 | 1.06 (1.04–1.08) | <0.001 |
| Ventilation | |||||
| No | Ref | ||||
| Yes | 0.662 | 0.248 | 7.119 | 1.94 (1.19–3.16) | 0.008 |
| Congestive heart failure | |||||
| No | Ref | ||||
| Yes | 0.268 | 0.162 | 2.723 | 1.31 (0.95–1.80) | 0.099 |
| Atrial fibrillation | |||||
| No | Ref | ||||
| Yes | 0.950 | 0.161 | 35.035 | 2.59 (1.89–3.54) | <0.001 |
| Renal failure | |||||
| No | Ref | ||||
| Yes | 0.473 | 0.195 | 5.869 | 1.60 (1.09–2.35) | 0.015 |
| Malignant cancer | |||||
| No | Ref | ||||
| Yes | 0.744 | 0.195 | 14.532 | 2.11 (1.44–3.09) | <0.001 |
| Heart rate, bpm | 0.004 | 0.004 | 0.793 | 1.00 (1.00–1.01) | 0.373 |
| Systolic blood pressure | −0.006 | 0.003 | 2.818 | 0.99 (0.99–1.00) | 0.093 |
| Diastolic blood pressure | −0.015 | 0.005 | 10.677 | 0.98 (0.98–0.99) | 0.001 |
| Temperature | −0.400 | 0.110 | 13.129 | 0.67 (0.54–0.83) | <0.001 |
| SPO2 | −0.018 | 0.014 | 1.741 | 0.98 (0.96–1.01) | 0.187 |
| Respiratory rate | 0.022 | 0.012 | 3.099 | 1.02 (1.00–1.05) | 0.078 |
| GCS score | |||||
| <13 | Ref | ||||
| ≥13 | −1.194 | 0.164 | 52.867 | 0.30 (0.22–0.42) | <0.001 |
| WBC | 0.033 | 0.010 | 11.124 | 1.03 (1.01–1.05) | <0.001 |
| Hemoglobin | −0.131 | 0.038 | 11.607 | 0.88 (0.81–0.95) | <0.001 |
| Creatinine | 0.130 | 0.055 | 5.635 | 1.14 (1.02–1.27) | 0.018 |
| BUN | 0.021 | 0.003 | 38.527 | 1.02 (1.01–1.03) | <0.001 |
| Glucose | −0.001 | 0.001 | 1.029 | 1.00 (1.00–1.00) | 0.310 |
| Anion gap | 0.017 | 0.006 | 8.380 | 1.02 (1.01–1.03) | 0.004 |
| Steroid therapy | |||||
| No | Ref | ||||
| Yes | −0.358 | 0.202 | 3.156 | 0.70 (0.47–1.04) | 0.076 |
| Infectious diseases | |||||
| No | Ref | ||||
| Yes | 0.558 | 0.172 | 10.575 | 1.75 (1.25–2.45) | 0.001 |
Abbreviations: Ref, reference; OR, odds ratio; CI, confidence interval; SPO2, oxygen saturation; GCS, Glasgow Coma Scale; WBC, white blood cell; BUN, blood urea nitrogen.
The Association Between Log (RPR×1000) and the In-Hospital Mortality of AECOPD Patients
The results of Table 3 delineated that in the unadjusted univariate model, Log (RPR×1000) might be associated with increased risk of in-hospital mortality of AECOPD patients (OR=1.54, 95% CI: 1.18–1.99). After adjusting for age, malignant cancer, atrial fibrillation, ventilation, renal failure, DBP, temperature, GCS, WBC, creatinine, BUN, hemoglobin, infectious diseases and anion gap, we found that Log (RPR×1000) was linked with elevated risk of in-hospital mortality of AECOPD patients (OR=1.36, 95% CI: 1.01–1.84).
Table 3.
The Association Between Log (RPR×1000) and the in-Hospital Mortality of AECOPD Patients
| Variable | Model 1 | Model 2 | ||
|---|---|---|---|---|
| OR (95% CI) | P | OR (95% CI) | P | |
| Log (RPR×1000) | 1.54 (1.18–1.99) | 0.001 | 1.36 (1.01–1.84) | 0.042 |
Notes: Model 1: the unadjusted univariate logistic model. Model 2: Multivariable logistic model adjusted for age, ventilation, atrial fibrillation, renal failure, malignant cancer, DBP, temperature, GCS score, WBC, hemoglobin, creatinine, BUN, anion gap, and infectious diseases.
Abbreviations: Ref, reference; OR, odds ratio; CI, confidence interval; RPR, RDW to platelet ratio.
Construction of the Prediction Model for the In-Hospital Mortality of AECOPD Patients
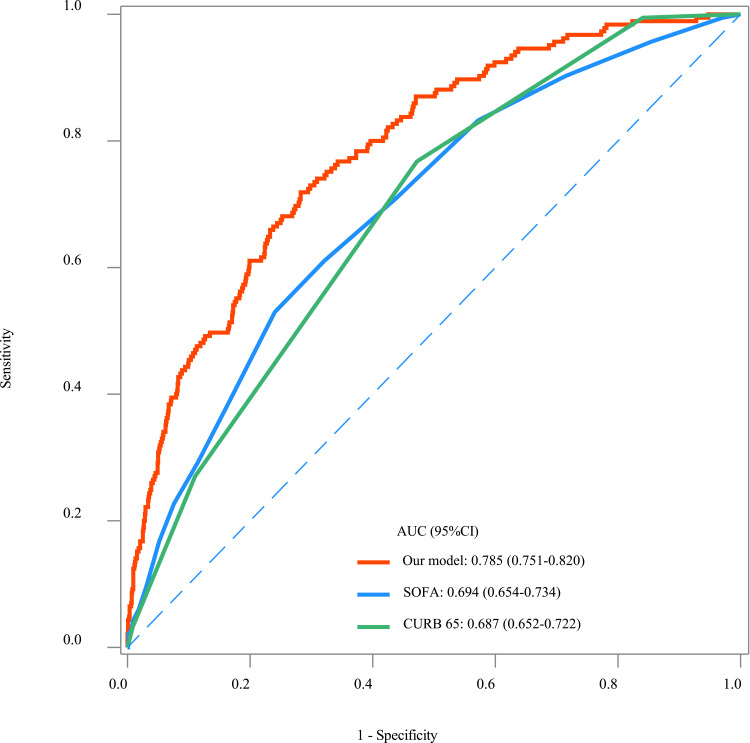
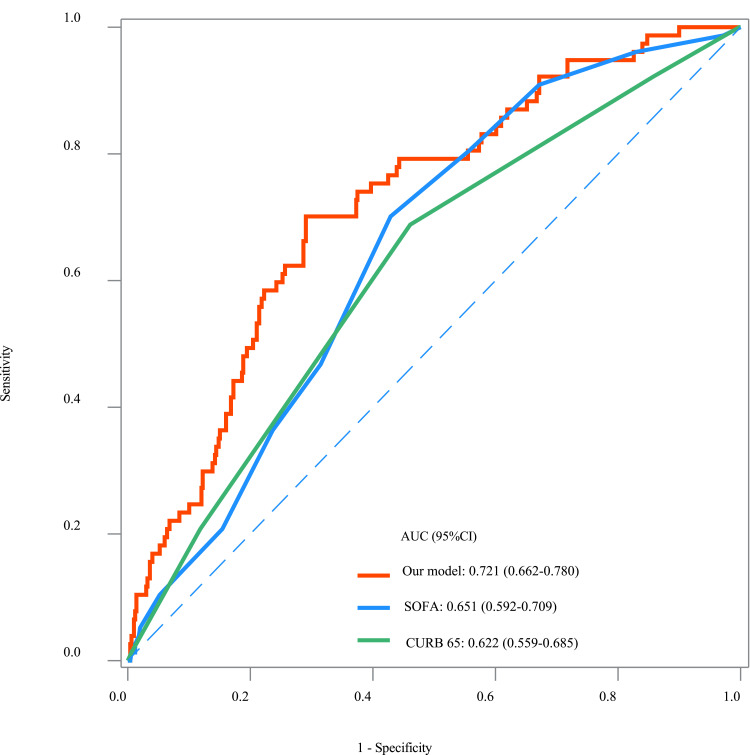
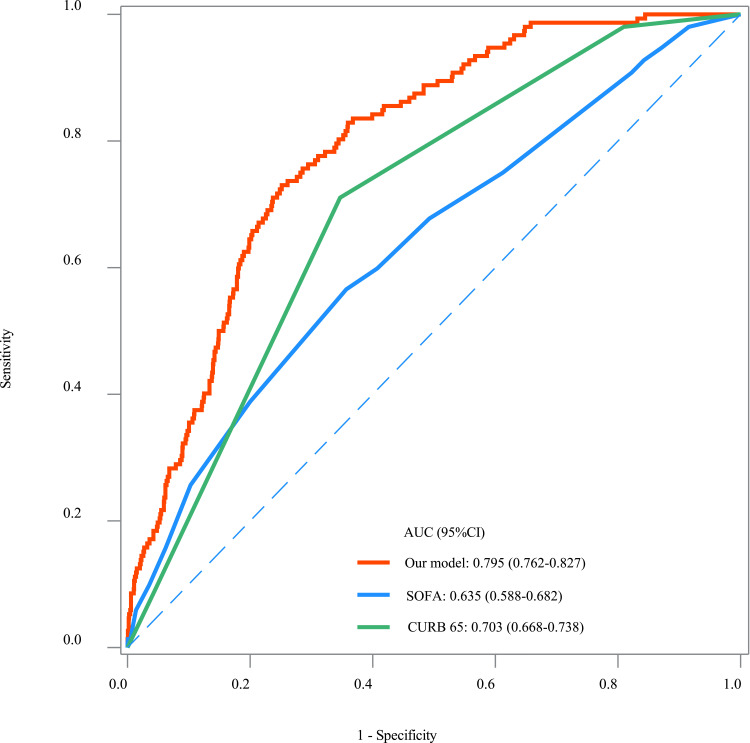
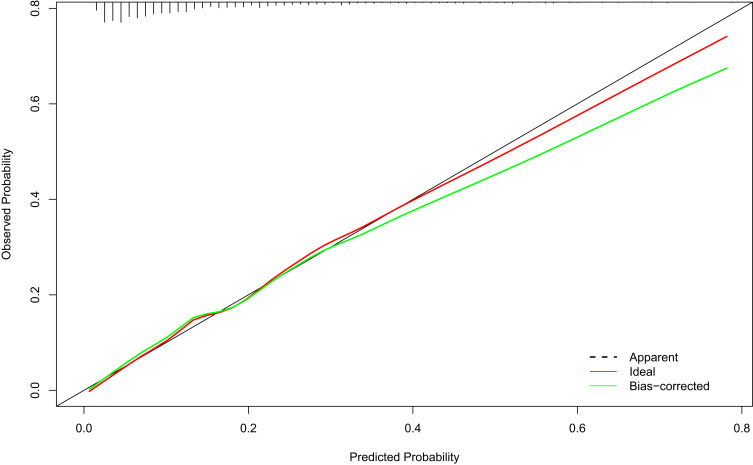
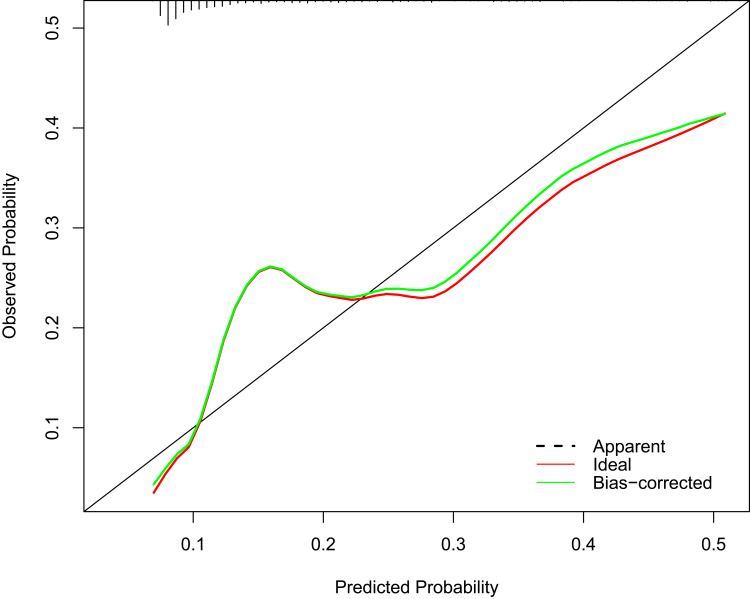
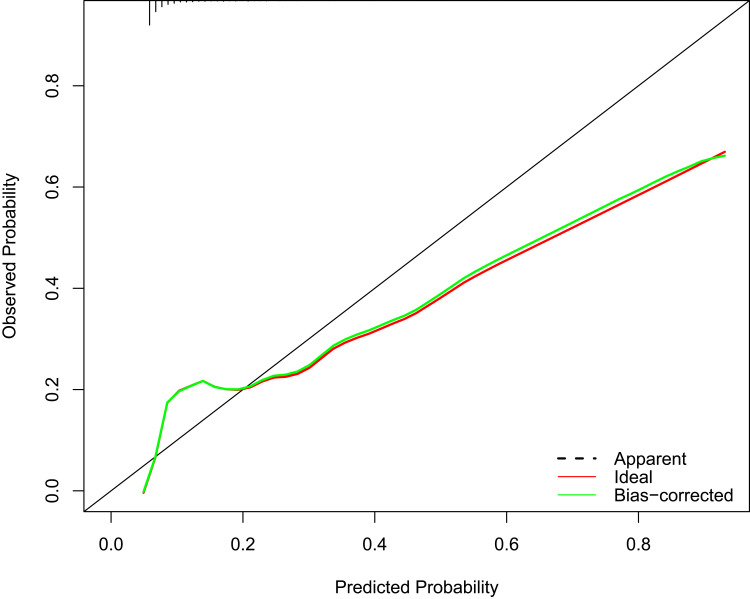
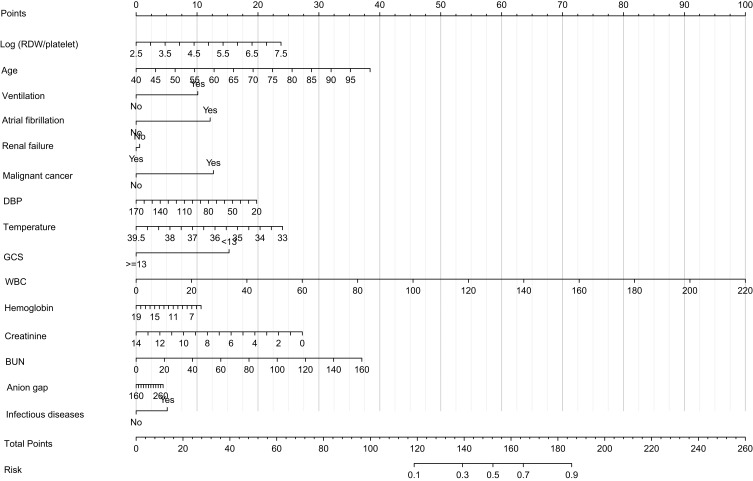
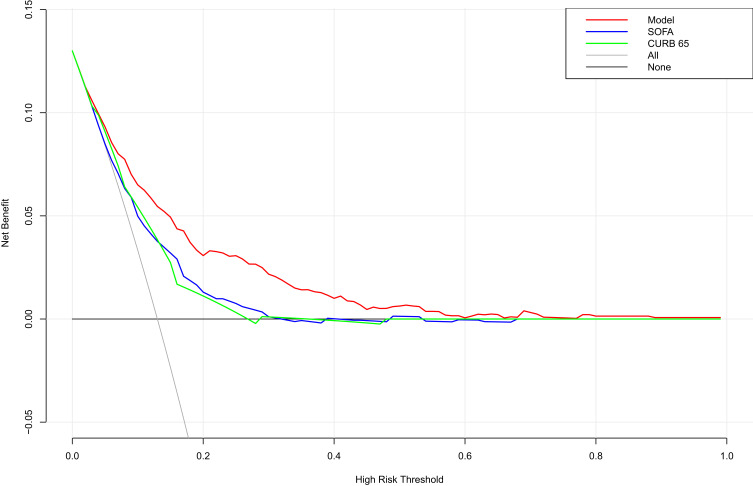
The prediction model was constructed using predictors including Log (RPR×1000), age, malignant cancer, atrial fibrillation, ventilation, renal failure, DBP, temperature, GCS, WBC, creatinine, BUN, hemoglobin, infectious diseases and anion gap. The goodness of fit in the training set was χ2=3.808 (P=0.874), goodness of fit in the testing set was χ2=5.431 (P=0.711), and goodness of fit in the validation set was χ2=5.897 (P=0.659). The AUC of the model was 0.785 (95% CI: 0.751–0.820) in the training set (Figure 2), 0.721 (95% CI: 0.662–0.780) in the testing set (Figure 3), and 0.795 (95% CI: 0.762–0.827) in the validation set (Figure 4). The results of DeLong tests depicted that the AUC of our prediction model was higher than SOFA score [training set: 0.694 (95% CI: 0.655–0.734), testing set: 0.651 (95% CI: 0.592–0.790) and validation set: 0.635 (95% CI: 0. 0.588–0. 0.683)] and CURB-65 [training set: 0.687 (95% CI: 0.652–0.722), testing set: 0.622 (95% CI: 0.560–0.685) and validation set: 0.703 (95% CI: 0.668–0.738)] (Table 4). The calibration curves of the model in the training set, testing set, and validation set revealed the predicted probability of our model was close to the ideal model (Figures 5–7), indicating the model was well calibrated. The nomogram of the model in the training set was plotted (Figure 8). The DCA curve of the model suggested the model had higher net benefit than SOFA score, and CURB-65 (Figure 9).
Figure 2.
The ROC curves of our prediction model, SOFA score, and CURB-65 in the training set.
Figure 3.
The ROC curves of our prediction model, SOFA score, and CURB-65 in the testing set.
Figure 4.
The ROC curves of our prediction model, SOFA score, and CURB-65 in the validation set.
Table 4.
The Predictive Performance of Different Models
| Model | AUC (95% CI) | ||
|---|---|---|---|
| Training Set | Testing Set | Validation Set | |
| Our model | 0.785 (0.751–0.820) | 0.721 (0.662–0.780) | 0.795 (0.762–0.827) |
| SOFA | 0.694 (0.655–0.734) * | 0.651 (0.592–0.790) * | 0.635 (0.588–0.683) * |
| CURB-65 | 0.687 (0.652–0.722) * | 0.622 (0.560–0.685) * | 0.703 (0.668–0.738) * |
Note: *Statistically different compared with our model.
Abbreviations: AUC, area under the curve; SOFA, the sequential organ failure assessment; CURB-65, the Confusion, Urea, Respiratory Rate, Blood Pressure and Age.
Figure 5.
The calibration curves of the prediction model in the training set.
Figure 6.
The calibration curves of the prediction model in the testing set.
Figure 7.
The calibration curves of the prediction model in the validation set.
Figure 8.
The nomogram of the prediction model.
Figure 9.
The DCA curve of our prediction model, SOFA score, and CURB-65.
Discussion
In this study, the association between RPR and the in-hospital mortality of AECOPD was evaluated. The results revealed that RPR was associated with the in-hospital mortality of AECOPD patients. In addition, a prediction model for the in-hospital mortality of AECOPD patients was established based on RPR and other predictors. The model showed an AUC of 0.785 in the training set, 0.721 in the testing set and 0.795 in the validation set. These findings suggested that RPR was associated with the in-hospital mortality of AECOPD patients, and the prediction model for the in-hospital mortality of AECOPD patients based on RPR and other predictors had good predictive value. The results of our study might offer a tool to quickly identify those with high risk of death, and reminded the clinicians to provide appropriate interventions to those patients.
RDW is a routine blood test that quantitatively reflects the volume difference in peripheral blood red cells. Infection, anemia, nutritional deficiency, and other factors can lead to an increase in RDW.17 In previous studies, there was evidence indicating that RDW was an important predictor for the prognosis of AECOPD patients. He et al showed that patients with RDW >12.75% were associated with poor prognosis.18 Another study found RDW ≥13.75% was an independent risk factor for 1-year mortality of AECOPD patients.8 Elevated RDW was also observed to be an independent predictor for prolonged hospitalization in AECOPD patients.19 High RDW suggests an underlying chronic inflammatory response in the body and inflammatory response is a vital pathogenesis in COPD, which is closely associated with disease severity and patient prognosis.20 AECOPD can enhance the systemic inflammatory response and promote the release of inflammatory cells and inflammatory mediators.21 RDW was associated with the prognosis in patients with AECOPD, which may be owing to the combined effects of high oxidative stress, severe inflammatory response, and activation of the neuroendocrine system. Platelet count is a routinely measured index in clinic, which remains within a relatively narrow range among healthy individuals but can be significantly altered in the setting of both acute and chronic disease.22 Platelet count was reported to be associated with all-cause mortality in stable COPD.23 A systematic review and meta-analysis involving 5 studies with 11,117 COPD patients also found that antiplatelet treatment might reduce the all-cause mortality in COPD patients.24 Increasing evidence suggests that platelets play modulatory effects on inflammatory- and immune-mediated pathways.25 The alteration of platelet activity might act as an important pathophysiological part in several acute and chronic disease states.26 In the present study, the RPR was identified to be associated with the risk of in-hospital mortality of AECOPD patients.
The current study firstly measured the association between RPR in-hospital mortality of AECOPD patients, and then constructed a prediction model for in-hospital mortality of AECOPD patients based on RPR, age, malignant cancer, atrial fibrillation, ventilation, renal failure, DBP, temperature, GCS, WBC, creatinine, BUN, hemoglobin, infectious diseases and anion gap. Previously, SOFA score and CURB-65 were applied for predicting the inpatient mortality in AECOPD patients.26 SOFA score was based on six different scores and one for each of the respiratory, cardiovascular, hepatic, coagulation, renal and neurological systems, and each scored from 0 to 4 with an increasing score reflecting worsening organ dysfunction.27 CURB-65 is a simple prediction model widely applied for patients with community-acquired pneumonia, and this model has been validated internally and externally.28 In our study, the prediction model presented better predictive performance for in-hospital mortality of AECOPD patients than SOFA score and CURB-65. The findings in this study indicated the importance of timely detection of RDW and platelet count in AECOPD patients. The prediction model in our study might help the clinicians to find out those who at high risk of in-hospital mortality, and offer timely interventions for improving their prognosis.
The present study had several limitations. Firstly, this was a retrospective study using data, which might have certain recall bias. Secondly, all the data were from the US population, and extension to other population still needs to be further verified. Thirdly, due to the limitations of MIMIC database, some inflammatory markers such as procalcitonin, CRP and interleukin 6 were not recorded, so comparisons of RDW with these biomarkers could not be conducted. In the future, more well-designed studies and data from our own facility were needed to validate the findings of our study.
Conclusions
The present study evaluated the association between RPR and the in-hospital mortality of AECOPD, which showed that RPR was associated with the in-hospital mortality of AECOPD patients. The prediction model for the in-hospital mortality of AECOPD patients based on RPR and other predictors presented good predictive performance, which might help the clinicians to quickly identify AECOPD patients at high risk of in-hospital mortality, and provide early interventions to improve their prognosis.
Acknowledgments
This Study was supported by the project of basic frontier research of the Science and Technology Bureau of Wuhan (No.2022020801020581), the Medical Research Project of Xuhui District, Shanghai (SHXH202006), and the Special Clinical Research Project of Shanghai Municipal Health Commission (202140473).
Disclosure
The authors report no conflicts of interest in this work.
References
- 1.Ritchie AI, Wedzicha JA. Definition, causes, pathogenesis, and consequences of chronic obstructive pulmonary disease exacerbations. Clin Chest Med. 2020;41(3):421–438. doi: 10.1016/j.ccm.2020.06.007 [DOI] [PMC free article] [PubMed] [Google Scholar]
- 2.Zhang D, Zhang H, Li X, et al. Pulmonary rehabilitation programmes within three days of hospitalization for acute exacerbation of chronic obstructive pulmonary disease: a systematic review and meta-analysis. Int J Chron Obstruct Pulmon Dis. 2021;16:3525–3538. doi: 10.2147/COPD.S338074 [DOI] [PMC free article] [PubMed] [Google Scholar]
- 3.Messous S, Trabelsi I, Bel Haj Ali K, et al. Two-day versus seven-day course of levofloxacin in acute COPD exacerbation: a randomized controlled trial. Ther Adv Respir Dis. 2022;16:17534666221099729. doi: 10.1177/17534666221099729 [DOI] [PMC free article] [PubMed] [Google Scholar]
- 4.Vogelmeier CF, Criner GJ, Martinez FJ, et al. Global strategy for the diagnosis, management, and prevention of chronic obstructive lung disease 2017 report. GOLD executive summary. Am J Respir Crit Care Med. 2017;195(5):557–582. doi: 10.1164/rccm.201701-0218PP [DOI] [PubMed] [Google Scholar]
- 5.MacLeod M, Papi A, Contoli M, et al. Chronic obstructive pulmonary disease exacerbation fundamentals: diagnosis, treatment, prevention and disease impact. Respirology. 2021;26(6):532–551. doi: 10.1111/resp.14041 [DOI] [PubMed] [Google Scholar]
- 6.Li Z, He P, Ding H, et al. Association between peripheral blood WBCs C3aR mRNA level and plasma C3a, C3aR, IL-1β concentrations and acute exacerbation of chronic obstructive pulmonary disease. Immunobiology. 2022;227(1):152164. doi: 10.1016/j.imbio.2021.152164 [DOI] [PubMed] [Google Scholar]
- 7.Hamdan M, Haddad BI, Jabaiti M, et al. Does red cell distribution width predict hip fracture mortality among the Arab population? A Single-Center Retrospective Cohort Study. Int J Gen Med. 2021;14:10195–10202. doi: 10.2147/IJGM.S343538 [DOI] [PMC free article] [PubMed] [Google Scholar]
- 8.Hu GP, Zhou YM, Wu ZL, et al. Red blood cell distribution width is an independent predictor of mortality for an acute exacerbation of COPD. Int J Tuberc Lung Dis. 2019;23(7):817–823. doi: 10.5588/ijtld.18.0429 [DOI] [PubMed] [Google Scholar]
- 9.Epstein D, Nasser R, Mashiach T, Azzam ZS, Berger G. Increased red cell distribution width: a novel predictor of adverse outcome in patients hospitalized due to acute exacerbation of chronic obstructive pulmonary disease. Respir Med. 2018;136:1–7. doi: 10.1016/j.rmed.2018.01.011 [DOI] [PubMed] [Google Scholar]
- 10.Manne BK, Xiang SC, Rondina MT. Platelet secretion in inflammatory and infectious diseases. Platelets. 2017;28(2):155–164. doi: 10.1080/09537104.2016.1240766 [DOI] [PMC free article] [PubMed] [Google Scholar]
- 11.Lehmann F, Schenk LM, Bernstock JD, et al. Elevated red cell distribution width to platelet ratio is associated with poor prognosis in patients with spontaneous, deep-seated intracerebral hemorrhage. Front Neurol. 2021;12:751510. doi: 10.3389/fneur.2021.751510 [DOI] [PMC free article] [PubMed] [Google Scholar]
- 12.Tomaniak M, Kołtowski Ł, Jonik S, et al. Platelet to red cell distribution width ratio for predicting clopidogrel efficacy in patients undergoing percutaneous coronary interventions: insights from the ONSIDE-TEST study. Pol Arch Intern Med. 2019;129(2):117–122. doi: 10.20452/pamw.4441 [DOI] [PubMed] [Google Scholar]
- 13.Johnson AE, Pollard TJ, Shen L, et al. MIMIC-III, a freely accessible critical care database. Sci Data. 2016;3(1):160035. doi: 10.1038/sdata.2016.35 [DOI] [PMC free article] [PubMed] [Google Scholar]
- 14.Yang R, Huang T, Shen L, et al. The use of antibiotics for ventilator-associated pneumonia in the MIMIC-IV database. Front Pharmacol. 2022;13:869499. doi: 10.3389/fphar.2022.869499 [DOI] [PMC free article] [PubMed] [Google Scholar]
- 15.Pollard TJ, Johnson AEW, Raffa JD, et al. The eICU collaborative research database, a freely available multi-center database for critical care research. Sci Data. 2018;5(1):180178. doi: 10.1038/sdata.2018.178 [DOI] [PMC free article] [PubMed] [Google Scholar]
- 16.Serpa Neto A, Deliberato RO, Johnson AEW, et al. Mechanical power of ventilation is associated with mortality in critically ill patients: an analysis of patients in two observational cohorts. Intensive Care Med. 2018;44(11):1914–1922. doi: 10.1007/s00134-018-5375-6 [DOI] [PubMed] [Google Scholar]
- 17.Lippi G, Plebani M. Red blood cell distribution width (RDW) and human pathology. One size fits all. Clin Chem Lab Med. 2014;52(9):1247–1249. doi: 10.1515/cclm-2014-0585 [DOI] [PubMed] [Google Scholar]
- 18.He F, Zhao P, Chu Y, Zhao N, Cheng J. Red blood cell distribution width and serum CA-125 level as prognostic markers in acute exacerbation of chronic obstructive pulmonary disease. J Int Med Res. 2021;49(5):3000605211020229. doi: 10.1177/03000605211020229 [DOI] [PMC free article] [PubMed] [Google Scholar]
- 19.Zhu M, Peng H, Wan L, Zhang S, Zeng Y. The role of elevated red blood cell distribution width in the prognosis of AECOPD patients: a retrospective study. Medicine. 2021;100(10):e25010. doi: 10.1097/MD.0000000000025010 [DOI] [PMC free article] [PubMed] [Google Scholar]
- 20.Salvagno GL, Sanchis-Gomar F, Picanza A, Lippi G. Red blood cell distribution width: a simple parameter with multiple clinical applications. Crit Rev Clin Lab Sci. 2015;52(2):86–105. doi: 10.3109/10408363.2014.992064 [DOI] [PubMed] [Google Scholar]
- 21.Crisafulli E, Barbeta E, Ielpo A, Torres A. Management of severe acute exacerbations of COPD: an updated narrative review. Multidiscip Respir Med. 2018;13(1):36. doi: 10.1186/s40248-018-0149-0 [DOI] [PMC free article] [PubMed] [Google Scholar]
- 22.Fawzy A, Anderson JA, Cowans NJ, et al. Association of platelet count with all-cause mortality and risk of cardiovascular and respiratory morbidity in stable COPD. Respir Res. 2019;20(1):86. doi: 10.1186/s12931-019-1059-1 [DOI] [PMC free article] [PubMed] [Google Scholar]
- 23.Pavasini R, Biscaglia S, d’Ascenzo F, et al. Antiplatelet treatment reduces all-cause mortality in COPD patients: a systematic review and meta-analysis. COPD. 2016;13(4):509–514. doi: 10.3109/15412555.2015.1099620 [DOI] [PubMed] [Google Scholar]
- 24.Rayes J, Bourne JH, Brill A, Watson SP. The dual role of platelet-innate immune cell interactions in thrombo-inflammation. Res Pract Thromb Haemost. 2020;4(1):23–35. doi: 10.1002/rth2.12266 [DOI] [PMC free article] [PubMed] [Google Scholar]
- 25.Zinellu A, Paliogiannis P, Sotgiu E, et al. Platelet Count and Platelet Indices in Patients with Stable and Acute Exacerbation of Chronic Obstructive Pulmonary Disease: a Systematic Review and Meta-Analysis. COPD. 2021;18(2):231–245. doi: 10.1080/15412555.2021.1898578 [DOI] [PubMed] [Google Scholar]
- 26.Akhter S, Warraich UA, Ghazal S, Rizvi N. Assessment and comparison of APACHE II (Acute Physiology and Chronic Health Evaluation), SOFA (Sequential Organ Failure Assessment) score and CURB 65 (Confusion; Urea; Respiratory Rate; Blood Pressure), for prediction of inpatient mortality in Acute Exacerbation of Chronic Obstructive Pulmonary Disease. J Pak Med Assoc. 2019;69(2):211–215. [PubMed] [Google Scholar]
- 27.Lambden S, Laterre PF, Levy MM, Francois B. The SOFA score-development, utility and challenges of accurate assessment in clinical trials. Crit Care. 2019;23(1):374. doi: 10.1186/s13054-019-2663-7 [DOI] [PMC free article] [PubMed] [Google Scholar]
- 28.Ilg A, Moskowitz A, Konanki V, et al. Performance of the CURB-65 score in predicting critical care interventions in patients admitted with community-acquired pneumonia. Ann Emerg Med. 2019;74(1):60–68. doi: 10.1016/j.annemergmed.2018.06.017 [DOI] [PMC free article] [PubMed] [Google Scholar]


