

Summary
HS3ST3B1-IT1 was identified as a downregulated long noncoding RNA in osteoarthritic cartilage. However, its roles and mechanisms in the pathogenesis of osteoarthritis (OA) are unclear. In this study, we demonstrated that the expressions of HS3ST3B1-IT1 and its maternal gene HS3ST3B1 were downregulated and positively correlated in osteoarthritic cartilage. Overexpression of HS3ST3B1-IT1 significantly increased chondrocyte viability, inhibited chondrocyte apoptosis, and upregulated extracellular matrix (ECM) proteins, whereas HS3ST3B1-IT1 knockdown had the opposite effects. In addition, HS3ST3B1-IT1 significantly ameliorated monosodium-iodoacetate-induced OA in vivo. Mechanistically, HS3ST3B1-IT1 upregulated HS3ST3B1 expression by blocking its ubiquitination-mediated degradation. Knockdown of HS3ST3B1 reversed the effects of HS3ST3B1-IT1 on chondrocyte viability, apoptosis, and ECM metabolism. AlkB homolog 5 (ALKBH5)-mediated N6-methyladenosine (m6A) demethylation stabilized HS3ST3B1-IT1 RNA. Together, our data revealed that ALKBH5-mediated upregulation of HS3ST3B1-IT1 suppressed OA progression by elevating HS3ST3B1 expression, suggesting that HS3ST3B1-IT1/HS3ST3B1 may serve as potential therapeutic targets for OA treatment.
Subject areas: Orthopedics, Biological sciences, Molecular biology, Molecular mechanism of gene regulation
Graphical abstract
Highlights
-
•
HS3ST3B1-IT1 attenuates OA progression by upregulating HS3ST3B1 expression
-
•
HS3ST3B1-IT1 upregulates HS3ST3B1 expression by increasing its protein stability
-
•
ALKBH5 enhances HS3ST3B1-IT1 expression via an m6A-YTHDF2-dependent pathway
Orthopedics; Biological sciences; Molecular biology; Molecular mechanism of gene regulation
Introduction
Osteoarthritis (OA) is a common chronic joint disorder causing pain and disability with a major impact on quality of life and socioeconomic burden/cost worldwide. Currently, there are no effective drugs to prevent or reverse the disease progression.1 OA involves complicated and multifactorial pathological changes in joint sites, including osteophyte formation, subchondral osteosclerosis, and synovitis. However, destruction of articular cartilage represents its landmark.2 Cartilage is a special avascular and aneural tissue with sparse chondrocytes embedding in the dense extracellular matrix (ECM). ECM accounts for 90% of the dry weight of cartilage, and changes in its physiology directly impact the function of cartilage.3 In addition, as the only cell type in the cartilage, chondrocytes are responsible for maintaining ECM homeostasis.4 Therefore, elucidating the molecular mechanisms of chondrocytes involved in OA pathogenesis is very essential for developing efficacious therapies for OA.
Long noncoding RNAs (lncRNAs) are a class of functional noncoding RNA transcripts, which mediate gene expression via multiple mechanisms, including chromatin remodeling, interaction with miRNAs, modulation of the activity of transcriptional regulators, and recruitment of scaffolding proteins.5,6 Recently, lncRNAs have been reported to be involved in a variety of human diseases, including cancer, neurodegenerative, and metabolism disorders.7,8,9 In fact, it has been reported that lncRNAs play essential roles in the progression of OA. For instance, lncRNA CRNDE suppressed interleukin-1β (IL-1β)-induced chondrocyte apoptosis and attenuated cartilage damage in OA rats.10 LncRNA PILA was elevated in damaged cartilage from patients with OA, and knockdown of PILA inhibited the ECM catabolism and chondrocytes apoptosis.11 Importantly, several lncRNAs, including LINC00167 and XIST, have been proposed as potential biomarkers and therapeutic targets for OA.12,13 However, because of the extensive number and complex mechanism of action, the roles and mechanisms of lncRNAs in the occurrence and development of OA remain to be explored.
We previously performed microarray analysis to identify the differentially expressed lncRNAs and mRNA between normal and osteoarthritic articular cartilage.14 Among the obtained differentially expressed lncRNAs, ENST00000583262.1, which is an intronic lncRNA derived from the intron 1 of human HS3ST3B1 gene (referred as HS3ST3B1-IT1), attracted our attention, because (1) it is one of the top five downregulated lncRNAs in osteoarthritic cartilage tissues based on our microarray data; (2) its maternal gene, HS3ST3B1, was simultaneously identified as a downregulated gene in osteoarthritic cartilage tissue in our microarray screening; and (3) HS3ST3B1 participates in the biosynthesis of heparan sulfate (HS), which has been proved to regulate ECM homeostasis.15 Therefore, we focused on the roles and underlying mechanisms of HS3ST3B1-IT1 and HS3ST3B1 in OA progression.
In the present study, we found that ectopic expression of HS3ST3B1-IT1 significantly promoted chondrocyte viability, inhibited chondrocyte apoptosis, and upregulated ECM proteins, whereas knockdown of HS3ST3B1-IT1 resulted in the opposite effects. In addition, HS3ST3B1-IT1 significantly ameliorated monosodium iodoacetate (MIA)-induced OA in vivo. Mechanistically, HS3ST3B1-IT1 upregulated HS3ST3B1 expression partially by blocking its ubiquitination-mediated degradation. Demethylation of HS3ST3B1-IT1 by AlkB homolog 5 (ALKBH5) was partially responsible for the elevation of HS3ST3B1-IT1. Taken together, our findings revealed that m6A-mediated upregulation of HS3ST3B1-IT1 suppressed OA progression by elevating HS3ST3B1 expression, suggesting that targeting HS3ST3B1-IT1/HS3ST3B1 may be a potential therapeutic strategy for OA.
Results
HS3ST3B1-IT1 and HS3ST3B1 are downregulated in human osteoarthritic cartilage
We previously performed microarray analysis to screen the differentially expressed lncRNAs and mRNAs between normal and osteoarthritic cartilage tissues.14 HS3ST3B1-IT1 was one of the top five downregulated lncRNAs in osteoarthritic cartilage compared with the normal cartilage tissues (n = 3, fold change = 6.651, and p = 0.0310, Table S1). Notably, HS3ST3B1, the maternal gene of HS3ST3B1-IT1, was also screened as a downregulated gene in osteoarthritic cartilage (Table S2). Till now, no reports have addressed the functions of HS3ST3B1-IT1. Then, we examined the expressions of HS3ST3B1-IT1 and HS3ST3B1 in a cohort of 50 normal and 50 osteoarthritic cartilage samples. Consistent with the microarray data, HS3ST3B1-IT1 and HS3ST3B1 were significantly downregulated in osteoarthritic cartilage samples compared with the normal cartilage tissues by using quantitative (real-time) reverse transcriptase PCR (qRT-PCR) assay (Figures 1A and 1B). Meanwhile, immunohistochemical (IHC) staining further validated the significant downregulation of HS3ST3B1 in osteoarthritic cartilage (Figure 1C). In addition, Pearson correlation analysis revealed that the expression of HS3ST3B1 and HS3ST3B1-IT1 were positively correlated in osteoarthritic cartilage (Figure 1D). Severe cartilage loss was observed in osteoarthritic cartilage, as indicated by the reduced safranin-O staining, decreased expression of COL2A1, and increased expression of MMP13 (Figures S1A and S1B). Moreover, logistic regression analysis indicated that there were no significant differences between normal and OA group regarding age (p = 0.140), sex (p = 0.967), and BMI (p = 0.448, Table S3). Collectively, these data indicate that both HS3ST3B1-IT1 and HS3ST3B1 are downregulated in osteoarthritic cartilage and thus may play important roles in the pathogenesis of OA.
Figure 1.

LncRNA HS3ST3B1-IT1 and HS3ST3B1 are downregulated in human osteoarthritic cartilage
(A and B) The expression levels of (A) HS3ST3B1-IT1 and (B) HS3ST3B1 in normal and osteoarthritic cartilage were evaluated by qRT-PCR. β-actin served as an internal control. n = 50 normal cartilage tissues from 50 individuals with no prior medical history of OA and undergoing hip arthroplasty surgery, and n = 50 OA cartilages from 50 patients with OA undergoing total knee replacement surgery. Each dot represented one donor as calculated by log2 transform. The horizontal lines indicated the mean ± SD from different donors per group.
(C) The expressions of HS3ST3B1 in normal and osteoarthritic cartilage were determined by IHC assays. Representative images from three independent experiments were shown in the left panel (scale bar, 200 μm). The quantification of cells positive for HS3ST3B1 was shown in the right panel. Values were shown as mean ± SD of n = 3 from three individual donors.
(D) Associations between HS3ST3B1-IT1 and HS3ST3B1 in osteoarthritic cartilage (n = 50) were assessed by Pearson correlation analysis. Statistical analysis was performed using an unpaired Student’s two-tailed t test (A–C). OA, osteoarthritis.
HS3ST3B1-IT1 increases chondrocyte viability, inhibits chondrocyte apoptosis, and upregulates ECM proteins in human primary chondrocytes
To explore the biological functions of HS3ST3B1-IT1 in OA, we first analyzed the basic characteristics of HS3ST3B1-IT1. The online Coding Potential Assessment Tool (CPAT, http://lilab.research.bcm.edu/cpat/) indicated that HS3ST3B1-IT1 had no protein-coding ability (Figure S2A). However, RegRNA 2.0 online software predicted an ORF (315 nt) in HS3ST3B1-IT1 transcript (Figure S2B). Therefore, we constructed series of GFP fusion plasmids to determine whether HS3ST3B1-IT1 encodes a peptide (Figure S2C). GFP protein was detected in GFPwt-transfected HEK 293T cells; however, no GFP protein was detected when the starting codon in GFP was mutated, as well as when GFPmut was fused with the ORF sequence of HS3ST3B1-IT1 (Figures S2D and S2E). Collectively, these data reveal that HS3ST3B1-IT1 has no encoding ability.
To determine the function of HS3ST3B1-IT1 in the biological activity of chondrocytes, we overexpressed or knocked down HS3ST3B1-IT1 by transfection of HS3ST3B1-IT1 expression plasmid or the antisense oligonucleotides (ASO) targeting HS3ST3B1-IT1 into human primary chondrocytes (Figure 2A). Cell Counting Kit-8 (CCK-8) assay indicated a significant increase of cell viability at 48 h upon HS3ST3B1-IT1 overexpression and a marked decrease of cell viability at 24 h after HS3ST3B1-IT1 knockdown (Figure 2B). Flow cytometric analysis revealed that the apoptosis rate was significantly reduced after HS3ST3B1-IT1 overexpression and increased following HS3ST3B1-IT1 knockdown (Figure 2C). In addition, after HS3ST3B1-IT1 overexpression, the expression of antiapoptotic protein Bcl-2 was significantly increased, whereas the expression of proapoptotic protein Bax as well as cleaved Caspase-9, cleaved Caspase-3, and cleaved PARP were markedly decreased. In contrast, HS3ST3B1-IT1 knockdown exhibited the opposite effects on the expression of these antiapoptotic and proapoptotic markers (Figure 2D).
Figure 2.

HS3ST3B1-IT1 increases chondrocyte viability, inhibits chondrocyte apoptosis, and regulates ECM metabolism
(A) qRT-PCR was performed to verify the overexpression and knockdown efficiencies of HS3ST3B1-IT1 in chondrocytes transfected with pcDNA-HS3ST3B1-IT1 or HS3ST3B1-IT1 ASO. Values were shown as mean ± SD (n = 3).
(B) CCK-8 assay was used to identify the viability of chondrocytes with HS3ST3B1-IT1 overexpression or knockdown. Values were shown as mean ± SD (n = 3).
(C) Chondrocyte apoptosis was detected with FITC-Annexin V/PI double staining using flow cytometry following HS3ST3B1-IT1 overexpression or knockdown. Values were shown as mean ± SD (n = 3).
(D) The expression levels of apoptosis-associated proteins were evaluated by western blotting. Representative blots from three independent experiments were shown (left panel). Densitometric analyses of the blots were presented as mean ± SD (n = 3, right panel).
(E) The expression levels of ECM proteins (COL2A1 and Aggrecan) and cartilage-degrading enzymes (MMP13 and ADAMTS-5) were analyzed by western blotting in chondrocytes following HS3ST3B1-IT1 overexpression or knockdown. Representative blots from three independent experiments were shown (left panel). Quantitative analyses of the blots were presented as mean ± SD (n = 3, right panel). Statistical analysis was performed using an unpaired Student’s two-tailed t test (A and C–E) or a two-way ANOVA followed by Sidak’s multiple comparison test (B).
Because the degradation of ECM components of articular cartilage is a hallmark of OA pathogenesis, we subsequently investigated the impact of HS3ST3B1-IT1 on the ECM component COL2A1 and Aggrecan. As shown in Figure 2E, HS3ST3B1-IT1 overexpression markedly enhanced the expression of COL2A1 and Aggrecan; on the contrary, HS3ST3B1-IT1 knockdown exhibited the opposite effects. Furthermore, we found that HS3ST3B1-IT1 overexpression blocked the expression of major matrix-degrading enzymes including MMP13 and ADAMTS-5, and HS3ST3B1-IT1 knockdown upregulated MMP13 and ADAMTS-5 expressions.
HS3ST3B1-IT1 attenuates OA progression in vivo
We further explored the in vivo role of HS3ST3B1-IT1 in OA progression by administering adeno-associated virus carrying HS3ST3B1-IT1 (AAV-HS3ST3B1-IT1) or its control virus (AAV-NC) to mice with OA induced by intra-articular injection of MIA (Figure 3A). As shown in Figures 3B and 3C, MIA treatment induced cartilage damage that resembled the pathological changes of OA, as evidenced by the reduced safranin-O/fast green and toluidine blue staining, and increased modified Mankin score. Interestingly, we found that overexpression of HS3ST3B1-IT1 significantly ameliorated MIA-induced OA phenotype (Figures 3B and 3C).
Figure 3.

HS3ST3B1-IT1 attenuates OA progression in vivo
(A) Schematic diagram illustrating the experimental design. Mice were randomly assigned into three groups: Ctrl+AAV-NC group (n = 7), MIA+AAV-NC group (n = 7), and MIA+ AAV-IT1 group (n = 7). For the induction of OA, mice were given an intra-articular injection of MIA in the knee. One week later, AAVs were administered once per week for 3 consecutive weeks. Six weeks later, mice were euthanized, and the knee joint tissues were separated for the subsequent experiments.
(B) Histological sections of cartilage harvested from each group were stained with safranin-O/fast green and toluidine blue staining. Scale bar, 100 μm (n = 4 for each group).
(C) The Mankin scoring system was used to evaluate articular cartilage of mice from each group (n = 4).
(D) The proliferation of chondrocytes in mouse cartilage tissues was detected using Ki67 immunohistochemistry. Upper panel: representative images of Ki67 staining (scale bar, 100 μm). Inset boxes indicate the areas of the articular cartilage. Lower panel: the percentage of Ki67-positive chondrocytes in mouse articular cartilage of each group (n = 4).
(E) Apoptosis of chondrocytes in mouse cartilage tissue was evaluated using the TUNEL assay. Left panel: representative images of TUNEL staining (scale bar, 100 μm). Dotted lines indicate the area of the articular cartilages. Right panel: the quantification of TUNEL-positive cells in the articular cartilages from each group (n = 4).
(F) The expressions of COL2A1 and MMP13 in knee articular cartilage were detected by IHC staining (scale bar, 100 μm). Inset boxes indicate the area of articular cartilage (n = 4 for each group).
(G) The expression levels of HS3ST3B1-IT1 in the knee articular cartilage were detected by qRT-PCR. Data were presented as the mean ± SD (n = 3). Statistical differences were determined using an unpaired Student’s two-tailed t test (C–-E and G). Saf-O/FG, safranin-O/fast green; TB, toluidine blue staining; AAV, adeno-associated virus; IT1, HS3ST3B1-IT1; MIA, monosodium iodoacetate; NC, negative control; ns, no significant difference.
Moreover, we observed that chondrocyte proliferation was significantly decreased, and chondrocyte apoptosis was markedly increased in MIA-induced OA mice, and these effects were markedly reversed by HS3ST3B1-IT1 overexpression (Figures 3D and 3E). In addition, IHC staining revealed that HS3ST3B1-IT1 overexpression dramatically reversed the loss of COL2A1 expression and the increase of MMP13 expression caused by MIA treatment (Figure 3F). The overexpression of HS3ST3B1-IT1 was validated by qRT-PCR (Figure 3G). Collectively, these findings indicate that overexpression of HS3ST3B1-IT1 is able to attenuate MIA-induced OA.
HS3ST3B1 enhances chondrocyte viability, inhibits chondrocyte apoptosis, and increases ECM components
Given that HS3ST3B1 was downregulated in OA, we speculated that HS3ST3B1 may act a suppressor role in OA progression. To prove this speculation, we overexpressed HS3ST3B1 via transfecting HS3ST3B1 expression plasmid and knocked down endogenous HS3ST3B1 via transfection of two independent small interfering RNAs (siRNAs) (Figures 4A and 4B). The influence of HS3ST3B1 on chondrocyte viability and apoptosis was evaluated by CCK-8 and flow cytometry analysis, respectively. As shown in Figure 4C, a significant increase of cell viability was observed at 24 h after HS3ST3B1 overexpression, and a marked decrease of cell viability was observed at 48 h after HS3ST3B1 knockdown. In addition, HS3ST3B1 overexpression significantly inhibited chondrocyte apoptosis, whereas HS3ST3B1 knockdown markedly induced chondrocyte apoptosis (Figure 4D). Besides, HS3ST3B1 overexpression significantly upregulated Bcl-2 expression and downregulated the expression levels of Bax, cleaved Caspase-9, cleaved Caspase-3, and cleaved PARP. In contrast, HS3ST3B1 knockdown exhibited the opposite effects on the expression of these apoptosis-related proteins (Figure 4E). Moreover, we investigated the effects of HS3ST3B1 on ECM metabolism. As shown in Figure 4F, HS3ST3B1 overexpression markedly upregulated COL2A1 and Aggrecan expressions and downregulated MMP13 and ADAMTS-5 expressions. Conversely, HS3ST3B1 knockdown exerted the opposite effects on the expression of these genes. Collectively, these results suggest that, similar to HS3ST3B1-IT, HS3ST3B1 may play an inhibitory role in OA progression.
Figure 4.

HS3ST3B1 increases chondrocyte viability, inhibits chondrocyte apoptosis, and regulates ECM metabolism
(A and B) qRT-PCR (A) and western blotting (B) were performed to verify the overexpression and knockdown efficiencies of HS3ST3B1 in chondrocytes transfected with pCMV3-HS3ST3B1 plasmid or HS3ST3B1 siRNAs. Values were shown as mean ± SD (n = 3).
(C) CCK-8 assay was used to identify the viability of chondrocytes with HS3ST3B1 overexpression or knockdown. Values were shown as mean ± SD (n = 3).
(D) The apoptosis rates were evaluated in chondrocytes with HS3ST3B1 overexpression or knockdown by flow cytometry. Values were shown as mean ± SD (n = 3).
(E) The expression levels of apoptosis-associated proteins were detected by western blotting in chondrocytes with HS3ST3B1 overexpression or knockdown. Representative blots from three independent experiments were shown (left panel). Densitometric analyses of the blots were presented as mean ± SD (n = 3, right panel).
(F) The expression levels of ECM proteins (COL2A1 and Aggrecan) and cartilage-degrading enzymes (MMP13 and ADAMTS-5) were analyzed by western blotting in chondrocytes with HS3ST3B1 overexpression or knockdown. Representative blots from three independent experiments were shown (left panel). Densitometric analyses of the blots were presented as mean ± SD (n = 3, right panel). Statistical analysis was performed using an unpaired Student’s two-tailed t test (A, D–F) or a two-way ANOVA followed by Sidak’s multiple comparison test (C).
HS3ST3B1-IT1 upregulates HS3ST3B1 expression partially by blocking its ubiquitination-mediated degradation
The high co-expression between HS3ST3B1-IT1 and HS3ST3B1 and their similar roles in OA progression prompted us to investigate whether this co-expression is caused by the mutual regulatory relationship between HS3ST3B1-IT1 and HS3ST3B1. We found HS3ST3B1 overexpression or knockdown had no obvious effects on HS3ST3B1-IT1 expression (Figure S3); however, overexpression of HS3ST3B1-IT1 resulted in statistically elevated HS3ST3B1 abundance at both mRNA and protein levels, whereas HS3ST3B1-IT1 knockdown exhibited the opposite trends (Figures 5A and 5B).
Figure 5.

HS3ST3B1-IT1 upregulates HS3ST3B1 expression by blocking ubiquitination-mediated degradation
(A) qRT-PCR was performed to detect the mRNA levels of HS3ST3B1 in chondrocytes after transfection with pcDNA-HS3ST3B1-IT1, HS3ST3B1-IT1 ASO, and their respective controls. Values were shown as mean ± SD (n = 3).
(B) Western blotting was performed to detect the protein levels of HS3ST3B1 in chondrocytes after transfection with pcDNA-HS3ST3B1-IT1, HS3ST3B1-IT1 ASO, and their respective controls. Representative blots from three independent experiments were shown (left panel). Densitometric analyses of the blots were presented as mean ± SD (n = 3, right panel).
(C) FISH assay was performed to detect HS3ST3B1-IT1 subcellular localization in chondrocytes. 18S and U6 were modified by cyanine 3 (Cy3, red), and the nucleus was stained by 4′, 6-diamidino-2-phenylindole (DAPI, blue). 18S and U6 were used as cytoplasmic and nuclear markers, respectively. Scale bar, 20 μm.
(D) The putative secondary structure of HS3ST3B1-IT1 transcript in minimum free energy mode was computationally analyzed by RNAfold WebServer.
(E) The chondrocytes were transfected with pCMV3-HS3ST3B1-Flag plasmid. RIP experiment was performed with anti-Flag antibody, and the coprecipitated RNAs were subjected to qRT-PCR for HS3ST3B1-IT1. The fold enrichment of HS3ST3B1-IT1 in the Flag precipitate is shown relative to its matching immunoglobulin G (IgG) control. Values were shown as mean ± SD, n = 3 biologically independent samples.
(F) The chondrocytes were treated with CHX (50 μg/mL), and harvested at different time points as indicated. The protein levels of HS3ST3B1 were detected by western blotting. Representative blots from three independent experiments were shown (left panel). Densitometric analyses of the blots were presented as mean ± SD (n = 3, right panel).
(G) The chondrocytes were treated with MG132 (20 μM) for the indicated time points, and 30 μg of total cell lysates were immunoblotted with HS3ST3B1 antibodies. Representative blots from three independent experiments were shown (upper panel). Densitometric analyses of the blots were presented as mean ± SD (n = 3, lower panel).
(H) The ubiquitination assays of cells transfected with HA-ubiquitin, HS3ST3B1-Flag, and pcDNA-HS3ST3B1-IT1 plasmids or HA-ubiquitin, HS3ST3B1-Flag, and HS3ST3B1-IT1 ASO for 36 h and then treated with 20 μM MG132 for 6 h. The cell lysates were immunoprecipitated with anti-Flag antibody and then immunoblotted with anti-ubiquitin antibody, and the same blot was reprobed for HS3ST3B1. Representative blots from three independent experiments were shown. Statistical analysis was performed using an unpaired Student’s two-tailed t test (A and B, E and G) or a two-way ANOVA followed by Sidak’s multiple comparison test (F).
Given the cellular location of lncRNAs is important for their biological functions, we initially detected the subcellular localization of HS3ST3B1-IT1 using FISH assay. Results showed that HS3ST3B1-IT1 distributed in both the cytoplasm and nucleus of the chondrocytes (Figure 5C). The secondary structure analysis based on the minimum free energy algorithm of the RNAfold server (http://rna.tbi.univie.ac.at/cgi-bin/RNAWebSuite/RNAfold.cgi) showed that HS3ST3B1-IT1 contained multiple stem-loop structures (Figure 5D), suggesting that HS3ST3B1-IT1 may have the protein-binding potential.16 The RNA-protein interaction prediction database RPISeq based on Random Forest (RF) and support vector machine (SVM) classifiers predicted that HS3ST3B1-IT1 transcript had a high affinity with HS3ST3B1 protein (Figure S4). We further validated the interaction between HS3ST3B1-IT1 and HS3ST3B1 via RNA immunoprecipitation (RIP) assay. We overexpressed HS3ST3B1 by transfecting pCMV3-HS3ST3B1-Flag plasmid into human primary chondrocytes. Then, whole-cell lysate was incubated with magnetic beads conjugated to an anti-Flag antibody. The immunoprecipitate was subjected to detect HS3ST3B1-IT1 by qRT-PCR. As shown in Figure 5E, HS3ST3B1-IT1 appeared in the immunoprecipitate of anti-Flag antibody, suggesting a physical interaction between HS3ST3B1-IT1 and HS3ST3B1 in primary chondrocytes.
Because several lncRNAs were identified to modulate the ubiquitination or phosphorylation of proteins and thereby regulate protein stability,17,18,19 we wondered whether cytoplasmic HS3ST3B1-IT1 exerts its biological function by influencing the posttranslational modification of HS3ST3B1 proteins. As shown in Figure 5F, ectopic expression of HS3ST3B1-IT1 increased the stability of HS3ST3B1 protein in the presence of cycloheximide (CHX), an inhibitor of protein synthesis. To further determine whether HS3ST3B1-IT1 upregulates the protein level of HS3ST3B1 via the ubiquitin-proteasome pathway, we treated the chondrocytes with proteasome inhibitor MG132 and found the protein levels of HS3ST3B1 were dramatically increased (Figure 5G). In addition, we observed that HS3ST3B1-IT1 overexpression obviously decreased the ubiquitination of HS3ST3B1 protein, whereas HS3ST3B1-IT1 knockdown increased the ubiquitination of HS3ST3B1 protein (Figure 5H). Altogether, these data reveal that HS3ST3B1-IT1 stabilizes HS3ST3B1 protein by reducing its decay via ubiquitin-proteasome pathway.
HS3ST3B1 mediates the effects of HS3ST3B1-IT1 on chondrocyte viability, chondrocyte apoptosis, and ECM metabolism
The aforementioned results suggested that HS3ST3B1-IT1 might exert its function in chondrocyte viability, apoptosis, and ECM metabolism via regulating HS3ST3B1 expression. To test this hypothesis, we knocked down HS3ST3B1 by transfecting HS3ST3B1 siRNA in HS3ST3B1-IT1-overexpressed primary chondrocytes. As shown in Figure 6A, HS3ST3B1-IT1 overexpression resulted in an increase of HS3ST3B1 expression, which was diminished after transfection with HS3ST3B1 siRNA. CCK-8 assay showed that knockdown of HS3ST3B1 effectively alleviated the increase of chondrocyte viability induced by HS3ST3B1-IT1 (Figure 6B). In addition, knockdown of HS3ST3B1 markedly attenuated the inhibitory effects of HS3ST3B1-IT1 on chondrocyte apoptosis, as evidence by increased apoptosis rates, decreased expression of Bcl-2, and increased expression of Bax, cleaved Caspase-9, cleaved Caspase-3, and cleaved PARP (Figures 6C and 6D). Moreover, knockdown of HS3ST3B1 effectively inhibited the upregulation of COL2A1 and Aggrecan, as well as the downregulation of MMP13 and ADAMTS-5 induced by HS3ST3B1-IT1 overexpression (Figure 6E). Moreover, we overexpressed HS3ST3B1 in HS3ST3B1-IT1 knockdown chondrocytes. We found that overexpression of HS3ST3B1 significantly abolished the impacts of HS3ST3B1-IT1 knockdown on chondrocyte viability, apoptosis, and ECM metabolism (Figures S5A–S5E). Collectively, these findings suggest that HS3ST3B1-IT1 may attenuate OA progression, at least partially, via upregulation of HS3ST3B1.
Figure 6.

Knockdown of HS3ST3B1 impairs the effects of HS3ST3B1-IT1 on chondrocyte viability, chondrocyte apoptosis, and ECM metabolism
(A) Western blotting was performed to assess the protein levels of HS3ST3B1 in chondrocytes transfected with Vector+si-NC, Vector+si-HS3ST3B1, pcDNA-HS3ST3B1-IT1+si-NC, or pcDNA-HS3ST3B1-IT1+si-HS3ST3B1. Representative blots from three independent experiments were shown (left panel). Densitometric analyses of the blots were presented as mean ± SD (n = 3, right panel).
(B) CCK-8 assay was used to evaluate the viability of chondrocytes in each group. Values were shown as mean ± SD (n = 3).
(C) The apoptosis rates were evaluated by flow cytometry in each group. Values were shown as mean ± SD (n = 3).
(D) The expression levels of apoptosis-associated proteins were detected by western blotting. Representative blots from three independent experiments were shown (left panel). Densitometric analyses of the blots were presented as mean ± SD (n = 3, right panel).
(E) The expression levels of ECM proteins (COL2A1 and Aggrecan) and cartilage-degrading enzymes (MMP13 and ADAMTS-5) were analyzed by western blotting in each group. Representative blots from three independent experiments were shown (left panel). Densitometric analyses of the blots were presented as mean ± SD (n = 3, right panel). Statistical differences were determined using an unpaired Student’s two-tailed t test (A and C–E) or a two-way ANOVA followed by Tukey’s multiple comparison test (B).
ALKBH5 mediates m6A demethylation of HS3ST3B1-IT1 and promotes its expression
Recently, m6A modification has been identified as the most prevalent internal RNA modification in eukaryotic cells.20 We wondered whether m6A modification was responsible for the downregulation of HS3ST3B1-IT1 in OA. Firstly, we examined the overall m6A levels of RNAs in osteoarthritic cartilage via dot blot assay. Osteoarthritic cartilage showed higher m6A modified RNA levels compared with normal cartilage (Figure 7A). Online bioinformatics tool SRAMP revealed that HS3ST3B1-IT1 transcript possessed three m6A consensus motifs, 5′-RRACH-3’ (Figure 7B). Methylated RNA immunoprecipitation (MeRIP) assay further validated m6A was highly enriched within the HS3ST3B1-IT1 transcript in chondrocytes (Figure 7C).
Figure 7.

ALKBH5 increases HS3ST3B1-IT1 expression through an m6A-YTHDF2-dependent mechanism
(A) Dot blot analyses with an anti-m6A antibody using normal and osteoarthritic cartilages. Methylene blue (MB) staining served as a loading control (n = 5).
(B) The m6A modification sites in HS3ST3B1-IT1 were predicted with the online tool SRAMP (http://www.cuilab.cn/sramp).
(C) The m6A level of HS3ST3B1-IT1 in chondrocytes was determined by MeRIP assay. The fold enrichment of HS3ST3B11-IT1 in m6A pellet was relative to its matching IgG control. Values were shown as mean ± SD, n = 3 biologically independent samples.
(D) qRT-PCR was performed to detect the expression levels of ALKBH5 and HS3ST3B1-IT1 in chondrocytes after transfection with ALKBH5 expression plasmid. Values were shown as mean ± SD (n = 3).
(E) The expression levels of ALKBH5 in normal and osteoarthritic cartilage were evaluated by qRT-PCR (n = 50). β-actin served as an internal control. n = 50 normal cartilage tissues from 50 individuals with no prior medical history of OA and undergoing hip arthroplasty surgery, and n = 50 OA cartilages from 50 patients with OA undergoing total knee replacement surgery. Each dot represented one donor as calculated by log2 transform. The horizontal lines indicated the mean ± SD from different donors per group.
(F) Associations between ALKBH5 and HS3ST3B1-IT1 in osteoarthritic cartilage (n = 50) were assessed by Pearson correlation analysis.
(G) The m6A level of HS3ST3B1-IT1 was evaluated by MeRIP assay in chondrocytes after transfecting with ALKBH5 expression plasmid. Values were shown as mean ± SD, n = 3 biologically independent samples.
(H) The chondrocytes were treated with Act D for the indicated times, and qRT-PCR was performed to evaluate the expression level of HS3ST3B1-IT1 upon ALKBH5 overexpression.
(I) Left panel: the wild-type (wt) and m6A consensus sequence mutant (mut) HS3ST3B1-IT1 fused with firefly luciferase reporter. Right panel: luciferase reporter assay in HEK 293T cells transfected with luciferase reporter constructs (wt or mut) and ALKBH5 expression plasmid. Values were shown as mean ± SD, n = 3 biologically independent samples.
(J) RIP assay was performed in chondrocytes with anti-YTHDF2 antibody, and the coprecipitated RNAs were subjected to detect HS3ST3B1-IT1 using qRT-PCR. The fold enrichment of HS3ST3B1-IT1 in YTHDF2 pellet is relative to its matching IgG control. Values were shown as mean ± SD, n = 3 biologically independent samples.
(K) The chondrocytes were transfected with YTHDF2 wild type or mutant expression plasmids and then treated with Act D for the indicated times. qRT-PCR was performed to evaluate the expression level of HS3ST3B1-IT1. Values were shown as mean ± SD (n = 3). Statistical analysis was performed using an unpaired Student’s two-tailed t test (C–E, G, I–J). OA, osteoarthritis; MB, methylene blue; wt, wild-type; mut, mutant.
M6A is a dynamical and reversible modification in eukaryotic RNAs, which is catalyzed by methyltransferase, including methyltransferase-like 3 (METTL3) and methyltransferase-like 14 (METTL14), and removed by demethylases, including fat mass and obesity-associated protein (FTO) and ALKBH5.21 To define which m6A demethylase is involved in the regulation of HS3ST3B1-IT1, we overexpressed m6A demethylases FTO and ALKBH5 in chondrocytes and observed that overexpression of ALKBH5, but not FTO, significantly upregulated the expression of HS3ST3B1-IT1 (Figures 7D and S6). In addition, we found that the expression of ALKBH5 was significantly downregulated (Figure 7E) and positively correlated with HS3ST3B1-IT1 in osteoarthritic cartilage (Figure 7F). Therefore, we focused on the regulatory effect of ALKBH5 on HS3ST3B1-IT1. MeRIP analysis revealed that overexpression of ALKBH5 dramatically reduced the m6A level of HS3ST3B1-IT1 (Figure 7G). In addition, we monitored the mRNA degradation rate of HS3ST3B1-IT1 at multiple time points after actinomycin D (ActD) treatment and found that ALKBH5 significantly increased the stability of HS3ST3B1-IT1 transcript (Figure 7H). To further identify the specific m6A modification sites on HS3ST3B1-IT1 RNA, we cloned HS3ST3B1-IT1 sequence containing three potential m6A sites into a dual luciferase reporter gene vector and generated three mutant HS3ST3B1-IT1 reporter vectors by replacing the adenosine base in m6A consensus sequences with cytosine to abolish m6A modification (Figure 7I, left). Relative luciferase activity of HS3ST3B1-IT1-wt was increased upon ALKBH5 overexpression, whereas mutant 2 and 3 almost abolished this induction, indicating that the modulation of HS3ST3B1-IT1 expression was under the control of ALKBH5-associated m6A modification on sites 2 and 3 (Figure 7I, right).
ALKBH5 increases HS3ST3B1-IT1 expression through an m6A-YTHDF2-dependent pathway
The effects of m6A modification on RNA metabolism predominantly depend on the recognition by m6A-binding proteins (also called “readers”), mainly including YTHDF1 and YTHDF2.22 YTHDF1 has been reported to promote the translation of targeted m6A-modified mRNA, whereas YTHDF2 selectively recognizes and destabilizes m6A-modified mRNA.23,24 Our aforementioned data showed that the expression level of HS3ST3B1-IT1 was decreased in osteoarthritic cartilage (Figure 1A), whereas its m6A modification level was increased (Figure 7C). We therefore hypothesized that YTHDF2 might regulate the m6A-modified HS3ST3B1-IT1 transcript in OA. RPISeq analysis indicated that HS3ST3B1-IT1 transcript had a high affinity with YTHDF2 (Figure S7). RIP analysis confirmed the direct binding between YTHDF2 protein and HS3ST3B1-IT1 transcript in chondrocytes (Figure 7J). More importantly, overexpression of YTHDF2 accelerated the degradation of HS3ST3B1-IT1 transcript (Figure 7K). It has been shown that K416/R527 of the YTH domain of YTHDF2 are essential for binding of RNA backbone and that W432/W486/W491 are responsible for the recognition of m6A modification sites.25,26 To validate YTHDF2-mediated downregulation of HS3ST3B1-IT1 further, we constructed YTHDF2 expression plasmid containing K416A/R527A/W432A/W486A/W491A mutations and found that overexpression of mutated YTHDF2 had no obvious effect on the degradation rate of HS3ST3B1-IT1 transcript (Figure 7K). Thus, these data suggest that ALKBH5 increases HS3ST3B1-IT1 expression mainly by abolishing m6A-YTHDF2-dependent mRNA degradation.
Discussion
OA is becoming a major public health problem, and the underlying mechanism has not been fully elucidated.27 Recently, accumulating evidence indicated that lncRNA dysregulation plays important roles in OA progression by cartilage degradation, synovial inflammation, and dysfunction of subchondral bone homeostasis and that lncRNAs could serve as therapeutic targets.28,29,30 Therefore, an expanded understanding of the functions and regulatory mechanisms of lncRNAs in OA may provide potential therapeutic targets for OA.
We previously performed microarray analysis to identify differentially expressed lncRNAs between normal and osteoarthritic cartilage. HS3ST3B1-IT1, an intronic lncRNA, was significantly downregulated and positively correlated with its maternal gene HS3ST3B1 in osteoarthritic cartilage. By loss- and gain-of-function experiments, we demonstrated that HS3ST3B1-IT1 and HS3ST3B1 increased chondrocyte viability, inhibited chondrocyte apoptosis, and upregulated ECM proteins. In addition, HS3ST3B1-IT1 overexpression markedly ameliorated MIA-induced OA in vivo. The high co-expression between HS3ST3B1-IT1 and HS3ST3B1 prompted us to investigate their mutual regulatory relationship. We found HS3ST3B1 had no obvious effects on HS3ST3B1-IT1 expression; however, HS3ST3B1-IT1 positively regulated HS3ST3B1 expression at both mRNA and protein levels. Besides, HS3ST3B1 reversed the effects of HS3ST3B1-IT1 on chondrocyte viability, apoptosis, and ECM metabolism, suggesting that HS3ST3B1-IT1 attenuated OA progression, at least partially, due to elevation of HS3ST3B1.
HS3ST3B1, belonging to the 3-O-sulfotransferases family, participates in the last biosynthetic steps of HS and transfers sulfate to the 3-O-position of glucosamine residues to yield mature sugar chains.31 Previous study has shown that HS binds to many proteins that regulate cartilage homeostasis, including growth factors, morphogens, and proteases, and modulates their localization, retention, and biological activity.15 Chanalaris et al. proved that the expression of HS biosynthesis and modifying enzymes significantly differed in normal and osteoarthritic cartilage.32 Herein, we observed that HS3ST3B1 was significantly reduced in osteoarthritic cartilage and played a suppressor role in the development of OA, suggesting that HS3ST3B1 may modulate the sulfation pattern of HS and alter HS affinity for a range of ligands, with varying effects on their downstream activity in OA. However, further investigation may be required to identify the abundance of 3-O-sulfation levels of HS and analyze its sulfation structures.
In the present study, we found HS3ST3B1-IT1 distributed in both the cytoplasm and nucleus of the chondrocytes. Cytoplasmic lncRNAs usually regulate gene expression through posttranscriptional, translational, and posttranslational mechanisms.33,34 We demonstrated the binding of HS3ST3B1-IT1 with HS3ST3B1 by combining bioinformatics analyses with RIP assays. Studies have revealed that lncRNAs can directly interact with proteins and thereby regulate protein stability.17,18 Herein, we found that HS3ST3B1 was an unstable protein regulated by the ubiquitin-proteasome system. Importantly, overexpression of HS3ST3B1-IT1 markedly enhanced the stability of HS3ST3B1 protein. Moreover, HS3ST3B1-IT1 overexpression markedly decreased the ubiquitination of HS3ST3B1 protein, whereas HS3ST3B1-IT1 knockdown significantly increased the ubiquitination of HS3ST3B1 protein. Together, these data revealed that HS3ST3B1-IT1 regulated the stability of HS3ST3B1 protein via ubiquitin-proteasome pathway. UbiBrowser prediction indicated that HS3ST3B1 has multiple ubiquitination sites (Figure S8A), and several E3 ubiquitin ligases potentially interact with HS3ST3B1 (Figure S8B). Therefore, we speculate that HS3ST3B1-IT1 increases the stability of HS3ST3B1 probably through competing with the E3 ubiquitin ligases, thereby reducing the ubiquitination of HS3ST3B1 protein.
It is reported that nuclear lncRNAs control the epigenetic state of particular genes that participate in transcriptional regulation.35,36 Some intronic RNAs can activate the transcription of the corresponding protein-coding genes in cis.37,38 Because HS3ST3B1-IT1 was localized in the nucleus, we speculated that nuclear HS3ST3B1-IT1 may regulate the transcription of HS3ST3B1 gene by recruiting chromatin-modifying proteins and coordinating interactions between distal regulatory elements or by establishing long-range chromosomal regulatory domains and nuclear bodies.
M6A modification modulates all phases of RNA metabolism, including RNA folding, stability, splicing, nuclear exporting, translational modulation, and degradation.39 Increasing evidence suggest that m6A modification plays critical roles in a variety of diseases,40,41,42,43 as well as in OA.44 Recently, it was reported that METTL3, the core component of the m6A methyltransferase, was involved in OA progression by affecting ECM degradation and regulating the inflammatory response.45 Chen et al. proved that METTL3-mediated m6A modification of ATG7 regulated the senescence of fibroblast-like synoviocytes and that inhibition of METTL3 could prevent OA development.46 Our previous study identified that FTO-mediated upregulation of AC008 promoted OA progression through the miR-328-3p–AQP1/ANKH axis.14 In the present study, we found ALKBH5 was downregulated in osteoarthritic cartilage, and overexpression of ALKBH5 dramatically decreased the m6A level of HS3ST3B1-IT1 and increased HS3ST3B1-IT1 RNA stability. YTHDF2, an m6A reader, binds to m6A residues located in the untranslated region through C-terminal YTD domain and renders the targeted mRNA to processing bodies for subsequent degradation.23,47 In this study, we validated the stronger YTHDF2 enrichment at HS3ST3B1-IT1 transcript. In addition, overexpression of YTHDF2 accelerated the degradation of HS3ST3B1-IT1 transcript. More importantly, overexpression of mutated YTHDF2 had no obvious effect on the degradation rate of HS3ST3B1-IT1 transcript. These findings suggest that ALKBH5 increases HS3ST3B1-IT1 expression through an m6A-YTHDF2-dependent pathway.
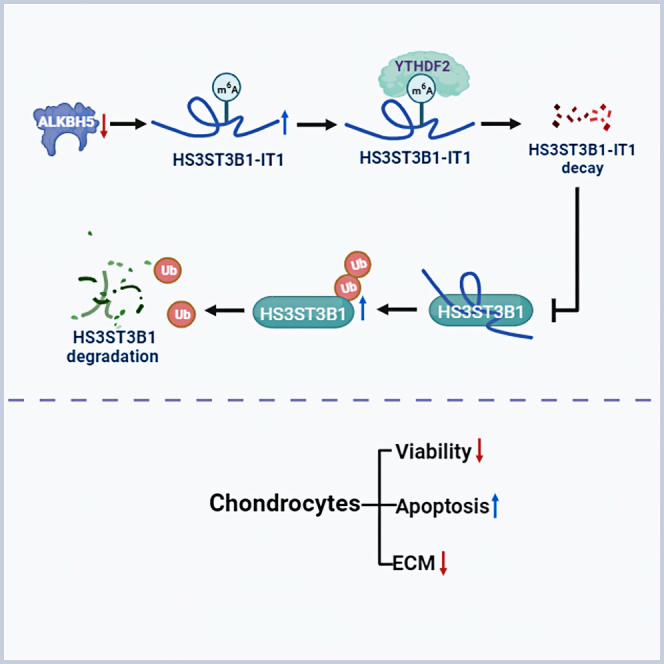
In summary, this study revealed that the downregulation of ALKBH5 in osteoarthritic cartilage increased the m6A level of HS3ST3B1-IT1, which accelerated HS3ST3B1-IT1 decay via a YTHDF2-dependent manner. Furthermore, decreased HS3ST3B1-IT1 induced the ubiquitination of HS3ST3B1 protein and promoted its degradation, ultimately inhibiting chondrocyte viability, promoting chondrocyte apoptosis, and reducing ECM components (Figure 8). Our findings suggest that HS3ST3B1-IT1 and HS3ST3B1 can act as potential therapeutic targets for OA.
Figure 8.

Schematic diagram illustrating the biological roles of HS3ST3B1-IT1 in OA
Downregulation of ALKBH5 increases the m6A level of HS3ST3B1-IT1, causing the degradation of HS3ST3B1-IT1 through a YTHDF2-dependent manner. Decreased HS3ST3B1-IT1 promotes OA progression by enhancing the ubiquitination-mediated degradation of HS3ST3B1 and consequently inhibiting chondrocyte viability, promoting chondrocyte apoptosis, and decreasing ECM proteins.
Limitations of the study
Our present data showed that HS3ST3B1-IT1 increased chondrocyte viability, inhibited chondrocyte apoptosis, and upregulated ECM components partially by stabilizing HS3ST3B1 protein. Nonetheless, the mechanisms by which HS3ST3B1-IT1 upregulated HS3ST3B1 mRNA expression were not explored in this study.
STAR★Methods
Key resources table
| REAGENT or RESOURCE | SOURCE | IDENTIFIER |
|---|---|---|
| Antibodies | ||
| Rabbit Polyclonal Anti-COL2A1 | Bioss | Cat# bs-0709R; RRID: AB_10857745 |
| Rabbit Polyclonal Anti-Aggrecan | Proteintech | Cat# 13880-1-AP RRID: AB_2722780 |
| Rabbit Polyclonal Anti-MMP13 | Proteintech | Cat# 18165-1-AP; RRID: AB_2144858 |
| Rabbit Polyclonal Anti-ADAMTS5 | Bioss | Cat# bs-3573R; RRID: AB_10856276 |
| Rabbit Polyclonal Anti-HS3ST3B1 | Bioss | Cat# bs-17391R; RRID: AB_2936791 |
| Sheep Polyclonal Anti-HS3ST3B1 | R&D Systems | Cat# AF7276; RRID: AB_2936792 |
| Rabbit Polyclonal Anti-PARP | Proteintech | Cat# 13371-1-AP; RRID: AB_2160459 |
| Rabbit Polyclonal Anti-Caspase 9 | Proteintech | Cat# 10380-1-AP; RRID: AB_2068632 |
| Rabbit Polyclonal Anti-Cleaved Caspase 3 | Affinity Biosciences | Cat# AF7022; RRID: AB_2835326 |
| Rabbit Polyclonal Anti-Bcl-2 | Proteintech | Cat# 12789-1-AP; RRID: AB_2227948 |
| Rabbit Polyclonal Anti-m6A | Epigentek | Cat# A-1801-100; RRID: AB_2936294 |
| Rabbit recombinant monoclonal Anti-YTHDF2 | Abcam | Cat# ab220163; RRID: AB_2868573 |
| Rabbit Polyclonal Anti-IgG | Millipore | Cat# PP64; RRID: AB_97852 |
| Rabbit Polyclonal Anti-Flag | Proteintech | Cat# 20543-1-AP; RRID: AB_11232216 |
| Mouse monoclonal Anti-Ubiquitin | Santa Cruz Biotechnology | Cat# SC-166553; RRID: AB_2241297 |
| Rabbit Polyclonal Anti-Bax | Cell Signaling Technology | Cat# 2772; RRID: AB_10695870 |
| Mouse monoclonal Anti-β-actin | Affinity Biosciences | Cat# T0022; RRID: AB_2839417 |
| Rabbit Polyclonal Anti-Ki67 | Affinity Biosciences | Cat# AF0198; RRID: AB_2834152 |
| Goat anti-rabbit IgG HRP antibody | Proteintech | Cat# SA00001-2; RRID: AB_2722564 |
| Goat anti-mouse IgG HRP antibody | Proteintech | Cat# SA00001-1; RRID: AB_2722565 |
| Rabbit anti-sheep IgG HRP antibody | Proteintech | Cat# SA00001-16; RRID: AB_2890978 |
| Bacterial and virus strains | ||
| Adeno-associated control virus | GeneChem | Cat# AAV9-CON-308 |
| Adeno-associated virus carrying HS3ST3B1-IT1 | GeneChem | Cat# AAV9-lncRNA (90233-1) |
| Chemicals, peptides, and recombinant proteins | ||
| Safranine O | Yeasen | Cat# 60517ES25 |
| Fast Green FCF | Yeasen | Cat# 60511ES08 |
| Toluidine Blue | Sigma-Aldrich | Cat# 89640-5G |
| Collagenase | Sigma-Aldrich | Cat# C6885-5G |
| EDTA decalcifying solution | Solarbio | Cat# E1171 |
| Protease inhibitors | Yeasen | Cat# 20124ES03 |
| Fetal bovine serum | WISENT Corporation | Cat# 086-550 |
| Radioimmunoprecipitation assay buffer | Beyotime | Cat# P0013C |
| ECL detection reagent | Tanon | Cat# 180-5001 |
| Polyvinylidene difluoride membrane | Roche | Cat# 03010040001 |
| Lipofectamine 2000 | Invitrogen | Cat# 11668019 |
| Trizol Reagent | Takara | Cat# 9109 |
| CHX | Sigma-Aldrich | Cat# C1988-1G |
| Actinomycin D | MCE | Cat# HY-17559 |
| Methylene blue | Sangon Biotech | Cat# 7220-79-3 |
| Hybond-N+ membranes | Biosharp | BS-NC-45 |
| Critical commercial assays | ||
| qPCR SYBR Green Master Mix | Yeasen | Cat# 11201ES08 |
| Cell Counting Kit 8 Kit | Yeasen | Cat# 40203ES76 |
| Dual Luciferase Reporter Gene Assay Kit | Yeasen | Cat# 11402ES60 |
| Mut Express II Fast Mutagenesis Kit V2 | Vazyme | Cat# C214-02 |
| RiboTM FISH Kit | RiboBio | Cat# C10910 |
| HiScript II Q Select RT SuperMix for qPCR (gDNA wiper) | Vazyme | Cat# R233-01 |
| EZ-Magna RIP Kit | Millipore | Cat# 17-700 |
| Anti-mouse/rabbit Immunohistochemical Detection Kit | Proteintech | Cat# PK10006 |
| BCA Kit | Beyotime | Cat# P0010 |
| QIAGEN Plasmid Plus Midi Kit | Qiagen | Cat# 12943 |
| FastPure Gel DNA Extraction Mini Kit | Vazyme | Cat# DC301-01 |
| (FITC)-Annexin V/Propidium Iodide (PI) Apoptosis Detection Kit | Vazyme | Cat# A211-01 |
| MIA | Sigma-Aldrich | Cat# I9148-5G |
| One Step TUNEL Apoptosis Assay Kit | Beyotime Biotechnology | Cat# C1086 |
| Experimental models: Cell lines | ||
| Human primary chondrocytes | This paper | N/A |
| HEK 293T cells | ATCC | Cat# CRL-11268 |
| Experimental models: Organisms/strains | ||
| Mouse C57BL/6 | Animal Laboratory Center of Nanjing Medical University | N/A |
| Oligonucleotides | ||
| anti-HS3ST3B1-IT1 oligodeoxynucleotide probe | RiboBio | Cat# lnc1101432 |
| anti-U6 oligodeoxynucleotide probe | RiboBio | Cat# lnc110101 |
| anti-18S rRNA oligodeoxynucleotide probe | RiboBio | Cat# lnc110102 |
| Primer used for plasmid construction, see Table S5 | This paper | N/A |
| siRNA and ASO sequences, see Table S6 | This paper | N/A |
| Primers used for qRT-PCR assay, see Table S7 | This paper | N/A |
| Recombinant DNA | ||
| pCMV3-Flag-HS3ST3B1 | Sino Biological | Cat# HG21316-CF |
| pCMV3-Flag- ALKBH5 | Sino Biological | Cat# HG24078-CF |
| pCMV3-Flag- YTHDF2 | Sino Biological | Cat# HG17055-CF |
| HA-ubiquitin | Addgene | Cat# 18712 |
| pcDNA-HS3ST3B1-IT1 | This paper | N/A |
| pEGFP-GFPmut | This paper | N/A |
| pEGFP-ORF-GFPmut | This paper | N/A |
| psi-CHECK2-HS3ST3B1-IT1 wt | This paper | N/A |
| psi-CHECK2-HS3ST3B1-IT1 mut1 | This paper | N/A |
| psi-CHECK2-HS3ST3B1-IT1 mut2 | This paper | N/A |
| psi-CHECK2-HS3ST3B1-IT1 mut3 | This paper | N/A |
| Software and algorithms | ||
| IBM SPSS Statistics 22 | SPSS Software | https://www.ibm.com/spss |
| GraphPad Prism 7 | GraphPad Software | https://www.graphpad.com/ |
| RNA-Protein Interaction Prediction | Lowa State University | http://pridb.gdcb.iastate.edu/RPISe/ |
Resource availability
Lead contact
Further information and requests for resources and reagents should be directed to and will be fulfilled by the lead contact, Changyan Ma (cyma@njmu.edu.cn).
Materials availability
Reagents (including plasmids) generated in this study are available from the lead contact.
Experimental model and study participant details
Clinical samples
Human osteoarthritic cartilage was collected from patients with OA undergoing total knee replacement surgery (n=50, aged 65-87 years). Normal cartilage was obtained from individuals with no prior medical history of OA and undergoing hip arthroplasty surgery (n=50, aged 61-84 years). The cartilage donor information, including the age, gender, BMI, and K&L grade, was listed in Table S4. Written informed consent was obtained from all participants. The experimental protocols of this study were approved by the Institutional Ethics Committee Board of Nanjing Medical University (approval No. 2020-499). A logistic regression model was used to estimate the confounders, such as sex, age, and BMI.
Collection of human primary chondrocytes
The human normal articular cartilage was collected from the hip joints of patients with no prior medical history of OA and undergoing hip arthroplasty surgery. Articular cartilage collected from each donor was sliced and digested in 0.2% type II collagenase in Dulbecco's Modified Eagle’s Medium/Nutrient Mixture F12 (DMEM/F12) supplemented with 10% fetal bovine serum (WISENT Corporation, Nanjing, China) for 16 h at 37°C. Cells were then filtered through 70 μm cell strainers and maintained as a monolayer in DMEM/F12 supplemented with 10% fetal bovine serum at 37°C incubator with 5% CO2. Chondrocytes at passage 2 were used for the following in vitro experiments. Each assay was performed three times by using primary chondrocytes isolated from cartilage tissues of three individual donors.
Mouse model of MIA-induced OA
All animal procedures were approved by the Committee on the Ethics of Animal Experiments of Nanjing Medical University (Protocol Number: IACUC-1908017). 8-week-old male C57BL/6 mice were randomly divided into three groups: Ctrl+AAV-NC group (n=7), MIA+AAV-NC group (n=7), and MIA+ AAV-IT1 group (n=7). For the induction of OA, mice were given an intra-articular injection of MIA (Sigma-Aldrich, St. Louis, MO, USA) in the knee. Control mice were given normal saline in the same volume. One week later, 20 μL of AAV-HS3ST3B1-IT1 or AAV-NC (GeneChem, Shanghai, China) were injected into the knee joints of mice. Treatments were administered once per week for 3 consecutive weeks. Six weeks later, the mice were euthanized, and the knee joints were collected and store at -80°C.
Method details
Histological analysis and IHC staining
The mouse and human cartilage tissues were fixed with 4% paraformaldehyde, decalcified in EDTA for 6 weeks, and then embedded in paraffin. Serial sections (5 μm) were deparaffinized in xylene, hydrated through a graded ethanol series, and stained with safranin-O/fast green (Yeasen, Shanghai, China) and toluidine blue (Sigma-Aldrich). The severity of cartilage damage was evaluated by using the modified Mankin scoring system. For IHC assay, sections were incubated with the primary antibodies at 4°C overnight and then incubated with secondary antibodies at 37°C for 1 h. Primary antibodies specific for the following proteins were used: HS3ST3B1, Collagen II and MMP13 (all from Bioss, Beijing, China), and Ki67 (Affinity Biosciences, Changzhou, China). To visualize extracellular COL2A1, the sections were pre-digested with pepsin. Positive cells were manually counted by two pathologists blinded with respect to normal or OA group, and the percentages of cells positive for HS3ST3B1, COL2A1, MMP13 and Ki67 were quantified accordingly.
TUNEL staining
TUNEL staining was performed with the kit obtained from Beyotime Biotechnology according to the manufacturer’s instructions (Shanghai, China). The nuclei were counterstained with DAPI (Beyotime Biotechnology). Images were observed by fluorescence microscopy. The percentages of cells positive for TUNEL were calculated using ImageJ software.
Plasmid construction, RNAi, and cell transfection
Full-length HS3ST3B1-IT1 was amplified by PCR and subcloned into the pcDNA3.1 vector (Invitrogen, Carlsbad, CA, USA). GFPmut vector was generated by mutating the starting codon of GFP at pEGFP-N2 vector (Clontech, Pal Alto, CA, USA) using Mut Express II Fast Mutagenesis Kit V2 (Vazyme Biotech, Nanjing, China). ORF-GFPmut fusion plasmid was constructed by inserting HS3ST3B1-IT1 ORF into the GFPmut vector. Wild-type HS3ST3B1-IT1 reporter (HS3ST3B1-IT1-Luc-wt) was constructed by inserting wild-type HS3ST3B1-IT1 sequence into the psiCHECK2 vector (Promega, Madison, WI, USA). The mutant HS3ST3B1-IT1 reporters were generated by replacing the adenosine bases with cytosines at wild-type HS3ST3B1-IT1 reporter. The HS3ST3B1, ALKBH5 and YTHDF2 expression plasmids were purchased from Sino Biological (Beijing, China). The YTHDF2-5A-mut (containing K416A/R527A/W432A/W486A/W491A mutations) was conducted by Mut Express II Fast Mutagenesis Kit V2 (Vazyme Biotech). The primers used for plasmid construction were listed in Table S5. HA-ubiquitin plasmid was purchased from Addgene (Cambridge, MA, USA). RiboBio (Guangzhou, China) chemically synthesized the siRNA against HS3ST3B1 and negative control siRNA; and the antisense oligonucleotides (ASO) targeting HS3ST3B1-IT1 and negative control. The sequences of siRNAs and ASOs were listed in Table S6. Cell transfection was executed with Lipofectamine 2000 (Invitrogen, Carlsbad, CA, USA) according to the manufacturer’s instructions.
Western blotting
Cells were lysed in radioimmunoprecipitation assay buffer (Beyotime Biotechnology) containing protease inhibitor cocktail (Yeasen). Equal amounts of proteins were separated by 10% sodium dodecyl sulfate-polyacrylamide gel and transferred to a polyvinylidene difluoride membrane (Roche, Indianapolis, IN, USA). The membrane was incubated with specific primary antibody overnight at 4°C, and was then incubated with secondary antibody at room temperature for 1 h. Bands were visualized with an ECL detection reagent (Tanon, Shanghai, China).
qRT-PCR
Total RNA were isolated from articular cartilage and cultured cells using Trizol reagent (Takara, Otsu, Japan). Complementary DNA was synthesized from 1 μg of total RNA using HiScript II Q Select RT SuperMix (Vazyme Biotech). Real-time PCR was performed using FastStart Universal SYBR Green Master Mix (Yeasen) in a Roche LightCycler 96 Real-Time PCR System. Relative expression level was calculated using the 2–ΔΔCt method with normalization to β-actin. All primers used for PCR amplification were listed in Table S7.
Cell viability assay
Cell Counting Kit-8 (CCK-8) (Yeasen) was used to assess the cell viability. The human primary chondrocytes coming from the same cartilage donor were transfected with the indicated plasmids, siRNAs or ASO, and then seeded at a density of 5×10³ cells per well in 96-well culture plates, respectively. Six replicate wells were used for each experimental group. On Days 0, 1, 2, and 3, 10 μL of CCK-8 solution was added to each well and incubated at 37°C for 2 h. The absorbance at 450 nm was measured using a microplate reader (BioTek, Winooski, VT, USA). The assay was repeated three times with different chondrocytes collected from three cartilage donors. We calculated averaged values from the six wells with the same treatments, and a two-way ANOVA followed by multiple comparison test was used to analyze the between-group differences at different time points (0, 24, 48, and 72 h), based on three biological replicates.
Flow cytometric analysis
Apoptosis was detected using a Fluorescein isothiocyanate (FITC)-Annexin V/Propidium Iodide (PI) Apoptosis Detection Kit (Vazyme Biotech). In Brief, cells were trypsinized, and resuspended in 100 μL of binding buffer containing FITC-Annexin V/PI for 15 min. Apoptosis was analyzed by BD FACSCalibur instrument (BD Biosciences, Franklin Lakes, NJ, USA).
Protein stability
To measure protein stability, the chondrocytes were treated with CHX (final concentration 100 μg/ml, Sigma-Aldrich) for the indicated time points. The protein level of HS3ST3B1 was measured by western blotting.
Fluorescence in situ hybridization (FISH)
The FISH assays were done by RiboTM FISH Kit (RiboBio). Cells were fixed with 4% formaldehyde for 10 min, permeabilized in 0.5% Triton X-100 at 4°C for 5 min, and then blocked in the preliminary hybridization solution for 30 min. Anti-HS3ST3B1-IT1, anti-U6, and anti-18S rRNA oligodeoxynucleotide probes (RiboBio) were used in the hybridization solution for incubation at 37°C overnight in the dark. Nuclear counterstaining was conducted with DAPI, and digital images were obtained using a Zeiss LSM 710 confocal laser microscope (Carl Zeiss, Oberkochen, Germany).
Ubiquitination assay
The chondrocytes were transfected with HA-ubiquitin, pCMV3-Flag-HS3ST3B1 and pcDNA-HS3ST3B1-IT1 expression plasmids or HA-ubiquitin, pCMV3-Flag-HS3ST3B1 and HS3ST3B1-IT1 ASO for 36 h, and then treated with 20 μM MG132 for 6 h before harvesting. Cell lystes were immunoprecipitated by anti-Flag antibody (Proteintech, Wuhan, China) or control IgG, and then immunoblotted with anti-Ubiquitin antibody (Santa Cruz Biotechnology, San Diego, CA, USA), and the same blot was reprobed for HS3ST3B1.
RNA decay assay
The chondrocytes were seeded in 6-well plates overnight, and the ALKBH5 or YTHDF2 expression plasmids were transfected into the cells for 24 h. 5 μg/ml Actinomycin D (ActD, MCE, Shanghai, China) was added to inhibit gene transcription for various times as indicated. Then, total RNA was extracted and analyzed by qRT-PCR. The mRNA half-life (t1/2) of HS3ST3B1-IT1 was calculated using ln2/slope, and normalized to β-actin.
Dual-luciferase reporter assay
To identify the m6A modification sites on HS3ST3B1-IT1 RNA, HEK293T cells were transfected with ALKBH5 expression plasmid together with wild-type or mutated HS3ST3B1-IT1 reporter plasmids. After 36 h of transfection, cells were lysed, and luciferase activity was assessed using a Dual-Luciferase Reporter Assay Kit (Yeasen). The firefly luciferase activity of each sample was normalized by the Renilla luciferase activity.
RIP assay
RIP was performed using an EZ-Magna RIP Kit (Millipore) according to the manufacturer’s protocol. Briefly, the whole-cell lysate was incubated with RIP buffer, containing magnetic beads conjugated to an anti-Flag antibody, anti-m6A antibody (Epigentek, Farmingdale, NY, USA), or anti-YTHDF2 antibody (Abcam, Cambridge, UK) at 4°C for 6 h. IgG was used as the negative control. The beads were washed and then incubated with 0.1% SDS/0.5 mg/mL proteinase K at 55°C for 30 min to remove proteins. Finally, the coprecipitated RNAs were evaluated by qRT-PCR.
m6A dot blot assay
The poly (A) RNAs (100 ng) were directly spotted onto Hybond-N+ membranes (Biosharp, Guangzhou, China). The membranes were UV crosslinked for 5 min and washed with TBST for 5 min to remove unbound total RNAs. After being blocked with 5% non-fat milk for 1 h, the membrane was incubated with specific anti-m6A antibody at 4°C overnight. Dot blots were hatched with horseradish peroxidase-conjugated goat anti-rabbit IgG (Affinity Biosciences) for 1 h, and exposed in visualizer Tanon-5200 (Tanon). The same 100 ng poly (A) mRNAs were spotted on the membranes, and stained with 0.2% Methylene blue (Sangon Biotech, Shanghai, China) followed by the scanning to indicate the total content of input RNA.
Quantification and statistical analysis
Experimental results were analyzed with SPSS software. Data were presented as the mean ± standard deviation (SD) values of three independent experiments. For two-group comparisons with normally distributed data, the unpaired two-tailed Student’s t test was used for data with equal variances among groups, and the unpaired Student’s t test with Welch correction was used for data with unequal variances. Two-way analysis of variance (ANOVA) was used for multiple group comparisons. The correlation coefficients were calculated by Pearson correlation analysis. P value<0.05 was considered statistically significant.
Acknowledgments
This work was supported by grants from the National Natural Science Foundation of China (No. 82072484, 81872389, and 82373058) and the Major Projects of Science and Technology Development Fund of Nanjing Medical University (No. NMUD2019004); Health Research Project of Lianyungang (No. 202113).
Author contributions
C.Y.M. and Y.C.J. designed the study and wrote the manuscript. Y.T.T. and Y.L. performed most of the experiments and analyzed the data. X.S.Z., Y.L.C., X.L.J., Q.Z., and M.Z. performed part of the experiments. J.S.Y. and H.M.D. collected the clinical samples. S.Y.D., Y.F.M., M.Y.X., and Z.Y.Z. analyzed and interpreted the data. All authors read and approved the final manuscript.
Declaration of interests
The authors declare no competing interests.
Inclusion and diversity
We support inclusive, diverse, and equitable conduct of research.
Published: September 7, 2023
Footnotes
Supplemental information can be found online at https://doi.org/10.1016/j.isci.2023.107838.
Contributor Information
Zongyu Zhang, Email: zzyails@163.com.
Huimin Ding, Email: huimin.ding@benqhospital.com.
Yucui Jin, Email: jyc@njmu.edu.cn.
Changyan Ma, Email: cyma@njmu.edu.cn.
Supplemental information
Data and code availability
-
•
All data reported in this article will be shared by the lead contact on request.
-
•
This article does not report original code.
-
•
Any additional information required to reanalyze the data reported in this article is available from the lead contact on request.
References
- 1.Tonge D.P., Pearson M.J., Jones S.W. The hallmarks of osteoarthritis and the potential to develop personalised disease-modifying pharmacological therapeutics. Osteoarthritis Cartilage. 2014;22:609–621. doi: 10.1016/j.joca.2014.03.004. [DOI] [PubMed] [Google Scholar]
- 2.Martel-Pelletier J., Barr A.J., Cicuttini F.M., Conaghan P.G., Cooper C., Goldring M.B., Goldring S.R., Jones G., Teichtahl A.J., Pelletier J.P. Osteoarthritis. Nat. Rev. Dis. Prim. 2016;2:16072. doi: 10.1038/nrdp.2016.72. [DOI] [PubMed] [Google Scholar]
- 3.Hardingham T.E., Fosang A.J. Proteoglycans: many forms and many functions. FASEB J. 1992;6:861–870. [PubMed] [Google Scholar]
- 4.Carballo C.B., Nakagawa Y., Sekiya I., Rodeo S.A. Basic Science of Articular Cartilage. Clin. Sports Med. 2017;36:413–425. doi: 10.1016/j.csm.2017.02.001. [DOI] [PubMed] [Google Scholar]
- 5.Rinn J.L., Chang H.Y. Genome regulation by long noncoding RNAs. Annu. Rev. Biochem. 2012;81:145–166. doi: 10.1146/annurev-biochem-051410-092902. [DOI] [PMC free article] [PubMed] [Google Scholar]
- 6.Ulitsky I., Bartel D.P. lincRNAs: genomics, evolution, and mechanisms. Cell. 2013;154:26–46. doi: 10.1016/j.cell.2013.06.020. [DOI] [PMC free article] [PubMed] [Google Scholar]
- 7.Liu S.J., Dang H.X., Lim D.A., Feng F.Y., Maher C.A. Long noncoding RNAs in cancer metastasis. Nat. Rev. Cancer. 2021;21:446–460. doi: 10.1038/s41568-021-00353-1. [DOI] [PMC free article] [PubMed] [Google Scholar]
- 8.Yang S., Lim K.H., Kim S.H., Joo J.Y. Molecular landscape of long noncoding RNAs in brain disorders. Mol. Psychiatr. 2021;26:1060–1074. doi: 10.1038/s41380-020-00947-5. [DOI] [PubMed] [Google Scholar]
- 9.Lu Q., Guo P., Liu A., Ares I., Martínez-Larrañaga M.R., Wang X., Anadón A., Martínez M.A. The role of long noncoding RNA in lipid, cholesterol, and glucose metabolism and treatment of obesity syndrome. Med. Res. Rev. 2021;41:1751–1774. doi: 10.1002/med.21775. [DOI] [PubMed] [Google Scholar]
- 10.Zhang Z., Yang P., Wang C., Tian R. LncRNA CRNDE hinders the progression of osteoarthritis by epigenetic regulation of DACT1. Cell. Mol. Life Sci. 2022;79:405. doi: 10.1007/s00018-022-04427-7. [DOI] [PMC free article] [PubMed] [Google Scholar]
- 11.Tang S., Cao Y., Cai Z., Nie X., Ruan J., Zhou Z., Ruan G., Zhu Z., Han W., Ding C. The lncRNA PILA promotes NF-kappaB signaling in osteoarthritis by stimulating the activity of the protein arginine methyltransferase PRMT1. Sci. Signal. 2022;15:eabm6265. doi: 10.1126/scisignal.abm6265. [DOI] [PubMed] [Google Scholar]
- 12.Jiang L., Zhou Y., Shen J., Chen Y., Ma Z., Yu Y., Chu M., Qian Q., Zhuang X., Xia S. RNA Sequencing Reveals LINC00167 as a Potential Diagnosis Biomarker for Primary Osteoarthritis: A Multi-Stage Study. Front. Genet. 2020;11:539489. doi: 10.3389/fgene.2020.539489. [DOI] [PMC free article] [PubMed] [Google Scholar]
- 13.Wang Y.H., Tsai C.H., Liu S.C., Chen H.T., Chang J.W., Ko C.Y., Hsu C.J., Chang T.K., Tang C.H. miR-150-5p and XIST interaction controls monocyte adherence: Implications for osteoarthritis therapy. Front. Immunol. 2022;13:1004334. doi: 10.3389/fimmu.2022.1004334. [DOI] [PMC free article] [PubMed] [Google Scholar]
- 14.Yang J., Zhang M., Yang D., Ma Y., Tang Y., Xing M., Li L., Chen L., Jin Y., Ma C. m(6)A-mediated upregulation of AC008 promotes osteoarthritis progression through the miR-328-3pAQP1/ANKH axis. Exp. Mol. Med. 2021;53:1723–1734. doi: 10.1038/s12276-021-00696-7. [DOI] [PMC free article] [PubMed] [Google Scholar]
- 15.Ori A., Wilkinson M.C., Fernig D.G. A systems biology approach for the investigation of the heparin/heparan sulfate interactome. J. Biol. Chem. 2011;286:19892–19904. doi: 10.1074/jbc.M111.228114. [DOI] [PMC free article] [PubMed] [Google Scholar]
- 16.Mathews D.H., Disney M.D., Childs J.L., Schroeder S.J., Zuker M., Turner D.H. Incorporating chemical modification constraints into a dynamic programming algorithm for prediction of RNA secondary structure. Proc. Natl. Acad. Sci. USA. 2004;101:7287–7292. doi: 10.1073/pnas.0401799101. [DOI] [PMC free article] [PubMed] [Google Scholar]
- 17.Liu B., Sun L., Liu Q., Gong C., Yao Y., Lv X., Lin L., Yao H., Su F., Li D., et al. A cytoplasmic NF-kappaB interacting long noncoding RNA blocks IkappaB phosphorylation and suppresses breast cancer metastasis. Cancer Cell. 2015;27:370–381. doi: 10.1016/j.ccell.2015.02.004. [DOI] [PubMed] [Google Scholar]
- 18.Wu Y., Yang X., Chen Z., Tian L., Jiang G., Chen F., Li J., An P., Lu L., Luo N., et al. m(6)A-induced lncRNA RP11 triggers the dissemination of colorectal cancer cells via upregulation of Zeb1. Mol. Cancer. 2019;18:87. doi: 10.1186/s12943-019-1014-2. [DOI] [PMC free article] [PubMed] [Google Scholar]
- 19.Zhou Y., Shao Y., Hu W., Zhang J., Shi Y., Kong X., Jiang J. A novel long noncoding RNA SP100-AS1 induces radioresistance of colorectal cancer via sponging miR-622 and stabilizing ATG3. Cell Death Differ. 2023;30:111–124. doi: 10.1038/s41418-022-01049-1. [DOI] [PMC free article] [PubMed] [Google Scholar]
- 20.Shi H., Wei J., He C. Where, When, and How: Context-Dependent Functions of RNA Methylation Writers, Readers, and Erasers. Mol. Cell. 2019;74:640–650. doi: 10.1016/j.molcel.2019.04.025. [DOI] [PMC free article] [PubMed] [Google Scholar]
- 21.Zaccara S., Ries R.J., Jaffrey S.R. Reading, writing and erasing mRNA methylation. Nat. Rev. Mol. Cell Biol. 2019;20:608–624. doi: 10.1038/s41580-019-0168-5. [DOI] [PubMed] [Google Scholar]
- 22.Zhao Y., Shi Y., Shen H., Xie W. m(6)A-binding proteins: the emerging crucial performers in epigenetics. J. Hematol. Oncol. 2020;13:35. doi: 10.1186/s13045-020-00872-8. [DOI] [PMC free article] [PubMed] [Google Scholar]
- 23.Wang X., Lu Z., Gomez A., Hon G.C., Yue Y., Han D., Fu Y., Parisien M., Dai Q., Jia G., et al. N6-methyladenosine-dependent regulation of messenger RNA stability. Nature. 2014;505:117–120. doi: 10.1038/nature12730. [DOI] [PMC free article] [PubMed] [Google Scholar]
- 24.Du H., Zhao Y., He J., Zhang Y., Xi H., Liu M., Ma J., Wu L. YTHDF2 destabilizes m(6)A-containing RNA through direct recruitment of the CCR4-NOT deadenylase complex. Nat. Commun. 2016;7:12626. doi: 10.1038/ncomms12626. [DOI] [PMC free article] [PubMed] [Google Scholar]
- 25.Li F., Zhao D., Wu J., Shi Y. Structure of the YTH domain of human YTHDF2 in complex with an m(6)A mononucleotide reveals an aromatic cage for m(6)A recognition. Cell Res. 2014;24:1490–1492. doi: 10.1038/cr.2014.153. [DOI] [PMC free article] [PubMed] [Google Scholar]
- 26.Zhu T., Roundtree I.A., Wang P., Wang X., Wang L., Sun C., Tian Y., Li J., He C., Xu Y. Crystal structure of the YTH domain of YTHDF2 reveals mechanism for recognition of N6-methyladenosine. Cell Res. 2014;24:1493–1496. doi: 10.1038/cr.2014.152. [DOI] [PMC free article] [PubMed] [Google Scholar]
- 27.Hunter D.J., Bierma-Zeinstra S. Osteoarthritis. Lancet. 2019;393:1745–1759. doi: 10.1016/S0140-6736(19)30417-9. [DOI] [PubMed] [Google Scholar]
- 28.Ali S.A., Peffers M.J., Ormseth M.J., Jurisica I., Kapoor M. The non-coding RNA interactome in joint health and disease. Nat. Rev. Rheumatol. 2021;17:692–705. doi: 10.1038/s41584-021-00687-y. [DOI] [PubMed] [Google Scholar]
- 29.He C.P., Jiang X.C., Chen C., Zhang H.B., Cao W.D., Wu Q., Ma C. The function of lncRNAs in the pathogenesis of osteoarthritis. Bone Joint Res. 2021;10:122–133. doi: 10.1302/2046-3758.102.BJR-2020-0228.R1. [DOI] [PMC free article] [PubMed] [Google Scholar]
- 30.Wang R., Shiu H.T., Lee W.Y.W. Emerging role of lncRNAs in osteoarthritis: An updated review. Front. Immunol. 2022;13:982773. doi: 10.3389/fimmu.2022.982773. [DOI] [PMC free article] [PubMed] [Google Scholar]
- 31.Kreuger J., Kjellén L. Heparan sulfate biosynthesis: regulation and variability. J. Histochem. Cytochem. 2012;60:898–907. doi: 10.1369/0022155412464972. [DOI] [PMC free article] [PubMed] [Google Scholar]
- 32.Chanalaris A., Clarke H., Guimond S.E., Vincent T.L., Turnbull J.E., Troeberg L. Heparan Sulfate Proteoglycan Synthesis Is Dysregulated in Human Osteoarthritic Cartilage. Am. J. Pathol. 2019;189:632–647. doi: 10.1016/j.ajpath.2018.11.011. [DOI] [PubMed] [Google Scholar]
- 33.Yao R.W., Wang Y., Chen L.L. Cellular functions of long noncoding RNAs. Nat. Cell Biol. 2019;21:542–551. doi: 10.1038/s41556-019-0311-8. [DOI] [PubMed] [Google Scholar]
- 34.Yoon J.H., Abdelmohsen K., Gorospe M. Posttranscriptional gene regulation by long noncoding RNA. J. Mol. Biol. 2013;425:3723–3730. doi: 10.1016/j.jmb.2012.11.024. [DOI] [PMC free article] [PubMed] [Google Scholar]
- 35.Hung T., Chang H.Y. Long noncoding RNA in genome regulation: prospects and mechanisms. RNA Biol. 2010;7:582–585. doi: 10.4161/rna.7.5.13216. [DOI] [PMC free article] [PubMed] [Google Scholar]
- 36.Lee J.T. Epigenetic regulation by long noncoding RNAs. Science. 2012;338:1435–1439. doi: 10.1126/science.1231776. [DOI] [PubMed] [Google Scholar]
- 37.Joung J., Engreitz J.M., Konermann S., Abudayyeh O.O., Verdine V.K., Aguet F., Gootenberg J.S., Sanjana N.E., Wright J.B., Fulco C.P., et al. Genome-scale activation screen identifies a lncRNA locus regulating a gene neighbourhood. Nature. 2017;548:343–346. doi: 10.1038/nature23451. [DOI] [PMC free article] [PubMed] [Google Scholar]
- 38.Sun B.K., Deaton A.M., Lee J.T. A transient heterochromatic state in Xist preempts X inactivation choice without RNA stabilization. Mol. Cell. 2006;21:617–628. doi: 10.1016/j.molcel.2006.01.028. [DOI] [PubMed] [Google Scholar]
- 39.Meyer K.D., Jaffrey S.R. The dynamic epitranscriptome: N6-methyladenosine and gene expression control. Nat. Rev. Mol. Cell Biol. 2014;15:313–326. doi: 10.1038/nrm3785. [DOI] [PMC free article] [PubMed] [Google Scholar]
- 40.Panneerdoss S., Eedunuri V.K., Yadav P., Timilsina S., Rajamanickam S., Viswanadhapalli S., Abdelfattah N., Onyeagucha B.C., Cui X., Lai Z., et al. Cross-talk among writers, readers, and erasers of m(6)A regulates cancer growth and progression. Sci. Adv. 2018;4:eaar8263. doi: 10.1126/sciadv.aar8263. [DOI] [PMC free article] [PubMed] [Google Scholar]
- 41.Weng H., Huang H., Wu H., Qin X., Zhao B.S., Dong L., Shi H., Skibbe J., Shen C., Hu C., et al. METTL14 Inhibits Hematopoietic Stem/Progenitor Differentiation and Promotes Leukemogenesis via mRNA m(6)A Modification. Cell Stem Cell. 2018;22:191–205.e9. doi: 10.1016/j.stem.2017.11.016. [DOI] [PMC free article] [PubMed] [Google Scholar]
- 42.Deng X., Su R., Weng H., Huang H., Li Z., Chen J. RNA N(6)-methyladenosine modification in cancers: current status and perspectives. Cell Res. 2018;28:507–517. doi: 10.1038/s41422-018-0034-6. [DOI] [PMC free article] [PubMed] [Google Scholar]
- 43.Wu Y., Xie L., Wang M., Xiong Q., Guo Y., Liang Y., Li J., Sheng R., Deng P., Wang Y., et al. Mettl3-mediated m(6)A RNA methylation regulates the fate of bone marrow mesenchymal stem cells and osteoporosis. Nat. Commun. 2018;9:4772. doi: 10.1038/s41467-018-06898-4. [DOI] [PMC free article] [PubMed] [Google Scholar]
- 44.Mo X.B., Zhang Y.H., Lei S.F. Genome-Wide Identification of N(6)-Methyladenosine (m(6)A) SNPs Associated With Rheumatoid Arthritis. Front. Genet. 2018;9:299. doi: 10.3389/fgene.2018.00299. [DOI] [PMC free article] [PubMed] [Google Scholar]
- 45.Sang W., Xue S., Jiang Y., Lu H., Zhu L., Wang C., Ma J. METTL3 involves the progression of osteoarthritis probably by affecting ECM degradation and regulating the inflammatory response. Life Sci. 2021;278:119528. doi: 10.1016/j.lfs.2021.119528. [DOI] [PubMed] [Google Scholar]
- 46.Chen X., Gong W., Shao X., Shi T., Zhang L., Dong J., Shi Y., Shen S., Qin J., Jiang Q., Guo B. METTL3-mediated m(6)A modification of ATG7 regulates autophagy-GATA4 axis to promote cellular senescence and osteoarthritis progression. Ann. Rheum. Dis. 2022;81:87–99. doi: 10.1136/annrheumdis-2021-221091. [DOI] [PubMed] [Google Scholar]
- 47.Wang H., Zuo H., Liu J., Wen F., Gao Y., Zhu X., Liu B., Xiao F., Wang W., Huang G., et al. Loss of YTHDF2-mediated m(6)A-dependent mRNA clearance facilitates hematopoietic stem cell regeneration. Cell Res. 2018;28:1035–1038. doi: 10.1038/s41422-018-0082-y. [DOI] [PMC free article] [PubMed] [Google Scholar]
Associated Data
This section collects any data citations, data availability statements, or supplementary materials included in this article.
Supplementary Materials
Data Availability Statement
-
•
All data reported in this article will be shared by the lead contact on request.
-
•
This article does not report original code.
-
•
Any additional information required to reanalyze the data reported in this article is available from the lead contact on request.