

Summary
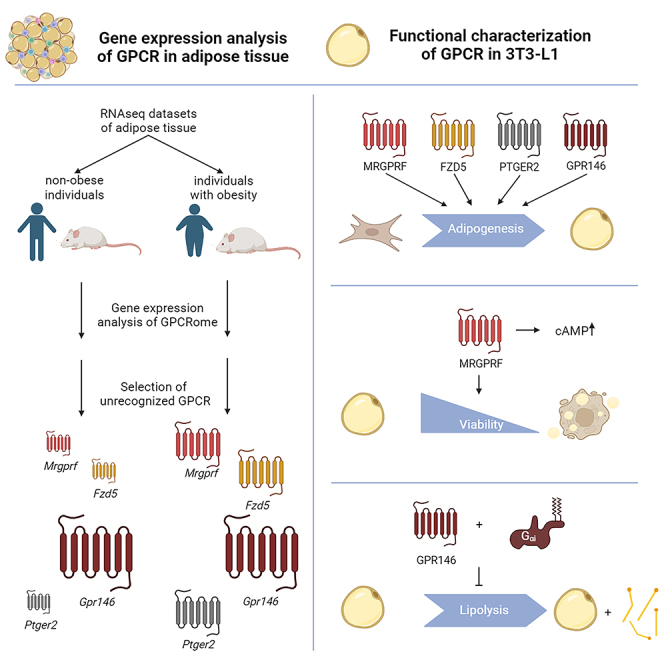
G protein-coupled receptors (GPCRs) modulate the function of adipose tissue (AT) in general and of adipocytes, specifically. Although it is well-established that GPCRs are widely expressed in AT, their repertoire as well as their regulation and function in (patho)physiological conditions (e.g., obesity) is not fully resolved. Here, we established FATTLAS, an interactive public database, for improved access and analysis of RNA-seq data of mouse and human AT. After extracting the GPCRome of non-obese and obese individuals, highly expressed and differentially regulated GPCRs were identified. Exemplarily, we describe four receptors (GPR146, MRGPRF, FZD5, PTGER2) and analyzed their functions in a (pre)adipocyte cell model. Besides all receptors being involved in adipogenesis, MRGPRF is essential for adipocyte viability and regulates cAMP levels, while GPR146 modulates adipocyte lipolysis via constitutive activation of Gi proteins. Taken together, by implementing and using FATTLAS we describe four hitherto unrecognized GPCRs associated with AT function and adipogenesis.
Subject areas: Natural sciences, Biological sciences, Physiology, Molecular biology, Bioinformatics
Graphical abstract
Highlights
-
•
Implementing the innovative and freely accessible RNA-seq database FATTLAS
-
•
Describing the GPCRome of adipose tissue in non-obese and obese conditions
-
•
Identification of four GPCRs that have not been linked to adipocyte function
-
•
Functional characterization of the identified GPCRs (FZD5, MRGPRF, PTGER2, GPR146)
Introduction
Adipose tissue (AT) was long considered to be inert, only necessary for storing fat. However, the research of the last decades demonstrated that it has endocrine functions modulating energy homeostasis.1 Healthy AT expansion is driven by a balance of adipocyte hypertrophy and hyperplasia.2 If energy consumption exceeds energy expenditure in the long term, AT expands excessively mainly by adipocyte hypertrophy leading to obesity. This results in increased inflammation, insulin insensitivity, and imbalance of hormone secretion finally resulting in AT dysfunction and negative systemic health effects.3,4,5
Functional changes in AT and adipocytes due to obesity are also connected to changes in gene expression.6,7 Those can be determined by RNA sequencing (RNA-seq) analysis comparing AT or adipocyte gene expression of non-obese and obese individuals. Several of those studies have been conducted using mouse and human tissue and cell samples.8,9,10,11,12,13,14,15 However, with the growing complexity and amount of data from next-generation sequencing it is challenging, particularly for bench researchers, to conduct comprehensive analyses with limited resources to use dedicated computational tools. Here, we developed FATTLAS, an interactive public database of AT RNA-seq experiments that allows hypothesis testing and candidate gene discovery analyses.
As a proof-of-principle, we used our webtool and database to identify highly expressed or differentially regulated G protein-coupled receptors (GPCRs) in obesity. GPCRs are the largest family of transmembrane receptors transducing extracellular signals into intracellular responses and, thereby, represent excellent drug targets.16 They are involved in almost all physiological processes including the development of mature adipocytes17 and the modulation of adipocyte function such as lipolysis, glucose uptake, hormone release, and thermogenesis.18 Furthermore, expression of more than 150 GPCRs has been shown in human AT with most of them being poorly characterized.19 Therefore, many receptors with the potential to interfere with adipocyte dysfunction caused by obesity-induced hypertrophic expansion still need to be discovered. Thus, we comprehensively analyzed GPCR expression in AT of non-obese and obese individuals and identified highly or differentially expressed GPCRs with unknown function in adipocytes. Four GPCRs (GPR146, Mas-related G protein-coupled receptor F (MRGPRF), Frizzled-like receptor 5 (FZD5), Prostaglandin E receptor type 2 (PTGER2)) were chosen for further analyses including their signal transduction and functional properties in adipocytes using the model cell line 3T3-L1.
Here, we demonstrate that these four receptors are necessary for the development of fully functional adipocytes. Furthermore, MRGPRF and GPR146 are involved in the acute regulation of adipocyte function. Our approach demonstrates that hypothesis-free analysis of publicly available expression data can guide the identification of proteins regulating essential cellular functions. Furthermore, our database may promote collaborative research in the obesity research community allowing custom analyses of genes across different datasets.
Results
G protein-coupled receptor expression patterns in RNA-seq datasets of AT of non-obese and obese individuals are reproducible in independent experiments
Because GPCRs are important for transducing extracellular signals into intracellular responses, highly expressed receptors showing comparable expression patterns in healthy and disease states can be considered crucial for general tissue function. Moreover, GPCRs differing in their expression patterns point toward an important functionality connected to disease development. Here, we hypothesized that publicly available RNA-seq datasets can guide the identification of GPCRs crucial for adipocyte function in non-obese and obese individuals by analyzing GPCR expression patterns.
As RNA-seq analysis of olfactory GPCRs (OR) is complex and error-prone due to gene duplication and high sequence similarity,20,21 we focused on non-olfactory GPCRs. All investigations described here were also conducted for OR and the results are given in the supplements (Table S1; Figure S1).
To identify GPCRs involved in AT function and to prevent false positive results due to dataset heterogeneity (e.g., age and origin), we identified two independent datasets each for human and mouse subcutaneous AT (scAT) as well as mouse visceral AT (vAT) from non-obese (BMI-SDS <1.88, BMI <30 or chow) and obese (BMI-SDS ≥1.88, BMI ≥30 or HFD) individuals and compared the GPCR expression patterns. Thus, we divided the datasets into their corresponding weight groups and correlated the GPCR expression patterns between species-, tissue subtype-, and weight group-matched subcohorts (Figure S2). The resulting correlations were consistent across a R2 of 0.71–0.94 in corresponding datasets (Table S2) demonstrating that the expression patterns of GPCRs are not biased between the matched datasets. Therefore, these datasets can be used to identify and verify GPCRs involved in AT function and in obesity.
To identify GPCRs highly expressed in both, non-obese and obese individuals, we compared the top ten expressed GPCRs between the two weight-group subcohorts of each dataset and detected similar expression patterns (Figure 1). Here, we found several GPCRs well-characterized in AT function (e.g., ADRB322). Interestingly, the orphan G protein-coupled receptor 146 (GPR146) is highly expressed in human and mouse AT (among the top 8% GPCRs). Although this receptor has not been implicated in adipocyte function yet, previous data point toward roles in energy homeostasis. It is controversially discussed that GPR146 is activated by C-peptide,23,24 and receptor dysfunction has been connected to altered plasma cholesterol levels.25
Figure 1.

The expression of the top ten expressed GPCRs is highly similar per dataset comparing the weight groups
(A–F) The composition of best-expressed GPCRs is very similar between the weight groups in (A) human_scAT_#1, (B) human_scAT_#2, (C) mouse_scAT_#1, (D) mouse_scAT_#2, (E) mouse_vAT_#1 and (F) mouse_vAT_#2. gray boxes: GPCRs top expressed in both weight groups of one dataset; white boxes: GPCRs top expressed in only one weight group of one dataset. Given is the median. The whiskers go down to the smallest value and up to the largest. The box extends from the 25th to 75th percentiles (see also Figures S1–S7).
Altogether, we showed that analyzing GPCR expression patterns of publicly available datasets helps to identify GPCRs highly expressed and, therefore, potentially involved in adipocyte function.
A variety of G protein-coupled receptors is differentially expressed in non-obese and obese individuals
Being excellent drug targets, GPCRs are also discussed for obesity treatment. Therefore, the identification of GPCRs regulated in AT of individuals with obesity and their characterization might offer new therapeutic options. Moreover, understanding their functionality in AT might broaden our knowledge about AT dysregulation in obesity. Here, we hypothesized that transcriptionally regulated GPCRs are essential for AT function. The above-mentioned RNA-seq datasets can be used for differential expression analysis of GPCRs under non-obese and obese conditions.
To obtain a comprehensive overview of significantly regulated GPCRs in individuals with obesity, we used differential gene expression analysis. Here, at least 27% (103) of GPCRs in human scAT, 6% (37) in mouse scAT and 32% (104) in mouse vAT were significantly regulated (Table 1; Figure S3). Following, we extracted those GPCRs, which were repeatedly differentially expressed (Figures 2A–2F; Table 1), prior filtering for synchronic regulation in all datasets (Figures 2G–2I). Only three GPCRs were significantly and synchronically regulated in all datasets (Adrb3, Ptgir, Ccr5). Two of these receptors have already assigned functions in AT and/or adipocytes (Adrb322 and Ptgir26) and Ccr5 has been described as an immune cell receptor.27 As these selection criteria made it difficult to detect GPCRs newly associated with AT function and obesity, we applied the following selection criteria: i) expression above a defined threshold (Table S3) in all datasets, ii) differential expression in at least one dataset between non-obese and obese samples, and iii) synchronic regulation in at least 50% of the other datasets. We found 106 GPCRs to fit these criteria. To further reduce the number of GPCRs for characterization we excluded receptors that were previously characterized in adipocytes or AT or GPCRs without known endogenous agonists. This selection process yielded 25 GPCRs with an unknown function in adipocytes. Besides Gpr146, three other GPCRs were chosen for further characterization: Mrgprf, Fzd5, and Ptger2 (Figures 2A–2F and 2J).
Table 1.
Analysis of differential GPCR expression in the discovery datasets of total AT
| Dataset | GPCRs with expression above threshold | tested groups | p < 0.05 | % of GPCRs expressed above threshold | compared datasets |
replicated GPCRs | non- replicated GPCRs |
|---|---|---|---|---|---|---|---|
| human_scAT_#1 | 259 | non-obese vs. obese | 117 | 45.17 | a) | n = 47 | n = 70 |
| human_scAT_#2 | 399 | non-obese vs. obese | 103 | 25.81 | a) | n = 47 | n = 56 |
| mouse_scAT_#1 | 215 | chow vs. HFD | 91 | 45.05 | b) | n = 27 | n = 64 |
| mouse_scAT_#2 | 202 | chow vs. HFD | 37 | 17.21 | b) | n = 27 | n = 10 |
| mouse_vAT_#1 | 229 | chow vs. HFD | 104 | 59.76 | c) | n = 67 | n = 37 |
| mouse_vAT_#2 | 209 | chow vs. HFD | 111 | 48.47 | c) | n = 67 | n = 44 |
GPCRs are described without olfactory receptors (OR). Annotated GPCRs showing a median expression above threshold (Table S3) were chosen for described group testing. GPCRs with significant regulation (p < 0.05; Wilcoxon rank test) were compared between indicated datasets (a, b, or c). The number of GPCRs, replicated or non-replicated between the compared datasets, is indicated. (see also Tables S1–S3, S6, and S7).
Figure 2.

GPCRs differentially regulated in species- and tissue matched-datasets of non-obese and obese individuals were compared to identify GPCRs of interest
(A–F) GPCRs differentially expressed in non-obese and obese individuals in human_scAT_#1 (A), mouse_scAT_#1 (B), mouse_vAT_#1 (C), human_scAT_#2 (D), mouse_scAT_#2 (E), and mouse_vAT_#2 (F) were analyzed for repeated differential regulation between species- and tissue-matching datasets. Given is the median.
(G–I) Following, replicated GPCRs were filtered for GPCRs with synchronic regulation between human scAT (G), mouse scAT (H), and mouse vAT (I).
(J) Four receptors (either highly expressed or differentially regulated) were chosen for further analysis. Receptor expression is shown as x-fold of the median expression of individuals with obesity over the median expression of non-obese individuals. Significant changes are determined using a Wilcoxon rank test. ∗p < 0.05; ∗∗p < 0.01; ∗∗∗p < 0.001. (see also Figure S2; Tables S1–S3, S6, and S7).
MRGPRF is probably activated by angiotensin III (AngIII) and Ang1-7,28 both generated by the proteolysis of angiotensin II (AngII), which are reported to be involved in regulating blood pressure and energy homeostasis.29 Because the presence of Ang1-7 in AT was already described,30 one can speculate that it may function via MRGPRF.
FZD5 activates Gq proteins upon Wnt5a stimulation.31 Because Wnt5a expression in adipocytes and serum levels are upregulated in individuals with obesity,32 an increased FZD5 activation may be involved in the pathogenesis of obesity.
PTGER2 is activated by its endogenous agonist prostaglandin E2 (PGE2) resulting in an increase of intracellular cAMP.33,34 PGE2 has been shown to have several effects on AT. It leads to reduced adipogenesis and fat mass through a paracrine mechanism showing a negative feedback loop with COX2 as well as to anti-inflammatory and pro-browning effects.35,36 Other prostaglandin receptor subtypes, such as PTGER3/EP3 and PTGER4/EP4, have been shown to mediate these effects of PGE2.37,38,39,40 However, the involvement of PTGER2 has not yet been investigated.
Taken together, we identified three GPCRs (Mrgprf, Fzd5, Ptger2) differentially expressed in AT of non-obese and obese individuals, which have not been characterized in AT function and obesity yet.
Gpr146, Fzd5, Mrgprf, and Ptger2 are expressed in adipocytes
Bulk RNA-sequencing of whole tissue is a helpful tool to analyze gene expression profiles and to identify genes of interest. However, since AT consists of different cell types, it is necessary to confirm the expression of the chosen receptors in adipocytes.
Therefore, we showed that Gpr146, Mrgprf, Fzd5, and Ptger2 are expressed in human subcutaneous adipocytes (scAdipocytes), mouse scAdipocytes, and mouse visceral adipocytes (vAdipocytes) of lean individuals using RNA-seq datasets (Figures 3A–3C). Furthermore, we analyzed their expression in mouse primary (pre)adipocytes and found all of them expressed at increased levels in adipocytes compared to preadipocytes (Figures 3D and 3E; Table S4). For further characterization of Gpr146, Mrgprf, Fzd5, and Ptger2 in adipocyte function, we used 3T3-L1 cells, an established cell line with adipogenic potential. All four receptors were found to be expressed in both, pre- and adipocyte state (Figure 3F; Table S5). Gpr146, Fzd5, and Ptger2 were upregulated in 3T3-L1 adipocytes compared to 3T3-L1 preadipocytes, however, Mrgprf showed a downregulation in contrast to primary cells.
Figure 3.

The GPCRs Gpr146, Fzd5, Mrgprf, and Ptger2 are expressed in (pre)adipocytes
(A–C) Expression of receptors well-characterized in AT (Adrb1, Adrb3) and GPCRs of interest were investigated in RNA-seq datasets of primary human scAdipocytes (A), as well as primary mouse scAdipocytes (B) and vAdipocytes (C).
(D–F) Furthermore, receptor expression was analyzed by qPCR in primary (pre)adipocytes of mouse scAT (D) (n = 3–6, Actb: Ct = 20.8 ± 0.99) and vAT (E) (n = 3–6, Actb: Ct = 17.69 ± 0.90) as well as in 3T3-L1 (pre)adipocytes (F) (n = 5, Actb: Ct = 15.53 ± 0.22). All four GPCRs are expressed in primary as well as 3T3-L1 (pre)adipocytes. dCT values are described in Table S4 (D and E) and in Table S5 (F). Given is the mean ± SEM of biological replicates. Significant expression changes were tested using a paired Student’s t test. ∗p < 0.05; ∗∗∗p < 0.001. (see also Tables S4 and S5).
Our results demonstrate, that the GPCRs, Gpr146, Mrgprf, Fzd5, and Ptger2, are expressed in adipocytes and that the 3T3-L1 cell line is suitable to characterize their function in adipocytes.
Only GPR146 and PTGER2 show G protein-coupling properties in a heterologous expression, none of them in 3T3-L1 (pre)adipocytes
Although for all four chosen receptors agonist activation and/or the corresponding G-protein pathway have been described, some of the results are controversially discussed, such as GPR146 stimulation by C-peptide.24 Therefore, we initially characterized the signal transduction pathways of the mouse receptors with and without agonist stimulation in a heterologous expression system.
First, we showed that all four receptors can be overexpressed in HEK293T cells (Figure 4A). However, only MRGPRF, FZD5, and PTGER2 showed robust cell surface expression (Figure 4B), while GPR146 was mainly localized in endosomes (Figure 4C). Interestingly, by adding the N-terminal sequence of P2Y12, a method previously used to improve expression and cell membrane localization,41,42,43 we could increase the receptor amount localized at the cell surface, however, we still detected endosomal localization (Figures 4A–4C). Second, we investigated the signal transduction properties analyzing Gs-protein- (Figures 4D and 4E), Gi-protein- (Figures 4D, 4E, and 4G), and Gq-protein (Figures 4F–4I) coupling. Surprisingly, we did not observe FZD5 activation by Wnt5a and MRGPRF activation by AngIII/Ang1-7. Moreover, we did not detect any constitutive activity of both receptors in our assays. Interestingly, for GPR146 we detected a slight reduction of intracellular cAMP (Figure 4E) correlating with increasing receptor amount. Using an independent experiment we measured an increased dissociation of Gαi and Gβγ protein in a BRET assay (Figure 4G) again correlating with increasing receptor amount. Increasing total and cell surface expression of GPR146 using a CMV promoter (pcDNA3.1 vector) (Figures 4A and 4B), we found increased constitutive Gi-protein coupling (Figures 4E and 4G). As expected, PTGER2 showed constitutive and PGE2-/Taprenepag-stimulated activation of the Gs protein-signaling pathway (Figures 4D and 4E).
Figure 4.

The G protein-coupling properties of the chosen receptors were evaluated in HEK293T
(A) Before analyzing G protein-coupling properties, we evaluated the expression of all GPCRs. Thereto, total expression was determined using a Sandwich ELISA and normalized to P2Y12 expression (OD492nm = 1.03 ± 0.26; n ≥ 3).
(B) Cell surface expression was only detected for FZD5, MRGPRF, PTGER2, and P2Y12-GPR146. Expression values were normalized to P2Y12 (OD492nm = 2.42 ± 0.66; n ≥ 3).
(C) Immunofluorescence microscopy showed an endosomal localization of GPR146 and P2Y12-GPR146 (scale bar: 20 μm).
(D) Intracellular cAMP levels were determined and normalized to mock-transfected cells. TSHR and P2Y6 were used as positive controls for Gs and Gi activation, respectively.
(E) Changes in basal cAMP accumulation were determined by transfecting increasing amounts of plasmid DNA encoding the indicated receptor and normalized to mock-transfected cells (n ≥ 3, ccAMP = 0.97 ± 0.19 nM). While a potential increase in cAMP is indicative for Gs-protein activation, decrease of cAMP points toward coupling to Gi proteins.
(F) To test for Gq activation after receptor stimulation, a Gq-BRET sensor was co-transfected with the indicated receptor DNA, however, no Gq dissociation was detected (n ≥ 2).
(G) To replicate the previously measured constitutive Gi coupling of GPR146 and P2Y12-GPR146, constitutive Gi-protein dissociation was measured after transfecting a Gi-BRET sensor together with increasing amounts of plasmid DNA using pcDps and pcDNA3.1(−) vectors (n ≥ 5).
(H) Accordingly, constitutive Gq coupling was assessed for all receptors (n = 6).
(I) As G-protein dissociation measured via BRET only indicates but does not prove G-protein activation, we measured Ca2+ influx after stimulation and found no activation (shown is a representative experiment). 100 μM ATP was used as positive control to assess endogenous Ca2+ mobilization. Shown are either mean ± SEM (A, B, D, E, F, G, H) or mean ± SD (F and I) of the indicated numbers of independent experiments. Stimulation was performed with: 200 ng/mL Tsh, 10 μM UDP, 26.31 nM Wnt5a, 1 μM AngIII, 1 μM Ang1-7, 100 nM PGE2, 20.8 nM Taprenepag (Tap). Significant expression changes were tested using a paired Student’s t test (E) or multiple t-test (H). ∗p < 0.05.
Taken together, GPR146 shows constitutive Gi protein-coupling and is mainly localized in endosomes but is also found at the plasma membrane. PTGER2 can activate the Gs protein-signaling pathway constitutively and after stimulation.
As the G-protein composition varies between different tissues and cell types, and thereby, influences the signal transduction properties, we also analyzed agonist-stimulated FZD5, MRGPRF, and PTGER2 signaling endogenously expressed in 3T3-L1 (pre)adipocytes. We confirmed our previous data for FZD5 and MRGPRF indicating no activation of these receptors by Wnt5a and AngIII/Ang1-7, respectively (Figures 4D–4I and S4A–S4C). Furthermore, we only detected PGE2-, but not Taprenepag-mediated cAMP accumulation in 3T3-L1 preadipocytes indicating the stimulation of rather other members of the prostaglandin receptor family (Figure S4D; Table S5). The low expression of PTGER2 in 3T3-L1 (pre)adipocytes (Table S5) might result only in subtle changes of cAMP accumulation as Taprenepag stimulation was not detectable here.
Due to a lack of suitable agonists for the stimulation of the chosen receptors, we decided to analyze receptor function in 3T3-L1 (pre)adipocytes using siRNA-mediated knockdown.
Knockdown of Gpr146, Fzd5, Mrgprf, and Ptger2 impairs adipogenesis in 3T3-L1 cells
During the differentiation of preadipocytes to adipocytes, the expression of several genes is changing, such as adipogenesis regulators as well as many GPCR genes. First, we analyzed the expression of the selected receptors each day during differentiation and observed two expression patterns. Fzd5 and Mrgprf showed a steady downregulation, whereas Ptger2 and Gpr146 were highly upregulated, peaking at day 4 of differentiation (Figures 5A–5D).
Figure 5.

Receptor knockdown prior to start of differentiation affects 3T3-L1 adipogenesis
(A–D) Receptor expression was analyzed during 3T3-L1 differentiation every other day showing two distinct expression patterns for (A) Fzd5 (n = 3, D0: dCt = 8.72 ± 0.70) and (B) Mrgprf (n = 4, D0: dCt = 5.10 ± 0.16) as well as (C) Ptger2 (n = 4, D0: dCt = 13.89 ± 0.19) and (D) Gpr146 (n = 4, D0: dCt = 8.10 ± 0.27). Given is the mean ± SEM of the relative expression normalized to the expression prior to differentiation induction (D0). ΔCt values were calculated relative to Actb (Ct = 16.02 ± 0.13).
(E) Lipid accumulation was measured in 3T3-L1 adipocytes after receptor knockdown in preadipocytes conducted four days prior to the induction of differentiation using Oil red O (ORO). Microscopic analysis implies a reduced lipid droplet size and count (scale bar: 50 μm).
(F) Eluted ORO confirmed reduced lipid accumulation after receptor knockdown for all four receptors. Data were normalized to control-transfected cells (OD500nm = 0.40 ± 0.03, n ≥ 4).
(G) While Ptger2 knockdown led to an increased droplet number, knockdown of the other receptors reduced it (n ≥ 3). Data were normalized to control-transfected cells (nlipid droplets = 6910.8 ± 925.9).
(H) The average droplet size (n ≥ 3) was decreased after receptor knockdown.
(I) The droplet size distribution (n ≥ 3) showed a shift from larger (120–240 μm2) toward smaller (0–120 μm2) droplets after knockdown of Mrgprf and Ptger2.
(J) Measuring the expression of the adipogenic marker Pparg after receptor knockdown prior to differentiation, we detected two different expression patterns leading to reduced Pparg expression at day 2 or 4 (D2, D4) (n ≥ 4). Data are normalized to Pparg expression of control-transfected cells (ΔCt = 8.29 ± 0.21). ΔCt values were determined relative to Actb expression (Ct = 15.08 ± 0.20).
(K) cAMP accumulation was reduced by knockdown of Mrgprf and Ptger2 implying coupling to Gs protein in 3T3-L1 cells (n = 7–8). For control purposes, cells were stimulated with 10 μM isoprenaline (Iso). Data are normalized to non-stimulated cAMP levels in control-transfected cells (ccAMP = 1.24 ± 0.43 nM). Shown is the mean ± SEM of the indicated number of independent experiments. Statistical significance was identified using a paired Student’s t test (F – H, K) or a two-way ANOVA (I, J). ∗p < 0.05, ∗∗p < 0.01, ∗∗∗p < 0.001. (see also Figure S4).
Second, applying siRNA-mediated knockdown in preadipocytes, we analyzed the impact of partial receptor loss (Figure S4E) on adipogenesis by measuring lipid accumulation after differentiation into 3T3-L1 adipocytes. Here, the knockdown of all four receptors resulted in a significantly reduced lipid accumulation (Figures 5E and 5F). Additionally, lipid droplet number and average droplet size were reduced after Fzd5, Mrgprf, and Gpr146 knockdown (Figures 5G and 5H) indicating a severe impairment of adipogenesis. In-depth analysis revealed no differences in droplet size distribution after knockdown of Fzd5 and Gpr146, while knockdown of Mrgprf resulted in significantly smaller droplets, underlining its impact on adipogenesis (Figure 5I). Reduced amounts of Ptger2 also resulted in a lowered average droplet size, however, droplet number was increased, pointing more toward a delayed adipogenesis (Figures 5G and 5H), which was confirmed analyzing droplet size distribution (Figure 5I). To investigate the impact of receptor knockdown on adipogenesis in more detail, we measured the expression of the adipogenic marker Pparg during differentiation (Figure 5J). Again, we found two different expression patterns: Ptger2 and Gpr146 knockdown cells tended toward a slight downregulation of Pparg after day 4 of differentiation. After silencing Fzd5 and Mrgprf the reduction in Pparg was more prominent and started already at day 2 of differentiation. As cAMP is known to be a major driver in adipogenesis, we measured cAMP accumulation in preadipocytes after knockdown (Figure 5K) and found reduced cAMP levels after Mrgprf and Ptger2 silencing, while no differences were detected after Fzd5 and Gpr146 knockdown. The knockdown of all four receptors leads to an impaired adipogenesis via the Pparg axis. Additionally, knockdown of Mrgprf and Ptger2 is accompanied by reduced cAMP levels, which might be responsible, at least partly, for the reduced adipogenesis.
Receptor knockdown influences 3T3-L1 (pre)adipocyte viability
Besides modulating adipocyte-specific functions, G-protein pathways are also involved in cellular viability by regulating e.g., apoptosis.44 As this directly affects adipogenesis and, thereby, adipocyte function, we tested the impact of receptor knockdown in 3T3-L1 (pre)adipocytes on vitality.
Here, we determined ATP levels, an indicator for proliferation and cytotoxicity, in 3T3-L1 preadipocytes and found significantly reduced levels after Ptger2 and Mrgprf knockdown (Figure 6A). Accordingly, we also found a trend towards reduced cell numbers in Ptger2 and Mrgprf knockdown cells (Figure 6B). As this could be caused by lower proliferation or increased cell death, we determined apoptosis and necrosis rate by staining with AnnexinV and propidium iodide, respectively. As shown in Figure 6C, apoptosis was increased by all siRNAs (Figure 6C), and necrosis by siFzd5 and siPtger2 (Figure 6D). This data shows that receptor knockdown had an impact on cellular viability, which might influence adipogenesis.
Figure 6.

Receptor knockdown affects cell viability and adipocyte function
(A) Four days after receptor knockdown, cell viability was analyzed in 3T3-L1 preadipocytes by the determination of ATP amount (n ≥ 3). Data were normalized to luciferase activity in control-transfected cells (320,874 ± 59,167 RLU).
(B) Cell number was determined by counting cell nuclei after staining with Hoechst33342 (n ≥ 4).
(C and D) (C) Apoptosis and (D) necrosis are affected by knockdown of all receptors demonstrating an influence on cell viability (n ≥ 4). Data are given relative to total cell count.
(E) Furthermore, we investigated the impact of receptor knockdown two days prior to full differentiation on cell viability of 3T3-L1 adipocytes by determining ATP amount (n ≥ 3). Data were normalized to luciferase activity of control-transfected cells (405,133 ± 111,865 RLU).
(F) Cell number was determined by counting Hoechst33342-stained cell nuclei (n ≥ 4).
(G) Apoptosis rate was measured by Caspase activity and is given relative to control-transfected cells (n = 4, siNC: 36,741 ± 8,406 RFU).
(H) Necrosis rate was assessed by PI-staining and is given relative to total cell number (n ≥ 4).
(I) Accumulation of cAMP was not affected by receptor knockdown two days prior to full differentiation (n ≥ 4). Data are normalized to non-stimulated control-transfected cells (ccAMP = 2.09 ± 0.20 nM). For control purposes, cells were also stimulated with 10 μM isoprenaline (Iso).
(J) Adiponectin secretion was reduced after Mrgprf knockdown (n = 4) but not impaired by knockdown of the other receptors. Data were normalized to adiponectin secretion of control-transfected cells (siNC: cAdiponectin = 0.36 ± 0.08 ng/μL).
(K) Lipolysis was determined by measuring free glycerol and was increased after Gpr146 knockdown (n = 4). Given is the mean ± SEM of biological replicates. Significant changes were tested using a paired Student’s t test. ∗p < 0.05, ∗∗p < 0.01, ∗∗∗p < 0.001, ∗∗∗∗p < 0.0001. (see also Figure S4).
Due to the limitations of preadipocyte knockdown regarding differentiation and cell viability, we silenced the selected GPCRs two days prior to maturity to analyze the effect of receptor knockdown onto adipocyte function, which did not influence lipid accumulation (Figures S4F and S4G). Furthermore, the impact onto cellular viability was much less pronounced compared to knockdown prior to differentiation (Figures 6E–6H). We only detected a reduced ATP amount after Mrgprf knockdown (Figure 6E) and a lowered apoptosis after silencing Mrgprf and Ptger2 (Figure 6G). We, therefore, used this approach for investigating receptor function in 3T3-L1 adipocytes.
Since adipocyte function is often connected to changes in cAMP level, we measured basal cAMP levels in 3T3-L1 adipocytes after knockdown and found no differences (Figure 6I). Without an appropriate stimulus and by only reducing the receptor number, changes in cAMP levels especially in adipocytes, where cAMP levels are elevated, are difficult to detect with GPCRs of low constitutive activity. Making use of signal amplification, we investigated adipocyte functions downstream of cAMP after receptor knockdown. Two of these downstream effectors, already known to be regulated by Gαs coupling of beta-adrenergic receptors, are adiponectin secretion45,46 and lipolysis.47,48 Isoprenaline-mediated reduction of adiponectin secretion was observable in all conditions. Furthermore, reduction of basal adiponectin secretion was only found after Mrgprf knockdown (Figure 6J). Lipolysis was also induced by isoprenaline, as well as by the silencing of Gpr146 (Figure 6K).
Taken together, we demonstrate that all four analyzed GPCRs influence cell viability of 3T3-L1 preadipocytes, which might contribute to the reduced adipogenesis. For Mrgprf and Gpr146 knockdown we also found a function in mature adipocytes with MRGPRF being essential for 3T3-L1 adipocytes viability and adiponectin secretion and while Gpr146 knockdown increased lipolysis.
Discussion
Over the last decade, a rising amount of publicly available RNA-seq data of different cells and tissues from various species has been generated. This should be a valuable resource for generating and testing scientific hypothesis leading to the discovery of new factors associated with distinct functionalities. To facilitate the analysis of publicly available AT RNA-seq datasets, we provide an interactive webtool specifically focusing on human and mouse white AT and primary adipocytes. In these data, users can perform comparisons of groups, query genes of interest and correlate across all annotated human and mouse genes (manual in Data S1). From the available annotated experimental variables users of our database can analyze subgroups of patients or mice with different body weight or BMI and test batch effects. Comparisons of two groups of samples defined can be performed employing two-sided Wilcoxon rank tests and FDR-control to discover variables that differentiate both groups (Figure 2; Tables 1 and S1). For correlating continuous variables, such as expression of two genes, Spearman’s correlation can be used. Hence, the database allows biomarker discovery and replication across different RNA-seq cohorts of adipose tissues.
Since it is well-established that GPCRs are highly expressed and play a major role in the regulation of AT function,19,49 we hypothesized that using our web interface we can identify novel GPCRs required for proper AT function. To ensure that the conducted analyses are not influenced by dataset heterogeneity and, thereby, prevent false positive results, we used two separate datasets per species and tissue with a comparable GPCR expression pattern (Figure S2; Table S2). Searching the AT gene expression data, we discovered highly expressed and/or significantly regulated GPCRs in obesity. Demonstrating the reliability of our analysis, we find a large overlap with previously published expression data regarding highly expressed GPCRs.19 However, we also observed considerable differences in the number of regulated GPCRs indicating that the analysis of more than one dataset is advisable. 32–36% of significantly and synchronically regulated GPCRs were repeatedly differentially expressed in human scAT, 30–73% in mouse scAT, and 58–64% in mouse vAT (Table 1) corroborate our resulting candidate gene list. In line with this, several of these GPCRs have already been analyzed in AT or adipocyte function, for example ADRB3,50 ADR1A51, and FFAR2.52 Moreover, we also identified four receptors which were either highly expressed in AT (GPR146) or significantly regulated between non-obese and obese individuals (MRGPRF, FZD5, PTGER2) and have not been described in AT or adipocyte function, yet (Figure 2J). Because little is known about these GPCRs, some of them being orphan or having controversially discussed agonists, we further analyzed their signal transduction as well as their function in adipocytes using a siRNA-based approach in the model cell line 3T3-L1. It would also be interesting to observe the effects of receptor overexpression, however 3T3-L1 cells are known to be difficult to transfect.53 Nevertheless, we performed several attempts of 3T3-L1 with GPCR cDNA which all failed.
Although AngIII and Ang1-7 were discussed to be agonists,28 MRGPRF is still considered to be an orphan rhodopsin-like receptor. Accordingly, we were not able to induce the G-protein activation of MRGPRF following incubation with AngIII or Ang1-7 (Figures 4 and S4). In 3T3-L1 cells, Mrgprf knockdown reduced lipid accumulation and Pparg expression (Figure 5). Interestingly, it also reduced intracellular cAMP levels, which may explain the reduced adipogenesis. Since early differentiation is dependent on cAMP which has an inhibitory effect in late adipogenesis,54 the effects on Pparg expression in the beginning of the differentiation indicate a function in early adipogenesis. Furthermore, as loss of MRGPRF also had an effect on viability of 3T3-L1 preadipocytes and mature adipocytes (Figure 6). The observed reduction in basal adiponectin secretion might be caused by the reduced cell viability. Taken together, our data imply an important role of MRGPRF in adipogenesis and cell viability very likely by the modulation of intracellular cAMP. Since we were not able to show an activation by AngIII and Ang1-7, their effects on adipocyte beiging in AT,30 appear to be solely mediated by canonic angiotensin receptors.
FZD5 was described to activate Gq-protein signaling upon Wnt5a stimulation.31 Together with upregulated Wnt5a expression in adipocytes resulting in increased serum levels in obese humans and mice,32 this receptor seemed to be an excellent target for the modulation of adipocyte function within the context of obesity. Furthermore, FZD5 was already described to be regulated during adipogenesis.55 However, we did not detect any G-protein activation after the incubation of FZD5 with Wnt5a although we applied various methods including Ca2+ measurements comparable to the previous work31 (Figures 4 and S4). Lack of FZD5 due to siRNA-mediated knockdown in preadipocytes significantly impaired lipid accumulation and cell viability by increasing apoptosis and necrosis (Figure 6). Knockdown in differentiated adipocytes did not alter function and/or viability (Figure 6). Therefore, our data indicate a function for FZD5 in preadipocyte vitality and differentiation of preadipocytes to adipocytes rather than altering adipocyte function.
PTGER2, a Gs protein-coupled rhodopsin-like receptor, is activated by its endogenous agonist PGE233,34 as well as by the synthetic and subtype-specific agonist Taprenepag.56,57 Although the function of PGE2 in AT has been already extensively analyzed,58 the involvement of PTGER2 in any adipocyte function has not been studied yet. We did not observe Taprenepag-induced cAMP accumulation in 3T3-L1 (pre)adipocytes, most likely due to a low endogenous PTGER2 expression (Table S5). However, Ptger2 knockdown resulted in reduced cAMP accumulation in 3T3-L1 cells (Figure 5). In line with this, knockdown affected adipogenesis and we observed reduced lipid accumulation caused only by reduced droplet size. Additionally, Ptger2 expression was induced during differentiation (Figure 5) and upregulation of Pparg expression after receptor knockdown was impaired at the end of differentiation. These data indicate that PTGER2 is required for lipid droplet growth in the final part of adipogenesis.
The orphan rhodopsin-like receptor GPR146 was previously described to activate the cAMP/CRE signaling after serum stimulation.59 Investigating constitutive activity, we detected Gi-protein signaling (Figure 4) only after increasing expression and cell surface targeting by using a heterologous receptor N terminus, as GPR146 showed an endosomal localization when overexpressed in HEK293T (Figure 4). However, it needs to be noted that we did not analyze signal transduction after receptor activation. Lack of GPR146 results in reduced adipogenesis in 3T3-L1 cells shown by reduced lipid accumulation and Pparg expression. Furthermore, we found GPR146 to be involved in lipolysis, where Gpr146 knockdown leads to increased free glycerol without affecting adipocyte viability (Figure 6). A similar effect on lipid metabolism was shown for the adenosine-activated adenosine A1 receptor, a Gi protein-coupled receptor, downregulating lipolysis.60 Together with previous reports connecting GPR146 to plasma cholesterol regulation25,59 our data indicate an important role of GPR146 in energy homeostasis.
Conclusion
Here, we demonstrate that publicly available RNA-seq data can guide the identification of novel genes involved in regulating cell function. We used different sets of RNA-seq data to describe the GPCRome of AT in non-obese and obese condition and identified GPCRs required for adipocyte function. We analyzed the function of four receptors (MRGPRF, FZD5, PTGER2, GPR146) newly implicated in the function of AT and demonstrated that all receptors are necessary for proper adipogenesis while the constitutive activity of GPR146 is necessary for the regulation of lipolysis.
Limitations of the study
While our study aims at the identification and functional characterization of highly expressed and differentially regulated GPCRs in non-obese and obese individuals, limitations are still present. Although it was of primary interest to identify receptors modulating adipocyte function, publicly available RNA-seq datasets allowing the comparison of adipocytes in non-obese and obese conditions could not be identified. Therefore, we took advantage of adipose tissue RNA-seq datasets. Furthermore, it would be of interest to include single-cell RNA-seq data, however, currently the sequencing depth is too low to identify lowly expressed genes such as GPCRs.
For functional analysis we took advantage of the mouse model cell line 3T3-L1 using a receptor knock-down approach. Receptor stimulation was not feasible due to the missing suitable agonist availability. To overcome this limitation, we tried a transient and constitutive overexpression of the GPCRs, however, 3T3-L1 transfection was not successful.
Finally, 3T3-L1 cells have a mouse origin, therefore, we cannot comment on the functional transferability to human (pre)adipocytes.
STAR★Methods
Key resources table
| REAGENT or RESOURCE | SOURCE | IDENTIFIER |
|---|---|---|
| Antibodies | ||
| Rat-anti-HA-POD | Sigma-Aldrich | 12013819001; RRID:AB_390917 |
| Mouse-anti-FLAG | Sigma-Aldrich | F1804; RRID:AB_262044 |
| Mouse-anti-HA | Sigma-Aldrich | H3663; RRID:AB_262051 |
| Goat-anti-mouse-IgG AF488 | Invitrogen | A11029; RRID:AB_2534088 |
| Chemicals, peptides, and recombinant proteins | ||
| Ang1-7 | Sigma-Aldrich | A9202 |
| AngII | Sigma-Aldrich | A9525 |
| AngIII | Sigma-Aldrich | 10385 |
| Annexin V, AF488 conjugate | AAT Bioquest | ABD-20092 |
| ATP | Sigma-Aldrich | A2383 |
| BSA | Sigma-Aldrich | A2153 |
| CaCl2 | Sigma-Aldrich | C3306 |
| Citric acid | Sigma-Aldrich | 251275 |
| Collagenase I | Worthington | LS004196 |
| Dexamethasone | Sigma-Aldrich | D4902 |
| DMEM | Gibco | 41966-029 |
| DTT | Sigma-Aldrich | 10197777001 |
| EDTA | Roth | 8043.2 |
| FKS | Gibco | 10270-106 |
| Formaldehyde | Roth | 4979.2 |
| Fura-2 AM | Sigma-Aldrich | 47989 |
| Furimazine | Promega | N1572 |
| Glucose | Sigma-Aldrich | G6152 |
| HCl | Roth | 9277-2 |
| HEPES | Sigma-Aldrich | H3375 |
| Hoechst33342 | Sigma-Aldrich | B2261 |
| IBMX | Sigma-Aldrich | I5879 |
| Insulin | Sigma-Aldrich | I6634 |
| Isoprenaline | Sigma-Aldrich | I6504 |
| KCl | Roth | 6781.2 |
| KHCO3 | Roth | P748.2 |
| Lipofectamin RNAiMAX | Invitrogen | 13778150 |
| Lipofectamine 2000 | Invitrogen | 11668-019 |
| MgCl2 | Sigma-Aldrich | M2670 |
| Na2HPO4 | Roth | 6781.2 |
| NaCl | Roth | 9265.2 |
| Na-Deoxycholate | VEB Berlin Chemie | 060574 |
| NH4Cl | Roth | 54701 |
| NP-40 | Sigma-Aldrich | 74385 |
| Oil Red O | Serva | 31170 |
| o-phenylenediamine | Sigma-Aldrich | P9029 |
| OptiMEM | Gibco | 31985-047 |
| PBS | Gibco | 14190-144 |
| Penicillin/Streptomycin | Gibco | 15140122 |
| PGE2 | Biomol | Cay10140-1 |
| Propidium-iodide | Invitrogen | P13041P |
| Rosiglitazone | Sigma-Aldrich | R2408 |
| Sodium tetraborat/HCl | Merck | 1.06303.1000 |
| Taprenepag | MedChemExpress | HY-14899 |
| Tris/HCl | Sigma-Aldrich | T3253 |
| Triton X-100 | Sigma-Aldrich | T8787 |
| Trypsin-EDTA (0,25%) | Gibco | 25200056 |
| Tsh | Sigma-Aldrich | T8931 |
| Tween-20 | Roth | 9127.1 |
| UDP | Tocris | 3111 |
| Wnt5a | Biotechne | 645-WN-010 |
| Critical commercial assays | ||
| Adiponectin Mouse ELISA Kit | Invitrogen | KMP0041 |
| AlphaScreen® cAMP Functional Assay | PerkinElmer | 6760635M |
| Apo-ONE® Homogeneous Caspase-3/7 Assay | Promega | G7790 |
| ATPlite Luminescence Assay System | PerkinElmer | 6016941 |
| Free Glycerol Reagent | Sigma-Aldrich | F6428 |
| Luna Universal qPCR Master Mix | New England Biolabs | M3003 |
| Platinum® SYBR-Green qPCR SuperMix-UDG | Invitrogen | 11733038 |
| ReliaPrep™ RNA Miniprep Systems | Promega | Z6012 |
| SuperScript II™ Reverse Transcriptase | Invitrogen | 18064071 |
| Deposited data | ||
| Data of GPCRome and differential gene expression analysis | Zenodo | https://doi.org/10.5281/zenodo.8272790 |
| Experimental models: Cell lines | ||
| 3T3-L1 cells | ATCC | CL-173™; RRID:CVCL_0123 |
| HEK293-T | ATCC | CRL-3216; RRID:CVCL_0063 |
| Experimental models: Organisms/strains | ||
| wild-type C57BL/6N | Charles River Laboratories | N/A |
| Oligonucleotides | ||
|
Non coding (siNC), rCrGrUrUrArArUrCrGr CrGrUrArUrArArUrArCrGrCrGrUAT |
Origene | SR30004 |
|
siFzd5, rGrCrArCrUrArArGrArCrGrGrArCrArArGrCrUrArGrArGAA |
Origene | SR417789, siRNA C |
|
siGpr146, rCrUrGrGrArCrArCrCrUrUrArCrUrArCrUrUrGrArGrCrCTG |
Origene | SR411161, siRNA B |
|
siMrgprf, rUrArArCrCrArGrGrArArUrGrArUr ArGrCrArUrCrCrArGrArGrCrA |
Origene | SR411548, siRNA A |
|
siPtger2, rArGrArUrGrArArArCrArGrArCrUrUrUrArUrGrArGrGrUAG |
Origene | SR412228, siRNA C |
| See Table S8 for utilized qPCR Primers | ||
| Recombinant DNA | ||
| HF-TshR-pcDps | this manuscript | - |
| HF-P2y6-pcDps | this manuscript | - |
| HF-Fzd5-pcDps | this manuscript | - |
| HF-Gpr146-pcDps | this manuscript | - |
| HF-P2y12-Gpr146-pcDps | this manuscript | - |
| HF-Mrgprf-pcDps | this manuscript | - |
| HF-Ptger2-pcDps | this manuscript | - |
| HF-Gpr146-pcDNA3.1(-) | this manuscript | - |
| HF-P2y12-Gpr146-pcDNA3.1(-) | this manuscript | - |
| Gq-CASE | Addgene | Plasmid #168125; RRID:Addgene_168125 |
| Gi3-CASE | Addgene | Plasmid #168122; RRID:Addgene_168122 |
| Software and algorithms | ||
| Celigo Imaging Cytometer | Nexcelom Bioscience | Celigo Imaging Cytometer |
| CFX Manager | Bio-Rad | N/A |
| GraphPad Prism | Graphpad | N/A |
| ImageJ 1.53q | Fiji | N/A |
| TILLvisION (version 4.0) | T.I.L.L. Photonics | N/A |
| Other | ||
| FATTLAS, a publicly available online database, for the analysis of RNAseq data of adipose tissue | this manuscript | https://tools.hornlab.org/FATTLAS/ |
| Comprehensive, high-quality and freely accessible set of protein sequences annotated with functional information | UniProt database | https://www.uniprot.org/ |
| Database for genomic data and annotation | Ensembl 109 Genome Browser | Ensembl 109 Genome Browser |
| Functional genomics data repository | Gene Expression Omnibus | https://www.ncbi.nlm.nih.gov/geo/ |
| human_scAT_#2 | Gene Expression Omnibus | GSE135134 |
| human_scAdipocytes | Gene Expression Omnibus | GSE110820 |
| Mouse_ scAT_#1 | Gene Expression Omnibus | GSE91067 |
| Mouse_ vAT_#1 | Gene Expression Omnibus | GSE91067 |
| Mouse_ scAT_#2 | Gene Expression Omnibus | GSE132706 |
| Mouse_ vAT_#2 | Gene Expression Omnibus | GSE132706 |
| Mouse_ vAdipocytes | Gene Expression Omnibus | GSE142187 |
| Mouse_ scAdipocytes | Gene Expression Omnibus | GSE168906 |
| Mouse_ vAdipocytes | Gene Expression Omnibus | GSE168906 |
Resource availability
Lead contact
Further information and requests for resources and reagents should be directed to and will be fulfilled by the lead contact, Doreen Thor (Doreen.Thor@medizin.uni-leipzig.de).
Materials availability
The receptor plasmids described in this study will be made available on request following the completion of a materials transfer agreement (MTA).
Experimental model and study participant details
Animals
Male, wild-type C57BL/6N (20 weeks of age) mice were bred under specific pathogen-free conditions, a 12:12 h light/dark cycle, at 21°C, and 55 % humidity. Mice had free access to food and water. Mice were kept on a regular chow diet (9 % kcal fat; ssniff Spezialdiäten). All experiments were conducted in accordance with European Directive 2010/63/EU on the protection of animals used for scientific purposes and were performed with permission from the Animal Care and Use Committee (ACUC #T19/18, #T08/21-MEZ) and the Government of the State of Saxony, Germany.
Cell culture
Mouse (pre)adipocytes were isolated from mice sacrificed by cerebral dislocation. After preparation of scAT and vAT, the fat pads were washed in cold PBS, chopped up, and transferred into 5 ml of sterile adipocyte isolation buffer (123 mM NaCl, 5 mM KCl, 1.3 mM CaCl2, 5 mM glucose, 100 mM HEPES, 1 % Pen/Strep, 4 % BSA, and 1 mg/ml collagenase I). To allow for collagenase digestion, AT was incubated at 37°C for 45 min shaking in a water bath (120 rpm). Undigested fat was removed by filtering (mesh size: 100 μm). After 5 min centrifugation at 1,000 rpm (Megafuge 16R, ThermoFisher Scientific), the supernatant containing the adipocytes was washed twice with PBS. The Stroma vascular fraction-containing cell pellet was resuspended in 2 ml erythrocytes lysis buffer (0.154 mM NH4Cl, 0.01 mM KHCO3, and 0.1 mM EDTA), incubated for 7 min at RT, centrifuged at 2,000 rpm for 4 min and washed twice with PBS.
HEK293T cells (female) were cultured in culture medium (DMEM supplemented with 10 % FBS, 100 U/ml penicillin and 100 μg/ml streptomycin) at 37°C and 5 % CO2 in humidified atmosphere. To achieve receptor overexpression, HEK293T cells were transiently transfected using Lipofectamine 2000. In brief, cells were seeded into the appropriate well format and after 24 h incubated with plasmid DNA and Lipofectamine 2000 following the manufacturer’s protocol.
3T3-L1 CL-173™ cells (male) were cultured and differentiated as previously described.61 In brief, 3T3-L1 cells were cultured in culture medium (DMEM supplemented with 10 % FBS, 100 U/ml penicillin and 100 μg/ml streptomycin) at 37°C in a humidified atmosphere (5 % CO2). Cell splitting was performed before confluence with a seeding density of 100,000 cells to 200,000 cells per T175 flask. For differentiation into mature adipocytes, 3T3-L1 cells were grown in culture medium until confluence. After two days, culture medium was replaced by differentiation medium (culture medium containing 1 μg/ml insulin, 0.25 μM dexamethasone, 0.5 mM IBMX, 2 μM rosiglitazone). Three days later, the media was changed to culture medium containing 1 μg/ml insulin for another three days. Afterwards, cell culture medium was changed every other day. On day 10, differentiation to mature adipocytes was completed.
Method details
Collection and reprocessing of RNA-seq data
Publicly available RNA-seq data of bulk AT as well as of primary adipocytes of mice and humans were collected from the NCBI GEO database (Tables S6 and S7). Further, a previously published dataset was provided by Center for Pediatric Research Leipzig.11,12 Datasets were chosen based on the following selection criteria: group size (for bulk analysis ≥8/group, for adipocytes ≥3/group), non-obese/obese status of individuals, and for mouse datasets the availability of data for scAT and vAT, for human only scAT. To obtain comparable datasets, we chose quantified, normalized gene expression data (FPKM, RPKM, TPM) when available. In case of raw sequencing data, those were re-processed to perform quantification and normalization (Tables S6 and S7). Reprocessing of raw sequencing data in the fastq format was performed using kallisto version 0.45.162 on Ensembl v96 transcriptomes. Gene expression in transcripts per million mapped reads (TPM) per gene was obtained using the annotation of transcripts to genes provided by kallisto in the Mus_musculus.GRCm38.96.gtf and Homo_sapiens.GRCh38.96.gtf files. The retrieved processed data of gene expression levels were combined with available, corresponding metadata. Each dataset comprised of tabular numerical continuous quantitative data and an initially separate tabular annotation of metadata. Both were merged for presentation in the webtool with analysis and download options.
The interactive webtool FATTLAS was implemented in R (version 4.3.1) using the library shiny and R functions for e.g., plotting (library ggplot2), Spearman correlation (function cor.test), Wilcoxon rank tests for group comparisons (function wilcox.test), ANOVA (function aov) and k means (library NbClust). Users can select tissues and genes of interest for analysis to obtain figures and tables, e.g., projections of gene co-expression and custom statistical comparisons of tissue specific-expression. A manual describing the use of FATTLAS in this publication can be found in supplemental information (Data S1). Furthermore, some analysis options which were not used here, are built in, such as linear regression and survival analysis (libraries epitools, survival, survminer).
Extraction of GPCR and OR genes and expression data
We extracted all GPCR and OR gene names and synonyms using Uniprot database63 and Ensembl 109 Genome Browser.64 After matching the gene synonyms to gene names in each dataset, we extracted all GPCR and OR expression data for further analysis. A list of all GPCRs and ORs expressed in the datasets can be found in the following repository: https://doi.org/10.5281/zenodo.8272790.
Comparability of RNA-seq data sets
To verify the comparability of two RNA-seq datasets, species- and tissue subtype-matched subcohorts of all datasets were divided into weight groups. The median per gene was calculated, analyzing human and mouse GPCRs, respectively. Subsequently, the percentage of GPCR expression in every subcohort was calculated by dividing the median of each GPCR gene per subcohort by the sum of all GPCR medians per subcohort. After plotting the percentage of GPCR expression of species-, tissue subtype- and weight group-matched subcohorts, the correlation between GPCR expression was calculated using Pearson correlation (Table S2).
Differential gene expression analysis of GPCR
To identify GPCR gene expression changes associated with obesity, we analyzed published datasets from various RNA-seq experiments of bulk AT with phenotypic data related to obesity (Tables S6 and S7). First, human and mouse datasets were divided into adipose depots (scAT and vAT), before those subcohorts were sorted into weight groups (BMI-SDS <1.88 vs BMI-SDS ≥1.88; BMI <30 vs BMI ≥30; chow vs HFD). Two-sided Wilcoxon rank tests were performed comparing both groups processing all annotated genes. Besides p-values calculation conservative correction for multiple tests also yielded Bonferroni-corrected q-values, and FDR-corrected q-values, which were computed by applying the function p.adjust in R using the fdr method. Following, all GPCRs expressed in each dataset were extracted before filtering for all GPCRs expressed above a predefined threshold (Table S3). The threshold of each dataset was determined by calculating the median of all transcripts per sample and averaging all median/sample of each dataset.65 A manual describing how to use the webtool can be found in the supplemental information (Data S1). A list describing all differentially expressed GPCRs can be found in the following repository: https://doi.org/10.5281/zenodo.8272790.
RNA extraction and real-time quantitative-PCR
After washing with PBS, cells were harvested using BL-TG buffer. RNA isolation was performed according to the manufacturer’s instructions (ReliaPrep™ RNA Miniprep Systems, Promega). Reverse transcription was executed using SuperScript II™. For quantitative PCR, Platinum® SYBR-Green qPCR SuperMix-UDG or Luna Universal qPCR Master Mix were added to 10 ng cDNA and 1.2 μM primer mix. Measurements were conducted with the CFX Connect™ Real-Time PCR Detection System (Bio-Rad). Data were normalized to beta-actin (Actb) which served as recommended housekeeping gene.66 Only primers with a duplication efficiency of E=1.9-2.1 were considered for analysis.
Cell surface and total expression
After overexpression of GPCRs tagged with an HA- and FLAG-tag in HEK293T cells, cell surface expression was measured with an ELISA. Cells were fixed with 4 % formaldehyde for 20 min at room temperature before blocking for 1 h at 37°C. Then, cells were incubated with anti-HA-POD antibody (1:1000) for 1 h at room temperature. Blocking and antibody dilution were done in DMEM supplemented with 10 % FBS, 100 U/ml penicillin and 100 μg/ml streptomycin. Cell surface expression was analyzed using o-phenylenediamine solved in substrate buffer (0.1 M citric acid, 0.1 M Na2HPO4) containing 0.2 % H2O2. The reaction was stopped after 2-10 min with 1 M HCl. OD readings were recorded at 492 nm using the Sunrise microplate reader (Tecan) and normalized by subtracting background readings.
Total expression was measured by detaching cells with dH2O and pelletizing. Cell pellets were lysed using lysis buffer (10 mM Tris/HCl, 150 mM NaCl, 1 mM DTT, 1 mM EDTA, 0.2 mM Na-Deoxycholate, 1 % NP-40) and incubated overnight at 4°C while shaking. Additionally, anti-FLAG (10 μg/ml) diluted in coating buffer (0.15 M sodium tetraborate/HCl in H2O; pH 8.0) was incubated in a 96-Well-Maxi-Sorb plate (Thermo Fisher Scientific) shaking overnight at 4°C. The next day the Maxi-Sorb plate was blocked for 1 h at 37°C in DMEM supplemented with 10 % FBS, 100 U/ml penicillin and 100 μg/ml streptomycin. Following, the solubilizate was centrifuged (10 min, 13,000 rpm) before removing the supernatant and adding PBS-T thereto. After the solubilizate was incubated for 1 h at 37°C in the Maxi-Sorb plate, anti-HA-POD (1:1000) was added for 1 h at room temperature. Detection was done simultaneously to cell surface expression ELISA.
Immunofluorescence
After seeding HEK293T cells on poly-L-lysine coated glass coverslips (12 mm diameter) and co-transfecting them with pReceptor and pRab5-Venus (1:1) cells were fixed with 4 % formaldehyde for 20 min at room temperature before a 10 min permeabilization with 0.5 % Triton X-100 and blocking for 1 h at 37°C. Then, cells were incubated with primary anti-HA (1:400) for 2 h at room temperature. Afterwards, the secondary AF488-labeled antibody (1:500) was added and incubated for 1 h at room temperature before staining the nuclei with Hoechst33342 (1 μg/ml in PBS) for 20 min. Blocking and antibody dilution was done in DMEM supplemented with 10 % FBS, 100 U/ml penicillin, and 100 μg/ml streptomycin. Following cells were mounted on slides and measured with the LSM 510 META confocal microscope (Carl Zeiss).
Determination of GPCR activity
As Gs-protein coupling increases and Gi-protein coupling decreases intracellular cAMP levels, we measured cAMP accumulation to detect constitutive or stimulated receptor activity. Thus, cells were washed in serum-free DMEM containing 1 mM IBMX and further incubated for 60 min at 37°C in serum-free DMEM containing 1 mM IBMX and the respective compounds (10 μM Isoprenaline, 200 ng/ml Tsh, 10 μM UDP, 26.31 nM Wnt5a, 1 μM AngII, 1 μM AngIII, 1 μM Ang1-7, 100 nM PGE2, 20.8 nM Taprenepag). Following, cells were lysed using LI buffer (5 mM HEPES, 0.3 % Tween-20, 0.1 % BSA, and 0.5 mM IBMX). The amount of cAMP was determined using the AlphaScreen® cAMP Functional Assay according to the manufacturer’s protocol using the EnVision 2105 Multimode Plate Reader (PerkinElmer).
To determine the dissociation of Gα and Gβγ using BRET cells co-transfected with pReceptor and pBRET (1:1) were serum-starved overnight, washed with HBSS and incubated with 1000x dilution of furimazine stock solution. After incubation for 5 min at room temperature, the BRET ratio was measured in two consecutive reads. To assess GPCR ligand-induced changes in G-protein BRET, four basal reads were followed by addition of ligand solutions or vehicle control and subsequent BRET reads to detect ligand-induced changes in BRET. To analyze constitutive receptor activity we transfected a stable concentration of pBRET and increasing concentrations of pReceptor before measuring BRET dissociation without stimulation over 25 reads. All experiments were conducted with the EnVision 2105 Multimode Plate Reader (PerkinElmer). Nluc emission intensity was selected using a BRET Deep Red 647/75 nm and cpVenus173 emission using a NanoBRET Blue 460/80 nm. Data analysis was calculated as described by Schihada et al.67. In brief, BRET ratios (acceptor emission/donor emission) were calculated and the basal BRET ratios (Ratiobasal) were averaged before ΔBRET was calculated as percent over basal (Ratiostim-Ratiobasal/Ratiobasalx100). Following, the average ΔBRET of vehicle control was subtracted (corr. ΔBRET). For constitutive activity, Nluc intensity of one time point of at least five independent experiments was plotted over the corresponding BRET ratios, fitted using a linear fit, and tested for deviation from linear correlation applying runs test (p < 0.05). The resulting Y-intercept was defined as BRET0. Significance was tested using student’s t-test.
For imaging of Ca2+, HEK293T cells were seeded on poly-L-lysine coated glass coverslips (12 mm diameter) in a 24-well plate and transfected thereafter. One day post transfection, coverslips were transferred into a new 12-well plate, where cells were loaded with 5 μM fura-2 AM dissolved in standard bath solution (140 mM NaCl, 10 mM HEPES, 5 mM KCl, 2 mM CaCl2, 1 mM MgCl2, and 3 mM glucose, pH 7.4) for 60 min at 20°C–22°C. After loading, the coverslip was transferred to a perfusion chamber (Warner Instruments) mounted on an upright microscope (Olympus BX51WI). Cells were visualized using a 20x water immersion objective (UMPlanFl, Olympus), perfused with standard bath solution and stimulated by adding the agonists (26.31 nM Wnt5a, 1 μM AngII, 1 μM AngIII, 1 μM Ang1-7, 100 nM PGE2, 20.8 nM Taprenepag) to standard bath solution. After application of different receptor agonists, cells were stimulated with 100 μM ATP to obtain endogenous Ca2+ signals. Fura-2 AM-based Ca2+ imaging was performed using a monochromator-based imaging system and the imaging software TILLvisION 4.0 (both T.I.L.L. Photonics). Emitted fluorescence at 510 nm (excited at 340 nm and 380 nm) was collected with a CCD camera (PCO Imaging), acquired at intervals of 2 s and corrected for background fluorescence.
siRNA-mediated knockdown
To reduce the mRNA levels of our GPCRs of interest in 3T3-L1 we used a siRNA-mediated knockdown approach. For knockdown in preadipocytes, 0.216 μl siRNA (5 μM) was pre-incubated with 17.89 μl Opti-MEM and 0.18 μl RNAiMAX per well (96-well plate) for 20 min at 37°C in a humidified atmosphere (5 % CO2). 9.000 cells were added in 90 μl Opti-MEM. The following day 100 μl culture medium was added. Day 4 after seeding was set as day 0 of differentiation. Control siRNA did not interfere with 3T3-L1 differentiation.61 Knocking down on day 8 of differentiation 35 μl Opti-MEM, 0.18 μl RNAiMax and 0.216 μl siRNA (5 μM) were incubated for 20 min at room temperature before adding the mixture to the cells. Culture medium (100 μl) was added 6 h post transfection.
Adipocyte staining and droplet analysis
After differentiation of 3T3-L1 fibroblasts to mature adipocytes, cells were fixed in 10 % formaldehyde/PBS in two incubation steps (5 min and 1 h) and subsequently washed with 60 % isopropanol. Oil Red O (ORO) stock solution was prepared by solving 3.5 g/l ORO in isopropanol and stored at 4°C. The working solution was prepared freshly before usage by diluting the stock solution in dH2O 60:40, incubation at RT for 20 min, and filtering (mesh size: 0.2 μm) resulting in a final concentration of 2.1 g/l ORO. For staining, fixed cells were incubated with fresh working solution of ORO for 10 min. After incubation, cells were immediately washed four times with tap water. Pictures were taken using Keyence bz-x800_long (Keyence) and further analyzed using ImageJ, modifying an approach described before by Deutsch et al.68 Elution of ORO was carried out by adding isopropanol and short incubation at RT while pipetting up and down. OD values were measured at 500 nm using the Sunrise™ photometer (Tecan).
Detection of cell viability and cell number
ATP levels were measured in 96-well plates three days post transfection in 3T3-L1 preadipocytes and two days post transfection in 3T3-L1 adipocytes according to manufacturer’s protocol (ATPlite) using the EnVision 2105 Multimode Plate Reader (PerkinElmer).
Staining for apoptosis, necrosis, and nuclei were detected in 96-well plates three days post transfection in 3T3-L1 preadipocytes and two days post transfection in 3T3-L1 adipocytes. Thereto, cells were incubated for 20 min with AnnexinV, Propidium-iodide (1 μg/ml), and Hoechst33342 (1 μg/ml) before taking images and analyzing them using the Celigo Image Cytometer (Nexcelom Bioscience). Apoptosis in adipocytes was detected with Apo-ONE® Homogeneous Caspase-3/7 Assay instead of AnnexinV according to manufacturer’s instructions.
Analysis of adipocyte function
Secretion of adiponectin was analyzed in fully differentiated 3T3-L1 cells, which were serum-starved overnight and stimulated for 24 h with or without 10 µM isoprenaline. Secretion rate was obtained measuring total adiponectin amount in the supernatant using a mouse adiponectin ELISA kit following the manufacturer’s instructions. The amount of secreted adiponectin was normalized to total cell count.
Lipolysis rate in mature 3T3-L1 cells was analyzed by free glycerol in supernatant. After 5 h starvation in low glucose (5.6 mM) DMEM containing 1 % FBS, cells were incubated for 16 h with or without 10 µM isoprenaline. For determination, 20 μl of supernatant were mixed with 150 μl of Free Glycerol Reagent and incubated for 10 min at 37°C. OD readings were recorded at 540 nm using the Sunrise microplate reader (Tecan) and the free glycerol amount was normalized to total cell count.
Quantification and statistical analysis
Statistical details of experiments can be found in figure legends and the method details section. Statistical analysis was completed using GraphPad Prism software (student’s t-test, multiple t-test, two-way ANOVA) or R-studio (Wilcoxon rank tests for group comparisons).
Acknowledgments
We thank Kristiana Schüssler and Isabel Wehner for experimental support, Hermann Kalwa for help with immunofluorescent experiments, and Gunnar Kleinau for helpful discussions. BRET plasmids were a kind gift of Hannes Schihada. The graphical abstract was created using BioRender.com. Publication expenses were funded by the Open Access Publishing Fund of Leipzig University supported by the German Research Foundation within the program Open Access Publication Funding. Our research related to this topic is funded by the German Research Foundation (Deutsche Forschungsgemeinschaft; project number 209933838, CRC 1052/3, subprojects B6 (TS), C5 (AK), C9 (KL, AK), CRU337 project number 405344257 (HO 6389/2-2) (SH), and the European Social Funds, European Union (DT).
Author contributions
IK, SH, TS, and DT conceived the project, designed the experiments, wrote the article, and prepared the figures. CK, IK, and SH implemented the database. IK, IW, KE, RK performed experimental work. KL and AK provided RNA-seq data. All authors reviewed the article.
Declaration of interests
The authors declare no competing interests.
Published: September 9, 2023
Footnotes
Supplemental information can be found online at https://doi.org/10.1016/j.isci.2023.107841.
Supplemental information
Data and code availability
-
•
This paper analyzes existing, publicly available data. The accession numbers for the datasets are listed in the key resources table. Detailed expression analysis (GPCRome, differential expression) data have been deposited at Zenodo and are publicly available as of the date of publication. Accession numbers are listed in the key resources table.
-
•
This paper does not report original code.
-
•
Any additional information required to reanalyze the data reported in this paper is available from the lead contact upon request.
References
- 1.Ottaviani E., Malagoli D., Franceschi C. The evolution of the adipose tissue: a neglected enigma. Gen. Comp. Endocrinol. 2011;174:1–4. doi: 10.1016/j.ygcen.2011.06.018. [DOI] [PubMed] [Google Scholar]
- 2.Zubiría M.G., Alzamendi A., Ongaro L., Spinedi E., Giovambattista A. In: Adiposity - Epidemiology and Treatment Modalities. Gordeladze J.O., editor. IntechOpen; 2017. Dietary and Hormonal Factors Involved in Healthy or Unhealthy Visceral Adipose Tissue Expansion. [Google Scholar]
- 3.Verboven K., Wouters K., Gaens K., Hansen D., Bijnen M., Wetzels S., Stehouwer C.D., Goossens G.H., Schalkwijk C.G., Blaak E.E., Jocken J.W. Abdominal subcutaneous and visceral adipocyte size, lipolysis and inflammation relate to insulin resistance in male obese humans. Sci. Rep. 2018;8:4677. doi: 10.1038/s41598-018-22962-x. [DOI] [PMC free article] [PubMed] [Google Scholar]
- 4.Longo M., Zatterale F., Naderi J., Parrillo L., Formisano P., Raciti G.A., Beguinot F., Miele C. Adipose Tissue Dysfunction as Determinant of Obesity-Associated Metabolic Complications. Int. J. Mol. Sci. 2019;20:2358. doi: 10.3390/ijms20092358. [DOI] [PMC free article] [PubMed] [Google Scholar]
- 5.Brown W.V., Fujioka K., Wilson P.W.F., Woodworth K.A. Obesity: why be concerned? Am. J. Med. 2009;122:4–11. doi: 10.1016/j.amjmed.2009.01.002. [DOI] [PubMed] [Google Scholar]
- 6.Nadler S.T., Stoehr J.P., Schueler K.L., Tanimoto G., Yandell B.S., Attie A.D. The expression of adipogenic genes is decreased in obesity and diabetes mellitus. Proc. Natl. Acad. Sci. USA. 2000;97:11371–11376. doi: 10.1073/pnas.97.21.11371. [DOI] [PMC free article] [PubMed] [Google Scholar]
- 7.Musovic S., Komai A.M., Said M.K., Shrestha M.M., Wu Y., Wernstedt Asterholm I., Olofsson C.S. Noradrenaline and ATP regulate adiponectin exocytosis in white adipocytes: Disturbed adrenergic and purinergic signalling in obese and insulin-resistant mice. Mol. Cell. Endocrinol. 2022;549:111619. doi: 10.1016/j.mce.2022.111619. [DOI] [PubMed] [Google Scholar]
- 8.Soccio R.E., Li Z., Chen E.R., Foong Y.H., Benson K.K., Dispirito J.R., Mullican S.E., Emmett M.J., Briggs E.R., Peed L.C., et al. Targeting PPARγ in the epigenome rescues genetic metabolic defects in mice. J. Clin. Invest. 2017;127:1451–1462. doi: 10.1172/JCI91211. [DOI] [PMC free article] [PubMed] [Google Scholar]
- 9.Jones J.E.C., Rabhi N., Orofino J., Gamini R., Perissi V., Vernochet C., Farmer S.R. The Adipocyte Acquires a Fibroblast-Like Transcriptional Signature in Response to a High Fat Diet. Sci. Rep. 2020;10:2380. doi: 10.1038/s41598-020-59284-w. [DOI] [PMC free article] [PubMed] [Google Scholar]
- 10.Nahmgoong H., Jeon Y.G., Park E.S., Choi Y.H., Han S.M., Park J., Ji Y., Sohn J.H., Han J.S., Kim Y.Y., et al. Distinct properties of adipose stem cell subpopulations determine fat depot-specific characteristics. Cell Metabol. 2022;34:458–472.e6. doi: 10.1016/j.cmet.2021.11.014. [DOI] [PubMed] [Google Scholar]
- 11.Landgraf K., Rockstroh D., Wagner I.V., Weise S., Tauscher R., Schwartze J.T., Löffler D., Bühligen U., Wojan M., Till H., et al. Evidence of early alterations in adipose tissue biology and function and its association with obesity-related inflammation and insulin resistance in children. Diabetes. 2015;64:1249–1261. doi: 10.2337/db14-0744. [DOI] [PubMed] [Google Scholar]
- 12.Dalgaard K., Landgraf K., Heyne S., Lempradl A., Longinotto J., Gossens K., Ruf M., Orthofer M., Strogantsev R., Selvaraj M., et al. Trim28 Haploinsufficiency Triggers Bi-stable Epigenetic Obesity. Cell. 2016;164:353–364. doi: 10.1016/j.cell.2015.12.025. [DOI] [PMC free article] [PubMed] [Google Scholar]
- 13.Laakso M., Kuusisto J., Stančáková A., Kuulasmaa T., Pajukanta P., Lusis A.J., Collins F.S., Mohlke K.L., Boehnke M. The Metabolic Syndrome in Men study: a resource for studies of metabolic and cardiovascular diseases. J. Lipid Res. 2017;58:481–493. doi: 10.1194/jlr.O072629. [DOI] [PMC free article] [PubMed] [Google Scholar]
- 14.Bradford S.T., Nair S.S., Statham A.L., van Dijk S.J., Peters T.J., Anwar F., French H.J., von Martels J.Z.H., Sutcliffe B., Maddugoda M.P., et al. Methylome and transcriptome maps of human visceral and subcutaneous adipocytes reveal key epigenetic differences at developmental genes. Sci. Rep. 2019;9:9511. doi: 10.1038/s41598-019-45777-w. [DOI] [PMC free article] [PubMed] [Google Scholar]
- 15.Caputo T., Tran V.D.T., Bararpour N., Winkler C., Aguileta G., Trang K.B., Giordano Attianese G.M.P., Wilson A., Thomas A., Pagni M., et al. Anti-adipogenic signals at the onset of obesity-related inflammation in white adipose tissue. Cell. Mol. Life Sci. 2021;78:227–247. doi: 10.1007/s00018-020-03485-z. [DOI] [PMC free article] [PubMed] [Google Scholar]
- 16.Sriram K., Insel P.A. G Protein-Coupled Receptors as Targets for Approved Drugs: How Many Targets and How Many Drugs? Mol. Pharmacol. 2018;93:251–258. doi: 10.1124/mol.117.111062. [DOI] [PMC free article] [PubMed] [Google Scholar]
- 17.Eisenstein A., Ravid K. G protein-coupled receptors and adipogenesis: a focus on adenosine receptors. J. Cell. Physiol. 2014;229:414–421. doi: 10.1002/jcp.24473. [DOI] [PMC free article] [PubMed] [Google Scholar]
- 18.Im H., Park J.-H., Im S., Han J., Kim K., Lee Y.-H. Regulatory roles of G-protein coupled receptors in adipose tissue metabolism and their therapeutic potential. Arch Pharm. Res. (Seoul) 2021;44:133–145. doi: 10.1007/s12272-021-01314-w. [DOI] [PMC free article] [PubMed] [Google Scholar]
- 19.Amisten S., Neville M., Hawkes R., Persaud S.J., Karpe F., Salehi A. An atlas of G-protein coupled receptor expression and function in human subcutaneous adipose tissue. Pharmacol. Ther. 2015;146:61–93. doi: 10.1016/j.pharmthera.2014.09.007. [DOI] [PubMed] [Google Scholar]
- 20.Glusman G., Yanai I., Rubin I., Lancet D. The complete human olfactory subgenome. Genome Res. 2001;11:685–702. doi: 10.1101/gr.171001. [DOI] [PubMed] [Google Scholar]
- 21.Zhang X., Firestein S. The olfactory receptor gene superfamily of the mouse. Nat. Neurosci. 2002;5:124–133. doi: 10.1038/nn800. [DOI] [PubMed] [Google Scholar]
- 22.Evans B.A., Merlin J., Bengtsson T., Hutchinson D.S. Adrenoceptors in white, brown, and brite adipocytes. Br. J. Pharmacol. 2019;176:2416–2432. doi: 10.1111/bph.14631. [DOI] [PMC free article] [PubMed] [Google Scholar]
- 23.Yosten G.L.C., Kolar G.R., Redlinger L.J., Samson W.K. Evidence for an interaction between proinsulin C-peptide and GPR146. J. Endocrinol. 2013;218:1–8. doi: 10.1530/JOE-13-0203. [DOI] [PubMed] [Google Scholar]
- 24.Lindfors L., Sundström L., Fröderberg Roth L., Meuller J., Andersson S., Kihlberg J. Is GPR146 really the receptor for proinsulin C-peptide? Bioorg. Med. Chem. Lett. 2020;30:127208. doi: 10.1016/j.bmcl.2020.127208. [DOI] [PubMed] [Google Scholar]
- 25.Yu H., Rimbert A., Palmer A.E., Toyohara T., Xia Y., Xia F., Ferreira L.M.R., Chen Z., Chen T., Loaiza N., et al. GPR146 Deficiency Protects against Hypercholesterolemia and Atherosclerosis. Cell. 2019;179:1276–1288.e14. doi: 10.1016/j.cell.2019.10.034. [DOI] [PMC free article] [PubMed] [Google Scholar]
- 26.Rahman M.S. Prostacyclin: A major prostaglandin in the regulation of adipose tissue development. J. Cell. Physiol. 2019;234:3254–3262. doi: 10.1002/jcp.26932. [DOI] [PubMed] [Google Scholar]
- 27.Zhang Z., Wang Q., Yao J., Zhou X., Zhao J., Zhang X., Dong J., Liao L. Chemokine Receptor 5, a Double-Edged Sword in Metabolic Syndrome and Cardiovascular Disease. Front. Pharmacol. 2020;11:146. doi: 10.3389/fphar.2020.00146. [DOI] [PMC free article] [PubMed] [Google Scholar]
- 28.Gembardt F., Grajewski S., Vahl M., Schultheiss H.-P., Walther T. Angiotensin metabolites can stimulate receptors of the Mas-related genes family. Mol. Cell. Biochem. 2008;319:115–123. doi: 10.1007/s11010-008-9884-4. [DOI] [PubMed] [Google Scholar]
- 29.Kalupahana N.S., Moustaid-Moussa N. The renin-angiotensin system: a link between obesity, inflammation and insulin resistance. Obes. Rev. 2012;13:136–149. doi: 10.1111/j.1467-789X.2011.00942.x. [DOI] [PubMed] [Google Scholar]
- 30.Than A., Xu S., Li R., Leow M.K.-S., Sun L., Chen P. Angiotensin type 2 receptor activation promotes browning of white adipose tissue and brown adipogenesis. Signal Transduct. Targeted Ther. 2017;2:17022. doi: 10.1038/sigtrans.2017.22. [DOI] [PMC free article] [PubMed] [Google Scholar]
- 31.Wright S.C., Cañizal M.C.A., Benkel T., Simon K., Le Gouill C., Matricon P., Namkung Y., Lukasheva V., König G.M., Laporte S.A., et al. FZD5 is a Gαq-coupled receptor that exhibits the functional hallmarks of prototypical GPCRs. Sci. Signal. 2018;11:eaar5536. doi: 10.1126/scisignal.aar5536. [DOI] [PubMed] [Google Scholar]
- 32.Lee G.-J., Kim Y.J., Park B., Yim S., Park C., Roh H., Moon Y., Seong J.K., Park H. YAP-dependent Wnt5a induction in hypertrophic adipocytes restrains adiposity. Cell Death Dis. 2022;13:407. doi: 10.1038/s41419-022-04847-0. [DOI] [PMC free article] [PubMed] [Google Scholar]
- 33.Wilson R.J., Rhodes S.A., Wood R.L., Shield V.J., Noel L.S., Gray D.W., Giles H. Functional pharmacology of human prostanoid EP2 and EP4 receptors. Eur. J. Pharmacol. 2004;501:49–58. doi: 10.1016/j.ejphar.2004.08.025. [DOI] [PubMed] [Google Scholar]
- 34.Okada Y., Taniguchi T., Morishima S., Suzuki F., Akagi Y., Muramatsu I. Characteristics of acid extrusion from Chinese hamster ovary cells expressing different prostaglandin EP receptors. Life Sci. 2006;78:2454–2462. doi: 10.1016/j.lfs.2005.10.013. [DOI] [PubMed] [Google Scholar]
- 35.Wang C., Zhang X., Luo L., Luo Y., Wu D., Spilca D., Le Q., Yang X., Alvarez K., Hines W.C., et al. COX-2 Deficiency Promotes White Adipogenesis via PGE2-Mediated Paracrine Mechanism and Exacerbates Diet-Induced Obesity. Cells. 2022;11:1819. doi: 10.3390/cells11111819. [DOI] [PMC free article] [PubMed] [Google Scholar]
- 36.García-Alonso V., Titos E., Alcaraz-Quiles J., Rius B., Lopategi A., López-Vicario C., Jakobsson P.-J., Delgado S., Lozano J., Clària J. Prostaglandin E2 Exerts Multiple Regulatory Actions on Human Obese Adipose Tissue Remodeling, Inflammation, Adaptive Thermogenesis and Lipolysis. PLoS One. 2016;11:e0153751. doi: 10.1371/journal.pone.0153751. [DOI] [PMC free article] [PubMed] [Google Scholar]
- 37.Xu H., Fu J.-L., Miao Y.-F., Wang C.-J., Han Q.-F., Li S., Huang S.-Z., Du S.-N., Qiu Y.-X., Yang J.-C., et al. Prostaglandin E2 receptor EP3 regulates both adipogenesis and lipolysis in mouse white adipose tissue. J. Mol. Cell Biol. 2016;8:518–529. doi: 10.1093/jmcb/mjw035. [DOI] [PMC free article] [PubMed] [Google Scholar]
- 38.Tao X., Du R., Guo S., Feng X., Yu T., OuYang Q., Chen Q., Fan X., Wang X., Guo C., et al. PGE2 -EP3 axis promotes brown adipose tissue formation through stabilization of WTAP RNA methyltransferase. EMBO J. 2022;41:e110439. doi: 10.15252/embj.2021110439. [DOI] [PMC free article] [PubMed] [Google Scholar]
- 39.Inazumi T., Shirata N., Morimoto K., Takano H., Segi-Nishida E., Sugimoto Y. Prostaglandin E₂-EP4 signaling suppresses adipocyte differentiation in mouse embryonic fibroblasts via an autocrine mechanism. J. Lipid Res. 2011;52:1500–1508. doi: 10.1194/jlr.M013615. [DOI] [PMC free article] [PubMed] [Google Scholar]
- 40.Inazumi T., Yamada K., Shirata N., Sato H., Taketomi Y., Morita K., Hohjoh H., Tsuchiya S., Oniki K., Watanabe T., et al. Prostaglandin E2-EP4 Axis Promotes Lipolysis and Fibrosis in Adipose Tissue Leading to Ectopic Fat Deposition and Insulin Resistance. Cell Rep. 2020;33:108265. doi: 10.1016/j.celrep.2020.108265. [DOI] [PubMed] [Google Scholar]
- 41.Stäubert C., Böselt I., Bohnekamp J., Römpler H., Enard W., Schöneberg T. Structural and functional evolution of the trace amine-associated receptors TAAR3, TAAR4 and TAAR5 in primates. PLoS One. 2010;5:e11133. doi: 10.1371/journal.pone.0011133. [DOI] [PMC free article] [PubMed] [Google Scholar]
- 42.Bohnekamp J., Schöneberg T. Cell adhesion receptor GPR133 couples to Gs protein. J. Biol. Chem. 2011;286:41912–41916. doi: 10.1074/jbc.C111.265934. [DOI] [PMC free article] [PubMed] [Google Scholar]
- 43.Liebscher I., Schön J., Petersen S.C., Fischer L., Auerbach N., Demberg L.M., Mogha A., Cöster M., Simon K.-U., Rothemund S., et al. A tethered agonist within the ectodomain activates the adhesion G protein-coupled receptors GPR126 and GPR133. Cell Rep. 2014;9:2018–2026. doi: 10.1016/j.celrep.2014.11.036. [DOI] [PMC free article] [PubMed] [Google Scholar]
- 44.Yanamadala V., Negoro H., Denker B.M. Heterotrimeric G proteins and apoptosis: intersecting signaling pathways leading to context dependent phenotypes. Curr. Mol. Med. 2009;9:527–545. doi: 10.2174/156652409788488784. [DOI] [PMC free article] [PubMed] [Google Scholar]
- 45.Wang Z.V., Scherer P.E. Adiponectin, the past two decades. J. Mol. Cell Biol. 2016;8:93–100. doi: 10.1093/jmcb/mjw011. [DOI] [PMC free article] [PubMed] [Google Scholar]
- 46.Cong L., Chen K., Li J., Gao P., Li Q., Mi S., Wu X., Zhao A.Z. Regulation of adiponectin and leptin secretion and expression by insulin through a PI3K-PDE3B dependent mechanism in rat primary adipocytes. Biochem. J. 2007;403:519–525. doi: 10.1042/BJ20061478. [DOI] [PMC free article] [PubMed] [Google Scholar]
- 47.Carmen G.-Y., Víctor S.M. Signalling mechanisms regulating lipolysis. Cell. Signal. 2006;18:401–408. doi: 10.1016/j.cellsig.2005.08.009. [DOI] [PubMed] [Google Scholar]
- 48.Collins S. β-Adrenergic Receptors and Adipose Tissue Metabolism: Evolution of an Old Story. Annu. Rev. Physiol. 2022;84:1–16. doi: 10.1146/annurev-physiol-060721-092939. [DOI] [PubMed] [Google Scholar]
- 49.Barella L.F., Jain S., Kimura T., Pydi S.P. Metabolic roles of G protein-coupled receptor signaling in obesity and type 2 diabetes. FEBS J. 2021;288:2622–2644. doi: 10.1111/febs.15800. [DOI] [PubMed] [Google Scholar]
- 50.Collins S. β-Adrenoceptor Signaling Networks in Adipocytes for Recruiting Stored Fat and Energy Expenditure. Front. Endocrinol. 2011;2:102. doi: 10.3389/fendo.2011.00102. [DOI] [PMC free article] [PubMed] [Google Scholar]
- 51.Gharibi B., Abraham A.A., Ham J., Evans B.A.J. Adenosine receptor subtype expression and activation influence the differentiation of mesenchymal stem cells to osteoblasts and adipocytes. J. Bone Miner. Res. 2011;26:2112–2124. doi: 10.1002/jbmr.424. [DOI] [PubMed] [Google Scholar]
- 52.Al Mahri S., Malik S.S., Al Ibrahim M., Haji E., Dairi G., Mohammad S. Free Fatty Acid Receptors (FFARs) in Adipose: Physiological Role and Therapeutic Outlook. Cells. 2022;11:750. doi: 10.3390/cells11040750. [DOI] [PMC free article] [PubMed] [Google Scholar]
- 53.Zhang X., Heckmann B.L., Liu J. Studying lipolysis in adipocytes by combining siRNA knockdown and adenovirus-mediated overexpression approaches. Methods Cell Biol. 2013;116:83–105. doi: 10.1016/B978-0-12-408051-5.00006-1. [DOI] [PMC free article] [PubMed] [Google Scholar]
- 54.Williams I.H., Polakis S.E. Differentiation of 3T3-L1 fibroblasts to adipocytes. The effect of indomethacin, prostaglandin E1 and cyclic AMP on the process of differentiation. Biochem. Biophys. Res. Commun. 1977;77:175–186. doi: 10.1016/s0006-291x(77)80180-0. [DOI] [PubMed] [Google Scholar]
- 55.Bennett C.N., Ross S.E., Longo K.A., Bajnok L., Hemati N., Johnson K.W., Harrison S.D., MacDougald O.A. Regulation of Wnt signaling during adipogenesis. J. Biol. Chem. 2002;277:30998–31004. doi: 10.1074/jbc.M204527200. [DOI] [PubMed] [Google Scholar]
- 56.Prasanna G., Carreiro S., Anderson S., Gukasyan H., Sartnurak S., Younis H., Gale D., Xiang C., Wells P., Dinh D., et al. Effect of PF-04217329 a prodrug of a selective prostaglandin EP(2) agonist on intraocular pressure in preclinical models of glaucoma. Exp. Eye Res. 2011;93:256–264. doi: 10.1016/j.exer.2011.02.015. [DOI] [PubMed] [Google Scholar]
- 57.Schachar R.A., Raber S., Courtney R., Zhang M. A phase 2, randomized, dose-response trial of taprenepag isopropyl (PF-04217329) versus latanoprost 0.005% in open-angle glaucoma and ocular hypertension. Curr. Eye Res. 2011;36:809–817. doi: 10.3109/02713683.2011.593725. [DOI] [PubMed] [Google Scholar]
- 58.Civelek E., Ozen G. The biological actions of prostanoids in adipose tissue in physiological and pathophysiological conditions. Prostaglandins Leukot. Essent. Fatty Acids. 2022;186:102508. doi: 10.1016/j.plefa.2022.102508. [DOI] [PubMed] [Google Scholar]
- 59.Han F., Liu X., Chen C., Liu Y., Du M., Zhou Y., Liu Y., Song B.-L., He H.H., Wang Y. Hypercholesterolemia risk-associated GPR146 is an orphan G-protein coupled receptor that regulates blood cholesterol levels in humans and mice. Cell Res. 2020;30:363–365. doi: 10.1038/s41422-020-0303-z. [DOI] [PMC free article] [PubMed] [Google Scholar]
- 60.Johansson S.M., Lindgren E., Yang J.-N., Herling A.W., Fredholm B.B. Adenosine A1 receptors regulate lipolysis and lipogenesis in mouse adipose tissue-interactions with insulin. Eur. J. Pharmacol. 2008;597:92–101. doi: 10.1016/j.ejphar.2008.08.022. [DOI] [PubMed] [Google Scholar]
- 61.Suchý T., Zieschang C., Popkova Y., Kaczmarek I., Weiner J., Liebing A.-D., Çakir M.V., Landgraf K., Gericke M., Pospisilik J.A., et al. The repertoire of Adhesion G protein-coupled receptors in adipocytes and their functional relevance. Int. J. Obes. 2020;44:2124–2136. doi: 10.1038/s41366-020-0570-2. [DOI] [PMC free article] [PubMed] [Google Scholar]
- 62.Bray N.L., Pimentel H., Melsted P., Pachter L. Near-optimal probabilistic RNA-seq quantification. Nat. Biotechnol. 2016;34:525–527. doi: 10.1038/nbt.3519. [DOI] [PubMed] [Google Scholar]
- 63.UniProt Consortium UniProt: the Universal Protein Knowledgebase in 2023. Nucleic Acids Res. 2023;51:D523–D531. doi: 10.1093/nar/gkac1052. [DOI] [PMC free article] [PubMed] [Google Scholar]
- 64.Cunningham F., Allen J.E., Allen J., Alvarez-Jarreta J., Amode M.R., Armean I.M., Austine-Orimoloye O., Azov A.G., Barnes I., Bennett R., et al. Ensembl 2022. Nucleic Acids Res. 2022;50:D988–D995. doi: 10.1093/nar/gkab1049. [DOI] [PMC free article] [PubMed] [Google Scholar]
- 65.Knierim A.B., Röthe J., Çakir M.V., Lede V., Wilde C., Liebscher I., Thor D., Schöneberg T. Genetic basis of functional variability in adhesion G protein-coupled receptors. Sci. Rep. 2019;9:11036. doi: 10.1038/s41598-019-46265-x. [DOI] [PMC free article] [PubMed] [Google Scholar]
- 66.Zhang J., Tang H., Zhang Y., Deng R., Shao L., Liu Y., Li F., Wang X., Zhou L. Identification of suitable reference genes for quantitative RT-PCR during 3T3-L1 adipocyte differentiation. Int. J. Mol. Med. 2014;33:1209–1218. doi: 10.3892/ijmm.2014.1695. [DOI] [PubMed] [Google Scholar]
- 67.Schihada H., Shekhani R., Schulte G. Quantitative assessment of constitutive G protein-coupled receptor activity with BRET-based G protein biosensors. Sci. Signal. 2021;14:eabf1653. doi: 10.1126/scisignal.abf1653. [DOI] [PubMed] [Google Scholar]
- 68.Deutsch M.J., Schriever S.C., Roscher A.A., Ensenauer R. Digital image analysis approach for lipid droplet size quantitation of Oil Red O-stained cultured cells. Anal. Biochem. 2014;445:87–89. doi: 10.1016/j.ab.2013.10.001. [DOI] [PubMed] [Google Scholar]
Associated Data
This section collects any data citations, data availability statements, or supplementary materials included in this article.
Supplementary Materials
Data Availability Statement
-
•
This paper analyzes existing, publicly available data. The accession numbers for the datasets are listed in the key resources table. Detailed expression analysis (GPCRome, differential expression) data have been deposited at Zenodo and are publicly available as of the date of publication. Accession numbers are listed in the key resources table.
-
•
This paper does not report original code.
-
•
Any additional information required to reanalyze the data reported in this paper is available from the lead contact upon request.