

Summary
Senescent tumor cells (STCs) can induce immunosuppression, promoting tumor progression and therapy resistance. However, the specific characteristics of immunosuppressive STC have not been thoroughly investigated. This study aimed to characterize and elucidate the immunosuppressive phenotype of STC in lung adenocarcinoma by employing single-cell and bulk transcriptomics, as well as serum proteomics profiling. We identified senescence-related genes specific to tumors and identified Cluster10 of STC as the immunomodulatory subtype. Cluster10 exhibited a distinct secretome dominated by cytokines such as CXCL1, CXCL2, and CXCL8 and showed activation of transcription factors associated with cytokine secretion, including NFKB1, RELA, and STAT3. Notably, Cluster10 demonstrated the highest degree of intercellular communication among all cell types, with interactions as LGALS9-TIM3 and MIF-CD74. Furthermore, Cluster10 showed significant associations with poor prognosis and diminished response to immunotherapy. Analysis of serum proteomics data from our in-house cohort identified CXCL8 as a potential marker for predicting immunotherapeutic outcomes.
Subject areas: Immunology, Components of the immune system, Bioinformatics, Cancer, Proteomics, Transcriptomics
Graphical abstract
Highlights
-
•
Cluster10 was the immunosuppressive subtype of senescent tumor cells
-
•
Cluster10 exhibited a cytokine-dominated secretome
-
•
Cluster10 demonstrated the highest degree of intercellular communication
-
•
CXCL8 could predict immunotherapeutic outcomes in lung adenocarcinoma
Immunology; Components of the immune system; Bioinformatics; Cancer; Proteomics; Transcriptomics
Introduction
Cellular senescence, characterized by irreversible cell-cycle arrest in response to cellular stresses, is a hallmark of aging.1 Tumor cells, burdened with high replication rates, often experience genomic instability, leading to cellular senescence.2,3,4 Senescent tumor cells (STCs) have been observed in various cancers, including thyroid cancer, colorectal cancer, prostate cancer, and lymphoma.5,6,7
STCs are known to secrete a diverse range of proteins, such as inflammatory cytokines, chemokines, matrix remodeling factors, and growth factors, collectively referred to as the senescence-associated secretory phenotype (SASP).8 The impact of SASP on the tissue microenvironment can vary depending on the cell types undergoing senescence (e.g., stromal or epithelial cells, normal or cancer cells) and the cause of senescence.4 SASP factors can remodel tissues in a paracrine manner, affecting the proliferation and migration of adjacent cells, including stromal cells, immune cells, and cancer cells.9 Additionally, SASP factors can promote angiogenesis and create an immunosuppressive microenvironment.10
The significant role of STCs in immunomodulation has sparked interest in STC-based precision medicine. However, the lack of specific markers poses a challenge in identifying and eliminating immunosuppressive STCs in clinical practice.11 Conventional senescence markers derived from non-tumor cells or animal models, such as CDKN1A, CDKN2A, LMNB1, and SA-β-Gal, often yield false positives when distinguishing STCs.11 This discrepancy may arise from distinct senescence mechanisms in tumor cells, including high genomic instability implicated in senescence development.12 Furthermore, due to STC heterogeneity, conventional senescence markers fail to differentiate immunosuppressive STCs from a mixed population of STCs.13 The precise phenotype of immunosuppressive STCs remains elusive. Understanding the changes in cellular physiology associated with immunosuppressive STCs could facilitate their selective eradication.
Lung adenocarcinoma (LUAD) is characterized by a high mutation rate and genome instability, potentially leading to the generation of STCs. Moreover, DNA-damage-inducing therapies such as chemotherapy and radiotherapy often induce therapy-induced senescence in tumor cells.13 Targeting immunosuppressive STCs as a sequential treatment following pro-senescence therapy holds promise for enhancing anticancer treatment efficacy.14 Furthermore, as immunosuppressive STCs significantly modify the tumor microenvironment (TME), the identification of clinically significant genes associated with immunosuppressive STCs could serve as potential biomarkers for prognosis and therapeutic targeting. Additionally, STCs can influence various neighboring cell types, including fibroblasts, immune cells, vascular endothelial cells, and tumor cells, activating signaling pathways within the tissue microenvironment.9,15 Therefore, unraveling the interaction patterns between immunosuppressive STCs and other key cell types in the TME could uncover new therapeutic targets for STC-based treatments.
In this study, our objectives were to identify tumor-specific senescence-related genes to recognize STCs at the single-cell level and to investigate the heterogeneity of STCs in LUAD while thoroughly elucidating the phenotype of the immunosuppressive cluster. We also revealed the unique cytokine-dominated secretome, cytokine-secreting transcription factors, and immunomodulatory cell-cell communication within this cluster. In conclusion, our findings lay the groundwork for a better understanding of STC-related modulation of the TME and will facilitate the identification of biomarkers and the development of customized therapeutic regimens in clinical oncology.
Results
Intra-patient and inter-patient heterogeneity of malignant cells in LUAD
The workflow of this study is illustrated in Figure 1A. A total of 107,761 cells were obtained from 32 LUAD samples in GSE131907 for single-cell analysis. When compared to malignant epithelial cells, the levels of copy number variations (CNV) in references (fibroblasts and endothelial cells) were relatively lower. Since none of the epithelial cells had similar CNV patterns with references, all epithelial cells were considered malignant and selected for further examination (Figure 1B).
Figure 1.

Intra-patient and inter-patient heterogeneity of malignant cells in LUAD
(A) The workflow of this study.
(B and C) The hierarchical heatmap showing large-scale copy number variations in cancer cells and references (fibroblasts and endothelial) (c) The UMAP plots displayed malignant cells grouped by Seurat clusters and sample origins.
(D) The UMAP plots displayed stromal cells and immune cells grouped by Seurat clusters and sample origins.
(E) 25,496 malignant cells were divided into 332 metacells. LUAD, lung adenocarcinoma; TME, tumor microenvironment; UMAP, uniform manifold approximation and projection.
Malignant cells exhibited distinct clusters corresponding to their sample origins (Figure 1C), while non-malignant cells showed minimal variations across patients (Figure 1D). Furthermore, malignant cells from the same patient often belonged to different clusters, highlighting significant intra-patient and inter-patient heterogeneity. To address the bias introduced by this heterogeneity when selecting cells for subsequent weighted gene co-expression network analysis (WGCNA) analysis, we employed the non-parametric K-nn graph algorithm implemented in the MetaCell package. This algorithm allowed us to divide the cells into homogeneous groups, referred to as metacells. After quality control, we retained 25,496 malignant cells with 27,578 genes, which were divided into 332 metacells (Figure 1E). These metacells represent groups of cells with similar transcriptional states and serve as the basis for approximating gene expression distributions in the single-cell data.
A group of senescent tumor cells with high secretory activity were identified
DNA damage is a major trigger for senescence in tumor cells, and it leads to genomic instability. To assess the extent of DNA damage in each cell, we computed the genomic instability score (GIS). Malignant cells exhibited the highest GIS compared to fibroblasts and endothelial cells (Figure 2A). Interestingly, among malignant cells, cells from metastatic samples displayed higher GIS values than cells from primary tumors. Notably, cells from metastatic lymph nodes exhibited the greatest genomic instability (Figure 2A).
Figure 2.

A group of senescent tumor cells with high SASP-secreting activity were identified using WGCNA
(A) The distribution of genomic instability score (GIS) in tumor cells, fibroblasts, and endothelial cells. The mLN and mBrain represented cells from metastatic lymph node samples and metastatic brain tissue samples. The tL/B and tLung represented the advanced and early stage primary LUAD tumor cells.
(B) The hierarchical cluster tree depicted a total of 16 modules identified in WGCNA.
(C) The heatmap displayed the correlation of each module with the two groups (high-GIS and low-GIS). The first number in each grid denoted the correlation coefficient, while the second reflected the p value.
(D) The heatmap showed the intercorrelation of each module.
(E) The bubble plot depicted that genes in MEtan and MEpurple were correlated with distinct biological pathways.
(F) The bar chart displayed the upregulated and downregulated pathways in STC.
(G) The expression levels of the classical senescence marker genes CDKN2A and CDKN1A in STC and non-STC.
(H) The curated senescence-related gene sets in STC and non-STC. SASP, senescence-associated secretory phenotype; WGCNA, weighted gene co-expression network analysis; LUAD, lung adenocarcinoma; STC, senescent tumor cells.
We compiled a total of 1,259 genes associated with senescence from previously published studies16 (Table S1). Among these genes, 525 were identified as positive senescence-related genes, while 734 were classified as negative senescence-related genes. Using the WGCNA approach, we investigated the core genes involved in senescence initiation. Firstly, we included the expression profiles of the 1,259 senescence-related genes from the 332 metacells. To create a scale-free topology model, we set the soft thresholding power to 4. After weight-based filtering, we obtained a total of 16 modules, and their hierarchical cluster tree is depicted in Figure 2B. Two modules, MEpurple (correlation = 0.5, p = 4e-22) and MEtan (correlation = 0.58, p = 2e-30), showed a significant association with GIS (Figure 2C) (Table S2). The intercorrelation study revealed the distinct functions of these two modules (Figure 2D). Genes in the MEpurple module were predominantly positive senescence-related genes, while genes in the MEtan module were mainly negative senescence-related genes. MEpurple exhibited a strong correlation with p53 signaling, whereas MEtan showed a positive correlation with cell proliferation, which represents the opposite feature of senescence (MYC targets, E2F targets, G2M checkpoint, cell cycle)1 (Figure 2E). These findings validated the identified genes from WGCNA and their functional relevance. As senescence levels increased, the disparities in gene expression between senescence-positive and senescence-negative genes became more pronounced. To capture these differences, we defined the senescence score as the difference between the activities of these two gene sets.
Using the AUCell algorithm, we calculated the senescence score for each cell and identified tumor cells in the highest and lowest 25% of the score distribution as STC and non-STC, respectively. Compared to non-STC, STC showed a distinct downregulation of proliferation-related pathways (cell cycle, G2M checkpoint, MYC checkpoint, and E2F targets), which is a characteristic feature of senescent cells (Figure 2F). Notably, STC exhibited significant upregulation in secretory activities, such as membrane transport of vesicles, secretory granules, and proteins, indicating an activated SASP secretion in these cells. Additionally, major histocompatibility protein complex, antigen binding, processing, and presentation were also amplified in STC, indicating enhanced intercellular communication between these cells and immune cells. Overall, we established a tumor-specific signature to assess senescence levels in tumor cells and identified a distinct subgroup of STC with activated secretory activity.
We compared the expression levels of the classical senescence marker genes CDKN2A and CDKN1A in STC and non-STC (Figure 2G). CDKN2A showed significantly higher expression in STC compared to non-STC (p < 0.001, avg_logFC = 1.35), while CDKN1A showed minimal difference between the two groups (p < 0.001, avg_logFC = 0.12). We assessed the enrichment of four gene sets previously described in cellular senescence (Table S3), including hallmark gene signatures of Fridman and Casella et al. These gene sets included the positive senescence-related genes (Fridman_UP and Casella_UP) and negative senescence-related genes (Fridman_DOWN and Casella_DOWN). We found that the Fridman_UP and Casella_UP were significantly enriched in STC, while the Fridman_DOWN and Casella_DOWN were significantly downregulated in STC, supporting our definition of STC (Figure 2H). These findings further validate the effectiveness of the marker genes in characterizing the senescent condition.
Cluster10 of STC had notable immunomodulatory activities
The heterogeneity of (STCs) has been welldocumented in multiple studies.8,17 In our study, we identified 11 distinct cell clusters of STC using unbiased clustering (Figure 3A). The distribution of senescence scores within each cluster is illustrated in Figure 3A. Expression profiling of top 5 differential expressed genes (DEGs) of different clusters was described (Figure 3B). Notably, Cluster10 exhibited high expression levels of DEGs (avg_logFC>1) associated with hypoxia and angiogenesis, such as S100A4, ERO1A, CP, TGM2, TMEM45A, and TNFAIP3.
Figure 3.

Cluster10 of SCT showed enhanced immunomodulatory activities
(A) The UMAP plot depicted the 11 clusters of STC (upper) and the distribution of senescence score in these clusters (lower).
(B) The expression profiling of top 5 DEGs in each cluster.
(C) The bubble chart revealed the expression profiling of 25 SASP factors in each cluster.
(D) The heatmap depicted the normalized enrichment score of the top 20 variable pathways in 11 clusters.
(E) The bubble chart showed the expression profiling of 9 anti-apoptosis and 10 pro-apoptosis genes in each cluster.
(F) The heatmap depicted the activity of the top 20 variable transcription factors in 11 clusters. STC, senescent tumor cells; SASP, senescence-associated secretory phenotype; UMAP, uniform manifold approximation and projection; DEGs, differential expressed genes.
Components of the SASP produced by STC have the ability to regulate the local tissue microenvironment.8 We curated a list of 25 experimentally identified SASP factors from published studies (Table S4) and investigated their distribution among the 11 clusters. We observed significant differences in the secretome among clusters. Nine (TGFB1, VEGFA, VEGFB, CXCL8, IL6, CXCL3, CXCL2, CXCL1, and CCL2) were strongly expressed in STC (Figure 3C). Cluster10 exhibited the most extensive secretome, accounting for 9.7% of all STCs, with high expression of IL-6, CXCL1, CXCL2, CXCL8, and CCL2. Several of these SASP factors, including IL-6, CCL2, CXCL1, and CXCL2, have been implicated in immunosuppressive tumor microenvironments and tumorigenesis in various tumor types.18,19,20,21
To gain further insights into the biological roles of each cluster in tumorigenicity and progression, pathway enrichment analysis was performed (Figure 3D). Cluster10 showed enhanced hypoxia and epithelial-mesenchymal transition, with significant VEGFA expression, suggesting their association with tumor growth. Cluster10, in particular, exhibited upregulation of genes enriched in numerous immune-related pathways, including TNF-α signaling, IFN-γ response, IFN-α response, cytokine-cytokine receptor interaction, IL2/STAT5 signaling, and IL6/JAK/STAT3 signaling. These findings suggest that the SASP components released by Cluster10 may have a significant impact on the local tissue microenvironment.
Resistance to cell death is another defining feature of STC, which can occur through resistance to apoptotic stimuli or activation of pro-survival pathways.22 The overexpression of BCL2 and BCL-XL in STC is a known mechanism for their resistance to programmed cell death.23 We conducted a comprehensive analysis of anti-apoptosis and pro-apoptosis genes in STC (Figure 3E). Anti-apoptosis genes were found to be highly expressed in comparison to pro-apoptosis genes in STC. Different clusters exhibited activation of distinct anti-apoptosis genes. Interestingly, BCL2 was expressed at significantly low levels in all clusters, indicating that BCL2-targeting senolytic drugs (such as ABT-263 and ABT737) may have limited efficacy against STC in LUAD.12 The most abundantly produced anti-apoptosis genes were BCL2L1, MCL1, and GADD45A, which could be potential targets for eliminating Cluster10 cells in LUAD.
Several transcription factors (TFs), including those involved in NF-kB signaling and the C/EBP transcription cofactor, have been implicated in the induction and regulation of SASP.24,25 We used the Dorothea database to investigate potential differences in regulon activity (i.e., TFs and their target genes) among the clusters. NFKB1 and RELA from the NF-kB family, as well as STAT3 from the STAT family, exhibited exceptional levels of expression in Cluster10. These TFs are known to be important transactivators of SASP-related proinflammatory cytokines.25 Additionally, two hypoxia-related TFs, HIF1A and KLF6, showed elevated expression levels in Cluster10.
Cluster10 cells modulated complex cell-cell communication in the TME
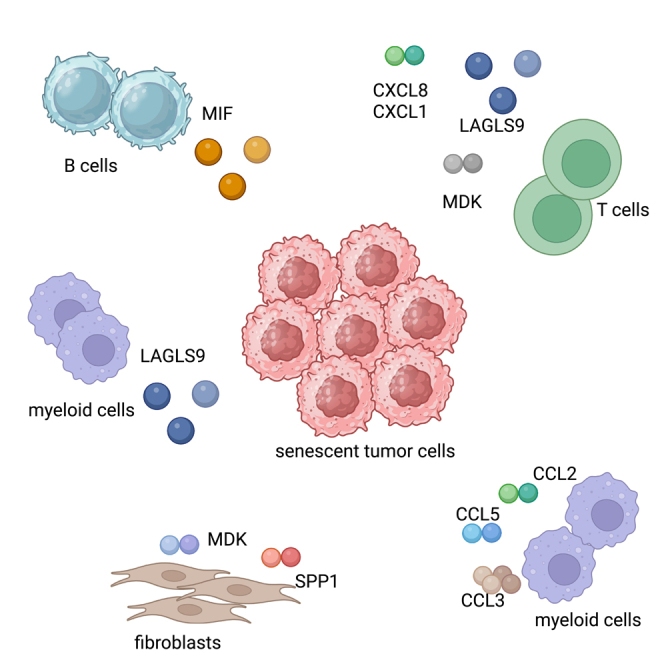
The interaction between STC and immune cells, such as macrophages, and T cells, has been observed to exacerbate both local and systemic inflammation.21 Among all the STC clusters, Cluster10 cells exhibited the highest level of activity with the most incoming and outgoing interactions (Figure 4A). Therefore, we examined the intercellular communication between Cluster10 cells and other important cell types (Figure 4B). Endothelial cells, myeloid cells, and non-STC malignant cells were found to be significantly active and interacted with Cluster10 cells (Figure 4C). Cluster10 cells triggered a variety of signaling pathways beyond the canonical SASP pathways (CXCL, VEGF), including MIF, MK, EGF, ANGPTL, SEMA3, BAG, WNT, and CSF. Additionally, Cluster10 cells received various secreted signals, such as SPP1, GRN, IFN-II, PERIOSTIN, TNF, TGFB, IGF, and OSM.
Figure 4.

Cluster10 modulated complex cell-cell communication in TME. C0-10 represented Cluster0-10 cells and non-STC malignant cells represented non-senescent tumor cells in the following plots
(A) The incoming and outgoing signaling interaction strength of all cell types.
(B) The number of interactions and interaction weights among each cell type.
(C) The outgoing (left) and (right) incoming signaling patterns of all cell types.
(D) The ligand-receptor pairs signaled from Cluster10 cells to other cell types (left) and signaled from other cell types to Cluster10 cells (right). TME, tumor microenvironment.
Broad ligand-receptor pairs were identified, revealing substantial molecular connections between Cluster10 cells and the principal cell types (Figure 4D). Firstly, Cluster10 cells released molecules that activate pro-proliferation signaling pathways in non-STC malignant cells. TGFA, AREG, HBEGF, and EREG released by Cluster10 cells were shown to activate EGFR and ERBB2 in non-STC malignant cells. Secondly, VEGFA-VEGFR1 and VEGFB-VEGFR2 were identified as major ligand-receptor pairs in the intercellular communication between Cluster10 cells and endothelial cells, indicating the pro-angiogenic activity of Cluster10 cells in the local microenvironment. Additionally, Cluster10 cells released multiple SASP factors (CCL2, CCL5, CXCL1, CXCL2, CXCL3, and CXCL8) that activated ACKR1 in endothelial cells.
Notably, several receptor-ligand pairs between Cluster10 cells and immune cells were discovered. LGALS9 was identified as the main checkpoint signal from Cluster10 cells, exerting an inhibitory effect on immune cells such as mast cells, myeloid cells, NK cells, B cells, and T cells. The main ligand-receptor pairs involving LGALS9 were LGALS9-TIM3, LGALS9-CD45, and LGALS9-CD44. LGALS9 has been reported to interact with PD-1 and TIM3, and it may serve as a potential therapeutic target for immunotherapy.26 Additionally, MDK was found to activate NCL in T cells. MDK is an immune modulator that promotes detrimental inflammation and cancer metastasis. Exploiting the multiple immunofluorescence technology, we successfully observed the co-location of LGALS9 and its receptor CD45 and the co-location of MDK and its receptor NCL on the CD8 T cells, which validated the specific cell-cell interaction of these ligand-receptors (Figure S1). There was a significant presence of the CCL family (CCL3, CCL2, and CCL5) between myeloid cells and Cluster10 cells. The involvement of myeloid cells in tumor progression has been confirmed in previous studies.27 Overall, Cluster10 cells exhibited remarkable signaling functions and modulated complex cell-cell communication, which may contribute to an immunosuppressive tumor microenvironment.
Cluster10 was associated with immunosuppressive TME in the pan-cancer level
The single-cell analysis identified the marker genes for Cluster10 with average log2 fold change (avg_log2FC) > 1 and p value <0.05 (Table S5). To validate the effectiveness of these marker genes in characterizing the senescent condition at the bulk level, an independent transcriptome data collected from a panel of 13 cancer cell lines rendered senescent by alisertib or etoposide.28 In Figure 5A, the left side meant these cell lines rendered senescent by alisertib or etoposide and the right side meant the status of untreated cell lines. The signature of Cluster10 was significantly enriched in STCs (NES = 1.73, p = 0.001), suggesting that the marker genes can effectively characterize the senescent condition. Gene set variation analysis scores were then used to assess the enrichment of Cluster10 at the bulk level.
Figure 5.

Cluster10 was associated with immunosuppressive TME in bulk level analysis
(A) The GSEA plot showed Cluster10 was more enriched in senescent cancer cells than normal ones.
(B) The distribution of Cluster10 in 32 cancer types. The cutoff was the median Cluster10 of all samples.
(C) The top 20 pathways that had strong correlation with Cluster10 in 32 cancer types. The x axis represented the sum of cancer types where the correlation between each pathway and Cluster10 > 0.3.
(D) The heatmap showed the correlation between the immune signatures and Cluster10 in 32 cancer types.
(E) The heatmap showed the correlation between the 25 SASP factors and Cluster10 in 32 cancer types.
(F) The heatmap showed the correlation between the immune checkpoints and Cluster10 in 32 cancer types. TME, tumor microenvironment; GSEA, gene set enrichment analysis; SASP, senescence-associated secretory phenotype.
Consistent with the single-cell analyses, Cluster10 cells exhibited a diverse secretome of SASP components and the activation of numerous immune-related pathways. To examine if these patterns were observed at the bulk level, more than 12,000 samples spanning 32 cancer types from the pan-cancer datasets of TCGA were analyzed. The distribution of Cluster10 signature scores varied among different cancer types (Figure 5B). Ovarian serous cystadenocarcinoma, lung squamous cell carcinoma, and cholangiocarcinoma had the highest scores for the Cluster10 signature, while acute myeloid leukemia, brain lower-grade glioma, and bladder urothelial carcinoma had the lowest scores.
Multiple immune-related pathways, including complement, TNF-α signaling, inflammatory response, IL2-STAT5 signaling, IL6-JAK-STAT3 signaling, and cytokine-cytokine receptor interaction, were significantly associated with Cluster10 in most cancer types (Figure 5C). Cluster10 was also strongly correlated with hypoxia, angiogenesis, and epithelial-mesenchymal transition, which are characteristics of tumor cell invasion and proliferation (Figure 5C).
The levels of ImmuneScore, StromaScore, and MicroenvironmentScore showed positive correlations with Cluster10 in most cancer types (Figures 5D and S2). Immune cell infiltration analysis revealed a positive correlation between Cluster10 and the abundance of immunosuppressive cells such as regulatory T cells (Tregs) and myeloid-derived suppressor cells (MDSCs), while showing a negative correlation with activated CD8 T cells and activated CD4 T cells (Figure 5D).
Furthermore, several SASP factors were positively correlated with Cluster10, including IL6, CXCL1, CXCL2, and CXCL8, which were previously observed to be secreted by Cluster10 at the single-cell level (Figure 5E). CXCL2 and CXCL8 have been implicated in Treg accumulation, contributing to the immunosuppressive tumor microenvironment.29,30 The expression levels of multiple immune checkpoints were significantly correlated with Cluster10 cells in most cancer types, including TIM-3, TIGIT, PD-1, PD-L1, LAG3, and CTLA4, indicating the immunomodulatory function of Cluster10 cells in the local tumor microenvironment (Figure 5F). These findings collectively support the notion that Cluster10 cells can drive an immunosuppressive and pro-tumorigenic remodeling of the microenvironment, validating the observations made at the single-cell level.
Cluster10 was associated with poor prognosis and worse response to immunotherapy in multiple cohorts, including NSCLC
To assess the predictive value of the Cluster10 signature in clinical outcomes, survival analysis was conducted using four cohorts of LUAD.31,32,33 Patients with high Cluster10 had significantly lower overall survival (OS) compared to those with low Cluster10 (Figure 6A). Furthermore, the role of Cluster10 in predicting clinical outcomes was investigated across 32 cancer types. Consistently, high Cluster10 expression was associated with poorer OS in multiple cancer types (Figures 6B and S3).
Figure 6.

Cluster10 was related to undesirable prognosis and worse immunotherapy response in various forms of cancer, including NSCLC
(A) Kaplan–Meier curve for OS between the high- and low-Cluster10 groups in LUAD patients of 4 cohorts.
(B) Kaplan–Meier curve for OS between the high- and low-Cluster10 groups in multiple cancer types.
(C) The enrichment of the signature of Cluster10 between non-responders and responders in multiple immunotherapy cohorts.
(D) The Cluster10 showed predictive value of immunotherapy response in 61 non-small-cell lung cancer (NSCLC) patients who received PD-1 antibody sintilimab.
(E) The protein level difference of 26 proteins in the signature of Cluster10 between non-responders and responders.
(F) The paired boxplots showed the CXCL8 level in the baseline (T0) and the time point of progress (T1) in non-responders (left) and the last evaluation time point (T1) in responders (right).
OS, overall survival; LUSC, lung squamous cell carcinoma; KIRC, kidney renal clear cell carcinoma; LGG, brain lower-grade glioma; GBM, glioblastoma multiforme; STAD, stomach adenocarcinoma; UVM, uveal melanoma; PAAD, pancreatic adenocarcinoma; TGCT, Testicular germ cell tumors; CHOL, Cholangiocarcinoma; NSCLC, non-small-cell lung cancer; SKCM, skin cutaneous melanoma; GC, gastric cancer; RCC, renal cell carcinoma; UC, urothelial carcinoma; MIF, multiple immunofluorescence.
Next, the role of Cluster10 in immunotherapy response was explored. Gene set enrichment analysis revealed that Cluster10 was enriched in non-responders across nine immunotherapy cohorts, including non-small-cell lung cancer (NSCLC), skin cutaneous melanoma, renal cell carcinoma, and urothelial carcinoma (Figure 6C).34,35,36,37,38,39,40,41,42,43,44,45,46,47 To further validate the predictive value of Cluster10, we obtained bulk transcriptomics data from a cohort of 61 NSCLC patients who received PD-1 antibody sintilimab in a phase 3 clinical trial (ORIENT-3) conducted in China (NCT03150875). These patients had locally advanced or metastatic NSCLC (stage III or IV). Using the transcriptomics data, we stratified the patients into Cluster10-high and Cluster10-low groups based on the best cutoff point. Subsequently, we assessed the clinical outcomes, including progression-free survival (PFS) and OS, between these two groups. Our analysis revealed that Cluster10-high patients had shorter PFS and OS compared to Cluster10-low patients (Figure 6D). This cohort provided additional evidence supporting the adverse role of Cluster10 in the context of immunotherapy.
To identify potential biomarkers for immunotherapy, serum proteomics data were analyzed. An in-house cohort comprising 57 samples (including longitudinal and baseline samples) from 17 NSCLC patients treated with immunotherapy was utilized. Among the 74 markers in the Cluster10 signature, 26 proteins were present in the serum proteomics data. Among these proteins, CXCL8 showed the most significant upregulation in non-responders compared to responders (p value = 0.0027) (Figure 6E). In non-responders, the CXCL8 level increased at the time point of disease progression, while in responders, there was no significant difference in CXCL8 levels at the last evaluation time point compared to baseline (Figure 6F). These findings suggest that CXCL8 could serve as a potential biomarker for predicting therapeutic outcomes. To investigate the underlying mechanism of CXCL8, we conducted multiple immunofluorescence staining of CXCL8 and CD8 on a subset of 21 NSCLC patient samples who received immunotherapy. We also used PanCK to annotate tumor cells, allowing us to distinguish tumor cells from the surrounding microenvironment. Consistent with serum proteomics data, we observed that non-responders had higher CXCL8 average intensity of tumor cells than responders (Figures 6G and S4). In the meanwhile, CXCL8-high group exhibited a lower presence of CD8 T cells compared to the CXCL8-low group (Figures 6G and S4). This finding suggests that CXCL8 may have an immunosuppressive effect within the tumor microenvironment, as indicated by the lower infiltration of CD8 T cells in the CXCL8-high group.
Discussion
To detect senescent cells, many studies have utilized cell-cycle arrest, flattened morphology, and a combination of markers such as p16, p21, cH2AX (a DNA damage response marker), downregulation of lamin B (a nuclear envelope protein), senescence-associated β-galactosidase activity, and the SASP.4,11 Recently, some studies have developed signature scores based on senescence-related genes to detect senescent cells.16,48 For example, Wang et al. successfully measured senescence levels in pan-cancer bulk tissues using a set of 1,259 published senescence-related genes.49 However, these markers were derived either from non-tumor tissues or from bulk tumor tissues consisting of a mixture of tumor cells, stromal cells, and immune cells. Therefore, these markers may not be specific enough to identify STC.
In our study, we recognized these limitations and aimed to overcome them by employing single-cell technology to isolate tumor cells and detect senescence-related gene expression. Since tumor had the extraordinary genomic instability that contributed to senescence initiation, we exploited genomic instability score and the published senescence-related genes to obtain tumor-specific senescence-related genes, based on which the senescence score was calculated. The tumor cells with top 25% senescence score was defined as STC.
At the single-cell level, we explored the heterogeneity of STC in LUAD and identified an immunosuppressive subtype of STC. We investigated 25 SASP factors curated from previous literature and found that only nine of them exhibited high expression in STC. Most of these SASP factors were derived from non-tumor cells, suggesting that the distinct mechanisms of senescence in tumor cells might influence the secretome of SASP in these cells. Pathway analysis revealed that compared to proliferative cells, STC cells exhibited elevated secretory activities, including protein secretion and vesicle transport through membranes. Extracellular vesicles have been identified as an important form of SASP, and we speculated that some clusters of STC might primarily secrete extracellular vesicles as their main form of SASP. However, further experimental validation and exploration are needed to confirm this hypothesis.
Cluster10, which displayed the broadest secretome of SASP factors, was found to be involved in various immunomodulatory activities. For example, IL-6 is known to be involved in immune responses and inflammation and may promote tumor cell proliferation in animal models of skin, breast, prostate, and lung malignancies.27,50,51 The signaling via CXCL2/MIF-CXCR2 promotes the recruitment of myeloid-derived suppressor cells (MDSCs).52,53 CCL2 also recruits myeloid cells, which can develop into MDSCs.21 CXCL8, a key multifunctional cytokine, controls the paracrine proliferation, invasion, and migration of tumors.54 Additionally, CXCL8 plays a crucial role in neovascularization, which promotes tumor development and metastasis in the tumor microenvironment.54
We also explored the modulation of the TME by Cluster10 in this study, shedding light on its role in tumor immunity. LGALS9 was identified as the primary checkpoint signaled by Cluster10 cells, exerting an inhibitory effect on immune cells. Therefore, it represents a potential therapeutic target in LUAD. Positive relationships were observed between Cluster10 and immunosuppressive cells such as Tregs and MDSCs in various cancer types, including LUAD. CXCL2, CCL2, and IL-6 have been found to recruit MDSCs to the TME, and these cells modify the TME by generating VEGF and MMP9, which aid in the growth and spread of cancer.52,55 MDSCs also exert immunosuppression by inhibiting T cell activity through direct ligand-receptor interaction and the production of soluble inhibitory cytokines.56 Furthermore, several checkpoint expression levels were substantially linked with the signature of Cluster10 in multiple cancer types, including TIM3, TIGIT, PD-L1, LAG3, and CTLA4. Engagement of TIM3, upon binding to LGALS9 or CEACAM1, induces CD8+ T cell death or functional exhaustion, respectively. Preclinical investigations have provided insights into the therapeutic potential of TIM3 inhibition in combination with anti-PD-1 antibodies.57,58 These findings highlight the potential mechanisms by which immunosuppressive STC impedes immune clearance and accelerates tumor development.
Cellular senescence can be induced by a variety of cellular stresses, including persistent DNA damage.13 When irreparable DNA damage persists, the expression of various p53-target genes are induced, including cyclin-dependent kinase inhibitor (CDKI), p21 (Cip/Kip family) and the INK4 family CDKI p16.59 These CDKIs collaborate synergistically, imposing a persistent cell-cycle arrest that serves as the fundamental mechanism underlying the induction of cellular senescence. However, the recurring inactivation of both p53 and p16 genes often occurred across diverse human cancers.60 Indeed, the p53 and INK4a (p16) gene loci are frequently found to be mutated in human cancers.61 Moreover, hypermethylation events occurring at the p16 gene promoter, leading to the suppression of p16 gene expression, are commonly observed in these malignant settings.62 This epigenetic alteration effectively portrays the loss of the cellular senescence-inducing machinery within cancer cells.
Finally, the marker genes of immunosuppressive STC in immunotherapy response were explored. CXCL8 was identified as a potential serum predictor in immunotherapy response. CXCL8 has been proposed as a biomarker for predicting prognosis and immunotherapy resistance in multiple studies.63,64,65 Notably, elevated CXCL8 in the blood is associated with an indication-agnostic mechanism of resistance to immunotherapy.66 These studies verified our results of serum proteomic analysis. The mechanism of CXCL8 in immunotherapy is yet unknown and requires additional experimental research. As CXCL8 is easier to detect, its clinical implications for prognosis are promising.
Compared to earlier research, our study has several strengths. Firstly, it is the first study to characterize STC in LUAD and investigate its heterogeneity at the single-cell level, providing new insights into the understanding of senescence in cancer. Secondly, we identified and verified the signature of an immunosuppressive subtype of STC, which contributes to its detection and potential elimination. Our study incorporated more than 100,000 cells in single-cell analysis and over 13,000 transcriptomic samples in bulk analysis, enhancing the breadth and depth of our findings.
Limitations of the study
There are several limitations in our study. First, due to the limited number of patients in our in-house cohort, the application of CXCL8 in immunotherapy needs to be further verified in larger ones. Second, more experimental validations are needed to comprehensively interpret CXCL8 in the immune response.
STAR★Methods
Key resources table
| REAGENT or RESOURCE | SOURCE | IDENTIFIER |
|---|---|---|
| Antibodies | ||
| Rabbit monoclonal [KRT/1877R] to pan Cytokeratin | abcam | Cat# ab234297; RRID: AB_2895302 |
| CD8 Monoclonal Antibody (4B11)(MA1-80231) | Thermo Fisher Scientific | Cat# MA1-80231; RRID: AB_929437 |
| Rabbit monoclonal [EP1143Y] to Midkine | abcam | Cat# ab52637; RRID: AB_880698 |
| Rabbit monoclonal [EPR22214] to galectin 9/Gal-9 | abcam | Cat# ab227046; RRID: AB_2883983 |
| Rabbit monoclonal [EPR7952] to Nucleolin | abcam | Cat# ab129200; RRID: AB_11144140 |
| Rabbit monoclonal [CAL66] to CD8 alpha | abcam | Cat# ab237709; RRID: AB_2892677 |
| Rabbit monoclonal [EPR26511-74] to IL-8 | abcam | Cat# ab289967; RRID: AB_2933977 |
| CD45/PTPRC Mouse Monoclonal Antibody[C11-C101] | Beyotime | Cat# AG3024 |
| Biological samples | ||
| Human lung adenocarcinoma tissues | Cancer Hospital, Chinese Academy of Medical Sciences & Peking Union Medical College | N/A |
| Critical commercial assays | ||
| 7-Color Multiple IHC Kit | Akoya | AXT37100041 |
| Deposited data | ||
| TCGA databases RNA sequencing data | UCSC XENA | https://xenabrowser.net/datapages/ |
| GSE131907 | Kim et al.67 | http://www.ncbi.nlm.nih.gov/geo/ |
| E-MTAB-9970 | Jochems et al.28 | PMID: 34320349 |
| GSE31210 | Okayama et al.32 | PMID: 22080568 |
| Shedden | Shedden et al.31 | PMID: 18641660 |
| Bhattacharjee | Bhattacharjee et al.33 | PMID: 11707567 |
| Cho_NSCLC | Cho et al.34 | PMID: 32879421 |
| Lee_NSCLC | Lee et al.35 | PMID: 33857424 |
| Jung_NSCLC | Jung et al.36 | PMID: 32762727 |
| Riaz_SKCM | Riaz et al.37 | PMID: 29033130 |
| Liu_SKCM | Liu, D. et al.38 | PMID: 31792460 |
| Gide_SKCM | Gide et al.39 | PMID: 30753825 |
| Hugo_SKCM | Hugo et al.40 | PMID: 26997480 |
| Mariathasan_BLCA | Mariathasan et al.41 | PMID: 32416780 |
| Braun_RCC | Braun et al.42 | PMID: 32472114 |
| Zhao_GBM | Zhao et al.43 | PMID: 28912897 |
| Van_SKCM | Van et al.44 | PMID: 26359337 |
| Kim_GC | Kim et al.45 | PMID: 30013197 |
| Cuaran_NSCLC | Cuaran et al.46 | GEO: GSE161537 |
| Snyder_UC | Snyder et al.47 | PMID: 28552987 |
| The serum proteomics data | This study | the OMIX database (OMIX004819, https://ngdc.cncb.ac.cn/omix) |
| Software and algorithms | ||
| GSVA (v1.34.0) | Hänzelmann et al.68 | https://www.bioconductor.org/packages/release/bioc/html/GSVA.html |
| InferCNV | Patel et al.69 | https://github.com/broadinstitute/InferCNV |
| genomicInstability | Alvarez et al. | http://www.bioconductor.org/packages/release/bioc/html/genomicInstability.html |
| metacell | Baran et al.70 | https://github.com/tanaylab/metacell |
| WGCNA | Langfelder et al.71 | https://horvath.genetics.ucla.edu/html/CoexpressionNetwork/Rpackages/WGCNA/ |
| AUCell | Aibar et al.72 | http://www.bioconductor.org/packages/release/bioc/html/AUCell.html |
| Dorothea | Holland et al.73 | http://www.bioconductor.org/packages/release/data/experiment/html/dorothea.html |
| CellChat | Jin et al.74 | https://github.com/sqjin/CellChat |
| Other | ||
| Original code used in this study | This study | https://github.com/fgypumc/STC_in_LUAD) |
Resource availability
Lead contact
Further information and requests for resources and reagents should be directed to and will be fulfilled by the lead contact, Yuankai Shi (syuankai@cicams.ac.cn).
Materials availability
This study did not generate new unique reagents.
Experimental model and study participant details
Patient samples
We longitudinally collected serial plasma samples before and after treatment, including the 1st,2nd, 3rd or more than 3rd assessment time points. A total of 57 plasma samples were collected from August 2016 to September 2019 for 17 NSCLC patients. All the above have been informed consent and approved by the ethics committee of the Cancer Hospital of the Chinese Academy of Medical Sciences (No. 19-019/1804). This cohort included 14 Chinese males and 3 Chinese females and their median age was 60, ranging from 32 to 74. The detailed clinical information of all patients were in Table S6. All the blood samples were collected in EDTA tubes, after centrifuging at 16,000 g and 4°C for 10 minutes, the plasma was collected in a new tube and stored at -80°C until use. In addition, 21 tumors were obtained from treatment-free NSCLC patients at Cancer Hospital Chinese Academy Of Medical Science (Beijing, China), in accordance with institutional ethical guidelines and after informed consent of patient was obtained. The protocol was approved by the Ethical Committee of Institut Curie. This cohort included 15 Chinese males and 6 Chinese females and their median age was 56, ranging from 40 to 70.
The treatment efficacy was evaluated by oncologists and radiologists according to clinical and radiological examination results. The clinical response was defined as complete response, partial response, stable disease or progressive disease based on Response Evaluation Criteria in Solid Tumours (RECIST) version 1.1. Responder(R) patients were defined as patients with complete response/partial response within 6 months. Non-responder (NR) group included patients who had progressive disease/stable disease on/before 6 months. All experiments were executed with the approval of the Research Ethics Committee and according to the Declaration of Helsinki.
Method details
Data and materials
The single-cell LUAD data of GSE131907 was downloaded from Gene Expression Omnibus (GEO) database.67 To thoroughly examine the phenotype of STC in LUAD, 107761 cells from 15 original tumors, 7 metastatic lymph nodes, and 10 metastatic brain tissues were analyzed. Additionally, the clinical data and metadata were taken from the original study.
For bulk level analysis, we downloaded The Cancer Genome Atlas (TCGA) level 3 data from UCSC Xena (http://xena.ucsc.edu/), which included mRNA expression and clinical data for 32 cancer types. In addition, we collected 13 independent datasets including 3 LUAD cohorts and 10 immunotherapy cohorts from GEO for further analysis (Table S7). For these immunotherapy cohorts, patients were divided into two groups according to their response status: complete response (CR) and partial response (PR) as responders, or stable disease (SD) and progressive disease (PD) as non-responders.
The bulk transcriptomics data of 61 NSCLC patients treated with immunotherapy was obtained from an open-label, randomized controlled phase 3 trial (ORIENT-3) conducted in 39 centers across China (NCT03150875). The detailed information on the clinical trial could be obtained from the published article.75
InferCNV
We used InferCNV analysis (InferCNV of the Trinity CTAT Project: https://github.com/broadinstitute/InferCNV) to identify malignant cells. We extracted all fibroblasts (n=2562) and all endothelial cells (n=854) as reference normal cells. A raw counts matrix, annotation file, and gene/chromosome position file were prepared according to data requirements. The infercnv object was created using the function CreateInfercnvObject. Then we run the inferCNV analysis using the default parameters (cutoff =0.1, cluster_by_groups=TRUE, denoise=TRUE, HMM=FALSE).
Genomic instability score
The genomicInstability package was exploited to run genomic instability analysis in the tumor cells. Genomic instability analysis uses the aREA algorithm to quantitatively evaluate the connection between gene expression and chromosomal position by performing enrichment analysis of contiguously coded genes (loci-blocks) on the gene expression patterns of single cells. By default, the algorithm generates loci-blocks composed by 100 contiguous genes and with 75% overlap between blocks. The enrichment of each loci-block on the gene expression profile of each cell is expressed as Normalized Enrichment Scores (NES). The Genomic Instability Score (GIS) is estimated as the log of the NES variance for each cell, and the computation is performed by the function genomicInstabilityScore.
Metacell analysis
The metacell package was employed to partition tumor-labeled epithelial cells into multiple metacells.69 Initially, mitochondrial genes with the "MT-" prefix, known to signify cellular distress or impending demise, were excluded from the analysis. Subsequently, feature genes exhibiting a scaled variance greater than 0.08, as determined from count matrices of genes, were selected to evaluate cell-to-cell similarity employing Pearson correlations. Balanced K-nearest neighbor similarity graphs were constructed for malignant cells using the parameter K set to 100, thereby restricting the number of neighbors for each cell. Thereafter, resampling techniques were performed iteratively with 500 iterations, wherein 75% of the cells were resampled in each iteration. The resulting resampled cells were subjected to coclustering graph construction, with a minimum cluster size of 50. The average expression level of each gene within a given metacell was computed as the mean expression of that gene across its constituent individual cells. Additionally, the genomic instability score (GIS) for each metacell was defined as the average GIS of its constituent individual cells.
Screening for tumor-specific senescence-related genes
We assembled a curated list of senescence-related genes (n=1259) from previously published data, which originated from the bulk transcriptome analysis of 26 different tissue types.16 These 1259 genes were further categorized into two sets: 525 positive senescence-related genes and 734 negative senescence-related genes. Given that genomic instability serves as a hallmark of cancer, we performed inferCNV analysis at the single-cell level, which revealed a higher degree of genomic instability in tumor cells compared to immune cells and stromal cells. Therefore, our objective was to identify senescence-related genes that exhibit a significant correlation with genomic instability, as these genes may offer greater specificity for tumor cell senescence assessment.
To accomplish this, we employed the WGCNA method to screen for tumor-specific senescence-related genes.70 The expression matrix of these senescence-related genes (n=1259) within 332 metacells served as the input data. The pickSoftThreshold function was utilized to determine the optimal value of weighting parameters for the adjacent parts, which subsequently served as a soft threshold for constructing the network. Consequently, we constructed a weighted adjacency matrix and generated gene modules through hierarchical clustering based on the dissimilarity measure (1-Tom) of the topological overlap matrix. Subsequently, the 332 metacells were divided into two groups, namely high-GIS and low-GIS, based on the median GIS value. Finally, we calculated the correlation between the co-expression modules and the two GIS groups to explore potential associations.
The construction of senescence score
We identified two modules, MEpurple and MEtan, through WGCNA analysis that exhibited significant associations with GIS. These modules comprised genes involved in pro-senescence (in module MEpurple) and anti-senescence activities (in module MEtan), respectively. To assess the individual cell's anti/pro-senescence activities, we employed the R package AUCell. Firstly, we utilized the AUCell_buildRankings function with default parameters to compute gene expression rankings in each cell based on an expression matrix. Subsequently, for each gene set and cell, we computed area-under-the-curve (AUC) values using the AUCell_calcAUC function. These AUC values represent the fraction of genes within the top-ranking genes for each cell that are associated with the pathway gene set. Finally, we calculated the senescence score by subtracting the anti-senescence activities from the pro-senescence activities.
Differential expression analysis and gene set enrichment analysis (GSEA)
We used FindMarkers in Seurat package with MAST differentially expression analysis method to identify the DEGs between STC and non-STC. It was run with cutoff logfc 0.25, only.pos =F. We used Gene Set Enrichment Analysis (GSEA) in Rpackage fgsea to determine the enrichment of cancer hallmark (H dataset) and Biological Process Gene Ontology (GO) and Kyoto Encyclopedia of Genes and Genomes (KEGG) genesets.
Transcription factor analysis
We aimed to decipher the variation in TFs activity among clusters of STC. TF activity was inferred using the Dorothea resource (https://saezlab.github.io/dorothea), which contains signed TF-target interactions.71 We built TF regulons utilizing the 'dorothea regulon human' wrapper function from the 'dorothea' library, and selected the 'A', 'B', and 'C' levels of high-confidence TF, which have 13,223 interactions encompassing 271 TFs targeting 5321 distinct genes. In this context of single-cell data, we constructed regulons based on the mRNA expression levels of each TF along with the expression level of its direct targets. Then VIPER algorithm was combined with DoRothEA to estimate TF activities from the dorothea regulons using function run_viper.
CellChat analysis
The R package "CellChat" was applied to Cluster10 cells and other principal cell types in order to analyze the communication interactions and identify the communicating molecules at the single-cell level.72 Based on CellChatDB.human, we analyzed the primary signaling inputs and outputs among all cell clusters. The role of Cluster10 in the cell-cell communication network was reconigzed using netAnalysis_signalingRole_scatter. Using the “aggregateNet” function in CellChat, the aggregated cell-cell communication network was calculated, and the signaling from each cell group was visualized. Signaling groups based on their functional or structural similarity were identified via the function “computeNetSimilarity”. The outgoing/incoming signaling patterns of Cluster10 were calculated using the function “netAnalysis_signalingRole_heatmap”. The ligand-receptor pairs signaled from/to Cluster10 were recognized using the function “netVisual_bubble”.
Immune-related signatures
We used R package GSVA to calculate the signature of cluster10.73 Using TCGA pan-cancer datasets, we investigated the immune landscape of 32 cancer types. We calculated ImmuneScore, StromalScore, and MicroenvironmentScore to infer the tumor purity, abundances of stromal and immune cells. A curated immune gene set from Bindea et al. was used to quantify the compositions of various immune cells infiltrating each tumor sample.74 The list of SASP factors was compiled from the previously published literature (Table S3). Multiple immune checkpoints were extracted from a list of immunomodulators from Thorsson et al.68 (Table S8).
Measurement of serum proteome using DIA-MS
The peptide sample preparation and data-independent acquisition analysis were performed. Briefly, 2 μL serum sample were diluted with lysis buffer containing 6 M urea (Sigma, USA). Next, the serum was reduced with 10 mM Dithiothreitol (DTT) at 37°C for 60 min and then alkylated with 500 mM Iodoacetamide (IAA) at room temperature for 45 min in dark. The protein was sequentially digested with trypsin for 16 h at 37°C. The tryptic peptides were acidified with 1% trifluoroacetic acid and desalted with a C18 desalination column according to the manufacturer’s protocol. The desalted peptide was dried under vacuum and dissolved in 20 uL of buffer containing 0.1% formic acid and 2% acetonitrile. The peptide concentration was measured by Nanoscan (Analytik Jena AG, Jena, Germany). 1.5 μg peptides were separated on a 30 min LC gradient using an analytical column (150 μm × 250 mm, 2 μm 200 Å C18 particles) and injected into QE-HF mass spectrometer (Q Exactive HF Hybrid Quadrupole OrbitrapTM,Thermo Fisher). The DIA acquisition scheme consisted of 45 fixed Windows ranging from 350 to 1500 m/z. The resolution distribution of MS1 and MS2 is 60000 and 30000, respectively. A Spectronaut Pulsar X 12.0 (Biognosys, Schlieren, Switzerland) was used for identification and quantification. Finally, peptides FDR and Proteins FDR were all set at 1% (FDR).
MIF
The first panel of MIF including PanCK (abcam, ab234297), CD8 (Thermo Fisher Scientific, MA1-80231), LGALS9 (abcam, ab227046), CD45 (Beyotime, AG3024), MDK (abcam, ab52637), NCL (abcam, ab129200) was performed according to the manufacturer’s instructions (Akoya, 7-Color Multiple IHC Kit). The second panel of MIF including PanCK (abcam, ab234297), CXCL8 (abcam, ab289967) and CD8 (abcam, ab237709) was performed according to the manufacturer’s instructions. Briefly, slide sections of formalin-fixed paraffin-embedded (FFPE) block were deparaffinized in xylene and rehydrated in ethanol. After microwave antigen retrieval in heated citric acid buffer (pH 6.0) for 10 mins, endogenous peroxidase activity was blocked by 3% H2O2 for 10 mins, and nonspecific binding sites were blocked by goat serum for 10 mins. Primary antibodies were incubated for 1 h in a humidified chamber at room temperature, followed by incubation with the corresponding secondary horseradish peroxidase-conjugated polymer. Visualization of each target was accomplished using fluorescein TSA Plus (1:100). Then, the slide was again placed in a heated citric acid buffer (pH 6.0) using microwave antigen retrieval to remove redundant antibodies before the next step. Finally, nuclei were subsequently visualized with DAPI, and the sections were coverslipped using antifade mounting medium.
Quantification and statistical analysis
Mann-Whitney U test was used to analyze the differences between the two groups. Spearman's correlation test was used to analyze correlations between two variables. A two-tailed P-value of 0.05 was statistically significant. R 4.1.0 was used for the entire data processing, statistical analysis, and plotting processes.
Additional resources
The bulk transcriptomics data of 61 NSCLC patients treated with immunotherapy was obtained from an open-label, randomized controlled phase 3 trial (ORIENT-3) conducted in 39 centers across China (NCT03150875). The detailed information on the clinical trial could be obtained from the published article.75
Acknowledgments
This work was supported by China National Major Project for New Drug Innovation (2017ZX09304015, 2019ZX09201-002).
Author contributions
Conception/design, Y.K.S. and X.H.H.; methodology, G.Y.F., N.L., and T.J.X.; formal analysis, G.Y.F. and T.J.X.; writing–manuscript writing, G.Y.F., N.L., T.J.X., and S.S.W.; writing–revising & editing, Y.K.S. and X.H.H.
Declaration of interests
The authors declare that they have no competing interests.
Inclusion and diversity
We support inclusive, diverse, and equitable conduct of research.
Published: September 9, 2023
Footnotes
Supplemental information can be found online at https://doi.org/10.1016/j.isci.2023.107894.
Contributor Information
Xiaohong Han, Email: hanxiaohong@pumch.cn.
Yuankai Shi, Email: syuankai@cicams.ac.cn.
Supplemental information
Data and code availability
-
•
This paper analyzes existing, publicly available data. These accession numbers for the datasets are listed in the key resources table and Table S7. The serum proteomics data have been saved as the OMIX database (OMIX004819, https://ngdc.cncb.ac.cn/omix), which is listed in the key resources table. Any additional information required to reanalyze the data reported in this paper is available from the lead contact upon request.
-
•
All codes used for the bioinformatics analysis in this study were derived from existing software and algorithms, as listed in the key resources table. Code was reposited at the following link: (https://github.com/fgypumc/STC_in_LUAD).
References
- 1.Gorgoulis V., Adams P.D., Alimonti A., Bennett D.C., Bischof O., Bishop C., Campisi J., Collado M., Evangelou K., Ferbeyre G., et al. Cellular Senescence: Defining a Path Forward. Cell. 2019;179:813–827. doi: 10.1016/j.cell.2019.10.005. [DOI] [PubMed] [Google Scholar]
- 2.López-Otín C., Blasco M.A., Partridge L., Serrano M., Kroemer G. The Hallmarks of Aging. Cell. 2013;153:1194–1217. doi: 10.1016/j.cell.2013.05.039. [DOI] [PMC free article] [PubMed] [Google Scholar]
- 3.Macheret M., Halazonetis T.D. DNA Replication Stress as a Hallmark of Cancer. Annu. Rev. Pathol. 2015;10:425–448. doi: 10.1146/annurev-pathol-012414-040424. [DOI] [PubMed] [Google Scholar]
- 4.Ou H.L., Hoffmann R., González-López C., Doherty G.J., Korkola J.E., Muñoz-Espín D. Cellular senescence in cancer: from mechanisms to detection. Mol. Oncol. 2021;15:2634–2671. doi: 10.1002/1878-0261.12807. [DOI] [PMC free article] [PubMed] [Google Scholar]
- 5.Kim Y.H., Choi Y.W., Lee J., Soh E.Y., Kim J.-H., Park T.J. Senescent tumor cells lead the collective invasion in thyroid cancer. Nat. Commun. 2017;8:15208. doi: 10.1038/ncomms15208. [DOI] [PMC free article] [PubMed] [Google Scholar]
- 6.Braig M., Lee S., Loddenkemper C., Rudolph C., Peters A.H.F.M., Schlegelberger B., Stein H., Dörken B., Jenuwein T., Schmitt C.A. Oncogene-induced senescence as an initial barrier in lymphoma development. Nature. 2005;436:660–665. doi: 10.1038/nature03841. [DOI] [PubMed] [Google Scholar]
- 7.Chen S., Zhu G., Yang Y., Wang F., Xiao Y.-T., Zhang N., Bian X., Zhu Y., Yu Y., Liu F., et al. Single-cell analysis reveals transcriptomic remodellings in distinct cell types that contribute to human prostate cancer progression. Nat. Cell Biol. 2021;23:87–98. doi: 10.1038/s41556-020-00613-6. [DOI] [PubMed] [Google Scholar]
- 8.Faget D.V., Ren Q., Stewart S.A. Unmasking senescence: context-dependent effects of SASP in cancer. Nat. Rev. Cancer. 2019;19:439–453. doi: 10.1038/s41568-019-0156-2. [DOI] [PubMed] [Google Scholar]
- 9.Takasugi M., Yoshida Y., Ohtani N. Cellular senescence and the tumour microenvironment. Mol. Oncol. 2022;16:3333–3351. doi: 10.1002/1878-0261.13268. [DOI] [PMC free article] [PubMed] [Google Scholar]
- 10.Moiseeva O., Guillon J., Ferbeyre G. Senescence: A program in the road to cell elimination and cancer. Semin. Cancer Biol. 2022;81:48–53. doi: 10.1016/j.semcancer.2020.12.017. [DOI] [PubMed] [Google Scholar]
- 11.Sikora E., Bielak-Zmijewska A., Mosieniak G. A common signature of cellular senescence; does it exist? Ageing Res. Rev. 2021;71:101458. doi: 10.1016/j.arr.2021.101458. [DOI] [PubMed] [Google Scholar]
- 12.Wang L., Lankhorst L., Bernards R. Exploiting senescence for the treatment of cancer. Nat. Rev. Cancer. 2022;22:340–355. doi: 10.1038/s41568-022-00450-9. [DOI] [PubMed] [Google Scholar]
- 13.Park S.S., Choi Y.W., Kim J.-H., Kim H.S., Park T.J. Senescent tumor cells: an overlooked adversary in the battle against cancer. Exp. Mol. Med. 2021;53:1834–1841. doi: 10.1038/s12276-021-00717-5. [DOI] [PMC free article] [PubMed] [Google Scholar]
- 14.Shafqat S., Arana Chicas E., Shafqat A., Hashmi S.K. The Achilles’ heel of cancer survivors: fundamentals of accelerated cellular senescence. J. Clin. Invest. 2022;132:e158452. doi: 10.1172/JCI158452. [DOI] [PMC free article] [PubMed] [Google Scholar]
- 15.Schmitt C.A., Wang B., Demaria M. Senescence and cancer — role and therapeutic opportunities. Nat. Rev. Clin. Oncol. 2022;19:619–636. doi: 10.1038/s41571-022-00668-4. [DOI] [PMC free article] [PubMed] [Google Scholar]
- 16.Chatsirisupachai K., Palmer D., Ferreira S., de Magalhães J.P. A human tissue-specific transcriptomic analysis reveals a complex relationship between aging, cancer, and cellular senescence. Aging Cell. 2019;18:e13041. doi: 10.1111/acel.13041. [DOI] [PMC free article] [PubMed] [Google Scholar]
- 17.Ruhland M.K., Coussens L.M., Stewart S.A. Senescence and cancer: An evolving inflammatory paradox. Biochim. Biophys. Acta. 2016;1865:14–22. doi: 10.1016/j.bbcan.2015.10.001. [DOI] [PMC free article] [PubMed] [Google Scholar]
- 18.Hoare M., Ito Y., Kang T.-W., Weekes M.P., Matheson N.J., Patten D.A., Shetty S., Parry A.J., Menon S., Salama R., et al. NOTCH1 mediates a switch between two distinct secretomes during senescence. Nat. Cell Biol. 2016;18:979–992. doi: 10.1038/ncb3397. [DOI] [PMC free article] [PubMed] [Google Scholar]
- 19.Wiley C.D., Flynn J.M., Morrissey C., Lebofsky R., Shuga J., Dong X., Unger M.A., Vijg J., Melov S., Campisi J. Analysis of individual cells identifies cell-to-cell variability following induction of cellular senescence. Aging Cell. 2017;16:1043–1050. doi: 10.1111/acel.12632. [DOI] [PMC free article] [PubMed] [Google Scholar]
- 20.Di Mitri D., Toso A., Chen J.J., Sarti M., Pinton S., Jost T.R., D’Antuono R., Montani E., Garcia-Escudero R., Guccini I., et al. Tumour-infiltrating Gr-1+ myeloid cells antagonize senescence in cancer. Nature. 2014;515:134–137. doi: 10.1038/nature13638. [DOI] [PubMed] [Google Scholar]
- 21.Eggert T., Wolter K., Ji J., Ma C., Yevsa T., Klotz S., Medina-Echeverz J., Longerich T., Forgues M., Reisinger F., et al. Distinct Functions of Senescence-Associated Immune Responses in Liver Tumor Surveillance and Tumor Progression. Cancer Cell. 2016;30:533–547. doi: 10.1016/j.ccell.2016.09.003. [DOI] [PMC free article] [PubMed] [Google Scholar]
- 22.Sanders Y.Y., Liu H., Zhang X., Hecker L., Bernard K., Desai L., Liu G., Thannickal V.J. Histone Modifications in Senescence-Associated Resistance to Apoptosis by Oxidative Stress. Redox Biol. 2013;1:8–16. doi: 10.1016/j.redox.2012.11.004. [DOI] [PMC free article] [PubMed] [Google Scholar]
- 23.Ryu S.J., Oh Y.S., Park S.C. Failure of stress-induced downregulation of Bcl-2 contributes to apoptosis resistance in senescent human diploid fibroblasts. Cell Death Differ. 2007;14:1020–1028. doi: 10.1038/sj.cdd.4402091. [DOI] [PubMed] [Google Scholar]
- 24.Acosta J.C., O’Loghlen A., Banito A., Guijarro M.V., Augert A., Raguz S., Fumagalli M., Da Costa M., Brown C., Popov N., et al. Chemokine Signaling via the CXCR2 Receptor Reinforces Senescence. Cell. 2008;133:1006–1018. doi: 10.1016/j.cell.2008.03.038. [DOI] [PubMed] [Google Scholar]
- 25.Freund A., Patil C.K., Campisi J. p38MAPK is a novel DNA damage response-independent regulator of the senescence-associated secretory phenotype: p38 regulates the senescence secretory phenotype. EMBO J. 2011;30:1536–1548. doi: 10.1038/emboj.2011.69. [DOI] [PMC free article] [PubMed] [Google Scholar]
- 26.Yang R., Sun L., Li C.-F., Wang Y.-H., Yao J., Li H., Yan M., Chang W.-C., Hsu J.-M., Cha J.-H., et al. Galectin-9 interacts with PD-1 and TIM-3 to regulate T cell death and is a target for cancer immunotherapy. Nat. Commun. 2021;12:832. doi: 10.1038/s41467-021-21099-2. [DOI] [PMC free article] [PubMed] [Google Scholar]
- 27.Toso A., Revandkar A., Di Mitri D., Guccini I., Proietti M., Sarti M., Pinton S., Zhang J., Kalathur M., Civenni G., et al. Enhancing Chemotherapy Efficacy in Pten -Deficient Prostate Tumors by Activating the Senescence-Associated Antitumor Immunity. Cell Rep. 2014;9:75–89. doi: 10.1016/j.celrep.2014.08.044. [DOI] [PubMed] [Google Scholar]
- 28.Jochems F., Thijssen B., De Conti G., Jansen R., Pogacar Z., Groot K., Wang L., Schepers A., Wang C., Jin H., et al. The Cancer SENESCopedia: A delineation of cancer cell senescence. Cell Rep. 2021;36:109441. doi: 10.1016/j.celrep.2021.109441. [DOI] [PMC free article] [PubMed] [Google Scholar]
- 29.Cen S., Wang P., Xie Z., Yang R., Li J., Liu Z., Wang S., Wu X., Liu W., Li M., et al. Autophagy enhances mesenchymal stem cell-mediated CD4+ T cell migration and differentiation through CXCL8 and TGF-β1. Stem Cell Res. Ther. 2019;10:265. doi: 10.1186/s13287-019-1380-0. [DOI] [PMC free article] [PubMed] [Google Scholar]
- 30.Semba T., Wang X., Xie X., Cohen E.N., Reuben J.M., Dalby K.N., Long J.P., Phi L.T.H., Tripathy D., Ueno N.T. Identification of the JNK-Active Triple-Negative Breast Cancer Cluster Associated With an Immunosuppressive Tumor Microenvironment. J. Natl. Cancer Inst. 2022;114:97–108. doi: 10.1093/jnci/djab128. [DOI] [PMC free article] [PubMed] [Google Scholar]
- 31.Bhattacharjee A., Richards W.G., Staunton J., Li C., Monti S., Vasa P., Ladd C., Beheshti J., Bueno R., Gillette M., et al. Classification of human lung carcinomas by mRNA expression profiling reveals distinct adenocarcinoma subclasses. Proc. Natl. Acad. Sci. USA. 2001;98:13790–13795. doi: 10.1073/pnas.191502998. [DOI] [PMC free article] [PubMed] [Google Scholar]
- 32.Director’s Challenge Consortium for the Molecular Classification of Lung Adenocarcinoma. Shedden K., Taylor J.M.G., Enkemann S.A., Tsao M.-S., Yeatman T.J., Gerald W.L., Eschrich S., Jurisica I., Giordano T.J., et al. Gene expression-based survival prediction in lung adenocarcinoma: a multi-site, blinded validation study. Nat. Med. 2008;14 doi: 10.1038/nm.1790. [DOI] [PMC free article] [PubMed] [Google Scholar]
- 33.Okayama H., Kohno T., Ishii Y., Shimada Y., Shiraishi K., Iwakawa R., Furuta K., Tsuta K., Shibata T., Yamamoto S., et al. Identification of genes upregulated in ALK-positive and EGFR/KRAS/ALK-negative lung adenocarcinomas. Cancer Res. 2012;72:100–111. doi: 10.1158/0008-5472.CAN-11-1403. [DOI] [PubMed] [Google Scholar]
- 34.Snyder A., Nathanson T., Funt S.A., Ahuja A., Buros Novik J., Hellmann M.D., Chang E., Aksoy B.A., Al-Ahmadie H., Yusko E., et al. Contribution of systemic and somatic factors to clinical response and resistance to PD-L1 blockade in urothelial cancer: An exploratory multi-omic analysis. PLoS Med. 2017;14:e1002309. doi: 10.1371/journal.pmed.1002309. [DOI] [PMC free article] [PubMed] [Google Scholar]
- 35.Cho J.-W., Hong M.H., Ha S.-J., Kim Y.-J., Cho B.C., Lee I., Kim H.R. Genome-wide identification of differentially methylated promoters and enhancers associated with response to anti-PD-1 therapy in non-small cell lung cancer. Exp. Mol. Med. 2020;52:1550–1563. doi: 10.1038/s12276-020-00493-8. [DOI] [PMC free article] [PubMed] [Google Scholar]
- 36.Lee J.S., Nair N.U., Dinstag G., Chapman L., Chung Y., Wang K., Sinha S., Cha H., Kim D., Schperberg A.V., et al. Synthetic lethality-mediated precision oncology via the tumor transcriptome. Cell. 2021;184:2487–2502.e13. doi: 10.1016/j.cell.2021.03.030. [DOI] [PMC free article] [PubMed] [Google Scholar]
- 37.Kim J.Y., Choi J.K., Jung H. Genome-wide methylation patterns predict clinical benefit of immunotherapy in lung cancer. Clin. Epigenet. 2020;12:119. doi: 10.1186/s13148-020-00907-4. [DOI] [PMC free article] [PubMed] [Google Scholar]
- 38.Riaz N., Havel J.J., Makarov V., Desrichard A., Urba W.J., Sims J.S., Hodi F.S., Martín-Algarra S., Mandal R., Sharfman W.H., et al. Tumor and Microenvironment Evolution during Immunotherapy with Nivolumab. Cell. 2017;171:934–949.e16. doi: 10.1016/j.cell.2017.09.028. [DOI] [PMC free article] [PubMed] [Google Scholar]
- 39.Liu D., Schilling B., Liu D., Sucker A., Livingstone E., Jerby-Arnon L., Zimmer L., Gutzmer R., Satzger I., Loquai C., et al. Integrative molecular and clinical modeling of clinical outcomes to PD1 blockade in patients with metastatic melanoma. Nat. Med. 2019;25:1916–1927. doi: 10.1038/s41591-019-0654-5. [DOI] [PMC free article] [PubMed] [Google Scholar]
- 40.Gide T.N., Quek C., Menzies A.M., Tasker A.T., Shang P., Holst J., Madore J., Lim S.Y., Velickovic R., Wongchenko M., et al. Distinct Immune Cell Populations Define Response to Anti-PD-1 Monotherapy and Anti-PD-1/Anti-CTLA-4 Combined Therapy. Cancer Cell. 2019;35:238–255.e6. doi: 10.1016/j.ccell.2019.01.003. [DOI] [PubMed] [Google Scholar]
- 41.Hugo W., Zaretsky J.M., Sun L., Song C., Moreno B.H., Hu-Lieskovan S., Berent-Maoz B., Pang J., Chmielowski B., Cherry G., et al. Genomic and Transcriptomic Features of Response to Anti-PD-1 Therapy in Metastatic Melanoma. Cell. 2016;165:35–44. doi: 10.1016/j.cell.2016.02.065. [DOI] [PMC free article] [PubMed] [Google Scholar]
- 42.Galsky M.D., Arija J.Á.A., Bamias A., Davis I.D., De Santis M., Kikuchi E., Garcia-Del-Muro X., De Giorgi U., Mencinger M., Izumi K., et al. Atezolizumab with or without chemotherapy in metastatic urothelial cancer (IMvigor130): a multicentre, randomised, placebo-controlled phase 3 trial. Lancet Lond. Engl. 2020;395:1547–1557. doi: 10.1016/S0140-6736(20)30230-0. [DOI] [PubMed] [Google Scholar]
- 43.Braun D.A., Hou Y., Bakouny Z., Ficial M., Sant’ Angelo M., Forman J., Ross-Macdonald P., Berger A.C., Jegede O.A., Elagina L., et al. Interplay of somatic alterations and immune infiltration modulates response to PD-1 blockade in advanced clear cell renal cell carcinoma. Nat. Med. 2020;26:909–918. doi: 10.1038/s41591-020-0839-y. [DOI] [PMC free article] [PubMed] [Google Scholar]
- 44.Chen Y.-P., Zhang Y., Lv J.-W., Li Y.-Q., Wang Y.-Q., He Q.-M., Yang X.-J., Sun Y., Mao Y.-P., Yun J.-P., et al. Genomic Analysis of Tumor Microenvironment Immune Types across 14 Solid Cancer Types: Immunotherapeutic Implications. Theranostics. 2017;7:3585–3594. doi: 10.7150/thno.21471. [DOI] [PMC free article] [PubMed] [Google Scholar]
- 45.Van Allen E.M., Miao D., Schilling B., Shukla S.A., Blank C., Zimmer L., Sucker A., Hillen U., Foppen M.H.G., Goldinger S.M., et al. Genomic correlates of response to CTLA-4 blockade in metastatic melanoma. Science. 2015;350:207–211. doi: 10.1126/science.aad0095. [DOI] [PMC free article] [PubMed] [Google Scholar]
- 46.Kim S.T., Cristescu R., Bass A.J., Kim K.-M., Odegaard J.I., Kim K., Liu X.Q., Sher X., Jung H., Lee M., et al. Comprehensive molecular characterization of clinical responses to PD-1 inhibition in metastatic gastric cancer. Nat. Med. 2018;24:1449–1458. doi: 10.1038/s41591-018-0101-z. [DOI] [PubMed] [Google Scholar]
- 47.Foy J.-P., Karabajakian A., Ortiz-Cuaran S., Boussageon M., Michon L., Bouaoud J., Fekiri D., Robert M., Baffert K.-A., Hervé G., et al. Immunologically active phenotype by gene expression profiling is associated with clinical benefit from PD-1/PD-L1 inhibitors in real-world head and neck and lung cancer patients. Eur. J. Cancer. 2022;174:287–298. doi: 10.1016/j.ejca.2022.06.034. [DOI] [PubMed] [Google Scholar]
- 48.Xu P., Wang M., Song W.M., Wang Q., Yuan G.-C., Sudmant P.H., Zare H., Tu Z., Orr M.E., Zhang B. The landscape of human tissue and cell type specific expression and co-regulation of senescence genes. Mol. Neurodegener. 2022;17:5. doi: 10.1186/s13024-021-00507-7. [DOI] [PMC free article] [PubMed] [Google Scholar]
- 49.Wang X., Ma L., Pei X., Wang H., Tang X., Pei J.-F., Ding Y.-N., Qu S., Wei Z.-Y., Wang H.-Y., et al. Comprehensive assessment of cellular senescence in the tumor microenvironment. Briefings Bioinf. 2022;23:bbac118. doi: 10.1093/bib/bbac118. [DOI] [PMC free article] [PubMed] [Google Scholar]
- 50.Lederle W., Depner S., Schnur S., Obermueller E., Catone N., Just A., Fusenig N.E., Mueller M.M. IL-6 promotes malignant growth of skin SCCs by regulating a network of autocrine and paracrine cytokines. Int. J. Cancer. 2011;128:2803–2814. doi: 10.1002/ijc.25621. [DOI] [PubMed] [Google Scholar]
- 51.Di G.H., Liu Y., Lu Y., Liu J., Wu C., Duan H.-F. IL-6 Secreted from Senescent Mesenchymal Stem Cells Promotes Proliferation and Migration of Breast Cancer Cells. PLoS One. 2014;9:e113572. doi: 10.1371/journal.pone.0113572. [DOI] [PMC free article] [PubMed] [Google Scholar]
- 52.Neamah W.H., Singh N.P., Alghetaa H., Abdulla O.A., Chatterjee S., Busbee P.B., Nagarkatti M., Nagarkatti P. AhR Activation Leads to Massive Mobilization of Myeloid-Derived Suppressor Cells with Immunosuppressive Activity through Regulation of CXCR2 and MicroRNA miR-150-5p and miR-543-3p That Target Anti-Inflammatory Genes. J. Immunol. 2019;203:1830–1844. doi: 10.4049/jimmunol.1900291. [DOI] [PMC free article] [PubMed] [Google Scholar]
- 53.Deng X., Li X., Guo X., Lu Y., Xie Y., Huang X., Lin J., Tan W., Wang C. Myeloid-derived suppressor cells promote tumor growth and sorafenib resistance by inducing FGF1 upregulation and fibrosis. Neoplasia. 2022;28:100788. doi: 10.1016/j.neo.2022.100788. [DOI] [PMC free article] [PubMed] [Google Scholar]
- 54.Alfaro C., Sanmamed M.F., Rodríguez-Ruiz M.E., Teijeira Á., Oñate C., González Á., Ponz M., Schalper K.A., Pérez-Gracia J.L., Melero I. Interleukin-8 in cancer pathogenesis, treatment and follow-up. Cancer Treat Rev. 2017;60:24–31. doi: 10.1016/j.ctrv.2017.08.004. [DOI] [PubMed] [Google Scholar]
- 55.Wang Y., Johnson K.C.C., Gatti-Mays M.E., Li Z. Emerging strategies in targeting tumor-resident myeloid cells for cancer immunotherapy. J. Hematol. Oncol. 2022;15:118. doi: 10.1186/s13045-022-01335-y. [DOI] [PMC free article] [PubMed] [Google Scholar]
- 56.Schroeter A., Roesel M.J., Matsunaga T., Xiao Y., Zhou H., Tullius S.G. Aging Affects the Role of Myeloid-Derived Suppressor Cells in Alloimmunity. Front. Immunol. 2022;13:917972. doi: 10.3389/fimmu.2022.917972. [DOI] [PMC free article] [PubMed] [Google Scholar]
- 57.Wolf Y., Anderson A.C., Kuchroo V.K. TIM3 comes of age as an inhibitory receptor. Nat. Rev. Immunol. 2020;20:173–185. doi: 10.1038/s41577-019-0224-6. [DOI] [PMC free article] [PubMed] [Google Scholar]
- 58.Kraehenbuehl L., Weng C.-H., Eghbali S., Wolchok J.D., Merghoub T. Enhancing immunotherapy in cancer by targeting emerging immunomodulatory pathways. Nat. Rev. Clin. Oncol. 2022;19:37–50. doi: 10.1038/s41571-021-00552-7. [DOI] [PubMed] [Google Scholar]
- 59.Di Micco R., Krizhanovsky V., Baker D., d’Adda Di Fagagna F. Cellular senescence in ageing: from mechanisms to therapeutic opportunities. Nat. Rev. Mol. Cell Biol. 2021;22:75–95. doi: 10.1038/s41580-020-00314-w. [DOI] [PMC free article] [PubMed] [Google Scholar]
- 60.Chandler H., Peters G. Stressing the cell cycle in senescence and aging. Curr. Opin. Cell Biol. 2013;25:765–771. doi: 10.1016/j.ceb.2013.07.005. [DOI] [PubMed] [Google Scholar]
- 61.Yurgelun M.B., Kulke M.H., Fuchs C.S., Allen B.A., Uno H., Hornick J.L., Ukaegbu C.I., Brais L.K., McNamara P.G., Mayer R.J., et al. Cancer Susceptibility Gene Mutations in Individuals With Colorectal Cancer. J. Clin. Oncol. 2017;35:1086–1095. doi: 10.1200/JCO.2016.71.0012. [DOI] [PMC free article] [PubMed] [Google Scholar]
- 62.Cao Z., Wei L., Zhu W., Yao X. Meta-analysis of CDKN2A methylation to find its role in prostate cancer development and progression, and also to find the effect of CDKN2A expression on disease-free survival (PRISMA) Medicine (Baltim.) 2018;97 doi: 10.1097/MD.0000000000010182. [DOI] [PMC free article] [PubMed] [Google Scholar]
- 63.Oyanagi J., Koh Y., Sato K., Mori K., Teraoka S., Akamatsu H., Kanai K., Hayata A., Tokudome N., Akamatsu K., et al. Predictive value of serum protein levels in patients with advanced non-small cell lung cancer treated with nivolumab. Lung Cancer. 2019;132:107–113. doi: 10.1016/j.lungcan.2019.03.020. [DOI] [PubMed] [Google Scholar]
- 64.Liu Q., Li A., Yu S., Qin S., Han N., Pestell R.G., Han X., Wu K. DACH1 antagonizes CXCL8 to repress tumorigenesis of lung adenocarcinoma and improve prognosis. J. Hematol. Oncol. 2018;11:53. doi: 10.1186/s13045-018-0597-1. [DOI] [PMC free article] [PubMed] [Google Scholar]
- 65.Harel M., Lahav C., Jacob E., Dahan N., Sela I., Elon Y., Raveh Shoval S., Yahalom G., Kamer I., Zer A., et al. Longitudinal plasma proteomic profiling of patients with non-small cell lung cancer undergoing immune checkpoint blockade. J. Immunother. Cancer. 2022;10:e004582. doi: 10.1136/jitc-2022-004582. [DOI] [PMC free article] [PubMed] [Google Scholar]
- 66.Schalper K.A., Carleton M., Zhou M., Chen T., Feng Y., Huang S.-P., Walsh A.M., Baxi V., Pandya D., Baradet T., et al. Elevated serum interleukin-8 is associated with enhanced intratumor neutrophils and reduced clinical benefit of immune-checkpoint inhibitors. Nat. Med. 2020;26:688–692. doi: 10.1038/s41591-020-0856-x. [DOI] [PMC free article] [PubMed] [Google Scholar]
- 67.Kim N., Kim H.K., Lee K., Hong Y., Cho J.H., Choi J.W., Lee J.-I., Suh Y.-L., Ku B.M., Eum H.H., et al. Single-cell RNA sequencing demonstrates the molecular and cellular reprogramming of metastatic lung adenocarcinoma. Nat. Commun. 2020;11:2285. doi: 10.1038/s41467-020-16164-1. [DOI] [PMC free article] [PubMed] [Google Scholar]
- 68.Thorsson V., Gibbs D.L., Brown S.D., Wolf D., Bortone D.S., Ou Yang T.-H., Porta-Pardo E., Gao G.F., Plaisier C.L., Eddy J.A., et al. The Immune Landscape of Cancer. Immunity. 2018;48:812–830.e14. doi: 10.1016/j.immuni.2018.03.023. [DOI] [PMC free article] [PubMed] [Google Scholar]
- 69.Baran Y., Bercovich A., Sebe-Pedros A., Lubling Y., Giladi A., Chomsky E., Meir Z., Hoichman M., Lifshitz A., Tanay A. MetaCell: analysis of single-cell RNA-seq data using K-nn graph partitions. Genome Biol. 2019;20:206. doi: 10.1186/s13059-019-1812-2. [DOI] [PMC free article] [PubMed] [Google Scholar]
- 70.Langfelder P., Horvath S. WGCNA: an R package for weighted correlation network analysis. BMC Bioinf. 2008;9:559. doi: 10.1186/1471-2105-9-559. [DOI] [PMC free article] [PubMed] [Google Scholar]
- 71.Holland C.H., Tanevski J., Perales-Patón J., Gleixner J., Kumar M.P., Mereu E., Joughin B.A., Stegle O., Lauffenburger D.A., Heyn H., et al. Robustness and applicability of transcription factor and pathway analysis tools on single-cell RNA-seq data. Genome Biol. 2020;21:36. doi: 10.1186/s13059-020-1949-z. [DOI] [PMC free article] [PubMed] [Google Scholar]
- 72.Jin S., Guerrero-Juarez C.F., Zhang L., Chang I., Ramos R., Kuan C.-H., Myung P., Plikus M.V., Nie Q. Inference and analysis of cell-cell communication using CellChat. Nat. Commun. 2021;12:1088. doi: 10.1038/s41467-021-21246-9. [DOI] [PMC free article] [PubMed] [Google Scholar]
- 73.Hänzelmann S., Castelo R., Guinney J. GSVA: gene set variation analysis for microarray and RNA-seq data. BMC Bioinf. 2013;14:7. doi: 10.1186/1471-2105-14-7. [DOI] [PMC free article] [PubMed] [Google Scholar]
- 74.Bindea G., Mlecnik B., Tosolini M., Kirilovsky A., Waldner M., Obenauf A.C., Angell H., Fredriksen T., Lafontaine L., Berger A., et al. Spatiotemporal Dynamics of Intratumoral Immune Cells Reveal the Immune Landscape in Human Cancer. Immunity. 2013;39:782–795. doi: 10.1016/j.immuni.2013.10.003. [DOI] [PubMed] [Google Scholar]
- 75.Shi Y., Wu L., Yu X., Xing P., Wang Y., Zhou J., Wang A., Shi J., Hu Y., Wang Z., et al. Sintilimab versus docetaxel as second-line treatment in advanced or metastatic squamous non-small-cell lung cancer: an open-label, randomized controlled phase 3 trial (ORIENT-3) Cancer Commun. 2022;42:1314–1330. doi: 10.1002/cac2.12385. [DOI] [PMC free article] [PubMed] [Google Scholar]
Associated Data
This section collects any data citations, data availability statements, or supplementary materials included in this article.
Supplementary Materials
Data Availability Statement
-
•
This paper analyzes existing, publicly available data. These accession numbers for the datasets are listed in the key resources table and Table S7. The serum proteomics data have been saved as the OMIX database (OMIX004819, https://ngdc.cncb.ac.cn/omix), which is listed in the key resources table. Any additional information required to reanalyze the data reported in this paper is available from the lead contact upon request.
-
•
All codes used for the bioinformatics analysis in this study were derived from existing software and algorithms, as listed in the key resources table. Code was reposited at the following link: (https://github.com/fgypumc/STC_in_LUAD).