Abstract
Objective:
This study explored the relationship between the activation of the jak/stat3 signaling pathway and the CSN5 gene transcript and protein expression levels in the hematopoietic stem cells of patients with myelodysplastic syndromes (MDSs). This study also aimed to investigate the correlation between the expression level of CSN5 and the deubiquitination of HSF1, as well as the transcript level of the spi1/pu.1 genes to explore the pathogenesis of MDS.
Materials and Methods:
We isolated cells from normal individuals and MDS patients, and the mRNA and protein expression levels of spi1/pu.1 in cd34+ cells (hematopoietic stem cells) were measured by PCR and western blotting, respectively. A ChIP assay was used to detect the binding of HSF1 to the spi1/pu.1 promoter in cd34+ cells. The ubiquitination of HSF1 in cd34+ cells was detected by CO-IP. The binding of HSF1 and Fbxw7α was detected in in cd34+ cells by CO-IP. The binding of HSF1 and CSN5 was evaluated. A luciferase reporter assay was used to detect the effect of STAT3 on CSN5 promoter activation in cd34+ cells. Western blotting was used to detect the phosphorylation of STAT3 in cd34+ cells of MDS patients. The binding of STAT3 and C/EBP beta in cd34+ cells was detected by CO-IP.
Results:
Inhibition of SPI1/PU.1 expression was observed in MDS samples with low proliferation ability. Further experiments proved that phosphorylation of STAT3 affected CSN5 function and mediated the ubiquitination of HSF, the upstream regulator of SPI1/PU.1 transcription, which led to the inhibition of SPI1/PU.1 expression. Restoration of CSN5 rescued the inhibition of HSF1 ubiquitination, causing SPI1/PU.1 transcription to resume and increasing SPI1/PU.1 expression, promoting the recovery of cell proliferation in hypocellular MDS.
Conclusions:
Our research revealed the regulatory role of the CSN5/HSF/SPI1/PU.1 axis in hypocellular MDS, providing a probable target for clinical intervention.
Key Words: myelodysplastic syndromes, signaling pathway, gene transcription
Myelodysplastic syndromes (MDSs) are characterized by ineffective hematopoiesis that manifests as peripheral blood cytopenia and increased bone marrow (BM) cellularity.1 Most MDS patients have normocellular or hypercellular BM; however, a minority of MDS patients have hypocellular BM.2
To fully understand the regulatory pattern of hematopoietic cells in MDS, we referred to the KEGG database (see figure, Supplemental Digital Content 1, http://links.lww.com/JPHO/A631) and found an important transcription factor, SPI1/PU.1. When the transcriptional activity of SPI1/PU.1 was inhibited, the transcription of its downstream target gene CSF1R was sequentially impaired, which led to cell differentiation arrest.3 Studies have shown that the expression or function of the PU.1 gene is obviously inhibited in MDS patients,4 indicating that SPI1/PU.1 is closely correlated with the pathogenesis of MDS. However, the underlying mechanism of SPI1/PU.1 downregulation in MDS patients remains unclear. Bioinformatic analysis of the transcriptional regulation of SPI1/PU.1 revealed that HSF1 is the only transcriptional regulator,5 and it is likely that the reduced expression of SPI1/PU.1 is related to HSF1. Since the expression of CSN5 is regulated by the STAT3/CEBP-beta axis,6,7 we hypothesized that suppression of STAT3/CEBP-beta axis activation resulted in downregulated expression of CSN5 in MDS cells, which further inhibited the activation of the downstream genes HSF1 and SPI1/PU.1, causing differentiation arrest in hematopoietic cells.
MATERIALS AND METHODS
Cell Lines and Culture
BM cells were isolated from fresh BM of normal humans and MDS patients. Isolation of mononuclear cells from BM was performed as follows: fresh BM (3 mL) was diluted with an equal volume of PBS (3 mL) containing 10% FBS (Cat No. 61870094 HyClone, Logan, UT) before being mixed with 6 mL of lymphocyte separation medium and centrifuged at 2000 rpm for 20 minutes. Afterward, the mononuclear cells were washed and centrifuged with 5 volumes of PBS containing 10% FBS at 1000 rpm 2 times for 10 minutes each. The isolated cells were cultured with RPMI 1640 medium (Gibco, Invitrogen Corporation, NY) containing 10% FBS, 100 U/mL penicillin (Sigma, St. Louis, MO), and 100 μg/mL streptomycin (Sigma, St. Louis, MO). CD34+ magnetic beads were acquired commercially from STEMCELL Technologies Inc. (Vancouver, British Columbia, Canada), and magnetic-activated cell sorting was performed with the CD34+ magnetic beads according to the manufacturer’s instructions. Generally, the magnetic beads were washed with precooled washing buffer before use. Then, cells were incubated with the magnetic beads for 30 minutes, and the CD34+ cells were collected by application of a magnetic force and purified by washing 3 times using the buffers contained in the kit. The collection of all blood samples in our research center was approved by the institutional review board of the Hematological Institute of Southeast University, and all individuals were required to provide written informed consent.
Cell Transfection Experiment
For experiments with CSN5 overexpression plasmid transfection, MDS cells were transfected with 2 μg of either the NC or Flag-HA-COPS5 plasmid (#22541, Addgene, http://www.addgene.org) in 200 μL of OPTI-MEM containing 5 μL of Lipofectamine 3000. After 72 hours, 200 μg/mL puromycin (Sigma, St. Louis, MO) was added for selection of successfully transfected cells.
Dual Luciferase Reporter Assay
The CSN5 dual luciferase reporter system was constructed by HIBIO Biotechnology Company (Hangzhou, Zhejiang Province, China). Logarithmic phase cells (2×10⁵) were seeded in 96-well plates and cultured at 37°C. After the cells reached 90% confluence, they were incubated with OPTI-MEM containing 200 ng of the vector and 0.5 μL of lipofectamine 3000. After incubation, the cells were trypsinized and incubated with luciferase detection reagents. Firefly luciferase and Renilla luciferase activity was detected, and the corresponding values were calculated by using a Berthold microplate reader (Berthold LB941, microporous plate-type multifunctional enzyme labeling instrument).
Chromatin Immunoprecipitation
The chromatin immunoprecipitation (ChIP) assay was conducted as previously described.8 An anti-HSF1 antibody (Abcam, Cambridge, UK), an anti-STAT3 antibody (Abcam, Cambridge, UK), and goat anti-rabbit IgG H&L (Abcam, Cambridge, UK) were used in this assay. The primer sequences for amplification of the SPI1/PU.1 and CSN5 promoter regions were as follows: primer sequence.
Quantitative Real-Time Chain Reaction
RNA was extracted with TRIzol (Takara, Japan) following the manufacturer’s instructions. Then, 2 μl of RNA was used for cDNA synthesis by using an iScript cDNA synthesis kit (Bio-Rad, Hercules, CA, USA). Quantitative real-time chain reaction (qRT-PCR) was performed by using SsoFast EvaGreen Supermix in a LightCycler 480 system (Roche Applied Science). The amplification primer sequences are shown below (Table 1).
TABLE 1.
Primers Used in Real-time Quantitative PCR
| Primers | Sequence (5′→3′) | |
|---|---|---|
| CSN5 | Forward | 5′- CGGTATGGCCCAGAAAACCT-3′ |
| Reverse | 5′- CTTCCAAGTTGCCTCCCGAT-3′ | |
| HSF1 | Forward | 5′- TACAGCAGCTCCAGCCTCTA-3′ |
| Reverse | 5′- ACCAGCTGCTTCCCTGAATC-3′ | |
| PU.1/Spi1 | Forward | 5′- CGGTATGGCCCAGAAAACCT-3′ |
| Reverse | 5′- CTTCCAAGTTGCCTCCCGAT-3′ | |
| GAPDH | Forward | 5′-ACCACAGTCCATGCCATCAC-3′ |
| Reverse | 5′-TCCACCACCCTGTTGCTGTA -3′ | |
Protein Extraction
Cells were washed with ice-cold PBS before protein extraction, detached from the culture plate by scraping, collected into Eppendorf tubes, and centrifuged. Afterward, 200 μL of cytoplasmic protein extraction reagent A containing PMSF (Solon, OH) was added to 20 mL of the precipitated cell suspension, and the mixture was vortexed vigorously for 5 seconds. After 10 to 15 minutes of incubation on ice, 10 μL of cytoplasmic extraction reagent B was added to the mixture, which was incubated for 1 minute, vortexed for 5 seconds, and centrifuged at 12000 to 16000g for 5 minutes. The supernatant (the cytoplasmic protein fraction) was collected and stored at −80°C.
Western Blotting
Two hundred micrograms of protein were loaded and separated by 8.0% or 10% sodium dodecyl sulfate-polyacrylamide gel electrophoresis according to the molecular weight. After separation to the specified position, proteins were transferred to a 0.45 μm PVDF membrane (Millipore, Schwalbach, Germany). Then, the membrane was incubated with an anti-PU.1/Spi1 antibody (Abcam, Cambridge, UK), anti-HSF1 antibody (Abcam, Cambridge, UK), anti-CSN5 antibody (Abcam, Cambridge, UK), anti-FBXW7α antibody (Abcam, Cambridge, UK), anti-CEBP-β antibody (Abcam, Cambridge, UK), anti-β-actin antibody (Abcam, Cambridge, UK), anti-phospho-STAT3 antibody (Abcam, Cambridge, UK), and anti-STAT3 antibody (Abcam, Cambridge, UK) at 4°C overnight. After secondary antibody incubation, band signals were detected using a Tanon 6600 imaging system. Densitometric analysis was performed by Image-Pro Plus 6.0.
Immunoprecipitation
Cells were collected and washed with ice-cold PBS 3 times. After removal of the supernatant, 0.5 to 1 mL of IP buffer (50 mM pH 7.4 Tris HCl, 150 mM NaCl, 1% NP-40, 5 mM EDTA) containing 10x protease inhibitor cocktail tablets were added, and incubated with the cells at 4°C for 30 minutes. After centrifugation at 14,000 RPM for 15 minutes, the supernatant was collected and diluted with IP buffer to a final protein concentration of 3 μg/mL. After incubation with the anti-HSF1 antibody (Abcam, Cambridge, UK), agarose beads (Protein A Agarose, Sigma, St. Louis, MO) were washed with IP buffer without protease inhibitor cocktail tablets, proteins were denatured with nonreducing sodium dodecyl sulfate loading buffer, and subjected to western blotting.
Statistical Analysis
Statistical analysis was performed with SPSS (version 17.0). One-way ANOVA and Tukey exact post hoc test were conducted to compare differences between the experimental and control groups, where P<0.05 was set as the significance threshold.
RESULTS
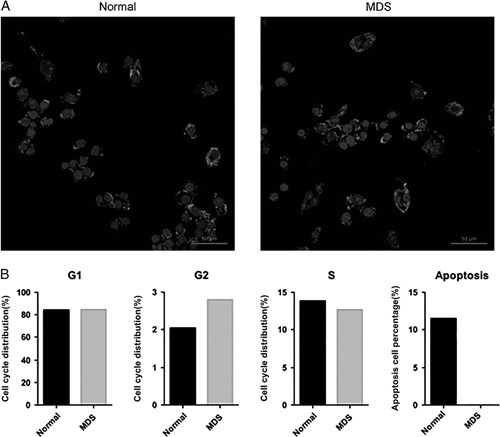
Cells expressing CD34 are recognized as hematopoietic cells. Thus, we used magnetic-activated cell sorting with CD34+ magnetic beads to acquire CD34+ cells from BM of normal individuals and hypocellular MDS patients (Fig. 1A) and performed a colony formation assay and cell cycle analysis. The colony formation assay results indicated that the proliferation ability of MDS cells was reduced, while cell cycle analysis showed that more MDS cells with low proliferation ability might remain in G2 phase and exhibit apoptosis resistance (Fig. 2H, Fig. 1B).
FIGURE 1.

A, Expression of CD34+ in bone marrow mononuclear cells of normal and MDS patients. B, Low proliferated MDS cells might remained more in G2 phase and exhibited with apoptotic resistance. MDS indicates myelodysplastic syndrome.
FIGURE 2.
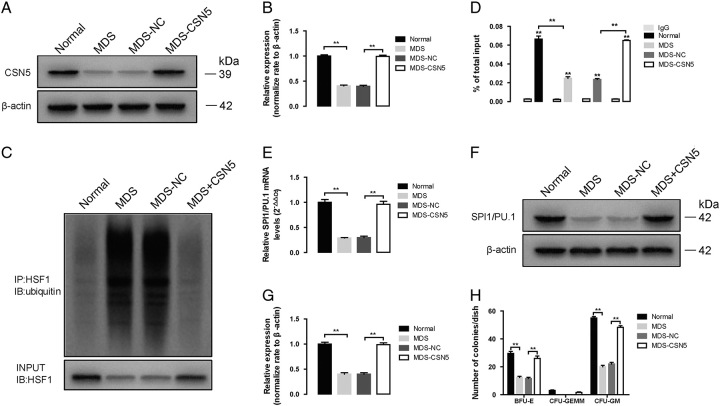
Effect of CSN5 overexpression in CD34+ cells of MDS patients. A, The protein expression of CSN5 in whole cell lysates of CD34+ cells of normal, MDS, MDS-NC, and MDS-CSN5. B, β-actin was used as the loading control for the whole cell lysate. Densitometry represents the expression of the proteins relative to β-actin. C, The results obtained by coimmunoprecipitation, and HSF1 ubiquitination levels were measured with western blot assay. Densitometry represents the expression of the proteins relative to input. D, ChIP assay shows HSF1 binding to PU.1/Spi1 promoter. The ChIP ratio of PU.1/Spi1 relative to input. E, PU.1/Spi1 mRNA levels were detected by real-time PCR. And GAPDH was used as the loading control. F, The protein expression of PU.1/Spi1, in whole cell lysates of CD34+ cells of normal, MDS, MDS-NC, and MDS-CSN5. G, β-actin was used as the loading control for the whole cell lysate. Densitometry represents the expression of the proteins relative to β-actin. H, The formation of BFU-E, CFU-GEMM, and CFU-GM was used with colony formation assay. All data are shown as mean ± SD (n = 3). *P < 0.05; **P < 0.01.
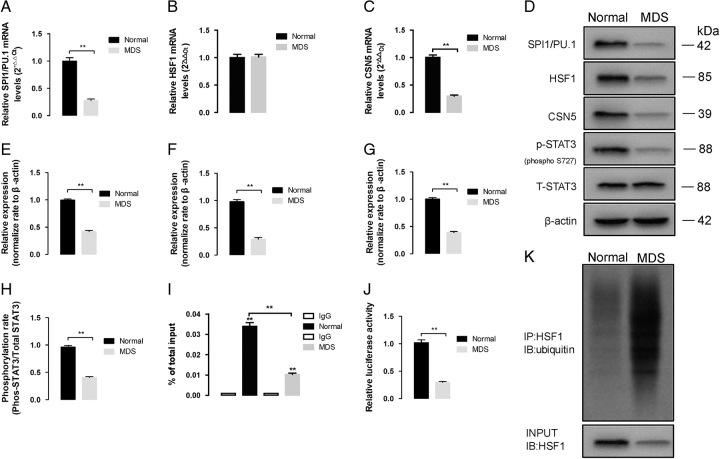
Since SPI1/PU.1 is related to the cell cycle,9,10 we examined the expression of SPI1/PU.1. The mRNA and protein expression levels of SPI1/PU.1 were obviously reduced in MDS patients, while the mRNA level of HSF1 exhibited no difference (P<0.01, Fig. 3A–F), and HSF1 protein was degraded via ubiquitination (Fig. 3K). Since HSF1 is a transcriptional regulator of the SPI1/PU.1 gene, we performed a ChIP assay to confirm whether it plays roles in inhibiting SPI1/PU.1 gene transcription. As expected, the binding of HSF1 at the SPI1/PU.1 promoter region was inhibited in MDS patients (P<0.01, Fig. 3I), further proving that decreased expression of HSF1 mediated the deregulated transcription of SPI1/PU.1.
FIGURE 3.
The altered signaling pathway in CD34+ cells of normal and MDS patients in PU.1/Spi1 (A), HSF1 (B), and (C) CSN5 mRNA levels was detected by real-time PCR. And GAPDH was used as the loading control. (D) The protein expression of PU.1/Spi1, HSF1 and CSN5 and STAT3 phosphorylation levels in whole cell lysates of CD34+ cells of normal and MDS patients. E–G, β-actin was used as the loading control for the whole cell lysate. Densitometry represents the expression of the proteins relative to β-actin. H, the level of phosphorylated STAT3 was significantly decreased in MDS patients. I, ChIP assay shows HSF1 binding to PU.1/Spi1 promoter. The ChIP ratio of PU.1/Spi1 relative to input. J, The binding of STAT3 to CSN5 promoters was measured with dual luciferase report gene assay. K, The results obtained by coimmunoprecipitation, and HSF1 ubiquitination levels were measured with western blot assay. Densitometry represents the expression of the proteins relative to input. All data are shown as mean ± SD (n = 3). *P < 0.05; **P < 0.01.
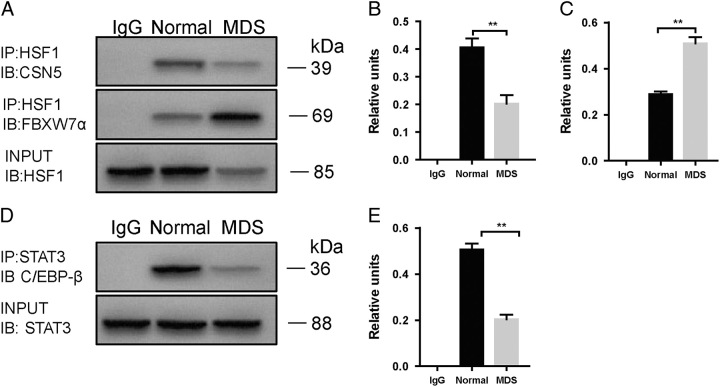
Next, we sought to explore the mechanism of HSF1 ubiquitination. Since CSN5 is a ubiquitination regulator, we examined the expression of CSN5 in MDS patient cells. As expected, the expression of CSN5 was obviously decreased (Fig. 3C, D, G). In addition to CSN5, HSF1 is also regulated by FBXW7α; thus, we examined the binding of HSF1 and FBXW7α by immunoprecipitation. Interestingly, the binding of HSF1 and FBXW7α was significantly increased in MDS cells (Fig. 4A–C).
FIGURE 4.
The altered signaling pathway in CD34+ cells of normal and MDS patients. A, Co-IP assay shows the binding of HSF1 to CSN5 and FBXW7α. Densitometry represents the expression of the proteins relative to input. B and C, The binding of HSF1 and FBXW7α was significantly increased in MDS cells. D, Co-IP assay shows the binding of STAT3 to C/EBP-β. E, Densitometry represents the expression of the proteins relative to input. All data are shown as mean ± SD (n = 3). *P < 0.05; **P < 0.01.
As reported previously, STAT3 functions as the upstream regulator of CSN5 by binding to C/EBP-ß; thus, we examined STAT3 phosphorylation and STAT3/C/EBP-ß regulation in MDS cells. Consistent with the previous results, the level of phosphorylated STAT3 was significantly decreased in MDS patients (Fig. 3D, H), and the binding of STAT3 to C/EBP-ß was inhibited (Fig. 3D, E), which led to the inhibition of binding activity in the CSN5 promoter region (Fig. 3J).
Thus, impaired phosphorylation of STAT3 inhibited transcription of the CSN5 gene, which further led to deubiquitination of HSF1 and downregulation of SPI1/PU.1.
To further validate our hypothesis, we overexpressed CSN5 in MDS cells (Fig. 2A, B). Restoration of CSN5 significantly inhibited HSF1 ubiquitination, causing SPI1/PU.1 transcription to resume (Fig. 2D) and increasing the protein expression of SPI1/PU.1 (Fig. 2E–G). Moreover, CSN5 restoration promoted colony formation in MDS cells (Fig. 2H).
DISCUSSION
The COP9 signalosome complex (CSN) is a highly conserved protein complex regulating the ubiquitination process. It comprises 8 distinct subunits, CSN1 to CSN8, among which CSN5 serves as the catalytic core of the CSN complex.11 The fifth component of the CSN5 has been reported to be overexpressed in multiple solid tumors and hematological malignancies, including breast cancer,12 lymphoma,13 ovarian cancer,14 pancreatic adenocarcinoma,15 and nasopharyngeal carcinoma.16. It plays an essential role in modulating intracellular signaling and further affects the cell cycle and cellular differentiation and proliferation.17
Tomoda et al18 reported that embryos with homozygous CSN5 knockout died at E8.5, while restoration of CSN5 rescued embryonic lethality, proving the impact of CSN5 on cell differentiation in vivo. Masaaki group revealed that overexpression of CSN5 promoted hematopoietic progenitor cell proliferation and initiated myeloproliferative disorders in transgenic mice.19 MDSs are heterogeneous myeloid diseases characterized by clonal expansion.20,21 The distinct features of the primary cell clones determine the unique manifestation and morphologic pattern of BM. Thus, this evidence indicates a potent role for CSN5 in mediating myeloid cell differentiation and proliferation in MDS patients with hypocellular BM. Our study showed that the expression of CSN5 was inhibited in MDS cells and led to cell quiescence, which further reduced cell proliferation, whereas restoration of CSN5 reversed the hypoplastic phenomenon (Fig. 2). These results further supported our hypothesis that the absence of CSN5 contributed to hypocellularity in MDS patients.
Modulation of HSF1 protein expression is regulated by different signaling pathways and molecules, among which FBXW7 was reported to be a regulator of HSF1 ubiquitination.6 As CSN5 is the catalytic core of the CSN complex, its most important function is ubiquitin-mediated protein degradation, and it can also maintain protein stability by mediating deubiquitination.22 Little is reported in the literature about how CSN5 and FBXW7 cooperatively regulate the differentiation and proliferation of MDS cells. For the first time, our study revealed that CSN5 maintains the dynamic balance of HSF1 expression by deubiquitination in normal cells, while elevated expression of CSN5 in MDS cells can inhibit HSF1 ubiquitination, which further transcriptionally regulates the increase in SPI1/Pu.1 expression and promotes the proliferation restoration in hypoplastic MDS cells with hypoplasia (Fig. 2H). Another interesting finding was that CSN5 expression was inhibited in MDS cells. Our results showed that STAT3 is related to the inhibition of CSN5. STAT3 plays a dual role in regulating CSN5 expression in MDS cells. First, phosphorylated STAT3 can bind to the promoter region of CSN5 itself and affect subsequent gene transcription. Alternatively, STAT3 can bind to CEBP-β, and the reduction in CEBP-β expression can also reduce CSN5 gene transcription. Our finding is consistent with Pan’s result in nasopharyngeal carcinoma.23
Our study was a preclinical research study and may be somewhat limited by the lack of evidence from human BM sections. If clinical investigation validates our hypothesis, CSN5 might be a potent treatment target for MDS patients with hypocellular BM.
Supplementary Material
Footnotes
The design and performance of this study were supported by a special fund project for health science and technology development of Nanjing Health Commission (YKK21270).
Ethics approval and patients’ consent to participate in accordance with the Declaration of Helsinki, all patients consented to the use of their medical information for this research before entering the study. The Southeast University Ethics Committees approved the study and required participants to sign a written informed consent form.
All authors and participants or in the case of children, their parents or legal guardians, consented to the publication of this manuscript.
Z-.P.Y.: participated in designing the study and writing the paper; Z.-Y.J.: conceived of the study and performed the statistical analysis; A.-N.S.: participated in the design and coordination of the study and helped draft the manuscript; B.C.: participated in the data analysis and follow-up of cases; and Z.G.: participated in the data analysis.
The authors declare no conflict of interest.
Supplemental Digital Content is available for this article. Direct URL citations are provided in the HTML and PDF versions of this article on the journal's website, www.jpho-online.com.
Contributor Information
Zheng-Ping Yu, Email: zhengpingyu2006@sina.com.
Zi-Ying Jian, Email: jianziying86729@126.com.
Ai-Ning Sun, Email: changli060726@126.com.
Bao-An Chen, Email: chenbaoan58@126.com.
Zheng Ge, Email: 2286393775@qq.com.
REFERENCES
- 1. Jana B, Khanfar A, Ninan M. Durable hematological and majorcytogenetic response in a patient with isolated 20q deletion myelodysplastic syndrome treated with lenalidomide. Case Rep Oncol Med. 2014;2014:1–4. [DOI] [PMC free article] [PubMed] [Google Scholar]
- 2. Mohamedali AM, Gaken J, Ahmed M, et al. High concordance of genomic and cytogenetic aberrations between peripheral blood and bone marrow in myelodysplastic syndrome (MDS). Leukemia. 2015;29:1928–1938. [DOI] [PubMed] [Google Scholar]
- 3. Huh HJ, Chae SL, Lee M, et al. CD34, RAB20, PU.1 and GFI1 mRNA expression in myelodysplastic syndrome. Int J Lab Hematol. 2009;6:344–351. [DOI] [PubMed] [Google Scholar]
- 4. Laricchia-Robbio L, Premanand K, Rinaldi CR, et al. EVI1 Impairs myelopoiesis by deregulation of PU.1 function. Cancer Res. 2009;15:1633–1642. [DOI] [PubMed] [Google Scholar]
- 5. Jego G, Lanneau D, De Thonel A, et al. Dual regulation of SPI1/PU.1 transcription factor by heat shock factor 1 (HSF1) during macrophage differentiation of monocytes. Leukemia. 2014;8:1676–1686. [DOI] [PubMed] [Google Scholar]
- 6. Kourtis N, Moubarak RS, Aranda-Orgilles B, et al. FBXW7 modulates cellular stress response and metastatic potential through HSF1 post-translational modification. Nat Cell Biol. 2015;17:322–332. [DOI] [PMC free article] [PubMed] [Google Scholar]
- 7. Shackleford TJ, Zhang Q, Tian L, et al. Stat3 and CCAAT/enhancer binding protein beta (C/EBP-beta) regulate Jab1/CSN5 expression in mammary carcinoma cells. Breast Cancer Res. 2011;13:R65. [DOI] [PMC free article] [PubMed] [Google Scholar]
- 8. Nagalingam K, Lorenc MT, Manoli S, et al. Chromatin immunoprecipitation (ChIP) method for non- model fruit flies (Diptera: Tephritidae) and evidence of histone modifications. PLOS One. 2018;13:1–13. [DOI] [PMC free article] [PubMed] [Google Scholar]
- 9. Ziliotto R, Gruca MR, Podder S, et al. PU.1 promotes cell cycle exit in the murine myeloid lineage associated with downregulation of E2F1. Exp Hematol. 2014;42:204–217. [DOI] [PubMed] [Google Scholar]
- 10. Kueh HY, Ameya C, Nutt SL, et al. Positive feedback between PU.1 and the cell cycle controls myeloid differentiation. Science. 2013;341:670–673. [DOI] [PMC free article] [PubMed] [Google Scholar]
- 11. Lingaraju GM, Bunker RD, Cavadini S, et al. Crystal structure of the human COP9 signalosome. Nature. 2014;512:161–165. [DOI] [PubMed] [Google Scholar]
- 12. Kouvaraki MA, Rassidakis GZ, Tian L, et al. Jun activation domain-binding protein 1 expression in breast cancer inversely correlates with the cell cycle inhibitor p27(Kip1). Cancer Res. 2003;63:2977–2981. [PubMed] [Google Scholar]
- 13. Rassidakis GZ, Claret FX, Lay R, et al. Expression of p27(Kip1) and c-Jun activation binding protein 1 are inversely correlated in systemic anaplastic large cell lymphoma. Clin Cancer Res.2003;9:1121–1128. [PubMed] [Google Scholar]
- 14. Alexander A, Keyomarsi K. Exploiting cell cycle pathways in cancer therapy: new (and old) targets and potential strategies. In: Kumar R, ed. Nuclear Signaling Pathways and Targeting Transcription in Cancer. Cancer Drug Discovery and Development; 2014:337-372. [Google Scholar]
- 15. Gladstone P, Fueresz L, Pious D. Gene dosage and gene expression in the HLA region: evidence from deletion variants. Proc Natl Acad Sci U S A. 1982;79:1235–1239. [DOI] [PMC free article] [PubMed] [Google Scholar]
- 16. Pan Y, Zhang Q, Atsaves V, et al. Suppression of Jab1/CSN5 induces radio- and chemo-sensitivity in nasopharyngeal carcinoma through changes to the DNA damage and repair pathways. Oncogene. 2013;32:2756–2766. [DOI] [PMC free article] [PubMed] [Google Scholar]
- 17. Shackleford TJ, Claret FX. JAB1/CSN5: a new player in cell cycle control and cancer. Cell Div. 2010;5:26–39. [DOI] [PMC free article] [PubMed] [Google Scholar]
- 18. Tomoda K, Yoneda-Kato N, Fukumoto A, et al. Multiple functions of Jab1 are required for early embryonic development and growth potential in mice. J Biol Chem. 2004;279:43013–430188. [DOI] [PubMed] [Google Scholar]
- 19. Mori M, Yoneda-Kato N, Yoshida A, et al. Stable form of JAB1 enhances proliferation and maintenance of hematopoietic progenitors. J Biol Chem. 2008;283:29011–29021. [DOI] [PMC free article] [PubMed] [Google Scholar]
- 20. Tefferi A, Vardiman JW. Myelodysplastic syndromes. N Engl J Med. 2009;361:1872–1885. [DOI] [PubMed] [Google Scholar]
- 21. Zou J, Zhou Z, Wan L, et al. Targeting the sonic Hedgehog-Gli1 pathway as a potential new therapeutic strategy for myelodysplastic syndromes. PLoS One. 2015;10:e0136843. [DOI] [PMC free article] [PubMed] [Google Scholar]
- 22. Schweitzer K, Bozko PM, Dubiel W, et al. CSN controls NF-kappaB by deubiquitinylation of IkappaBalpha. Embo J. 2007;26:1532–1541. [DOI] [PMC free article] [PubMed] [Google Scholar]
- 23. Pan Y, Wang S, Su B, et al. Stat3 contributes to cancer progression by regulating Jab1/Csn5 expression. Oncogene. 2017;36:1069–1079. [DOI] [PMC free article] [PubMed] [Google Scholar]


