

Abstract
We tested the association between endogenous testosterone density (ETD; the ratio between endogenous testosterone [ET] and prostate volume) and prostate cancer (PCa) aggressiveness in very favorable low- and intermediate-risk PCa patients who underwent radical prostatectomy (RP). Only patients with prostate-specific antigen (PSA) within 10 ng ml−1, clinical stage T1c, and International Society of Urological Pathology (ISUP) grade group 1 or 2 were included. Preoperative ET levels up to 350 ng dl−1 were classified as abnormal. Tumor quantitation density factors were evaluated as the ratio between percentage of biopsy-positive cores and prostate volume (biopsy-positive cores density, BPCD) and the ratio between percentage of cancer invasion at final pathology and prostate weight (tumor load density, TLD). Disease upgrading was coded as ISUP grade group >2, and progression as recurrence (biochemical and/or local and/or distant). Risk associations were evaluated by multivariable Cox and logistic regression models. Of 320 patients, 151 (47.2%) had intermediate-risk PCa. ET (median: 402.3 ng dl−1) resulted abnormal in 111 (34.7%) cases (median ETD: 9.8 ng dl−1 ml−1). Upgrading and progression occurred in 109 (34.1%) and 32 (10.6%) cases, respectively. Progression was predicted by ISUP grade group 2 (hazard ratio [HR]: 2.290; P = 0.029) and upgrading (HR: 3.098; P = 0.003), which was associated with ISUP grade group 2 (odds ratio [OR]: 1.785; P = 0.017) and TLD above the median (OR: 2.261; P = 0.001). After adjustment for PSA density and body mass index (BMI), ETD above the median was positively associated with BPCD (OR: 3.404; P < 0.001) and TLD (OR: 5.238; P < 0.001). Notably, subjects with abnormal ET were more likely to have higher BPCD (OR: 5.566; P = 0.002), as well as TLD (OR: 14.998; P = 0.016). Independently by routinely evaluated factors, as ETD increased, BPCD and TLD increased, but increments were higher for abnormal ET levels. In very favorable cohorts, ETD may further stratify the risk of aggressive PCa.
Keywords: endogenous testosterone density, prostate cancer, radical prostatectomy, tumor progression
INTRODUCTION
Prostate cancer (PCa) represents the most prevalent cancer and the second cancer-related cause of death in males.1 PCa is pathologically classified using the International Society of Urological Pathology (ISUP) grading system.2,3 Additionally, the risk of recurrence after treatment with curative intent is assessed through the D’Amico-European Association of Urology (EAU) classification and the National Comprehensive Cancer Network (NCCN) classification systems, which are not equivalent.2,4 One of the most critical issues in contemporary clinical practice is the management of low- and intermediate-risk groups, where treatments may vary from active surveillance (AS) or watchful waiting (WW) up to active treatments, including radiation therapy (RT) and radical prostatectomy (RP) eventually associated with extended pelvic lymph node dissection (ePLND).2,4 The risk of lymph node invasion (LNI) is assessed preoperatively by validated nomograms. However, ePLND, according to established templates, remains the most effective tool for PCa staging and LNI detection.5 These observations have a pivotal role due to the number of metastatic lymph nodes that might influence the prognosis and subsequent management of PCa patients after surgery.2,4 Additionally, ePLND is associated with not-negligible rate of complications, such as lymphocele-related thromboembolic events,6,7 as well as inhospital readmission.8,9
On the other hand, clinical undergrading and understaging are unfavorable issues,2,4 and several clinical factors have been assessed to identify the risk of PCa progression. Among these, endogenous testosterone (ET) may influence PCa natural history although its role is debated.10 Indeed, some evidence suggest a linear correlation between preoperative androgen levels and PCa aggressiveness.11–13 Conversely, other authors found that low levels of testosterone are associated with more aggressive disease.14,15 Our research team already focused on the role of ET density (ETD), defined as the ratio of ET on prostate volume (PV), with tumor quantitation features showing positive associations among risk groups.16,17 In the present study, we aimed to assess the role of ETD in PCa progression in a highly selected cohort of very favorable low- and intermediate-risk PCa patients.
PATIENTS AND METHODS
Patient population, data collection, and evaluation of parameters
The Institutional Review Board approval of the Integrated University Hospital of Verona (Verona, Italy) was obtained, and each patient provided informed consent for data collection and analysis. Prospectively collected data of 805 consecutive PCa patients treated with RP between November 2014 and December 2019 were retrospectively evaluated. In all patients, who were not under androgen blockade, ET (ng dl−1) has been measured at the medical laboratory of the Integrated University Hospital of Verona, before surgery by radioimmunoassay at least 1 month after biopsies, and between 8:00 a.m. and 8:30 a.m., based on the established notion that ET serum concentration peaks in the morning due to its circadian rhythm.18
For each patient, age (in year), body mass index (BMI; in kg m−2), prostate-specific antigen (PSA; in ng ml−1), PV (in ml) that was calculated by transrectal ultrasound (TRUS) standard ellipsoid methods,19 and percentage of biopsy-positive cores (BPC, defined as the ratio between positive and total taken cores) were recorded.
All included patients were prostate biopsy naïve. At our institution, prostate biopsies were performed in office setting under local anesthesia. After accurate perineal disinfection, biopsy cores were taken transperineally according to a standard template, which included 14 cores (6 cores in the peripheral zone and 1 in the transitional zone for each side of the gland). Antibiotic prophylaxis with bactrim or ciprofloxacin was administered before and then continued for four days after the procedure. Analysis of adjunctive targeted cores was excluded to avoid skewing phenomena. Additionally, the number of cores sampled was not increased according to PV.19 Biopsies performed elsewhere were assessed for number of cores taken, tumor grade, and PV, which was measured by transrectal approach.
For each patient, the ratio between BPC, PSA, and ET and PV was calculated, and relative densities were indicated as biopsy-positive cores density (BPCD; in % per ml), prostate-specific antigen density (PSAD; in ng ml−2), and ETD (in ng dl−1 ml−1), respectively. Tumor staging was assessed according to the tumor, node, metastasis (TNM) classification system (8th edition, 2017) with clinical T stage only referring to digital rectal exam findings.20 Patients were classified into risk classes according to EAU risk group classification.2
Preoperative physical status was evaluated by the American Society of Anesthesiologists (ASA) classification system.21 RP was delivered by robot-assisted (RARP) or open approach and performed by experienced surgeons. As previously reported, ePLND was performed according to guidelines and recommendations.2 In intermediate-risk group patients, the decision to perform an ePLND was mainly based on preoperative nomograms showing a risk of LNI greater than 5% such as Briganti Nomogram (2012 version).22 In low-risk group patients, the decision to perform an ePLND was based on clinical factors (prebiopsy PSA >7 ng ml−1, and percentage of BPC >20%), indicating an increased risk of tumor upgrading and LNI in the surgical specimen.23,24 Nodal packets were submitted in separate packages according to a standard anatomical template, including external iliac, internal iliac and obturator, Marcille’s common iliac, and Cloquet’s nodal stations, bilaterally.25–27 Specimens, including prostate and dissected lymph nodes, were placed into formalin and evaluated by a dedicated uropathologist. Prostates were weighted and tumors were graded according to the ISUP system.2,3 Tumor quantitation was assessed as tumor load (TL), defined as the percentage of prostate involved by cancer. Specifically, our dedicated uropathologist assessed tumor quantitation by visual estimation of all the glass slides after all microscopically identifiable foci of carcinoma have been circled with a marked pen, as recommended by ISUP.28 Tumor load density (TLD) was calculated as the ratio between TL and prostate weight (in % per g). Surgical margins were stated positively when cancer invaded the inked surface of the specimen. Removed lymph nodes were counted and assessed for cancer invasion. Prostate surgical specimens were staged using the 2017 version of the TNM system (8th edition), accordingly.2
Study design and outcomes of interest
The purpose of this study was to assess the role of ETD as a predictor of PCa progression in a highly selected cohort of patients with PSA up to 10 ng ml−1, clinical stage T1c, and biopsy ISUP grade group 1 or 2. Preoperative ET levels were classified according to international standard consensus and categorized as abnormal and normal for ET levels up to and above 350 ng dl−1, respectively.29 Tumor upgrading was defined as ISUP grade group >2 in the surgical specimen. After surgery, patients were followed up according to EAU recommendations.2 Specifically, disease clinical history and PSA measurements were obtained at 3 months, 6, months, and 12 months after treatment, then every 6 months for 3 years, and yearly then after. At PSA persistence/recurrence, imaging modalities were considered to restage the disease and plan further treatments. Disease progression was defined as the event of biochemical recurrence and/or local recurrence and/or distant metastases, as well. Biochemical recurrence after surgery was defined as PSA ≥ 0.2 ng ml−1 with a second confirmatory level of PSA >0.2 ng ml−1.2
Statistical analyses
Descriptive statistics included frequencies and proportions for categorical variables. Medians and interquartile ranges (IQRs) were reported for continuously coded variables. Mann–Whitney U test and Pearson’s Chi-squared tests examined the statistical significance of differences in medians and proportions, respectively, between PCa patients with ETD categorized as up to versus above the median. The length of time between surgery and the outcome of interest (disease progression) or the last available follow-up was measured as time to event occurrence. Nonadjusted Kaplan–Meier curves of factors associated with the risk of disease progression were displayed, if appropriate. Subsequently, univariable and multivariable Cox proportional hazards regression models were used to test the association between clinical and pathological factors with the risk of disease progression; accordingly, hazard ratios (HRs) and relative 95% confidence intervals (CIs) were evaluated. Finally, univariable and multivariable logistic regression models tested the associations between ETD and features of aggressive disease, which were also assessed for accuracy, as well. All tests were two-sided, with P < 0.05 considered to indicate statistical significance. IBM-SPSS version 26.0 (IBM Corp., Armonk, NY, USA) was used for all analyses.
RESULTS
Demographics of the patient population stratified by ETD
Overall, 320 patients were included (Table 1). The median age was 64 (IQR: 60–69) years. The median PSA was 5.9 (IQR: 4.5–7.3) ng ml−1, and the median PSAD was 0.13 (IQR: 0.10–0.20) ng ml−2. Preoperatively, the median ET level was 402.3 (IQR: 309.5–505.0) ng dl−1, resulted as abnormal in 111 (34.7%) patients. The median ETD was 9.8 (IQR: 6.6–14.3) ng dl−1 ml−1. The very favorable intermediate-risk class included 151 (47.2%) patients. Surgery was delivered by RARP in 285 (89.1%) cases. According to ASA physical status classification system, 36 (11.3%) patients were ASA 1, 259 (80.9%) were ASA 2, and 25 (7.8%) were ASA 3. In the surgical specimen, tumor upgrading and upstaging occurred in 109 (34.1%) and 32 (10.0%) patients, respectively. Positive surgical margins were detected in 76 (23.8%) patients. Of 186 patients staged anatomically, 8 (4.3%) had LNI.
Table 1.
Descriptive characteristics of 320 prostate cancer patients, including very favorable low- and intermediate-risk classes, treated with radical prostatectomy, and stratified according to median endogenous testosterone density
| Feature | Variable | Population (n=320) | ETD up to the median (n=159, 49.7%) | ETD above the median (n=161, 50.3%) | P |
|---|---|---|---|---|---|
| Clinical feature | ET (ng dl-1), median (IQR) | 402.3 (309.5–505.0) | 406 (314.5–510.0) | 442 (369.2–539.8) | <0.001 |
| ETD (ng dl-1 ml-1), median (IQR) | 9.80 (6.60–14.30) | 9.85 (6.81–13.94) | 12.63 (7.02–17.93) | <0.001 | |
| Age (year), median (IQR) | 64 (60–69) | 65 (60–70) | 65 (61–68) | 0.462 | |
| BMI (kg m-2), median (IQR) | 25.9 (24.0–27.8) | 25.9 (24.0–28.1) | 25.2 (24.2–26.4) | <0.001 | |
| PV (ml), median (IQR) | 40.0 (30.0–52.0) | 40.0 (31.0–52.0) | 35.5 (26.2–50.0) | <0.001 | |
| PSA (ng ml-1), median (IQR) | 5.9 (4.5–7.3) | 6.0 (4.3–7.3) | 6.2 (4.9–7.7) | 0.002 | |
| PSAD (ng ml-2), median (IQR) | 0.13 (0.10–0.20) | 0.13 (0.10–0.19) | 0.18 (0.10–0.24) | <0.001 | |
| <0.15 ng ml-2, n (%) | 136 (50.6) | 105 (66.0) | 56 (34.8) | <0.001 | |
| ≥0.14 ng ml-2, n (%) | 133 (49.4) | 54 (34.0) | 105 (65.2) | ||
| BPC (%), median (IQR) | 28.0 (16.2–43.0) | 26.6 (14.6–44.3) | 12.6 (7.0–17.9) | 0.074 | |
| <50%, n (%) | 208 (77.3) | 129 (81.1) | 122 (75.8) | 0.244 | |
| ≥50%, n (%) | 61 (22.7) | 30 (18.9) | 39 (24.2) | ||
| BPCD (% per ml), median (IQR) | 0.70 (0.36–1.22) | 0.65 (0.35–1.20) | 0.75 (0.44–1.85) | <0.001 | |
| Up to the median, n (%) | 140 (52.0) | 105 (66.0) | 57 (35.4) | <0.001 | |
| Above the median, n (%) | 129 (48.0) | 54 (34.0) | 104 (64.6) | ||
| ISUP grade group, n (%) | <0.001 | ||||
| ISUP grade group 1 | 169 (52.8) | 100 (62.9) | 62 (42.9) | ||
| ISUP grade group 2 | 151 (47.2) | 59 (37.1) | 92 (57.1) | ||
| Pathological feature | PW (g), median (IQR) | 53.1 (40.7–66.0) | 54.0 (41.7–66.0) | 48.5 (37.1–66.8) | <0.001 |
| TL (%), median (IQR) | 15 (10–20) | 10 (8–20) | 20 (10–25) | 0.001 | |
| TLD (% per g), median (IQR) | 0.25 (0.14–0.50) | 0.25 (0.15–0.46) | 0.31 (0.14–0.50) | <0.001 | |
| Up to the median, n (%) | 159 (49.7) | 99 (62.3) | 60 (37.3) | <0.001 | |
| Above the median, n (%) | 161 (50.3) | 60 (37.7) | 101 (62.7) | ||
| ISUP grade group, n (%) | 0.970 | ||||
| ISUP grade group ≤2 (no upgrading) | 211 (65.9) | 105 (66.0) | 106 (65.8) | ||
| ISUP grade group >2 (upgrading) | 109 (34.1) | 54 (34.0) | 55 (34.2) | ||
| Pathological tumor stage, n (%) | 0.271 | ||||
| pT2 | 288 (90.0) | 147 (92.5) | 141 (87.6) | ||
| pT3a | 16 (5.0) | 5 (3.1) | 11 (6.8) | ||
| pT3b | 16 (5.0) | 7 (4.4) | 9 (5.6) | ||
| Surgical margins status, n (%) | 0.323 | ||||
| Negative surgical margins | 244 (76.2) | 125 (78.6) | 119 (73.9) | ||
| Positive surgical margins | 76 (23.8) | 34 (21.4) | 42 (26.1) |
ET: endogenous testosterone; ETD: ET density; BMI: body mass index; PV: prostate volume; PSA: prostate-specific antigen; PSAD: PSA density; BPC: biopsy-positive cores; BPCD: BPC density; ISUP: International Society of Urological Pathology; PW: prostate weight; TL: tumor load; TLD: TL density; IQR: interquartile range
Compared to patients with ETD up to the median, patients with ETD above the median presented higher median ET (442 ng dl−1 vs 406 ng dl−1) and higher PSAD (0.18 ng ml−2 vs 0.13 ng ml−2), as well as higher tumor quantitation density factors such as BPCD (0.75% per ml vs 0.65% per ml) and TLD (0.31% per g vs 0.25% per g). Conversely, patients with ETD above the median had lower median BMI (25.2 kg m−2 vs 25.9 kg m−2), PV (35.5 ml vs 40.0 ml), and prostate weight (PW, 8.5 g vs 54.0 g), as well (all P < 0.001).
Predictors of disease progression
The median follow-up, which was available for 301 (94.1%) patients, was 41 (IQR: 22–58) months, with no significant difference between groups with or without progression. The median overall survival was 98.5%. Four deaths occurred; none were related to PCa. As shown in Table 2, disease progression occurred in 32 (10.6%) cases and was positively associated with biological density factors (PSAD, P = 0.022; ETD, P = 0.040), tumor grading (P = 0.009), quantitation density factors (BPCD, P = 0.034; TLD, P = 0.045), and unfavorable pathological outcomes (upgrading, P < 0.001; upstaging, P < 0.001; positive surgical margins, P = 0.006). In multivariable Cox regression analysis, disease progression was independently predicted by ISUP grade group 2 (HR: 2.290; 95% CI: 1.090–4.182; P = 0.029) among clinical factors, as well as by tumor upgrading (HR: 3.098; 95% CI: 1.479–6.487; P = 0.003), seminal vesicle invasion (HR: 2.683; 95% CI: 1.059–6.801; P = 0.038), and positive surgical margins (HR: 2.245; 95% CI: 1.081–4.665; P = 0.030) among pathological factors. Figure 1 and 2 depict the unadjusted Kaplan–Meier survival curves of disease progression for tumor grading factors. Compared with controls, the risk of disease progression was increased by biopsy ISUP grade group 2 (HR: 2.602; 95% CI: 1.264–5.357; P = 0.009) or by tumor upgrading (HR: 3.725; 95% CI: 1.835–7.561; P < 0.001).
Table 2.
Cox regression models predicting disease progression among 301 prostate cancer patients, including very favorable low- and intermediate-risk classes, treated with radical prostatectomy, and with available follow-up
| Feature | Variable | No disease progression (n=269, 89.4%) | Disease progression (n=32, 10.6%) | Univariable analysis | Multivariable analysisa | ||
|---|---|---|---|---|---|---|---|
|
| |||||||
| HR (95% CI) | P | HR (95% CI) | P | ||||
| Clinical feature | Age (year), median (IQR) | 65 (60–70) | 65 (61–70) | 1.007 (0.951–1.060) | 0.812 | ||
| BMI (kg m-2), median (IQR) | 25.9 (24.0–28.1) | 25.2 (24.2–26.4) | 0.924 (0.827–1.031) | 0.924 | |||
| ET (ng dl-1), median (IQR) | 406.0 (314.5–510.0) | 442.0 (369.2–539.8) | 1.001 (0.999–1.004) | 0.197 | |||
| ETD (ng dl-1 ml-1), median (IQR) | 9.8 (6.8–13.9) | 12.6 (7.0–17.9) | 1.034 (1.002–1.068) | 0.040 | 1.006 (0.956–1.058) | 0.831 | |
| PSA (ng ml-1), median (IQR) | 6.0 (4.3–7.3) | 6.2 (4.9–7.7) | 1.074 (0.893–1.291) | 0.448 | |||
| PSAD (ng ml-2), median (IQR) | 0.13 (0.10–0.19) | 0.18 (0.10–0.24) | 45.144 (1.727–1180.233) | 0.022 | 6.411 (0.044–933.046) | 0.465 | |
| PV (ml), median (IQR) | 40.0 (31.0–62.0) | 35.5 (26.2–72) | 0.987 (0.965–1.011) | 0.285 | |||
| BPC (%), median (IQR) | 26.6 (14.6–44.3) | 28.7 (17.7–50.0) | 1.005 (0.990–1.022) | 0.506 | |||
| BPCD (% per ml), median (IQR) | 0.67 (0.35–1.20) | 0.75 (0.44–1.85) | 1.478 (1.030–2.121) | 0.034 | 1.169 (0.730–1.873) | 0.516 | |
| ISUP grade group | |||||||
| ISUP grade group 1, n (%) | 128 (54.0) | 12 (37.5) | Reference | Reference | |||
| ISUP grade group 2, n (%) | 109 (46.0) | 20 (62.5) | 2.602 (1.264–5.357) | 0.009 | 2.990 (1.090–4.812) | 0.029 | |
| Pathological feature | PW (g), median (IQR) | 54.0 (41.7–66.0) | 48.5 (37.1–66.8) | 0.987 (0.968–1.006) | 0.175 | ||
| TL (%), median (IQR) | 15 (10–20) | 15 (10–20) | 1.012 (0.986–1.039) | 0.378 | |||
| TLD (% per g), median (IQR) | 0.25 (0.15–0.46) | 0.31 (0.14–0.50) | 1.857 (1.014–3.399) | 0.045 | 1.044 (0.551–1.979) | 0.894 | |
| ISUP grade group | |||||||
| ISUP grade group ≤2, n (%) | 168 (70.9) | 13 (40.6) | Reference | Reference | |||
| ISUP grade group >2, n (%) | 69 (29.1) | 19 (59.4) | 3.725 (1.835–7.561) | <0.001 | 3.098 (1.479–6.487) | 0.003 | |
| Pathological tumor stage | |||||||
| pT2, n (%) | 218 (92.0) | 24 (75.0) | Reference | Reference | |||
| pT3a, n (%) | 13 (5.5) | 1 (3.1) | 0.964 (0.130–7.161) | 0.971 | |||
| pT3b, n (%) | 6 (2.5) | 7 (21.9) | 5.314 (2.284–12.361) | <0.001 | 2.683 (1.059–6.801) | 0.038 | |
| Surgical margins status | |||||||
| Negative surgical margins, n (%) | 187 (78.9) | 17 (53.1) | Reference | Reference | |||
| Positive surgical margins, n (%) | 50 (21.1) | 15 (46.9) | 2.626 (1.311–5.260) | 0.006 | 2.245 (1.081–4.665) | 0.030 | |
aMultivariable models adjusted for ETD, PSAD, and biopsy ISUP grade group among clinical features, and adjusted for TLD, tumor upgrading, pathological tumor stage, and surgical margin status among pathological features. ET: endogenous testosterone; ETD: ET density; BMI: body mass index; PV: prostate volume; PSA: prostate-specific antigen; PSAD: PSA density; BPC: biopsy-positive cores; BPCD: BPC density; ISUP: International Society of Urological Pathology; PW: prostate weight; TL: tumor load; TLD: TL density; HR: hazard ratio; CI: confidence interval; IQR: interquartile range
Figure 1.
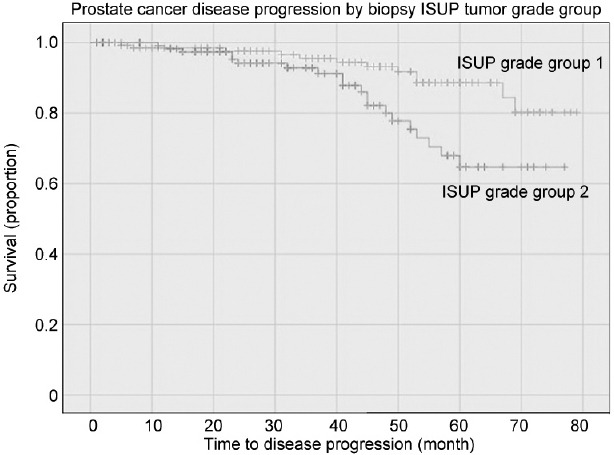
Unadjusted Kaplan–Meier survival curves testing the association between biopsy ISUP grade groups and disease progression in a selected cohort of patients with PSA up to 10 ng ml−1, clinical stage T1c, and ISUP grade group 1 or 2. Compared to the ISUP grade group 1, ISUP grade group 2 patients had a significantly increased risk of disease progression (HR: 2.602; 95% CI: 1.264–5.357; P=0.009). ISUP: International Society of Urological Pathology; PSA: prostate-specific antigen; HR: hazard ratio; CI: confidence interval.
Figure 2.
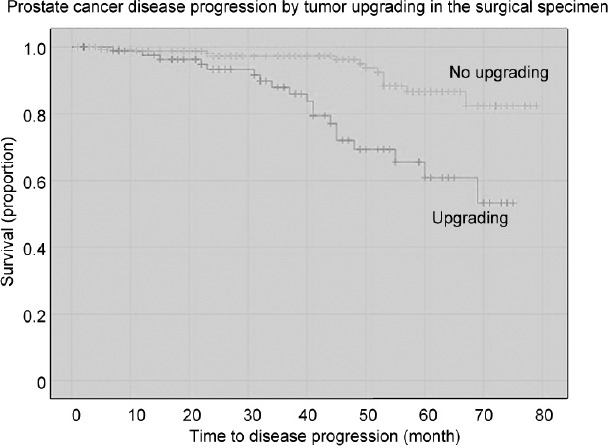
Unadjusted Kaplan–Meier survival curves testing the association between tumor upgrading and disease progression in a selected cohort of patients with PSA up to 10 ng ml−1, clinical stage T1c, and ISUP grade group 1 or 2. Compared to the not upgraded group, the upgraded group had a significantly increased risk of disease progression (HR: 3.725; 95% CI: 1.835–7.561; P < 0.001). At a follow-up of 70 months, almost 45% of upgraded patients had disease progression, which occurred in <20% of not upgraded cases. ISUP: International Society of Urological Pathology; PSA: prostate-specific antigen; HR: hazard ratio; CI: confidence interval.
Associations between ETD and predictors of disease progression
In the study population, tumor upgrading was independently predicted by age (odds ratio [OR]: 1.055; 95% CI: 1.014–1.093; P = 0.007) and ISUP grade group 2 (OR: 1.785; 95% CI: 1.111–2.866; P = 0.017) among clinical features. Similarly, tumor upgrading was also predicted by TLD above the median (OR: 2.261; 95% CI: 1.375–3.718; P = 0.001), extracapsular extension (OR: 4.101; 95% CI: 1.356–12.402; P = 0.012), and seminal vesicle invasion (OR: 5.635; 95% CI: 1.735–18.299; P = 0.004) among pathological features, as shown in Supplementary Table 1.
Supplementary Table 1.
Logistic regression models predicting tumor upgrading at final pathology (International Society of Urological Pathology >2) among 320 prostate cancer patients, including low-risk and very favorable intermediate-risk classes, treated with radical prostatectomy
| Variables | No upgrading (ISUP ≤2) n=211 (65.9) | Upgrading (ISUP>2) n=109 (34.1) | Univariable analysis | Multivariable analysisa | ||
|---|---|---|---|---|---|---|
|
|
|
|||||
| OR (95% CI) | P | OR (95% CI) | P | |||
| Clinical features | ||||||
| ET (ng dl−1) | 385.3 (307.2–504.0) | 412.3 (332.0–507.0) | 1.000 (0.998–1.002) | 0.998 | ||
| ETD (ng dl−1 ml−1) | 9.8 (6.6–13.9) | 9.8 (6.7–13.9) | 1.005 (0.973–1.037) | 0.773 | ||
| Age (year) | 64 (59–69) | 66 (61–70) | 1.051 (1.012–1.093) | 0.011 | 1.055 (1.014–1.097) | 0.007 |
| BMI (kg m−2) | 25.9 (23.9–27.7) | 25.6 (24.0–28.4) | 1.060 (0.987–1.139) | 0.110 | ||
| PV (ml) | 40 (31–53) | 40 (29–49) | 0.994 (0.981–1.008) | 0.405 | ||
| PSA (ng ml−1) | 5.8 (4.6–7.3) | 6.1 (4.5–7.5) | 1.052 (0.935–1.183) | 0.402 | ||
| PSAD (ng ml−2) | 0.13 (0.10–0.19) | 0.14 (0.11–0.20) | 4.317 (0.276–67.467) | 0.297 | ||
| BPC (%) | 27 (14–42) | 29 (17–48.5) | 1.009 (0.997–1.021) | 0.126 | ||
| BPCD (% ml−1) | 0.64 (0.34–1.22) | 0.73 (0.44–1.23) | 1.192 (0.865–1.641) | 0.283 | ||
| ISUP 1, n (%) | 121 (57.3) | 48 (44.0) | Reference | |||
| ISUP 2, n (%) | 90 (42.7) | 61 (56.0) | 1.709 (1.072–2.724) | 0.024 | 1.785 (1.111–2.866) | 0.017 |
| Pathological features | ||||||
| PW (g) | 53.0 (40.0–67.0) | 53.3 (43.5–65.5) | 1.004 (0.992–1.016) | 0.584 | ||
| TL (%) | 10.0 (7.5–20.0) | 20.0 (10.0–25.0) | 1.032 (1.014–1.049) | <0.001 | ||
| TLD (% g−1) | 0.22 (0.12–0.41) | 0.36 (0.19–0.53) | 2.430 (1.230–4.803) | 0.011 | ||
| TLD up to the median, n (%) | 122 (57.8) | 37 (33.9) | Reference | |||
| TLD above the median, n (%) | 89 (42.2) | 72 (66.1) | 2.667 (1.648–4.317) | <0.001 | 2.261 (1.375–3.718) | 0.001 |
| pT2, n (%) | 202 (95.7) | 86 (78.9) | Reference | |||
| pT3a, n (%) | 5 (2.4) | 11 (10.1) | 5.167 (1.743–15.321) | 0.003 | 4.101 (1.356–12.402) | 0.012 |
| pT3b, n (%) | 4 (1.9) | 12 (11) | 7.047 (2.210–22.464) | 0.001 | 5.635 (1.735–18.299) | 0.004 |
| Negative surgical margins, n (%) | 165 (78.2) | 79 (72.5) | Reference | |||
| Positive surgical margins, n (%) | 46 (21.8) | 30 (27.5) | 1.362 (0.800–2.320) | 0.255 | ||
aMultivariable models adjusted for ETD and biopsy ISUP grade group among clinical features, and adjusted for TLD, and pathological tumor stage among pathological features. Continuous variables are reported as medians (interquartile range) and categorical variables as frequencies (percentages). ET: endogenous testosterone; ETD: ET density; BMI: body mass index; PV: prostate volume; PSA: prostate specific antigen; PSAD: PSA density; BPC: biopsy-positive cores; BPCD: BPC density; ISUP: International Society of Urological Pathology; PW: prostate weight; TL: tumor load; TLD: TL density; OR: odds ratio; CI: confidence interval
The associations between ETD and tumor density features for multivariate models, where OR has been adjusted for BMI and PSAD >0.14 ng ml−2, are reported in Table 3. In the selected patient population, ETD above the median increased the risk of detecting larger tumor loads for both BPCD (OR: 3.404; 95% CI: 2.133–5.431; P < 0.001) and TLD features (OR: 5.238; 95% CI: 2.194–12.937; P < 0.001), and the same pattern was reproduced among subgroups. Accordingly, excluding only BPCD upstaging, the risk of detecting larger tumor quantities increased for biopsy ISUP grade group 2, tumor upgrading and upstaging, as well as for positive surgical margins. Interestingly, patients presenting with abnormal ET levels were more likely to have higher tumor density loads on either biopsy (OR: 5.566; 95% CI: 1.917–16.163; P = 0.002) and pathology specimens (OR: 14.998; 95% CI: 1.934–116.285; P = 0.010).
Table 3.
Multivariable logistic regression models testing the association between tumor quantitation density features and endogenous testosterone density stratified according to the median (endogenous testosterone density up to versus above the median)
| Variable | Patients (n) | BPCD | TLD | ||||
|---|---|---|---|---|---|---|---|
|
|
|
||||||
| OR (95% CI) | P | Accuracy | OR (95% CI) | P | Accuracy | ||
| Population | 320 | 3.404 (2.133–5.431) | <0.001 | 67.8 | 5.238 (2.194–12.937) | <0.001 | 68.1 |
| ISUP grade group 1 | 169 | 3.128 (1.610–6.074) | 0.001 | 70.4 | 2.513 (0.800–7.891) | 0.115 | 65.7 |
| ISUP grade group 2 | 151 | 3.246 (1.662–6.341) | 0.001 | 71.5 | 13.451 (2.521–71.782) | 0.002 | 74.8 |
| No upgrading | 211 | 2.961 (1.663–5.274) | <0.001 | 69.2 | 4.281 (1.514–12.105) | 0.006 | 69.2 |
| Upgrading | 109 | 4.277 (1.869–9.762) | 0.001 | 70.6 | 14.531 (2.386–88.475) | 0.004 | 67.0 |
| No upstaging | 288 | 3.452 (2.088–5.706) | <0.001 | 68.1 | 4.062 (1.620–10.188) | 0.003 | 68.4 |
| Upstaging | 32 | 0.484 (0.072–3.251) | 0.455 | 68.8 | 339.667 (3.286–30 152.993) | 0.011 | 68.8 |
| Negative surgical margins | 244 | 3.162 (1.378–4.295) | 0.002 | 66.0 | 3.390 (1.180–9.737) | 0.023 | 66.0 |
| Positive surgical margins | 76 | 4.219 (1.564–11.381) | 0.004 | 76.3 | 23.225 (2.910–185.394) | 0.003 | 72.4 |
| Normal ET | 209 | 4.008 (2.002–8.023) | <0.001 | 71.3 | 6.140 (1.590–23.703) | 0.008 | 72.2 |
| Abnormal ET | 111 | 5.566 (1.917–16.163) | 0.002 | 90.1 | 14.998 (1.934–116.285) | 0.010 | 88.3 |
Models adjusted for BMI, PSAD, BPCD, TLD, and surgical margin status. ET: endogenous testosterone; BMI: body mass index; PSAD: prostate-specific antigen density; BPCD: biopsy-positive cores density; ISUP: International Society of Urological Pathology; TLD: tumor load density; OR: odds ratio; CI: confidence interval
The boxplot distributions of BPCD and TLD stratified by ETD, biopsy ISUP grade groups, and ET levels are shown in Figure 3. As ETD increased, the risk of higher BPCD and TLD increased, but increments are higher for patients with abnormal ET for either ISUP grade group 1 or 2. The accuracy for goodness of fit of models is also included in Table 3 and was reproduced for the overall population, as well as for each subgroup. Notably, accuracy widely increased in subgroups presenting with abnormal ET from 67.8% to 90.1% for BPCD models, and from 68.1% to 88.3% for TLD models.
Figure 3.
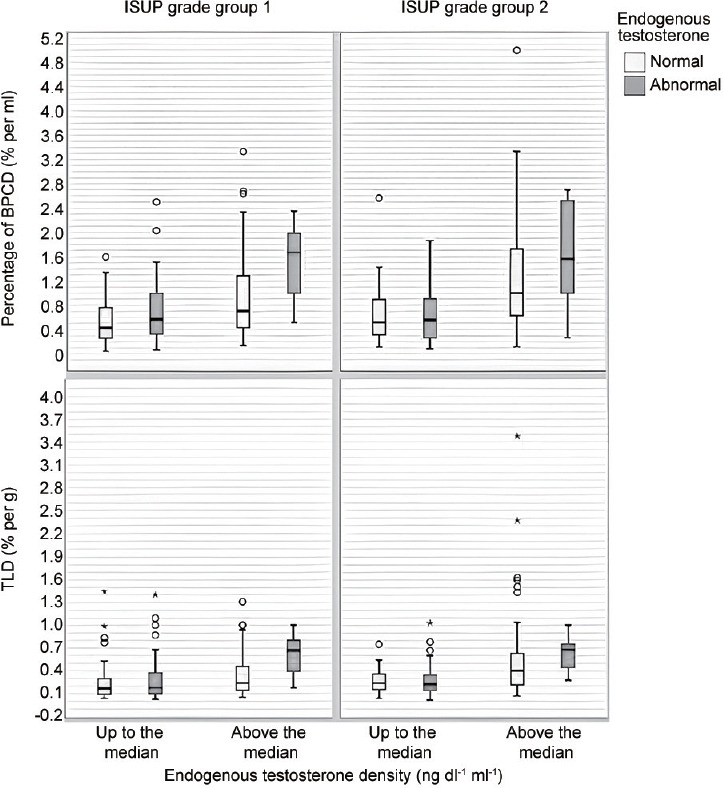
Box plots depicting BPCD and TLD distributions, stratified by ETD, biopsy ISUP grade group, and ET levels in a selected cohort of patients with PSA up to 10 ng ml−1, clinical stage T1c, and ISUP grade group 1 or 2. As ETD increases, the risk of higher BPCD increases, but increments are higher for patients with abnormal ET for either ISUP grade group 1 or 2. Similarly, as ETD increases, TLD increases, but increments are higher for patients with abnormal ET for either ISUP grade group 1 or 2. BPCD: biopsy-positive cores density; TLD: tumor load density; ET: endogenous testosterone; ETD: ET density; ISUP: International Society of Urological Pathology; PSA: prostate-specific antigen.
DISCUSSION
The purpose of this study was to compare ETD with other standard clinical parameters used to assess the features of aggressive disease in a highly selected cohort of PCa patients with PSA within 10 ng ml−1, clinical stage T1c, and ISUP grade group 1 or 2. These patients belong to very favorable low- and intermediate-risk PCa categories. Factors associated with disease progression were evaluated using Cox proportional hazards regression analyses, which showed that tumor grading was an independent predictor. Specifically, patients with biopsy ISUP grade group 2 had a higher risk of disease progression, as well as those undergoing tumor upgrading in the surgical specimen. Moreover, tumor upgrading was significantly associated with disease progression even after adjustment for other unfavorable pathological features, including seminal vesicle invasion and positive surgical margins. According to our results, the estimated risk of disease progression for patients with biopsy ISUP grade group 2 was almost 2.9-fold higher than that for patients diagnosed with ISUP grade group 1. Similarly, the estimated risk of disease progression for patients with tumor upgrading was 3.1-fold higher than that for patients without after adjustment for seminal vesicle invasion (2.6-fold higher than cases without) and positive surgical margins (2.2-fold higher than controls). These results confirm the prognostic potential of the actual tumor grade formulation; accordingly, as tumor grade increases along groups, the probability of recurrence increases.3,30 Specifically, 5-year biochemical recurrence-free survival rates after RP for ISUP grade groups 1 to 5 were 96%, 88%, 63%, 48%, and 26%, respectively; moreover, HR of ISUP grade groups 2 to 5 compared to group 1 was 2.2, 7.3, 12.3, and 23.9, respectively.3,30 As a theory, disease progression by tumor upgrading may explain the main drawback of AS, which is represented by 1% of cancer-specific mortality.2 A large study, including 1113 patients, has shown that tumor upgrading was associated with adverse pathological features; however, this study suffered from limitations such as historical and nonhomogenous cohorts, lack in assessing PV and PSAD, and its retrospective nature.31 Although our study shows similarities with the fore mentioned one, it differs for the cohort, contemporary and highly selected, and for evaluating tumor density factors, as well.
The risk of tumor upgrading was predicted by biopsy ISUP grade group 2 after adjustment for age, and by specimen aggressive features. According to our results, the estimated risk of tumor upgrading for patients presenting with biopsy ISUP grade group 2 was 1.7-fold higher than that of ISUP grade group 1 cases. Notably, the estimated risk of tumor upgrading for patients with large tumors (TLD above the median) was 2.2-fold higher than controls, independently by tumor upstaging, including extracapsular extension (4.1-fold higher than controls with pT2 disease) and seminal vesicle invasion (5.6-fold higher than controls). So far, tumor quantitation density is an important parameter for assessing tumor grading features, which adversely impact on the natural history of the disease. Our findings show that tumor-related density parameters are associated with upgrading patterns, and may explain the dynamic events which lead to the end of AS. Recently, a study has shown that PSAD predicted tumor upgrading at confirmatory biopsy in men who were elected for AS, including favorable low- and intermediate-risk patients with negative mpMRI findings; however, the study was limited by the small number of patients, by missing RP specimens, and by including two institutions with different AS protocols; moreover, it did not investigate ET, ETD, and tumor quantitation density features.32
Notably, our study showed a positive association between ETD and predictors of aggressive disease, including tumor quantitation density features (BPCD and TLD), PSAD, and biopsy ISUP grade group 2. Accordingly, as ETD increased, the risk of high tumor load densities increased, but tumor load increments were higher for patients with abnormal ET levels. According to our results, patients with ETD above the median were 3.4 times and 5.2 times more likely to have higher amounts of BPCD and TLD, respectively, compared with controls (ETD up to the median) after adjustment for PSAD and BMI. Moreover, the risk was incremented for unfavorable subgroups, including tumor upgrading and upstaging, as well as positive surgical margins. Patients with ETD above the median and abnormal ET levels were almost 15 times more likely to have high TLD on the surgical specimen, as well as 5.5 times more likely to have high BPCD on biopsy specimens than controls. In either biopsy or surgical specimens, tumor quantitation is an important parameter for evaluating PCa extension; however, only the former is actually extensively used to predict the risk of tumor upgrading, upstaging, as well as the risk of LNI, while the latter, although reported routinely, is rarely considered.2,4 Notably, biopsy tumor quantitation is included in the NCCN and Cancer of the Prostate Risk Assessment (CAPRA) system, as well as in nomograms for predicting LNI.2,4,33 Nevertheless, a recent multicenter study showed that currently available nomograms have similar performances and limitations, but old nomograms performed better for mpMRI parameters did not add any relevant information for increasing the predictive power because of the high operator dependency of the procedure.34 Accordingly, biopsy tumor quantitation features may have an impact in stratifying the favorable low through intermediate PCa risk categories.2,4
In a highly selected cohort, we showed that either ET or ETD was an effective parameter for evaluating occult aggressive disease. Notably, ETD, together with PSAD and BPCD, was positively associated with the risk of disease progression on univariable analysis. This is an important result, which needs to be further explored by larger prospective controlled trials. The association between ET and aggressive PCa is a controversial subject and controlled studies are missing; specifically, the controversy is supported by results demonstrating that the association between ET and the risk of aggressive PCa may be inverse, positive, or null, with the former being the most frequent occurrence.35 Several studies have shown inverse associations between ET and features of unfavorable disease in the surgical specimen such as tumor upgrading and upstaging; however, these investigations were limited for the retrospective nature, for the heterogeneity of the cohorts that were historical with a small number of cases, and/or for not accounting for diurnal variations of ET.14,15,36 On the other hand, there are investigations showing that low ET levels might have a prognostic prediction on the natural history of patients treated with radical RP; however, all these studies were severely biased by the low number of included cases, the heterogeneity of cohorts, the retrospective nature and the lack of evaluation of PV and tumor density factors.37
The results of our study have clinical implications. The cohort is representative of a very favorable subset of low- and intermediate-risk classes that occur frequently in daily clinical practice and implicate treatment decisions involving both urologists and radiation oncologists. Actually, elective treatment for patients representing this type of cohort is AS with drawbacks of disease reclassification for issues related to tumor upgrading and upstaging, which also represent prognostic factors for disease progression. Tumor upgrading represented the most pivotal unfavorable event for being detected in 34.1% of cases, while seminal vesicle invasion represented only 5.0% of operated subjects. Tumor upgrading rates were high for ISUP grade group 1 (44.0%) and ISUP grade group 2 (56.0%). According to study results, which are summarized in Table 3 and Figure 2 and 3, in both ISUP grade group 1 and 2 PCa patients, ETD above the median with abnormal ET levels was associated with the risk of high tumor load densities (BPCD or TLD). Accordingly, this information will help both urologists and radiation oncologists for taking decisions when counseling patients. Actually, recommendations for electing intermediate-risk patients to AS are different for the two main systems. According to EAU, criteria are represented by PSA <10 ng ml−1, ISUP grade group 2 with pattern 4 <10%, and cT <2b; however, there is no agreement on either number or percentage of cores that can be involved. According to NCCN, favorable features are PSA 10–20 ng ml−1 or ISUP grade group 2 or T2b–2c and BPC <50%.2,4 Follow-up schedule is even more controversial. EAU recommends re-biopsy within 6–12 months for ISUP grade group 2 to avoid sampling errors, while NCCN suggests it no more often than 12 months unless clinically indicated by multiparametric magnetic resonance imaging (mpMRI) or PSA or digital rectal examination (DRE). NCCN recommends mpMRI no more often than every 12 months unless clinically indicated, while EAU outlines that there is no definitive evidence to omit re-biopsies by only imaging findings.2,4 Notably, actual comparative data suggest different but meaningful toxicity burden with the use of active treatments in localized disease; moreover, more than 1 of 10 patients with localized disease experience treatment-related regret, which is more common in patients who underwent surgery and radiotherapy than AS.2,4 Taken together, the results of our study may help clinicians in decision-making regarding active treatment choice instead of AS for this highly selected patient cohort. Specifically, preoperative evaluation of ET levels and ETD, which are feasible and easy to assess, may be allowed a potential additional stratification of such patients based on the risk of developing aggressive tumor features or disease progression.
Our study has limitations. Prostate volumes were not all measured at our institution. ET was measured only once and not on a periodic base. Central pathology review of external biopsies was not performed. Results of mpMRI were not evaluated for not being available in all patients. Genomic tests were not performed. The percentage of pattern 4 in biopsy ISUP grade group 2 has not been evaluated. Analysis of maximal cancer involvement of each core, which is an important feature for assessing indolent cancers, was not performed for not being available in all patients.38 Finally, another limitation is the retrospective nature of the study. Additionally, it was not possible to define an ETD cutoff to discriminate between better and worse PCa prognosis. It should be defined and validated in studies with a large patient cohort to help the physician in additional stratification of the very favorable low- and intermediate-risk prostate cancer population. Nevertheless, our study still has several strengths. All prostate specimens were assessed by our dedicated pathologist. ET was measured in the morning that is the appropriate interval for evaluating the levels of the hormone, which decreases in the afternoon. Moreover, data were prospectively collected.
CONCLUSIONS
ETD was an independent factor assessing high tumor quantitation density features in this highly favorable cohort. As ETD increased, BPCD and TLD increased, accordingly; however, increments were higher for abnormal ET levels. Patients with ETD above the median, independently by ET levels and other routinely evaluated factors, represent unfavorable categories for tumor upgrading and disease progression. ET and relative density may stratify the risk of aggressive cancer among PCa patients presenting with very favorable features in the low-risk class through the intermediate-risk class. Prospective controlled trials are required to confirm these results.
AUTHOR CONTRIBUTIONS
ABP conducted the study design and conception, drafted the manuscript, and carried out the statistical analyses. AT performed the drafting of the manuscript, and analyses and interpretation of data. A Panunzio drafted the manuscript and carried out data collection. CC, AB, SG, SV, DD, ES, GM, A Princiotta, and DB carried out data collection. MB, VP, MAC, and AA provided supervision and critical revision of the manuscript for important intellectual contents. All authors read and approved the final manuscript.
COMPETING INTERESTS
All authors declare no competing interests.
Supplementary Information is linked to the online version of the paper on the Asian Journal of Andrology website.
REFERENCES
- 1.Siegel RL, Miller KD, Fuchs HE, Jemal A. Cancer statistics, 2021. CA Cancer J Clin. 2021;71:7–33. doi: 10.3322/caac.21654. [DOI] [PubMed] [Google Scholar]
- 2.Mottet N, van den Bergh RC, Briers E, van den Broeck T, Cumberbatch MG, et al. EAU-EANM-ESTRO-ESUR-SIOG guidelines on prostate cancer–2020 update Part 1: screening, diagnosis, and local treatment with curative intent. Eur Urol. 2021;79:243–62. doi: 10.1016/j.eururo.2020.09.042. [DOI] [PubMed] [Google Scholar]
- 3.Epstein JI, Allsbrook WC, Jr, Amin MB, Egevad LL. ISUP Grading Committee. The 2005 International Society of Urological Pathology (ISUP) consensus conference on Gleason grading of prostatic carcinoma. Am J Surg Pathol. 2005;29:1228–42. doi: 10.1097/01.pas.0000173646.99337.b1. [DOI] [PubMed] [Google Scholar]
- 4.National Comprehensive Cancer Network. Prostate cancer. NCCN clinical practice guidelines in oncology. J Natl Compr Canc Netw. 2004;2:224–48. doi: 10.6004/jnccn.2004.0021. [DOI] [PubMed] [Google Scholar]
- 5.Fossati N, Willemse PM, Van den Broeck T, van den Bergh NC, Yuan CY, et al. The benefits and harms of different extents of lymph node dissection during radical prostatectomy for prostate cancer: a systematic review. Eur Urol. 2017;72:84–109. doi: 10.1016/j.eururo.2016.12.003. [DOI] [PubMed] [Google Scholar]
- 6.Briganti A, Chun FK, Salonia A, Suardi N, Gallina A, et al. Complications and other surgical outcomes associated with extended pelvic lymphadenectomy in men with localized prostate cancer. Eur Urol. 2006;50:1006–13. doi: 10.1016/j.eururo.2006.08.015. [DOI] [PubMed] [Google Scholar]
- 7.Liss MA, Palazzi K, Stroup SP, Jabaji R, Raheem OA, et al. Outcomes and complications of pelvic lymph node dissection during robotic-assisted radical prostatectomy. World J Urol. 2013;31:481–8. doi: 10.1007/s00345-013-1056-9. [DOI] [PubMed] [Google Scholar]
- 8.Tafuri A, Sebben M, Pirozzi M, Processali T, Shakir A, et al. Predictive factors of the risk of long-term hospital readmission after primary prostate surgery at a single tertiary referral center: preliminary report. Urol Int. 2020;104:465–75. doi: 10.1159/000505409. [DOI] [PubMed] [Google Scholar]
- 9.Sebben M, Tafuri A, Shakir A, Pirozzi M, Processali T, et al. The impact of extended pelvic lymph node dissection on the risk of hospital readmission within 180 days after robot assisted radical prostatectomy. World J Urol. 2020;38:2799–809. doi: 10.1007/s00345-020-03094-2. [DOI] [PubMed] [Google Scholar]
- 10.Tafuri A, Porcaro AB, Shakir A, Migliorini F, Verratti V, et al. Serum testosterone and obesity in prostate cancer biology: a call for health promotion in the ageing male. Aging Clin Exp Res. 2021;33:1399–401. doi: 10.1007/s40520-020-01625-w. [DOI] [PubMed] [Google Scholar]
- 11.Porcaro AB, Tafuri A, Sebben M, Pirozzi M, Processali T, et al. Positive association between basal total testosterone circulating levels and tumor grade groups at the time of diagnosis of prostate cancer. Urol Int. 2019;103:400–7. doi: 10.1159/000500960. [DOI] [PubMed] [Google Scholar]
- 12.Tafuri A, Sebben M, Shakir A, Pirozzi M, Processali T, et al. Endogenous testosterone mirrors prostate cancer aggressiveness: correlation between basal testosterone serum levels and prostate cancer European Urology Association clinical risk classes in a large cohort of Caucasian patients. Int Urol Nephrol. 2020;52:1261–9. doi: 10.1007/s11255-020-02398-x. [DOI] [PubMed] [Google Scholar]
- 13.Salonia A, Gallina A, Briganti A, Abdollah F, Suardi N, et al. Preoperative hypogonadism is not an independent predictor of high-risk disease in patients undergoing radical prostatectomy. Cancer. 2011;117:3953–62. doi: 10.1002/cncr.25985. [DOI] [PubMed] [Google Scholar]
- 14.Massengill JC, Sun L, Moul JW, Wu H, McLeod DG, et al. Pretreatment total testosterone level predicts pathological stage in patients with localized prostate cancer treated with radical prostatectomy. J Urol. 2003;169:1670–5. doi: 10.1097/01.ju.0000062674.43964.d0. [DOI] [PubMed] [Google Scholar]
- 15.Ferro M, Lucarelli G, Bruzzese D, Di Lorenzo G, Perdonà S, et al. Low serum total testosterone level as a predictor of upstaging and upgrading in low-risk prostate cancer patients meeting the inclusion criteria for active surveillance. Oncotarget. 2017;8:18424–34. doi: 10.18632/oncotarget.12906. [DOI] [PMC free article] [PubMed] [Google Scholar]
- 16.Porcaro AB, Amigoni N, Tafuri A, Rizzetto R, Shakir A, et al. Endogenous testosterone as a predictor of prostate growing disorders in the aging male. Int Urol Nephrol. 2021;53:843–54. doi: 10.1007/s11255-020-02747-w. [DOI] [PubMed] [Google Scholar]
- 17.Porcaro AB, Tafuri A, Panunzio A, Mazzucato G, Cerrato C, et al. Endogenous testosterone density is an independent predictor of pelvic lymph node invasion in high-risk prostate cancer: results in 201 consecutive patients treated with radical prostatectomy and extended pelvic lymph node dissection. Int Urol Nephrol. 2022;54:541–50. doi: 10.1007/s11255-022-03103-w. [DOI] [PMC free article] [PubMed] [Google Scholar]
- 18.Vermeulen A, Kaufman JM. Diagnosis of hypogonadism in the aging male. Aging Male. 2002;5:170–6. [PubMed] [Google Scholar]
- 19.Porcaro AB, Tafuri A, Sebben M, Novella G, Processali T, et al. Prostate volume index and prostatic chronic inflammation predicted low tumor load in 945 patients at baseline prostate biopsy. World J Urol. 2020;38:957–64. doi: 10.1007/s00345-019-02830-7. [DOI] [PubMed] [Google Scholar]
- 20.Brierley JD, Gospodarowicz MK, Wittekind C. TNM Classification of Malignant Tumours. 8th ed. Oxford: John Wiley &Sons; 2017. pp. 191–4. [Google Scholar]
- 21.Doyle DJ, Hendrix JM, Garmon EH. American Society of Anesthesiologists Classification. Treasure Island: StatPearls Publishing; 2022. Dec 4, 2022. [PubMed] [Google Scholar]
- 22.Briganti A, Larcher A, Abdollah F, Capitanio U, Gallina A, et al. Updated nomogram predicting lymph node invasion in patients with prostate cancer undergoing extended pelvic lymph node dissection: the essential importance of percentage of positive cores. Eur Urol. 2012;61:480–7. doi: 10.1016/j.eururo.2011.10.044. [DOI] [PubMed] [Google Scholar]
- 23.Porcaro AB, Cavicchioli F, Mattevi D, De Luyk N, Corsi P, et al. Clinical factors of disease reclassification or progression in a contemporary cohort of prostate cancer patients elected to active surveillance. Urol Int. 2017;98:32–9. doi: 10.1159/000452631. [DOI] [PubMed] [Google Scholar]
- 24.Porcaro AB, Inverardi D, Corsi P, Sebben M, Cacciamani G, et al. Prostate-specific antigen levels and proportion of biopsy positive cores are independent predictors of upgrading patterns in low-risk prostate cancer. Minerva Urol Nefrol. 2020;72:66–71. doi: 10.23736/S0393-2249.18.03172-7. [DOI] [PubMed] [Google Scholar]
- 25.Porcaro AB, Cacciamani GE, Sebben M, Tafuri A, Processali T, et al. Lymph nodes invasion of Marcille's fossa associates with high metastatic load in prostate cancer patients undergoing extended pelvic lymph node dissection: the role of “marcillectomy”. Uro Int. 2019;103:25–32. doi: 10.1159/000500330. [DOI] [PubMed] [Google Scholar]
- 26.Porcaro AB, Tafuri A, Sebben M, Processali T, Pirozzi M, et al. High body mass index predicts multiple prostate cancer lymph node metastases after radical prostatectomy and extended pelvic lymph node dissection. Asian J Androl. 2020;22:323–9. doi: 10.4103/aja.aja_70_19. [DOI] [PMC free article] [PubMed] [Google Scholar]
- 27.Cacciamani GE, Porcaro AB, Sebben M, Tafuri A, Rizzetto R, et al. Extended pelvic lymphadenectomy for prostate cancer: should the Cloquet's nodes dissection be considered only an option? Minerva Urol Nefrol. 2019;71:136–45. doi: 10.23736/S0393-2249.19.03342-3. [DOI] [PubMed] [Google Scholar]
- 28.Van Der Kwast TH, Amin MB, Billis A, Epstein JI, Griffiths D, et al. International Society of Urological Pathology (ISUP) consensus conference on handling and staging of radical prostatectomy specimens. Working group 2: T2 substaging and prostate cancer volume. Mod Pathol. 2011;24:16–25. doi: 10.1038/modpathol.2010.156. [DOI] [PubMed] [Google Scholar]
- 29.Wang C, Nieschlag E, Swerdloff R, Behre HM, Hellstrom WJ, et al. ISA, ISSAM, EAU, EAA and ASA recommendations: investigation, treatment and monitoring of late-onset hypogonadism in males. Int J Impot Res. 2009;21:1–8. doi: 10.1038/ijir.2008.41. [DOI] [PubMed] [Google Scholar]
- 30.Epstein JI, Zelefsky MJ, Sjoberg DD, Nelson JB, Egevad L, et al. A contemporary prostate cancer grading system: a validated alternative to the Gleason score. Eur Urol. 2016;69:428–35. doi: 10.1016/j.eururo.2015.06.046. [DOI] [PMC free article] [PubMed] [Google Scholar]
- 31.Freedland SJ, Kane CJ, Amling CL, Aronson WJ, Terris MK, et al. Upgrading and downgrading of prostate needle biopsy specimens: risk factors and clinical implications. Urology. 2007;69:495–9. doi: 10.1016/j.urology.2006.10.036. [DOI] [PMC free article] [PubMed] [Google Scholar]
- 32.Press BH, Khajir G, Ghabili K, Leung C, Fan RE, et al. Utility of PSA density in predicting upgraded Gleason score in men on active surveillance with negative MRI. Urology. 2021;155:96–100. doi: 10.1016/j.urology.2021.05.035. [DOI] [PubMed] [Google Scholar]
- 33.Hueting TA, Cornel EB, Somford DM, Jansen H, van Basten JA, et al. External validation of models predicting the probability of lymph node involvement in prostate cancer patients. Eur Urol Oncol. 2018;1:411–7. doi: 10.1016/j.euo.2018.04.016. [DOI] [PubMed] [Google Scholar]
- 34.Oderda M, Diamand R, Albisinni S, Calleris G, Carbone A, et al. Indications for and complications of pelvic lymph node dissection in prostate cancer: accuracy of available nomograms for the prediction of lymph node invasion. BJU Int. 2021;127:318–25. doi: 10.1111/bju.15220. [DOI] [PubMed] [Google Scholar]
- 35.Klap J, Schmid M, Loughlin KR. The relationship between total testosterone levels and prostate cancer: a review of the continuing controversy. J Urol. 2015;193:403–14. doi: 10.1016/j.juro.2014.07.123. [DOI] [PubMed] [Google Scholar]
- 36.Isom-Batz G, Bianco FJ, Jr, Kattan MW, Mulhall JP, Lilja H, et al. Testosterone as a predictor of pathological stage in clinically localized prostate cancer. J Urol. 2005;173:1935–7. doi: 10.1097/01.ju.0000158040.33531.e7. [DOI] [PMC free article] [PubMed] [Google Scholar]
- 37.Røder MA, Christensen IJ, Berg KD, Gruschy L, Brasso K, et al. Serum testosterone level as a predictor of biochemical failure after radical prostatectomy for localized prostate cancer. BJU Int. 2012;109:520–4. doi: 10.1111/j.1464-410X.2011.10335.x. [DOI] [PubMed] [Google Scholar]
- 38.Antonelli A, Fugini AV, Tardanico R, Giovanessi L, Zambolin T, et al. The percentage of core involved by cancer is the best predictor of insignificant prostate cancer, according to an updated definition (tumor volume up to 2.5 cm3): analysis of a cohort of 210 consecutive patients with low-risk disease. Urology. 2014;83:28–32. doi: 10.1016/j.urology.2013.07.056. [DOI] [PubMed] [Google Scholar]