Abstract
A novel fiber-optic-based method for simultaneous time- and wavelength-resolved fluorescence spectroscopy for the rapid diagnosis of diseased tissue is demonstrated. By combining multiple bandpass and dichroic filters (405/40, 460/50, and 550/50) with different lengths of optical fiber (1, 10, and 19m) acting as an optical delay this system enables the near real-time acquisition and characterization of time-resolved fluorescence spectra using a single detector and excitation input. The recording of multiple fluorescence response pulses at selected wavelengths can be completed in hundreds of nanoseconds, which provides the capability of a real-time characterization of biological systems.
Time-resolved fluorescence spectroscopy (TRFS) is undergoing rapid development for medical applications in the detection and diagnosis of diseases, including cancer and atherosclerosis [1,2]. Specifically designed time- and wavelength-resolved fluorescence spectroscopy systems, typically using a grating monochromator, a photomultiplier, and a fast digitizer, can provide both fluorescence spectral and lifetime information [3–5]. Such systems demonstrate an enhanced capability of identifying diseased tissues by detecting the changes in their biochemical composition and metabolism. [3–7]. However, the clinical application of TRFS still faces challenges, including the time-consuming data acquisition and complex processing of the results. In this Letter, we report a novel concept achieved in a compact robust design providing feasible near real-time TRFS through the combination of optical fibers and bandpass filters. A single detector is used to simultaneously record multiple fluorescence intensity decay profiles (fluorescence response pulses) in response to a single pulse excitation event. Simultaneous timeand wavelength-resolved fluorescence spectroscopy (STWRFS) allows the recording of both fluorescence lifetime and intensity information within hundreds of nanoseconds. In addition, this system can be optimized for the characterization of a particular disease/ tissue with suitable spectral bands, thus simplifying the data analysis and tissue classification algorithms. Since the objective of medical diagnosis is to identify conditions in tissue by rapidly recognizing signatures corresponding to specific states, this technique has the inherent potential for a direct recording of representative tissue fluorescence. The current design aims to translate the research results to clinical applications. Classification models based on the TRFS database of normal and diseased tissues (atherosclerotic plaques and brain tumors) acquired both in vitro and in vivo are concurrently under development in our laboratory. Once this apparatus is interfaced with classification models that enable online diagnosis, the STWRFS device can evolve into a powerful diagnosis tool for physicians.
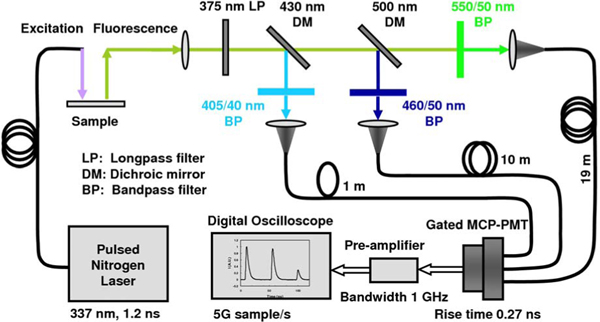
A schematic of the STWRFS apparatus is illustrated in Fig. 1. Based on a time-domain time-resolved approach [1,2,4], the core design of the system is the combination of three bandpass emission filters with optical fibers in different lengths, which enable the delivery of the fluorescence response pulses to the digitizer sequentially with 50 ns time delays. The excitation light from a nitrogen laser (337 nm, 1.2 ns pulse width, 10 Hz repetition rate) was incident onto the sample using an optical fiber. The fluorescence emission was collected by another optical fiber and delivered to a series of wavelength splitting stages so that the light was divided into three spectral subbands: 405/40, 460/50, and 550/50 nm (filter 1, filter 2, and filter 3, from Chroma Inc.). The light was then coupled into three fibers with integrated collimation lenses and with varying lengths of 1, 10, and 19 m (OZ Optics). The proximal ends of the fibers were arranged on a multichannel plate photomultiplier (MCP-PMT) configuration (gated to reject background light, R2024U, Hamamatsu), coupled to a preamplifier (9306, EG&G ORTEC). The fluorescence signals sequentially arrived at a fast digitizer (TDS 680C, Tektronix) that recorded the multiple time-resolved fluorescence response pulses. The acquisition was completed in a single acquisition of < 200 ns after one excitation laser pulse. To improve the signal to noise ratio each fluorescence profile was recorded as an average on the digitizer in response to repeated laser pulses at low energy (1 μJ). The average number was usually in the range of 16–256 depending on the emission brightness of the samples. Since a low-energy excitation pulse is needed it is possible in a future design to replace the nitrogen laser with a high-frequency compact solid state laser. In addition, for high quantum efficiency samples, the multiple fluorescence response pulses can be recorded in response to a single laser pulse excitation. This design not only achieves a rapid acquisition of specific data, but also facilitates construction of a compact and robust apparatus. The current optical instrument has a relatively small footprint of 18×20 cm. In this study three filters were selected for the autofluorescence characterization of the arterial wall based on our previous work [6,7] on arterial tissue, although more channels could be added according to the needs of a particular application. The filter transmission spectra measured by a spectrometer (USB2000, Ocean Optics) were consistent with the design profiles of the filter sets. The spectral intensity calibration of the apparatus was performed with a tungsten–halogen standard lamp (63358, Oriel). The spectral transmission ratio of the three channels was 0.28:1.0:0.59, which was then applied to the intensity correction of the collected fluorescence signals.
Fig. 1.
(Color online) Schematic of the STWRFS system.
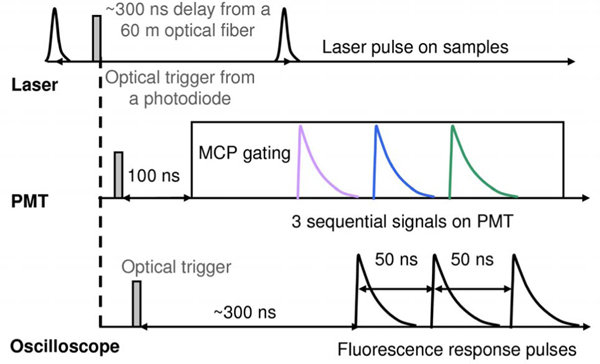
The synchronization of the electronic and optical signals is illustrated in Fig. 2. The optical trigger from a photodiode coupled to the laser output (2100, EG&E, Princeton Applied Research) is the master trigger to activate the oscilloscope for data acquisition. Laser pulses are delivered to the samples via a 60 m long optical fiber producing a 340 ns delay. This allows the fluorescence signals to arrive at the detector after the rising edge of the MCP-PMT gating pulse to reduce electronic background noise. Eventually, three lifetime decays are sequentially recorded within 50 ns time intervals resulting from the light propagation in the optical fibers with a 9 m difference in length. This delay allows the accurate measurement of fluorescence lifetimes up to 15 ns. The 19 m optical fiber, which delivers the last signal, does not have the time limitation. A longer decay can be recorded by increasing the length difference of the fibers.
Fig. 2.
(Color online) Trigger timing diagram of the STWRFS system.
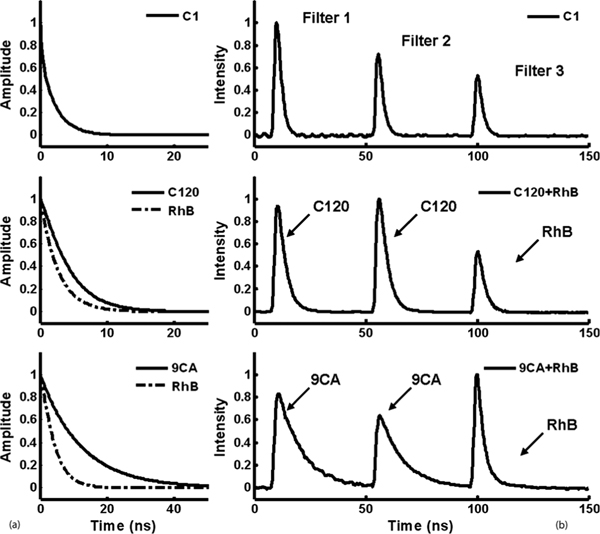
The temporal response of the system was evaluated with specific attention to the light dispersion through the fibers of differing lengths. First, the system responses (laser profiles) were measured through the 1, 10, and 19 m optical fibers coupled on the filter 1 port when the filter was removed. The full width at half maximum of the system responses were 1.62, 1.73, and 1.86 ns, respectively. The difference between them is much lower than the system temporal resolution estimated at ~500 ps, which is mainly determined by the rise time of the MCP-PMT (270 ns), the preamplifier bandwidth (1 GHz), and the bandwidth of the digital oscilloscope (1 GHz, 5 G sample/s). A conventional multiexponential approximation combined with iterative numerical deconvolution was used to retrieve the fluorescence impulse response function (FIRF) and to compute the lifetimes. Second, the fluorescence emission of fluorophore coumarin 1 [(C-1), all fluorophores in this report are purchased from Sigma-Aldrich] with a broad emission spectrum (390–600) nm was acquired through all three channels at the same time. The recorded FIRF and the deconvolved lifetimes of C-1 are consistent in the three channels, as seen in Fig. 3. The average lifetimes (τ) are 2.34, 2.18, and 2.14 ns for filters 1, 2, and 3, respectively. These results demonstrated that the dispersion error is negligible in the STWRFS, designed here for the application of diagnosing atherosclerotic plaque with typical lifetimes in the range of 1–7 ns[4,8–10].
Fig. 3.
STWRFS measurement: (a) FIRF of C1, C120, RhB, and 9CA retrieved from (b) fluorescence response pulses originally recorded from pure or mixed dye solutions. A neutral density filter of 0.8 or 0.6 was added in front of filter 2 for C-1, C-120, and 9CA to avoid the saturation of the photomultiplier (PMT) due to the intense emission peaks ~460 nm. For the analysis of tissue autofluorescence the light collecting efficiency can be optimized by designing the proper bandwidth and attenuation in each channel to produce correctly scaled signals on the detector.
To examine the performance of this system, several standard fluorophores with stable single exponential lifetimes in the range of 1–12 ns were measured. The emission spectra of coumarin 120 (C-120) and 9-anthracenecarbonitrile (9CA) mainly pass through filters 1 and 2, while that of Rhodamine B (RhB) goes through filter 3. Their lifetimes (τ), recorded individually, are 2.6, 3.8, and 12 ns for RhB, C-120, and 9CA, respectively, which are in good agreement with those reported (τr) in the literature [4,5,11,12]. All the results are summarized in Table 1. The fluorescence response pulses and intrinsic decays are plotted in Fig. 3.
Table 1.
Fluorescence Lifetimes of Standard Dyes and Their Mixed Solutions
| Dye | Filter | τ(ns) | σ(ns) | τr (ns) |
|---|---|---|---|---|
|
| ||||
| C-1a | 1 | 2.3 | 0.05 | 1.8–2.02 [11] |
| 2 | 2.2 | 0.03 | ||
| 3 | 2.1 | 0.06 | ||
| 9CAb | 1 | 12.1 | 0.11 | 11.7–11.85 [4,5] |
| 2 | 11.6 | 0.06 | ||
| RhBc | 3 | 2.6 | 0.03 | 2.6–3.1 [2,4] |
| 9CA+RhBd | 1 | 11.7 | 0.16 | |
| 2 | 11.0 | 0.06 | ||
| 3 | 5.1 | 0.27 | ||
| C-120e | 1 | 3.8 | 0.03 | 3.64 [12] |
| 2 | 3.8 | 0.01 | ||
| C-120+RhBf | 1 | 3.8 | 0.05 | |
| 2 | 3.6 | 0.02 | ||
| 3 | 2.9 | 0.02 | ||
100 μM in methanol.
100 μM in ethanol.
100 μM in ethanol.
100 μM in ethanol.
100 μM in ethanol.
25/50 μM in ethanol. σ is the standard deviation.
Further, the instrument was validated with mixtures of standard dye solutions: C-120 and RhB and 9CA and RhB with varied lifetimes in different spectral regimes. C-120 and 9CA have longer lifetimes and short emission wavelengths, while RhB has a short lifetime but a long emission wavelength. The fluorescence decays acquired in the three filter channels are displayed in Fig. 3(b). The retrieved lifetimes are listed in Table 1. 9CA and C-120 have consistent results as previous works. RhB in mixture shows somewhat longer lifetime than the value from the pure solution due to the spectral overlap of 9CA or C-120, although the instrument still reasonably distinguished the three dyes based on their characteristic fluorescence lifetime and emission wavelength.
This work successfully demonstrated the new concept of STWRFS in a single acquisition by the utilization of optical fibers and bandpass filters. The specific goal of this design targets the detection and screening of particular diseases with characterized tissue autofluorescence parameters. The advantages of the system include: (1) a rapid and specific data acquisition, which enables real-time study of biological systems in vivo using TRFS, and (2) multiple timeresolved fluorescence response pulses generated and recorded in response to a single excitation event; this virtually eliminates or minimizes the effect of photobleaching on the spectrum measurement. In addition, the STWRFS reported here allows for future development of compact/portable systems suitable for direct clinical investigations. This technique is undergoing further improvement in our laboratory. It utilizes a prism-based multichannel system for timeand wavelength-resolved fluorescence detection providing enhanced optical transmission efficiency in a miniaturized device.
Acknowledgments
This work was supported in part by the National Institutes of Health (NIH) grants R01-HL67377 and R21-EB003628.
References
- 1.Elson DS, Galletly N, Talbot C, Requejo-Isidro J, McGinty J, Dunsby C, Lanigan PMP, Munro I, Benninger RKP, de Beule P, Auksorius E, Hegyi L, Sandison A, Wallace A, Soutter P, Neil MAA, Lever J, Stamp GW, and French PMW, in Reviews in Fluorescence, Geddes CD and Lakowicz JR, eds. (Springer, 2006), p. 1. [Google Scholar]
- 2.Lakowicz JR, Principle of Fluorescence Spectroscopy (Springer, 2006). [Google Scholar]
- 3.Pfefer TJ, Paithankar DY, Poneros JM, Schomacker KT, and Nishioka NS, Lasers Surg. Med. 32, 10 (2003). [DOI] [PubMed] [Google Scholar]
- 4.Fang QY, Papaioannou T, Jo JA, Vaitha R, Shastry K, and Marcu L, Rev. Sci. Instrum. 75, 151 (2004). [DOI] [PMC free article] [PubMed] [Google Scholar]
- 5.Glanzmann T, Ballini JP, van den Bergh H, and Wagnieres G, Rev. Sci. Instrum. 70, 4067 (1999). [Google Scholar]
- 6.Marcu L, Fishbein MC, Maarek JMI, and Grundfest WS, Arterioscler. Thromb. 21, 1244 (2001). [DOI] [PubMed] [Google Scholar]
- 7.Jo JA, Fang Q, Papaioannou T, Baker JD, Dorafshar AH, Reil T, Qiao JH, Fishbein MC, Freischlag JA, and Marcu L, J. Biomed. Opt. 11, 021004 (2006). [DOI] [PMC free article] [PubMed] [Google Scholar]
- 8.Pitts JD and Mycek MA, Rev. Sci. Instrum. 72, 3061 (2001). [Google Scholar]
- 9.Requejo-Isidro J, McGinty J, Munro I, Elson DS, Galletly NP, Lever MJ, Neil MAA, Stamp GW, French PMW, Kellett PA, Hares JD, and Dymoke-Bradshaw AKL, Opt. Lett. 29, 2249 (2004). [DOI] [PubMed] [Google Scholar]
- 10.Siegel J, Elson DS, Webb SED, Lee KCB, Vlanclas A, Gambaruto GL, Leveque-Fort S, Lever MJ, Tadrous PJ, Stamp GWH, Wallace AL, Sandison A, Watson TF, Alvarez F, and French PMW, Appl. Opt. 42, 2995 (2003). [DOI] [PubMed] [Google Scholar]
- 11.Rusalov MV, Druzhinin SI, and Uzhinov BM, J.Fluoresc. 14, 193 (2004). [DOI] [PubMed] [Google Scholar]
- 12.Pal H, Nad S, and Kumbhakar M, J. Chem. Phys. 119, 443 (2003). [Google Scholar]


