

Abstract
Background
In vitro fertilisation (IVF) is a treatment for unexplained subfertility but is invasive, expensive, and associated with risks.
Objectives
To evaluate the effectiveness and safety of IVF versus expectant management, unstimulated intrauterine insemination (IUI), and IUI with ovarian stimulation using gonadotropins, clomiphene citrate (CC), or letrozole in improving pregnancy outcomes.
Search methods
We searched following databases from inception to November 2021, with no language restriction: Cochrane Gynaecology and Fertility Register, CENTRAL, MEDLINE, Embase, PsycINFO, CINAHL. We searched reference lists of articles and conference abstracts.
Selection criteria
Randomised controlled trials (RCTs) comparing effectiveness of IVF for unexplained subfertility with expectant management, unstimulated IUI, and stimulated IUI.
Data collection and analysis
We followed standard Cochrane methods.
Main results
IVF versus expectant management (two RCTs)
We are uncertain whether IVF improves live birth rate (LBR) and clinical pregnancy rate (CPR) compared to expectant management (odds ratio (OR) 22.0, 95% confidence interval (CI) 2.56 to 189.37; 1 RCT; 51 women; very low‐quality evidence; OR 3.24, 95% CI 1.07 to 9.8; 2 RCTs; 86 women; I2 = 80%; very low‐quality evidence). Adverse effects were not reported. Assuming 4% LBR and 12% CPR with expectant management, these would be 8.8% to 9% and 13% to 58% with IVF.
IVF versus unstimulated IUI (two RCTs)
IVF may improve LBR compared to unstimulated IUI (OR 2.47, 95% CI 1.19 to 5.12; 2 RCTs; 156 women; I2 = 60%; low‐quality evidence). We are uncertain whether there is a difference between IVF and IUI for multiple pregnancy rate (MPR) (OR 1.03, 95% CI 0.04 to 27.29; 1 RCT; 43 women; very low‐quality evidence) and miscarriage rate (OR 1.72, 95% CI 0.14 to 21.25; 1 RCT; 43 women; very low‐quality evidence). No study reported ovarian hyperstimulation syndrome (OHSS). Assuming 16% LBR, 3% MPR, and 6% miscarriage rate with unstimulated IUI, these outcomes would be 18.5% to 49%, 0.1% to 46%, and 0.9% to 58% with IVF.
IVF versus IUI + ovarian stimulation with gonadotropins (6 RCTs), CC (1 RCT), or letrozole (no RCTs)
Stratified analysis was based on pretreatment status.
Treatment‐naive women
There may be little or no difference in LBR between IVF and IUI + gonadotropins (1 IVF to 2 to 3 IUI cycles: OR 1.19, 95% CI 0.87 to 1.61; 3 RCTs; 731 women; I2 = 0%; low‐quality evidence; 1 IVF to 1 IUI cycle: OR 1.63, 95% CI 0.91 to 2.92; 2 RCTs; 221 women; I2 = 54%; low‐quality evidence); or between IVF and IUI + CC (OR 2.51, 95% CI 0.96 to 6.55; 1 RCT; 103 women; low‐quality evidence). Assuming 42% LBR with IUI + gonadotropins (1 IVF to 2 to 3 IUI cycles) and 26% LBR with IUI + gonadotropins (1 IVF to 1 IUI cycle), LBR would be 39% to 54% and 24% to 51% with IVF. Assuming 15% LBR with IUI + CC, LBR would be 15% to 54% with IVF.
There may be little or no difference in CPR between IVF and IUI + gonadotropins (1 IVF to 2 to 3 IUI cycles: OR 1.17, 95% CI 0.85 to 1.59; 3 RCTs; 731 women; I2 = 0%; low‐quality evidence; 1 IVF to 1 IUI cycle: OR 4.59, 95% CI 1.86 to 11.35; 1 RCT; 103 women; low‐quality evidence); or between IVF and IUI + CC (OR 3.58, 95% CI 1.51 to 8.49; 1 RCT; 103 women; low‐quality evidence). Assuming 48% CPR with IUI + gonadotropins (1 IVF to 2 to 3 IUI cycles) and 17% with IUI + gonadotropins (1 IVF to 1 IUI cycle), CPR would be 44% to 60% and 28% to 70% with IVF. Assuming 21% CPR with IUI + CC, CPR would be 29% to 69% with IVF.
There may be little or no difference in multiple pregnancy rate (MPR) between IVF and IUI + gonadotropins (1 IVF to 2 to 3 IUI cycles: OR 0.82, 95% CI 0.38 to 1.77; 3 RCTs; 731 women; I2 = 0%; low‐quality evidence; 1 IVF to 1 IUI cycle: OR 0.76, 95% CI 0.36 to 1.58; 2 RCTs; 221 women; I2 = 0%; low‐quality evidence); or between IVF and IUI + CC (OR 0.64, 95% CI 0.17 to 2.41; 1 RCT; 102 women; low‐quality evidence).
We are uncertain if there is a difference in OHSS between IVF and IUI + gonadotropins with 1 IVF to 2 to 3 IUI cycles (OR 6.86, 95% CI 0.35 to 134.59; 1 RCT; 207 women; very low‐quality evidence); and there may be little or no difference in OHSS with 1 IVF to 1 IUI cycle (OR 1.22, 95% CI 0.36 to 4.16; 2 RCTs; 221 women; I2 = 0%; low‐quality evidence). There may be little or no difference between IVF and IUI + CC (OR 1.53, 95% CI 0.24 to 9.57; 1 RCT; 102 women; low‐quality evidence).
We are uncertain if there is a difference in miscarriage rate between IVF and IUI + gonadotropins with 1 IVF to 2 to 3 IUI cycles (OR 0.31, 95% CI 0.03 to 3.04; 1 RCT; 207 women; very low‐quality evidence); and there may be little or no difference with 1 IVF to 1 IUI cycle (OR 1.16, 95% CI 0.44 to 3.02; 1 RCT; 103 women; low‐quality evidence). There may be little or no difference between IVF and IUI + CC (OR 1.48, 95% CI 0.54 to 4.05; 1 RCT; 102 women; low‐quality evidence).
In women pretreated with IUI + CC
IVF may improve LBR compared with IUI + gonadotropins (OR 3.90, 95% CI 2.32 to 6.57; 1 RCT; 280 women; low‐quality evidence). Assuming 22% LBR with IUI + gonadotropins, LBR would be 39% to 65% with IVF.
IVF may improve CPR compared with IUI + gonadotropins (OR 14.13, 95% CI 7.57 to 26.38; 1 RCT; 280 women; low‐quality evidence). Assuming 30% CPR with IUI + gonadotropins, CPR would be 76% to 92% with IVF.
Authors' conclusions
IVF may improve LBR over unstimulated IUI. Data should be interpreted with caution as overall evidence quality was low.
Keywords: Female; Humans; Pregnancy; Abortion, Spontaneous; Abortion, Spontaneous/epidemiology; Clomiphene; Clomiphene/therapeutic use; Fertility Agents, Female; Fertility Agents, Female/therapeutic use; Fertilization in Vitro; Fertilization in Vitro/methods; Gonadotropins; Gonadotropins/therapeutic use; Infertility; Infertility/drug therapy; Infertility/etiology; Insemination, Artificial; Insemination, Artificial/adverse effects; Insemination, Artificial/methods; Letrozole; Live Birth; Ovarian Hyperstimulation Syndrome; Ovulation Induction; Ovulation Induction/methods; Pregnancy Rate
Plain language summary
In vitro fertilisation compared to other options for unexplained subfertility
Key messages
In vitro fertilisation (IVF) treatment may be associated with a higher chance of a live birth compared to unstimulated intrauterine insemination (IUI) treatment. IVF may also result in higher live birth rates when compared to ovarian stimulation plus IUI in women previously treated with IUI plus clomiphene citrate (CC). However, in treatment‐naive women, live birth following IVF may be no better than IUI plus gonadotropins or IUI plus CC.
Background
IVF is frequently used for couples with unexplained subfertility, as it may bypass a variety of undiagnosed biological problems. However, it is expensive and invasive and can lead to complications. Other management options for unexplained subfertility include trying naturally for a pregnancy, introducing washed sperm within the womb (known as intrauterine insemination, or IUI), and performing IUI after the use of fertility drugs clomiphene citrate (CC) and gonadotropins to stimulate the ovaries.
What did we want to find out?
We investigated whether IVF treatment leads to more live births than other treatments for unexplained subfertility.
What did we do?
We included nine randomised controlled trials (a type of study where participants are randomly assigned to one of two or more treatment groups) in the review. Some trials involved several comparisons. Two trials compared IVF with expectant management; two with IUI alone; and six with IUI plus stimulation of the ovaries.
What did we find?
Scanty evidence meant that we were unable to draw any firm conclusions as to whether IVF may be associated with higher live birth rate (LBR) than trying naturally (expectant management). If we assume 4% LBR with expectant management, LBR with IVF would be between 8.8% and 9%.
IVF may lead to improved LBR compared to unstimulated IUI. If we assume LBR 16% with unstimulated IUI, LBR with IVF would be between 18.5% and 49%.
In women pretreated with IUI plus CC, IVF may lead to improved LBR compared with IUI plus gonadotropins. In women pretreated with IUI plus CC, if we assume 22% LBR with IUI plus gonadotropins, LBR with IVF would be between 39% and 65%.
In women never previously treated with IUI plus CC, LBR may be no better after one IVF cycle compared to two to three cycles of IUI plus gonadotropins; one IVF cycle compared to one IUI cycle plus gonadotropins; or IVF compared to IUI plus CC. If we assume 42% LBR with IUI plus gonadotropins (in one IVF to two to three IUI cycles), LBR would be between 39% and 54% with IVF; assuming 26% LBR with IUI plus gonadotropins (in one IVF to one IUI cycle), LBR would be between 24% and 51% with IVF. Assuming 15% LBR with IUI plus CC, LBR would be between 15% and 54% with IVF.
We were unable to examine complications associated with these treatments owing to lack of evidence.
What are the limitations of the evidence?
We have low confidence in the evidence because there were relatively few studies, with low numbers of participants.
How up‐to‐date is this evidence?
The evidence is current to November 2021.
Summary of findings
Summary of findings 1. IVF versus expectant management for unexplained subfertility.
| IVF versus expectant management for unexplained subfertility | ||||||
|
Patient or population: women with unexplained subfertility
Setting: fertility clinic
Intervention: IVF Comparison: expectant management | ||||||
| Outcomes | Plain language summary | Illustrative comparative risks* (95% CI) | Relative effect (95% CI) | No. of participants (studies) | Quality of the evidence (GRADE) | |
| Assumed risk | Corresponding risk | |||||
| Expectant management | IVF | |||||
| Live birth per woman randomised | We are uncertain whether IVF treatment may improve live birth rate compared with expectant management. | 37 per 1000 | 458 per 1000 (90 to 879) | OR 22 (2.56 to 189.37) | 51 (1 study) | ⊕⊝⊝⊝ Very low 1,2,3 |
| Clinical pregnancy rate per woman randomised | We are uncertain whether IVF treatment may improve clinical pregnancy rate compared with expectant management. | 122 per 1000 | 310 per 1000 (129 to 576) | OR 3.24 (1.07 to 9.8) | 86 (2 studies) | ⊕⊝⊝⊝ Very low 3, 4, 5 |
| Multiple pregnancy rate per woman randomised | No study reported this outcome. | |||||
| OHSS rate per woman randomised | No study reported this outcome. | |||||
| Miscarriage rate per woman randomised | No study reported this outcome. | |||||
| *The basis for the assumed risk (e.g. the median control group risk across studies) is provided in footnotes. The corresponding risk (and its 95% confidence interval) is based on the assumed risk in the comparison group and the relative effect of the intervention (and its 95% CI). CI: confidence interval; IVF: in vitro fertilisation; OHSS: ovarian hyperstimulation syndrome; OR: odds ratio | ||||||
| GRADE Working Group grades of evidence High quality: Further research is very unlikely to change our confidence in the estimate of effect. Moderate quality: Further research is likely to have an important impact on our confidence in the estimate of effect and may change the estimate. Low quality: Further research is very likely to have an important impact on our confidence in the estimate of effect and is likely to change the estimate. Very low quality: We are very uncertain about the estimate. | ||||||
1Serious risk of bias: downgraded by one level. Unclear risk of performance bias. 2Serious indirectness: downgraded by one level. Single study, small number of participants, and very wide confidence interval. 3Serious imprecision: downgraded by one level. Very wide confidence interval. 4Serious risk of bias: downgraded by one level. High risk of other bias and attrition bias, as well as unclear risk of bias for other domains. 5Serious inconsistency: downgraded by one level. High statistical heterogeneity (80%).
Summary of findings 2. IVF versus unstimulated IUI for unexplained subfertility.
| IVF versus unstimulated IUI for unexplained subfertility | ||||||
| Population: women with unexplained subfertility Setting: fertility clinic Intervention: IVF Comparison: unstimulated IUI | ||||||
| Outcomes | Plain language summary | Illustrative comparative risks* (95% CI) | Relative effect (95% CI) | No. of participants (studies) | Quality of the evidence (GRADE) | |
| Assumed risk | Corresponding risk | |||||
| Unstimulated IUI | IVF | |||||
| Live birth rate per woman randomised | IVF treatment may improve LBR compared with IUI without using fertility drugs. | 160 per 1000 | 320 per 1000 (185 to 494) | OR 2.47 (1.19 to 5.12) | 156 (2 studies) | ⊕⊕⊝⊝ Low 1,2,3 |
| Clinical pregnancy rate per woman randomised | There is not enough evidence to determine whether there is a difference in clinical pregnancy rate between IVF and IUI without using fertility drugs. | 121 per 1000 | 400 per 1000 (115 to 775) | OR 4.83 (0.94 to 24.95) | 43 (1 study) | ⊕⊝⊝⊝ Very low1,2,4 |
| Multiple pregnancy rate per woman randomised | There is not enough evidence to determine whether there is a difference in multiple pregnancy rate between IVF and IUI without using fertility drugs. | 30 per 1000 | 31 per 1000 (1 to 460) | OR 1.03 (0.04 to 27.29) | 43 (1 study) | ⊕⊝⊝⊝ Very low 1,2,4 |
| OHSS rate per woman randomised | No study reported this outcome. | |||||
| Miscarriage rate per woman randomised | There is not enough evidence to determine whether there is a difference in miscarriage rate between IVF and IUI without using fertility drugs. | 61 per 1000 | 100 per 1000 (9 to 578) | OR 1.72 (0.14 to 21.25) | 43 (1 study) | ⊕⊝⊝⊝ Very low 1,2,4 |
| *The basis for the assumed risk is the median control group risk across studies. The corresponding risk (and its 95% confidence interval) is based on the assumed risk in the comparison group and the relative effect of the intervention (and its 95% CI). CI: confidence interval; IUI: intrauterine insemination; IVF: in vitro fertilisation; OHSS: ovarian hyperstimulation syndrome; OR: odds ratio | ||||||
| GRADE Working Group grades of evidence High quality: Further research is very unlikely to change our confidence in the estimate of effect. Moderate quality: Further research is likely to have an important impact on our confidence in the estimate of effect and may change the estimate. Low quality: Further research is very likely to have an important impact on our confidence in the estimate of effect and is likely to change the estimate. Very low quality: We are very uncertain about the estimate. | ||||||
1Serious risk of bias: downgraded by one level. Unclear risk of performance bias. 2Serious imprecision: downgraded by one level. Very wide confidence interval. 3The statistical heterogeneity was moderate (60%), but the direction of effect was consistent, hence we did not downgrade for inconsistency. 4Serious indirectness: only one study reported the outcome.
Summary of findings 3. IVF versus IUI + ovarian stimulation with gonadotropins or CC for unexplained subfertility.
| IVF versus IUI + ovarian stimulation with gonadotropins or CC for unexplained subfertility | |||||||
| Patient or population: women with unexplained subfertility Setting: fertility clinic Intervention: IVF Comparison: IUI + ovarian stimulation with gonadotropins or CC | |||||||
| Outcomes | Plain language summary | Illustrative comparative risks* (95% CI) | Relative effect (95% CI) | No. of participants (studies) | Quality of the evidence (GRADE) | ||
| Assumed risk | Corresponding risk | ||||||
| IUI + ovarian stimulation with gonadotropins or CC | IVF | ||||||
| Live birth rate per woman randomised | Treatment‐naive women: IVF vs IUI + gonadotropins | In treatment‐naive women, there may be little or no difference in live birth rate between IVF and IUI using injectable fertility drugs. | 423 per 1000 | 466 per 1000 (390 to 542) | OR 1.19 (0.87 to 1.61) | 731 (3 studies) | ⊕⊕⊝⊝ Low 1,2 |
| Treatment‐naive women: IVF vs IUI + gonadotropins (1 IVF to 1 IUI cycle) | In treatment‐naive women, there may be little or no difference in live birth rate between 1 cycle of IVF and 1 cycle of IUI using injectable fertility drugs. | 261 per 1000 | 366 per 1000 (243 to 508) |
OR 1.63 (0.91 to 2.92) |
221 (2 studies) |
⊕⊕⊝⊝ Low 1,2 | |
| Pretreated women: IVF vs IUI + gonadotropins | In women pretreated with oral fertility drugs, IVF may improve live birth rate compared to IUI using injectable fertility drugs. | 219 per 1000 | 522 per 1000 (394 to 648) | OR 3.9 (2.32 to 6.57) | 280 (1 study) | ⊕⊕⊝⊝ Low2,3 | |
| Treatment‐naive women: IVF vs IUI + CC | In treatment‐naive women, there may be little or no difference in live birth rate between IVF and IUI using oral fertility drugs. | 154 per 1000 | 313 per 1000 (149 to 544) | OR 2.51 (0.96 to 6.55) | 103 (1 study) | ⊕⊕⊝⊝ Low 2,3 | |
| Clinical pregnancy rate per woman randomised | Treatment‐naive women: IVF vs IUI + gonadotropins | In treatment‐naive women, there may be little or no difference in clinical pregnancy rate between IVF and IUI using injectable fertility drugs. | 481 per 1000 | 520 per 1000 (441 to 596) | OR 1.17 (0.85 to 1.59) | 731 (3 studies) | ⊕⊕⊝⊝ Low 1,2, |
| Treatment‐naive women: IVF vs IUI + gonadotropins (1 IVF to 1 IUI cycle) | In treatment‐naive women, there may be little or no difference in clinical pregnancy rate between 1 cycle of IVF and 1 cycle of IUI using injectable fertility drugs. | 173 per 1000 |
490 per 1000 (280 to 704) |
OR 4.59 (1.86 to 11.35) |
103 (1 study) |
⊕⊕⊝⊝ Low 2,3 | |
| Pretreated women: IVF vs IUI + gonadotropins | In women pretreated with oral fertility drugs, IVF may improve clinical pregnancy rate compared to IUI using injectable fertility drugs. | 296 per 1000 | 856 per 1000 (761 to 917) | OR 14.13 (7.57 to 26.38) | 280 (1 study) | ⊕⊕⊝⊝ Low 2,3 | |
| Treatment‐naive women: IVF vs IUI + CC | In treatment‐naive women, there may be little or no difference in clinical pregnancy rate between IVF and IUI using oral fertility drugs. | 212 per 1000 | 490 per 1000 (288 to 695) | OR 3.58 (1.51 to 8.49) | 103 (1 study) | ⊕⊕⊝⊝ Low 2,3 | |
| Multiple pregnancy rate per woman randomised | Treatment‐naive women: IUI + gonadotropins | In treatment‐naive women, there may be little or no difference in multiple pregnancy rate between IVF and IUI using injectable fertility drugs. | 40 per 1000 | 33 per 1000 (16 to 69) | OR 0.82 (0.38 to 1.77) | 731 (3 studies) | ⊕⊕⊝⊝ Low 1,2 |
| Treatment‐naive women: IVF vs IUI + gonadotropins (1 IVF to 1 IUI cycle) | In treatment‐naive women, there may be little or no difference in multiple pregnancy rate between 1 cycle of IVF and 1 cycle of IUI using injectable fertility drugs. | 180 per 1000 | 143 per 1000 (73 to 258) | OR 0.76 (0.36 to 1.58) | 221 (2 studies) |
⊕⊕⊝⊝ Low 1,2 |
|
| Treatment‐naive women: IUI + CC | In treatment‐naive women, there may be little or no difference in multiple pregnancy rate between IVF and IUI using oral fertility drugs. | 118 per 1000 | 79 per 1000 (22 to 243) | OR 0.64 (0.17 to 2.41) | 102 (1 study) | ⊕⊕⊝⊝ Low 2,3 | |
| OHSS rate per woman randomised | Treatment‐naive women: IVF vs IUI + gonadotropins | In treatment‐naive women, it is unclear whether there is a difference in OHSS rate between IVF and IUI using injectable fertility drugs. | 0 per 1000 | 0 per 1000 (0 to 0) | OR 6.86 (0.35 to 134.59) | 207 (1 study) | ⊕⊝⊝⊝ Very low 1,2,3 |
| Treatment‐naive women: IVF vs IUI + gonadotropins (1 IVF to 1 IUI cycle) | In treatment‐naive women, there may be little or no difference in OHSS rate between 1 cycle of IVF and 1 cycle of IUI using injectable fertility drugs. | 45 per 1000 |
54 per 1000 (17 to 164) |
OR 1.22 (0.36 to 4.16) |
221 (2 studies) |
⊕⊕⊝⊝ Low 1,2 |
|
| Treatment‐naive women: IVF vs IUI + CC | In treatment‐naive women, there may be little or no difference in OHSS rate between IVF and IUI using oral fertility drugs. | 39 per 1000 | 59 per 1000 (10 to 281) | OR 1.53 (0.24 to 9.57) | 102 (1 study) | ⊕⊕⊝⊝ Low 2,3 | |
| Miscarriage rate per woman randomised | Treatment‐naive women: IUI + gonadotropins | In treatment‐naive women, it is unclear whether there is a difference in miscarriage rate between IVF and IUI using injectable fertility drugs. | 30 per 1000 | 9 per 1000 (1 to 85) | OR 0.31 (0.03 to 3.04) | 207 (1 study) | ⊕⊝⊝⊝ Very low 1,2,3 |
| Treatment‐naive women: IVF vs IUI + gonadotropins (1 IVF to 1 IUI cycle) | In treatment‐naive women, there may be little or no difference in miscarriage rate between 1 cycle of IVF and 1 cycle of IUI using injectable fertility drugs. | 192 per 1000 |
216 per 1000 (95 to 418) |
OR 1.16 (0.44 to 3.02) |
103 (1 study) |
⊕⊕⊝⊝ Low2,3 | |
| Treatment‐naive women: IUI + CC | In treatment‐naive women, there may be little or no difference in miscarriage rate between IVF and IUI using oral fertility drugs. | 157 per 1000 | 216 per 1000 (91 to 430) | OR 1.48 (0.54 to 4.05) | 102 (1 study) | ⊕⊕⊝⊝ Low2,3 | |
| *The basis for the assumed risk (e.g. the median control group risk across studies) is provided in footnotes. The corresponding risk (and its 95% confidence interval) is based on the assumed risk in the comparison group and the relative effect of the intervention (and its 95% CI). CC: clomiphene citrate; CI: confidence interval; IUI: intrauterine insemination; IVF: in vitro fertilisation; OHSS: ovarian hyperstimulation syndrome; OR: odds ratio | |||||||
| GRADE Working Group grades of evidence High quality: Further research is very unlikely to change our confidence in the estimate of effect. Moderate quality: Further research is likely to have an important impact on our confidence in the estimate of effect and may change the estimate. Low quality: Further research is very likely to have an important impact on our confidence in the estimate of effect and is likely to change the estimate. Very low quality: We are very uncertain about the estimate. | |||||||
1Serious risk of bias: downgraded by one level. Unclear risk of performance bias alone or with other bias. 2Serious imprecision: downgraded by one level. Wide confidence interval. 3Serious indirectness: downgraded by one level. Single study.
Background
Description of the condition
Subfertility is said to be unexplained in couples with apparently normal ovarian function, fallopian tubes, uterus, cervix, and pelvis and with adequate coital frequency; and apparently normal testicular function, genito‐urinary anatomy, and a normal ejaculate. The potential for this diagnosis is dependent upon the methodologies used or those methodologies available, or both (Zegers‐Hochschild 2017). The prevalence of unexplained infertility among couples attending a fertility clinic has been shown to be 21% among women younger than 35 years of age and 26% in women older than 35 years (Maheshwari 2008). In the absence of a known cause for subfertility, treatment options have included expectant management, unstimulated intrauterine insemination (IUI), IUI with ovarian stimulation using clomiphene citrate (CC), letrozole, or gonadotropins, and in vitro fertilisation (IVF). IVF is expected to overcome any subtle biological problems that could affect conception. However, it is invasive and is associated with risks such as ovarian hyperstimulation syndrome (OHSS).
NICE 2013 recommends offering IVF to women with unexplained subfertility who have not conceived after two years of regular unprotected sexual intercourse. In the UK, estimated live birth rates (LBRs) per embryo transferred for all indications of IVF vary between 32% in women younger than 35 years and 5% in women aged 43 years or over (HFEA 2019), with an overall LBR of 24% per embryo transferred (HFEA 2019). The European IVF‐Monitoring Consortium (EIM) for the European Society of Human Reproduction and Embryology (ESHRE), which generates results from registries of several European countries, reported LBRs per oocyte aspiration ranging between 14.4% and 30.5% (De Geyter 2018). The Society for Assisted Reproductive Technology National Summary Report for 2020 reported that 39.9% of cycles following oocyte retrieval resulted in a live birth following the first embryo transfer in women younger than 35 years (SART 2020).
The chance that pregnancy will lead to live birth is influenced by the prognostic profile of a couple such as female age, duration of infertility, and previous pregnancy (Collins 1995). Treatments such as IVF are thought to be more effective than expectant management for couples with limited chances of natural conception, but less so in couples with good prospects of natural conception.
Description of the intervention
In vitro fertilisation involves using standard protocols for ovarian stimulation (OS), oocyte retrieval under ultrasound guidance, insemination of sperm, embryo culture, and replacement of embryos into the uterus at cleavage or blastocyst stage. Standard OS for IVF involves several steps: of pituitary suppression with gonadotropin‐releasing hormone (GnRH) agonist or antagonist; OS using individualised gonadotropin dose based on predictive factors; and final oocyte maturation trigger (NICE 2013). IVF is invasive and is associated with several potential complications. The multiple pregnancy rate (MPR) (including twins and triplets) associated with IVF was 6% in the UK in 2019 (HFEA 2019). In 2014, the EIM reported the risk of having twins following IVF and intracytoplasmic sperm injection (ICSI) as 17%, and that of having triplets as 0.5% (De Geyter 2018). Twin and triplet rates following IVF in women under 35 years were reported to be 9.9% and 0.2% in the 2018 SART report (SART 2020). The incidence of OHSS in stimulated IVF cycles in Europe was reported to be 0.3% in 2014 (De Geyter 2018). OHSS can present with different grades of severity (mild, moderate, severe). The intravascular depletion associated with OHSS can lead to dehydration, hypovolaemia, electrolyte disturbances, and thrombosis due to haemoconcentration.
Other treatments that have been used in unexplained subfertility include IUI with or without OS and expectant management (spontaneous pregnancy).
IUI, with or without concomitant CC, letrozole, or gonadotropins, is a widely used treatment for unexplained infertility (Danhof 2020). By bypassing the cervical barrier and increasing the number of motile spermatozoa that reach the uterus and tubes, thereby bringing the sperm in close proximity to one or more eggs, IUI can improve fertilisation and could increase LBRs.
Unstimulated intrauterine insemination
In a spontaneous cycle, single or dual IUI is normally performed 20 to 30 hours after an endogenous luteinising hormone (LH) surge is detected in the serum or urine. Women are asked to monitor urinary or serum LH levels daily from day 10 to day 12 of the treatment cycle. Normally, a maximum of 0.5 mL suspension of processed spermatozoa is introduced into the uterine cavity with a suitable catheter. Semen is prepared using a standard pure sperm preparation (a procedure used to prepare semen to isolate a population of sperm with a higher percentage of motile forms and with a more uniform morphology than those found in untreated ejaculates). The procedure involves processing fresh and liquefied ejaculates over a pure sperm gradient of 80/40, followed by centrifugation. Couples are advised to abstain from intercourse from the day of LH monitoring until the day of insemination.
Intrauterine insemination + ovarian stimulation
For OS + IUI cycles, gonadotropins or CC (anti‐oestrogen) or letrozole are used (Danhof 2020). The aim is to achieve ovulation from a maximum of two mature follicles. The enhanced fertility induced by OS can be attributed to the increased number of fertilisable oocytes, improved sperm selection, and assisted migration. The advantage of this approach is that some of the risks associated with IVF are avoided, particularly those related to oocyte retrieval. However, significant risks of OHSS and multiple pregnancy remain if gonadotropins are used concomitantly.
Intrauterine insemination + gonadotropins
When gonadotropins are used concomitantly with IUI, a baseline ultrasound scan is carried out between days 1 and 3 of the treatment cycle (Guzick 1999). A daily or alternate‐day dose of 75 international units of gonadotropins is started from day 3, and follicular tracking is carried out from around day 5 of stimulation. Subtle variations in clinical protocol would be found with different clinics. When one or two follicles reach 17 mm in maximum diameter, urinary or serum LH levels are estimated to rule out endogenous surge, a human chorionic gonadotropin (hCG) trigger injection is given, and the IUI is carried out 36 to 40 hours later. In the case of excessive response of more than two mature follicles, the cycle is cancelled to avoid risk of high‐order multiple pregnancies. Luteal support is generally not required.
Intrauterine insemination + CC
Clomiphene treatment involves oral administration of CC tablets at a dose of 50 mg to 250 mg daily for five days in the early follicular phase (usually from day 2 to day 6) of the cycle (Guzick 1999). Follicular tracking is carried out from day 10 to day 12 of the treatment cycle. Once a follicle reaches 17 to 18 mm in maximum diameter, urinary LH or serum LH levels are estimated to rule out endogenous LH surge, hCG trigger injection is given, and IUI is carried out 36 to 40 hours later.
Intrauterine insemination + letrozole
Letrozole (aromatase inhibitor) treatment involves oral administration of letrozole tablets at a dose of 2.5 mg to 5 mg daily for five days in the early follicular phase (usually from day 2 to day 6) of the cycle (Danhof 2020). Follicular tracking is carried out from day 8 to day 10 of the treatment cycle. Once a follicle reaches 17 to 18 mm in maximum diameter, an hCG trigger may or may not be given intramuscularly, and IUI is carried out 24 to 40 hours later.
Expectant management
In the absence of an identified cause, couples with unexplained subfertility have a relatively high chance of spontaneous pregnancy (Collins 1995; Lenton 1977; Snick 1997; Steures 2006; Steures 2008). A cumulative LBR of 33% at 36 months was estimated from a Canadian multicentre cohort study (Collins 1995). Following this report, Snick 1997 presented data from a primary care study in the Netherlands and suggested a cumulative LBR of 60% at 36 months.
In an RCT that compared expectant management with IUI plus OS in couples with unexplained subfertility (Steures 2006), of the 253 couples enrolled, 127 were assigned IUI plus OS and 126 expectant management. In the intervention group, 42 (33%) women conceived and 29 (23%) pregnancies were ongoing. In the expectant management group, 40 (32%) women conceived and 34 (27%) pregnancies were ongoing (risk ratio 0.85, 95% confidence interval (CI) 0.63 to 1.1). One twin pregnancy occurred in each study group, and one woman in the intervention group conceived triplets. This study concluded that a large beneficial effect of IUI plus OS can be excluded in couples with unexplained subfertility with an intermediate prognosis. Expectant management for six months was therefore justified in these couples and is an efficient way to prevent multiple pregnancies.
In a Scottish multicentre trial, 580 couples with unexplained subfertility, mild endometriosis, or mild male factor subfertility were randomly assigned to three arms: expectant management, CC, and IUI (Bhattacharya 2008). Live birth rates of 17% and 23% were observed after expectant management and IUI, respectively, and there was no significant difference (odds ratio (OR) 1.46, 95% CI 0.88 to 2.43). Clinical pregnancy rates were similar in the two groups (expectant group 17% versus 23% in the IUI group) (OR 1.41, 95% CI 0.73 to 2.74). This study suggested that 17 women would need to undergo IUI for one extra live birth to be achieved.
A Cochrane Review pooled data from two trials comparing CC with IUI and expectant management and showed no clinical benefit with CC and IUI (OR 2.40, 95% CI 0.70 to 8.19) (Hughes 2010).
How the intervention might work
IVF can potentially circumvent many of the putative causes of unexplained subfertility by bypassing several in vivo steps that may be responsible for lack of natural conception. These include ovarian dysfunction, cervical factors, problems with sperm and egg transport and processes leading to sperm‐egg fertilisation.
Why it is important to do this review
IVF is invasive and expensive and is associated with risks. This is an update of a Cochrane Review first published in 2002 and updated in 2005, 2011, and 2015. This review evaluates the current evidence comparing IVF with other, less invasive treatments, including expectant management for unexplained infertility. Comparisons within the review should assist couples and clinicians in choosing the best treatment for unexplained infertility. Current limitations in the literature and future areas of research are highlighted in the review.
Objectives
To evaluate the effectiveness and safety of IVF versus expectant management, unstimulated intrauterine insemination (IUI), and IUI with ovarian stimulation using gonadotropins, clomiphene citrate (CC), or letrozole in improving pregnancy outcomes.
Methods
Criteria for considering studies for this review
Types of studies
Published and unpublished randomised controlled trials (RCTs). We planned to include cross‐over trials if first‐phase results could be extracted. We excluded quasi‐randomised trials.
Types of participants
Couples with unexplained subfertility.
Couples with minimal endometriosis (American Fertility Society (AFS) criteria grade I) with subfertility or mild male factor subfertility who have been trying to conceive for one year or longer.
Types of interventions
The study had to include one or more comparisons of effectiveness.
In vitro fertilisation (IVF) versus expectant management.
IVF versus intrauterine insemination (IUI) alone.
IVF versus IUI plus ovarian stimulation with gonadotropins, clomiphene citrate, or letrozole.
Types of outcome measures
Primary outcomes
Live birth rate (LBR) per woman. Live birth is defined as the delivery of a live foetus after 22 completed weeks of gestation (Zegers‐Hochschild 2017). Twins and multiple births are reported as a single live birth event in accordance with Core Outcome Measures for Infertility Trials (COMMIT) (Duffy 2020). LBR per woman is defined as the number of live births for each randomly assigned woman over a particular period of time.
Secondary outcomes
Clinical pregnancy rate (CPR) per woman. We defined clinical pregnancy as demonstration of intrauterine pregnancy with foetal heart activity on an ultrasound scan, and clinical pregnancy rate per woman as the number of clinical pregnancies for each randomly assigned woman over a particular period of time.
Multiple pregnancy rate (MPR) per woman. We defined multiple pregnancy as demonstration of more than one sac with a foetal pole on ultrasound scan, and multiple pregnancy rate per woman as the number of multiple pregnancies for each randomly assigned woman over a particular period of time.
Incidence of ovarian hyperstimulation syndrome (OHSS) per woman.
Miscarriage rate per woman, defined as the number of miscarriages for each randomly assigned woman over a particular period of time.
Search methods for identification of studies
We performed the original search in July 2001, and completed updated searches in August 2004, May 2007, March 2010, July 2011, May 2015, and November 2021. The updated search was performed by Cochrane Gynaecology and Fertility Group Information Specialist Marian Showell and independently screened by two review authors (SKS and MSK).
Electronic searches
We searched the following electronic databases:
Cochrane Gynaecology and Fertility Group Specialised Register; searched 10 November 2021, ProCite platform (Appendix 1);
Cochrane Central Register of Controlled Trials (CENTRAL); searched 10 November 2021, Ovid platform (Appendix 2);
MEDLINE; searched from 1946 to 11 November 2021, Ovid platform (Appendix 3);
Embase; searched from 1980 to 11 November 2021, Ovid platform (Appendix 4);
PsycINFO; searched from 1806 to 11 November 2021, Ovid platform (Appendix 5);
CINAHL (Cumulative Index to Nursing and Allied Health Literature); searched from 1961 to 4 November 2019, EBSCO platform (Appendix 6).
Searching other resources
We searched the citation lists of relevant publications, review articles, and included studies. We also searched Evidence‐Based Medicine Reviews. We handsearched relevant conference proceedings and sent personal communications to experts and authors in the field.
Data collection and analysis
Selection of studies
Two review authors (SKS, MSK) scanned the titles and abstracts of articles retrieved by the search, removing those that were clearly irrelevant. We retrieved the full texts of all potentially eligible studies. Two review authors (SKS, MSK) independently examined the full‐text articles for compliance with the eligibility criteria and selected studies for inclusion in the review, and listed excluded studies along with their reasons for exclusion in a 'Characteristics of excluded studies' table. When required, SKS and MSK corresponded with study investigators to clarify study eligibility. Any disagreements between review authors regarding study eligibility were resolved by consensus or by discussion with a senior review author (SB).
Data extraction and management
We analysed the included trials for the quality criteria and methodological details outlined below. We presented this information in the 'Characteristics of included studies’ table, which provides a context for discussing the reliability of results.
Two review authors (SKS, MSK) independently assessed trial quality and extracted data, using forms designed in accordance with Cochrane guidelines. Any discrepancies were resolved by discussion with a senior review author (SB). We sought additional information on trial methodology or actual original data from the principal authors of trials that appeared to meet our eligibility criteria but were unclear in aspects of methodology, or when data were provided in a form that was unsuitable for meta‐analysis. We sent reminders to study authors if we received no reply four weeks after making the initial request.
Assessment of risk of bias in included studies
We assessed all included studies for risk of bias by using the Cochrane 'Risk of bias' assessment tool according to the criteria laid down in the Cochrane Handbook for Systematic Review of Interventions (Higgins 2011) to assess sequence generation; allocation concealment; blinding of participants, providers and outcome assessors; completeness of outcome data; selective outcome reporting; and other potential sources of bias (Higgins 2011). Two review authors (SKS, MSK) performed risk of bias assessment, resolving any disagreements by consensus or by discussion with a third review author (SB). We have presented our conclusions in risk of bias tables.
When identified studies failed to report the primary outcome of live birth but reported interim outcomes such as pregnancy rate, we informally assessed whether those studies reporting the primary outcome provided typical values for interim outcomes.
Measures of treatment effect
We used dichotomous data for primary and some secondary outcome measures in this review. We expressed results for each study as odds ratios with 95% confidence intervals and combined them for meta‐analysis using Review Manager 5 software, employing a Mantel‐Haenszel fixed‐effect model (Review Manager 2020).
When outcome data were reported as a percentage of the total number of participants, we included this information in the analyses by multiplying the percentage number by the total number of participants (n) in that group and dividing by 100.
We considered live birth as a positive consequence of treatment. We considered miscarriage, MPRs, and OHSS as negative consequences, with higher numbers as detrimental. We considered this when designing and viewing summary graphs. An increase in the odds of a beneficial outcome is displayed to the right, and of a detrimental outcome is displayed to the left.
Unit of analysis issues
We performed the primary analysis per woman randomly assigned. When possible, we extracted per‐woman data from trials that reported data per cycle.
We counted multiple live births (e.g. twins, triplets) as one live birth event.
Dealing with missing data
We analysed data on an intention‐to‐treat basis to the greatest degree possible and attempted to obtain missing data from the original investigators. When we could not access missing data after attempting to contact the primary authors, we used the available data.
Assessment of heterogeneity
We considered whether clinical and methodological characteristics of the included studies were sufficiently similar for meta‐analysis to provide a meaningful summary. Even when trials included in a comparison group were statistically homogeneous, we noted potentially large differences in clinical features (clinical heterogeneity). We took these differences into account when analysing and interpreting pooled results. Clinical heterogeneity in subfertility (such as variation in entry criteria and subtle differences in treatments used, which are important from a clinical perspective) cannot be avoided because most centres use their own protocols, which can vary in different aspects. When trials met the inclusion criteria and investigators had provided the same intervention, we considered it appropriate to pool their results. We assessed statistical heterogeneity by inspecting scatter in the data points and overlap in the confidence intervals and, more formally, by checking results of the Chi2 test and measuring the I2 statistic. We considered an I2 value greater than 50% as indicative of substantial heterogeneity (Higgins 2023). If we detected substantial heterogeneity, we explored possible explanations by performing sensitivity analyses.
Assessment of reporting biases
In view of the difficulty involved in detecting and correcting for publication bias and other reporting biases, we aimed to minimise their potential impact by ensuring a comprehensive search for eligible studies and by staying alert for duplication of data. We planned that if there were 10 or more studies in an analysis, we would construct a funnel plot to assess the possibility of small‐study effects (whereby smaller studies tend to exaggerate the effects estimates of interventions).
Data synthesis
We combined data from primary studies using the fixed‐effect model (Deeks 2001; DerSimonian 1986), for the following comparisons.
IVF versus expectant management.
IVF versus unstimulated IUI.
IVF versus IUI + ovarian stimulation with gonadotropins or IUI + CC or IUI + letrozole.
We graphically displayed an increase in the odds of a particular outcome that may be beneficial (e.g. live birth) or detrimental (e.g. multiple pregnancy) in meta‐analyses to the right of the centre line, and we showed a decrease in the odds of an outcome to the left of the centre line.
We combined results for each study for meta‐analysis with Review Manager 5 software using the Peto‐modified Mantel‐Haenszel method (Review Manager 2020).
Subgroup analysis and investigation of heterogeneity
We planned a subgroup analysis to investigate heterogeneity based on treatment‐naive women versus women with pretreatment.
Sensitivity analysis
We performed sensitivity analysis for the primary outcome to determine whether the conclusions of the review would have differed if:
eligibility were restricted to studies without high or unclear risk of bias for any domain;
a random‐effects model was used instead of a fixed‐effect model;
the summary effect was measured using risk ratio instead of odds ratio.
Summary of findings and assessment of the certainty of the evidence
Two review authors (SKS, MSK) independently performed GRADE assessments. We prepared summary of findings tables to evaluate the overall quality of the body of evidence for the main review outcomes (live birth, clinical pregnancy, multiple pregnancy, miscarriage, OHSS) for the review comparisons IVF versus expectant management, IVF versus unstimulated IUI, and IVF versus IUI plus ovarian stimulation. We used the GRADE criteria (study limitations (i.e. risk of bias), consistency of effect, imprecision, indirectness, and publication bias) (GRADEpro GDT). We justified, documented, and incorporated into the reporting of results judgements about evidence quality (high, moderate, low, or very low) for each outcome.
Results
Description of studies
Results of the search
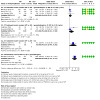
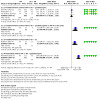
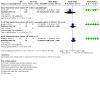
Our searches identified 1628 articles, of which we excluded 1621 articles based on title and abstract. We retrieved the full texts for seven records, of which we excluded five records. One new trial was eligible for inclusion in this update (Nandi 2017). We also identified one ongoing trial (Prentice 2020). We included a total of nine trials in this updated review (Bensdorp 2015; Elzeiny 2014; Goldman 2014; Goverde 2000; Hughes 2004; Nandi 2017; Reindollar 2010; Soliman 1993; van Rumste 2014), comprising one new study and eight studies from the previous version of the review (Figure 1). One study, van Rumste 2014, is a follow‐up of Custers 2011 and van Rumste 2009, which were included in the previous update of this review as two separate studies.
1.
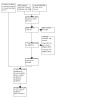
Study flow diagram.
We sought additional information from study authors when relevant, and received a response from two authors, Goldman 2014; van Rumste 2014, at the time of the previous update that were also relevant to this update. A flowchart for the review search results is shown in Figure 1. As relatively few studies were available for analysis, we could not use a funnel plot to explore the possibility of small‐study effects (a tendency for estimates of the intervention effect to be more beneficial in smaller studies) in comparisons 1 and 2. We did not perform subgroup analyses for mild endometriosis as planned because most studies did not identify such subgroups. Sensitivity analysis to determine whether conclusions of the review would have differed if eligibility was restricted to studies without high risk of bias was not required, as we found no significant differences in risk of bias among included trials.
Included studies
We included nine trials in this review (Bensdorp 2015; Elzeiny 2014; Goldman 2014; Goverde 2000; Hughes 2004; Nandi 2017; Reindollar 2010; Soliman 1993; van Rumste 2014).
Trial design characteristics
Design
The nine included studies were randomised parallel‐group trials.
Interventions
Two studies compared IVF with expectant management (Hughes 2004; Soliman 1993). The duration of expectant management was three months in Hughes 2004 and six months in Soliman 1993.
Two studies compared IVF with IUI alone (Elzeiny 2014; Goverde 2000). Goverde 2000 compared the effectiveness of IVF (six cycles) versus unstimulated IUI (six cycles). Elzeiny 2014 compared the effectiveness of one cycle of IVF versus one cycle of unstimulated IUI.
Six studies compared IVF with IUI plus ovarian stimulation with gonadotropins (Bensdorp 2015; Goldman 2014; Goverde 2000; Nandi 2017; Reindollar 2010; van Rumste 2014). The studies varied in the number of IUI cycles or IVF cycles and the definition of one IVF cycle. One study included fresh and frozen embryo transfers from one IVF cycle (Bensdorp 2015), while the remaining five studies did not include frozen embryo transfers.
One study analysed IUI + CC and IUI + follicle‐stimulating hormone separately (Goldman 2014). Both arms of Reindollar 2010 received IUI + CC before going on to IUI + gonadotropins or IVF. No studies compared IVF with IUI + letrozole.
Multicentre trials
Five trials were multicentre studies (Bensdorp 2015; Goldman 2014; Hughes 2004; Reindollar 2010; van Rumste 2014).
Statistical analysis
Two studies used the Chi2 test for the analysis of discrete data on the characteristics of participants and cycles and the Student's t‐test to analyse continuous data (Goverde 2000; Soliman 1993). One study used Fisher's exact test and calculated confidence intervals (CIs) using the Mantel‐Haenszel method (Hughes 2004). Another study used Fisher's exact test and exact binomial 95% CIs (Reindollar 2010). One study expressed results as risk ratios (RRs) and 95% CIs (Bensdorp 2015). One study used one‐tailed P Fisher's exact tests to compare categorical variables between study groups and represented continuous data as means ± standard deviations, analysing them using Student's t‐test (Elzeiny 2014). Another study stated that exact binomial 97.5% CIs were calculated (Goldman 2014). One study used rate ratios for ongoing pregnancy with corresponding 95% CIs. A formal test of differences in pregnancy rates was performed using Chi2 test statistics (van Rumste 2014). One study used the independent t‐test for the comparison of normally distributed baseline characteristics, the Mann‐Whitney U test for not normally distributed baseline characteristics and reported results as risk difference, RR and 95% CIs (Nandi 2017).
Financial support or sponsorship
Four trials stated funding details. Soliman 1993 was funded by Provincial Health Insurance, Ontario, Canada. Reindollar 2010 was supported by a grant from the National Institutes of Health, Rockville, Maryland, USA. Elzeiny 2014 was financially supported by Serono (Geneva, Switzerland) and Melbourne IVF (Melbourne, Australia). Bensdorp 2015 was supported by a grant from the Netherlands Organisation for Health Research and Development (ZonMw) and a grant from Zorgverzekeraars Nederland, the Dutch association of health care insurers.
One study reported receiving no funding; all study participants were eligible for and received funding from the National Health Service (NHS) for the IUI or IVF treatment cycles (Nandi 2017). This study was terminated prematurely, as the NHS stopped funding IUI treatment for unexplained infertility before the trial was completed.
Baseline characteristics of participants
All studies included couples with unexplained infertility in whom baseline infertility investigations were normal, but the inclusion criteria varied among studies.
Studies included women aged between 21 and 39 years (Reindollar 2010), 18 and 42 years (Elzeiny 2014), 18 and 38 years (Bensdorp 2015), 38 and 42 years (Goldman 2014), and 23 and 37 years (Nandi 2017). Two other studies did not mention female age for inclusion (Goverde 2000; van Rumste 2014). In one trial, women were included if the duration of infertility was three years (Goverde 2000). In another trial, a minimum duration of infertility of two years was an inclusion criterion (Hughes 2004). Four studies reported an inclusion criterion of infertility for at least one year (Elzeiny 2014; Nandi 2017; Reindollar 2010; Soliman 1993). One study included couples who had a poor prospect of pregnancy, defined as a chance of natural conception within 12 months below 30% (Custers 2011). One study that included only women between 38 and 42 years of age had an eligibility criterion of six months of attempted conception (Goldman 2014). Four studies included couples with mild male factor infertility (Bensdorp 2015; Goverde 2000; Reindollar 2010; van Rumste 2014), and another study included couples with endometriosis American Fertility Society (AFS) stage I (Goverde 2000).
Regarding the two studies of expectant management, Soliman 1993 included 245 women less than 40 years of age with varied diagnoses for subfertility and a mean duration of subfertility of 65 months. This study included 35 women with unexplained infertility, who are included in this review. The other 210 women were not included in analysis. Hughes 2004 included women between 18 and 39 years of age with a mean duration of subfertility of 56 months. Most women in this study had unexplained or male factor infertility, and all had patent fallopian tubes. Women in both of these studies had exhausted other treatment options.
Outcomes studied
Primary outcome
Live birth rate (LBR) per woman: seven trials reported LBR per woman or couple as an outcome (Bensdorp 2015; Elzeiny 2014; Goldman 2014; Goverde 2000; Hughes 2004; Nandi 2017; Reindollar 2010).
Secondary outcomes
Clinical pregnancy rate (CPR) per woman: nine trials reported CPR per woman as an endpoint (Bensdorp 2015; Elzeiny 2014; Goldman 2014; Goverde 2000; Hughes 2004; Nandi 2017; Reindollar 2010; Soliman 1993; van Rumste 2014).
Multiple pregnancy rate (MPR) per woman: six studies determined MPR per woman (Bensdorp 2015; Elzeiny 2014; Goldman 2014; Goverde 2000; Nandi 2017; van Rumste 2014).
Ovarian hyperstimulation syndrome (OHSS): three studies reported incidence of OHSS as an outcome (Goldman 2014; Goverde 2000; Nandi 2017).
Miscarriage rate per woman: three studies reported incidence of OHSS as an outcome (Elzeiny 2014; Goldman 2014; Nandi 2017)
Excluded studies
See Characteristics of excluded studies.
We excluded eight studies after full‐text review (Crosignani 1991; Custers 2012; Jarrell 1993; Karande 1998; Leeton 1987; Raneiri 1995; Tanbo 1990; Zayed 1997). Two studies did not perform diagnostic stratification before analysis (Jarrell 1993; Karande 1998). One study was a quasi‐randomised trial (Leeton 1987), another study allocated women by pseudo‐randomisation (Zayed 1997), and a third study did not include an IVF arm (Custers 2012). We excluded three studies included in an earlier version of the review: one because valid pregnancy and LBR data could not be extracted (Crosignani 1991), and two because they compared IVF with gamete intrafallopian transfer (Raneiri 1995; Tanbo 1990), which was not a comparison of interest for this update.
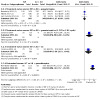
Risk of bias in included studies
See Characteristics of included studies; Figure 2; Figure 3.
2.
Methodological quality graph: review authors' judgements about each methodological quality item presented as percentages across all included studies.
3.
Methodological quality summary: review authors' judgements about each methodological quality item for each included study.
Allocation
Random sequence generation
All nine studies were at low risk of bias for sequence generation.
Of the nine included studies, three used computer‐generated randomisation (Elzeiny 2014; Goverde 2000; Nandi 2017). Soliman 1993 used a computer‐generated random numbers table. Bensdorp 2015 used an online randomisation program with biased coin minimisation stratified for study centre. Hughes 2004 did not mention the exact method of random sequence generation; however, we categorised it as low risk of bias for random sequence generation as the available information indicated that randomisation sequence was generated. Reindollar 2010 performed randomisation using permuted blocks of varying sizes, stratified by the woman's age (< 35 versus ≥ 35 years), laparoscopy within the past year (yes or no), and study site (Boston IVF or Harvard Vanguard Medical Associates). Goldman 2014 performed randomisation using permuted blocks of varying sizes, which were stratified by the woman's age (38th to 41st versus 42nd to 43rd birthday). van Rumste 2014 used central internet‐based randomisation, which was stratified for centre.
Allocation concealment
Seven studies were at low risk of bias and two studies were at unclear risk of bias for allocation concealment. Four studies used sealed envelopes (Elzeiny 2014; Goverde 2000; Hughes 2004; Nandi 2017). Two studies did not state concealment of allocation (Soliman 1993; van Rumste 2014). Allocation concealment was unclear in one study (Reindollar 2010). One study stated that the allocation sequence was generated by an independent biostatistician and was implemented by an epidemiologist (Goldman 2014). Another study stated that a unique number with allocation code was generated by a Web‐based program after participant initials and date of birth had been entered. Neither recruiters not the trial project group could access the randomisation sequence (Bensdorp 2015).
Blinding
Two studies were at low risk of bias and seven studies were at unclear risk of bias for blinding. Blinding of participants and clinicians was not possible due to the nature of the interventions. However, one study stated that investigators were blinded to all outcome determinations (Reindollar 2010), and another study stated that all clinical investigators were blinded to outcome determinations (Goldman 2014). It seems unlikely that blinding would affect the outcomes measured in this review.
Incomplete outcome data
Seven studies were at low risk and two studies was at high risk of attrition bias.
Six trials performed intention‐to‐treat analysis (Bensdorp 2015; Goldman 2014; Goverde 2000; Hughes 2004; Nandi 2017; Reindollar 2010). Seven trials reported the numbers of withdrawals and dropouts (Bensdorp 2015; Goverde 2000; Hughes 2004; Nandi 2017; Reindollar 2010; Soliman 1993; van Rumste 2014). Two studies mentioned the number of women excluded after randomisation but did not perform an intention‐to‐treat analysis (Elzeiny 2014; Soliman 1993). We contacted study authors for clarification when data were either incomplete or not clearly reported in the paper (Reindollar 2010; van Rumste 2014).
Selective reporting
To avoid selective reporting and reporting bias, we performed a comprehensive search for eligible studies and ensured that no data were duplicated.
Eight studies were at low risk of reporting bias, and one study was at unclear risk of reporting bias (Soliman 1993). There was no evidence to suggest that the decision to publish or failure to publish any specific outcomes by authors of the included studies was based on perceived statistical significance.
Other potential sources of bias
Seven studies were at low risk, one was at unclear risk (Nandi 2017), and one was at high risk of other bias (Soliman 1993). Eight studies included a priori power calculations in their reports (Bensdorp 2015; Elzeiny 2014; Goldman 2014; Goverde 2000; Hughes 2004; Nandi 2017; Reindollar 2010; Soliman 1993); one study was terminated prematurely before the sample size was reached due to public funding restrictions for treatment cycles (Nandi 2017).
Effects of interventions
See: Table 1; Table 2; Table 3
1. IVF versus expectant management
Two trials evaluated this comparison (Hughes 2004; Soliman 1993).
Primary outcome
1.1 Live birth rate (LBR)
Only one trial reported LBR per woman with a single cycle of IVF (Hughes 2004). We are uncertain whether a single cycle of IVF improves LBR compared to three months of expectant management (odds ratio (OR) 22.0, 95% CI 2.56 to 189.37; 51 women) (Analysis 1.1). We assessed the quality of evidence as very low (Table 1). If we assume 4% LBR with expectant management, LBR with IVF would be between 8.8% and 9%.
1.1. Analysis.
Comparison 1: IVF versus expectant management, Outcome 1: Live birth rate per woman
Secondary outcomes
1.2 Clinical pregnancy rate (CPR)
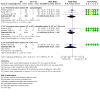
Two trials reported CPR (Hughes 2004; Soliman 1993). We are uncertain whether a single cycle of IVF improves CPR compared to three to six months of expectant management (OR 3.24, 95% CI 1.07 to 9.80; 2 RCTs; 86 women; I2 = 80%) (Analysis 1.2; Figure 4). We assessed the quality of evidence as very low (Table 1). Heterogeneity was high, as the studies had differing directions of effect. Following random‐effects analysis, there was no evidence of a difference in CPR between IVF and expectant management (OR 1.83, 95% CI 0.07 to 45.17; 2 RCTs; 86 women; I2 = 80%). If we assume 12% CPR with expectant management, CPR with IVF would be between 13% and 58%.
1.2. Analysis.
Comparison 1: IVF versus expectant management, Outcome 2: Clinical pregnancy rate per woman
4.
Forest plot of comparison: 1 IVF versus expectant management, outcome: 1.2 Clinical pregnancy rate per woman randomised.
No studies reported multiple pregnancy rate, incidence of ovarian hyperstimulation syndrome, or miscarriage rate for this comparison.
2. IVF versus unstimulated IUI
Two trials evaluated this comparison. One trial compared the effectiveness of IVF (six cycles) versus unstimulated IUI (six cycles) (Goverde 2000). The second trial compared the effectiveness of one cycle of IVF versus one cycle of unstimulated IUI (Elzeiny 2014).
Primary outcome
2.1 Live birth rate (LBR)
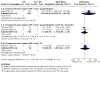
IVF may improve LBR compared to unstimulated IUI (OR 2.47, 95% CI 1.19 to 5.12; 2 RCTs; 156 women; I2 = 60%; low‐quality evidence) (Analysis 2.1; Figure 5). We assessed the quality of evidence as very low (Table 2). Following random‐effects analysis, there was no evidence of a difference in LBR between IVF and IUI (OR 3.56, 95% CI 0.74 to 16.99; 2 RCTs; 156 women; I2 = 60%). If we assume LBR 16% with unstimulated IUI, LBR with IVF would be between 18.5% and 49%.
2.1. Analysis.
Comparison 2: IVF versus unstimulated IUI, Outcome 1: Live birth rate per woman
5.

Forest plot of comparison: 2 IVF versus unstimulated IUI, outcome: 2.1 Live birth rate per woman randomised.
Secondary outcomes
2.2 Clinical pregnancy rate (CPR)
We are uncertain whether IVF improves CPR compared to unstimulated IUI (OR 4.83, 95% CI 0.94 to 24.95; 1 RCT; 43 women) (Analysis 2.2). We assessed the quality of evidence as very low (Table 2). If we assume CPR 12% with unstimulated IUI, CPR with IVF would be between 11.5% and 77.5%.
2.2. Analysis.
Comparison 2: IVF versus unstimulated IUI, Outcome 2: Clinical pregnancy rate per woman
2.3 Multiple pregnancy rate (MPR)
We are uncertain if there is a difference in MPR between IVF and unstimulated IUI (OR 1.03, 95% CI 0.04 to 27.29; 1 RCT; 43 women) (Analysis 2.3). We assessed the quality of evidence as very low (Table 2). If we assume 3% MPR with unstimulated IUI, MPR with IVF would be between 0.1% and 46%.
2.3. Analysis.
Comparison 2: IVF versus unstimulated IUI, Outcome 3: Multiple pregnancy rate per woman
2.4 Miscarriage rate
We are uncertain whether IVF increases miscarriage rate compared to unstimulated IUI (OR 1.72, 95% CI 0.14 to 21.25; 1 RCT; 43 women) (Analysis 2.4). We assessed the quality of evidence as very low. If we assume 6% miscarriage rate with unstimulated IUI, miscarriage rate with IVF would be between 0.9% and 58%.
2.4. Analysis.
Comparison 2: IVF versus unstimulated IUI, Outcome 4: Miscarriage rate
No studies reported incidence of ovarian hyperstimulation syndrome for this comparison.
3. IVF versus IUI + ovarian stimulation with gonadotropins (IUI + gonadotropins) or clomiphene citrate (IUI + CC)
Six trials compared the effectiveness of IVF versus IUI + gonadotropins (Bensdorp 2015; Goldman 2014; Goverde 2000; Nandi 2017; Reindollar 2010; van Rumste 2014). We performed stratified analysis based on pretreatment status and type of treatment.
Goverde 2000 compared the effectiveness of a maximum of six cycles of IUI after mild ovarian stimulation with gonadotropins versus IVF.
Reindollar 2010 compared three cycles of IUI + gonadotropins versus six cycles of IVF in women pretreated with CC + IUI.
Goldman 2014 compared two cycles of CC + IUI versus one cycle of IVF, and two cycles of recombinant follicle‐stimulating hormone + IUI versus one cycle of IVF.
van Rumste 2014 compared three cycles of IUI + gonadotropins versus one cycle of IVF.
Bensdorp 2015 compared three cycles of single‐embryo transfer IVF (plus subsequent cryo cycles) versus six cycles of IUI + gonadotropins.
Nandi 2017 compared three cycles of IUI + gonadotropins versus one cycle of IVF.
Primary outcome
3.1 Live birth rate (LBR)
Six studies reported LBR (Bensdorp 2015; Goldman 2014; Goverde 2000; Nandi 2017; Reindollar 2010; van Rumste 2014). These studies were stratified by pretreatment status, pretreated or treatment‐naive, and type of treatment, that is treatment‐naive women who underwent IVF versus IUI + gonadotropins (Bensdorp 2015; Goldman 2014; Goverde 2000; Nandi 2017; van Rumste 2014); treatment‐naive women who underwent IVF versus IUI + CC (Goldman 2014); or women who were previously treated and underwent IVF versus IUI + gonadotropins (Reindollar 2010).
IVF versus IUI + gonadotropins
Among treatment‐naive women, there may be little or no difference in LBR between IVF and IUI + gonadotropins (1 IVF to 2 to 3 IUI cycles) (OR 1.19, 95% CI 0.87 to 1.61; 3 RCTs; 731 women; I2 = 0%; low‐quality evidence) and where one cycle of IVF was compared to one IUI cycle (OR 1.63, 95% CI 0.91 to 2.92; 2 RCTs; 221 women; I2 = 54%; low‐quality evidence) (Table 3). Assuming 42% LBR with IUI + gonadotropins (in 1 IVF to 2 to 3 IUI cycles), LBR would be between 39% and 54% with IVF; assuming 26% LBR with IUI + gonadotropins (in 1 IVF to 1 IUI cycle), LBR would be between 24% and 51% with IVF.
In pretreated women, IVF may improve LBR compared with IUI + gonadotropins (OR 3.90, 95% CI 2.32 to 6.57; 1 RCT; 280 women; low‐quality evidence) (Analysis 3.1; Figure 6). In women pretreated with IUI + CC, assuming 22% LBR with IUI + gonadotropins, LBR would be between 39% and 65% with IVF.
3.1. Analysis.

Comparison 3: IVF versus IUI + ovarian stimulation with gonadotropins or CC, Outcome 1: Live birth rate per woman
6.
Forest plot of comparison: 3 IVF versus IUI + ovarian stimulation with gonadotropins or CC, outcome: 3.1 Live birth rate per woman randomised.
IVF versus IUI + CC
In treatment‐naive women, there may be little or no difference in LBR between IVF and IUI + CC (OR 2.51, 95% CI 0.96 to 6.55; 1 RCT; 103 women; low‐quality evidence) (Table 3). In treatment‐naive women, assuming 15% LBR with IUI + CC, LBR would be between 15% and 54% with IVF.
Secondary outcomes
3.2 Clinical pregnancy rate (CPR)
Five studies reported CPR per woman (Bensdorp 2015; Goldman 2014; Nandi 2017; Reindollar 2010; van Rumste 2014). These studies were stratified by pretreatment status and type of treatment, that is treatment‐naive women who underwent IVF versus IUI + gonadotropins (Bensdorp 2015; Goldman 2014; Nandi 2017; van Rumste 2014); treatment‐naive women who underwent IVF versus IUI + CC (Goldman 2014); or women who were previously treated and underwent IVF versus IUI + gonadotropins (Reindollar 2010).
IVF versus IUI + gonadotropins
Among treatment‐naive women, there may be little or no difference in CPR following IVF versus IUI + gonadotropins (1 IVF to 2 to 3 IUI cycles) (OR 1.17, 95% CI 0.85 to 1.59; 3 RCTs; 731 women; I2 = 0%; low‐quality evidence) and where one IVF cycle was compared with one IUI cycle (OR 4.59, 95% CI 1.86 to 11.35; 1 RCT; 103 women; low‐quality evidence) (Analysis 3.2; Figure 7; Table 3). Assuming 48% CPR with IUI + gonadotropins (1 IVF to 2 to 3 IUI cycles), CPR would be between 44% and 60% with IVF; assuming 17% CPR with IUI + gonadotropins (1 IVF to 1 IUI cycle), CPR would be between 28% and 70% with IVF.
3.2. Analysis.
Comparison 3: IVF versus IUI + ovarian stimulation with gonadotropins or CC, Outcome 2: Clinical pregnancy rate per woman
7.
Forest plot of comparison: 3 IVF versus IUI + ovarian stimulation with gonadotropins or CC, outcome: 3.2 Clinical pregnancy rate per woman randomised.
In pretreated women, IVF may improve CPR compared with IUI + gonadotropins (OR 14.13, 95% CI 7.57 to 26.38; 1 RCT; 280 women; low‐quality evidence) (Analysis 3.2 ; Figure 7). In women pretreated with IUI + CC, assuming 30% CPR with IUI + gonadotropins, CPR would be between 76% and 92% with IVF.
IVF versus IUI + CC
In treatment‐naive women, there may be little or no difference in CPR between IVF and IUI + CC (OR 3.58, 95% CI 1.51 to 8.49; 1 RCT; 103 women; low‐quality evidence). In treatment‐naive women, assuming 21% CPR with IUI + CC, CPR would be between 29% and 69% with IVF.
3.3 Multiple pregnancy rate (MPR)
Five trials reported MPR per woman (Bensdorp 2015; Goldman 2014; Goverde 2000; Nandi 2017; van Rumste 2014).
IVF versus IUI + gonadotropins
Among treatment‐naive women, there may be little or no difference in MPR following IVF versus IUI + gonadotropins (1 IVF to 2 to 3 IUI cycles) (OR 0.82, 95% CI 0.38 to 1.77; 3 RCTs; 731 women; I2 = 0%; low‐quality evidence) and where one IVF cycle was compared with one IUI cycle (OR 0.76, 95% CI 0.36 to 1.58; 2 RCTs; 221 women; I2 = 0%; low‐quality evidence) (Analysis 3.3; Figure 8; Table 3). Assuming 4% MPR with IUI + gonadotropins (1 IVF to 2 to 3 IUI cycles), MPR would be between 1.6% and 6.9% with IVF; assuming 18% MPR with IUI + gonadotropins (1 IVF to 1 IUI cycle), MPR would be between 7.3% and 26% with IVF.
3.3. Analysis.
Comparison 3: IVF versus IUI + ovarian stimulation with gonadotropins or CC, Outcome 3: Multiple pregnancy rate per woman
8.
Forest plot of comparison: 3 IVF versus IUI + ovarian stimulation with gonadotropins or CC, outcome: 3.3 Multiple pregnancy rate per woman randomised.
IVF versus IUI + CC
There may be little or no difference in MPR between IVF and IUI + CC (OR 0.64, 95% CI 0.17 to 2.41; 1 RCT; 102 women; low‐quality evidence) (Analysis 3.3; Figure 8). If we assume 12% MPR with IUI + CC, MPR would be between 2% and 24% with IVF.
3.4 Incidence of ovarian hyperstimulation syndrome (OHSS)
Three studies evaluated the incidence of OHSS (Goldman 2014; Goverde 2000; Nandi 2017).
IVF versus IUI + gonadotropins
Among treatment‐naive women, we are uncertain if there is a difference in OHSS between IVF and IUI + gonadotropins (1 IVF to 2 to 3 IUI cycles) (OR 6.86, 95% CI 0.35 to 134.59; 1 RCT; 207 women; very low‐quality evidence). There may be little or no difference in OHSS with one IVF cycle versus one IUI cycle (OR 1.22, 95% CI 0.36 to 4.16; 2 RCTs; 221 women; I2 = 0%; low‐quality evidence) (Analysis 3.4). In treatment‐naive women, assuming 4.5% OHSS rate with IUI + gonadotropins (1 IVF to 1 IUI cycle), OHSS rate would be between 1.7% and 16% with IVF.
3.4. Analysis.
Comparison 3: IVF versus IUI + ovarian stimulation with gonadotropins or CC, Outcome 4: Incidence of OHSS per woman
IVF versus IUI + CC
There may be little or no difference in OHSS rate between IVF and IUI + CC (OR 1.53, 95% CI 0.24 to 9.57; 1 RCT; 102 women; low‐quality evidence) (Analysis 3.4; Table 3). If we assume 4% OHSS rate with IUI + CC, OHSS would be between 1% and 28% with IVF.
3.5 Miscarriage rate
Two studies reported miscarriage rate per woman in treatment‐naive women (Goldman 2014; Nandi 2017).
IVF versus IUI + gonadotropins
Among treatment‐naive women, we are uncertain if there is a difference in miscarriage rate between IVF and IUI + gonadotropins (1 IVF to 2 to 3 IUI cycles) (OR 0.31, 95% CI 0.03 to 3.04; 1 RCT; 207 women; very low‐quality evidence). There may be little or no difference in miscarriage rate with one IVF cycle versus one IUI cycle (OR 1.16, 95% CI 0.44 to 3.02; 1 RCT; 103 women; low‐quality evidence) (Analysis 3.5). In treatment‐naive women, assuming 8.5% miscarriage rate with IUI + gonadotropins, miscarriage rate would be between 3.5% and 17% with IVF.
3.5. Analysis.
Comparison 3: IVF versus IUI + ovarian stimulation with gonadotropins or CC, Outcome 5: Miscarriage rate per woman
IVF versus IUI + CC
The may be little or no difference in miscarriage rate between IVF and IUI + CC (OR 1.48, 95% CI 0.54 to 4.05; 1 RCT; 102 women; low‐quality evidence) (Analysis 3.5; Table 3). If we assume 16% miscarriage rate with IUI + CC, miscarriage rate would be between 9% and 43% with IVF.
Other analyses
1. IVF versus expectant management
We performed sensitivity analysis for LBR with no change in direction of the treatment or significance noted when RR was used instead of OR, or when a random‐effects model was used instead of fixed‐effect model.
We were unable to perform sensitivity analysis by restricting to studies without high or unclear risk for any domain as only one study was included in the analysis.
2. IVF versus unstimulated IUI
We performed sensitivity analysis for LBR with no change in direction of the treatment or significance noted when RR was used instead of OR. When a random‐effects model was used instead of a fixed‐effect model, while the direction of the treatment was same, the difference was no longer significant (OR 3.56, 95% CI 0.74 to 16.99; 2 RCTs; 156 women; I2 = 60%).
We were unable to perform sensitivity analysis by restricting to studies without high or unclear risk for any domain as both studies had one domain at unclear risk of bias.
3. IVF versus stimulated IUI
3.1.1 Among treatment‐naive women, for IVF versus IUI + gonadotropins (1 IVF to 2 to 3 IUI cycles), there was no change in direction of the treatment or significance for LBR when RR was used instead of OR, or a random‐effects model was used instead of a fixed‐effect model.
We were unable to perform sensitivity analysis by restricting to studies without high or unclear risk of bias as all three included studies had one domain at unclear risk of bias.
3.1.2 Among treatment‐naive women, for IVF versus IUI + gonadotropins (1 IVF to 1 IUI cycle), there was no change in direction of the treatment or significance for LBR when RR was used instead of OR, or a random‐effects model was used instead of a fixed‐effect model. However, when the analysis was restricted to studies without any domain at high or unclear risk of bias, LBR was significantly higher following IVF (OR 2.94, 95% CI 1.09 to 7.92; 1 RCT; 103 women).
3.1.3 For IVF versus IUI + CC, there was no change in direction of the treatment or significance for LBR when RR was used instead of OR, or a random‐effects model was used instead of a fixed‐effect model.
We were unable to perform sensitivity analysis by restricting to studies without high or unclear risk for any domain as only one study was included in the analysis.
3.1.4 Among pretreated women, for IVF versus IUI + gonadotropins, there was no change in direction of the treatment or significance for LBR when RR was used instead of OR, or a random‐effects model was used instead of a fixed‐effect model.
We were unable to perform sensitivity analysis by restricting to studies without high or unclear risk for any domain as only one study was included in the analysis.
Discussion
Summary of main results
See Table 1; Table 2; Table 3.
We are uncertain if IVF improves LBR and CPR when compared to expectant management. IVF may improve LBR when compared to unstimulated IUI. In treatment‐naive women, there may be little or no difference in LBR between IVF and IUI + gonadotropins. In women pretreated with IUI + CC, IVF may improve LBR compared with IUI + gonadotropins. In treatment‐naive women, there may be little or no difference in LBR between IVF and IUI + CC. Adverse events associated with these interventions have not been adequately reported, and further research is needed.
Overall completeness and applicability of evidence
The evidence for each comparison was limited. The primary outcome for this review was LBR per woman. Only one study followed couples for 12 months after randomisation (Bensdorp 2015), during which time they underwent a maximum of three IVF cycles with subsequent transfer of a single fresh and, when appropriate, frozen embryo, or a maximum of six cycles of IUI + gonadotropins. The duration of infertility among couples included in the trials varied significantly. No trial compared IVF with IUI + letrozole. The paucity of trials and possible clinical heterogeneity among the included trials suggest that evidence for the effectiveness of IVF is inconclusive. It was not possible to pool all studies for the comparison of IVF versus IUI because of the difference in numbers of IUI cycles offered versus IVF.
Meta‐analysis was possible for three comparisons (IVF versus expectant management, IVF versus unstimulated IUI, and IVF versus IUI + gonadotropins), but as few outcomes were reported, pooling was limited due to insufficient data. One included trial that compared IVF with expectant management dates from 1993 (Soliman 1993). The comparison IVF versus IUI + CC was represented by a single trial. Although risk of bias was not substantial in the trial included in this comparison, it is difficult to be confident about the results, as all trials share similar weaknesses, as discussed above. Adverse events associated with these interventions have not been adequately reported.
The applicability of studies comparing IVF versus expectant management is questionable, as they included extensively pretreated women who had been subfertile for several years (mean 58 to 65 months), and the duration of expectant management was only three to six months.
Clinical pregnancy rates were significantly higher with IVF compared with IUI + gonadotropins. However, a large study of women pretreated with CC + IUI reported significantly higher pregnancy and LBR rates following IVF. Couples in this study were randomly assigned to (1) a conventional pathway involving CC plus IUI, followed by IUI + gonadotropins, then IVF, or (2) an accelerated pathway (CC + IUI followed by six cycles of IVF) (Reindollar 2010). Randomly assigned groups included similar numbers of women. However, study populations in the other studies in this comparison, Bensdorp 2015; Goldman 2014; Goverde 2000; Nandi 2017; van Rumste 2014, differed from those of Reindollar 2010, as women in these studies did not undergo CC + IUI treatment before receiving IUI + gonadotropins or IVF. Despite pretreatment with CC + IUI in both randomly assigned arms, we believe the comparison between IUI + gonadotropins and IVF is valid. Our analysis suggests there may be little or no difference between IVF and IUI + gonadotropins in terms of CPR in treatment‐naive women, and IVF may be more effective than IUI + gonadotropins in terms of CPR and LBR per woman in pretreated women, but these results should be interpreted with caution. The single study that compared CC + IUI with IVF in women 38 to 42 years of age also showed that pregnancy rates were significantly higher with IVF than with CC + IUI (Goldman 2014). In treatment‐naive women, there was no difference in LBR between one cycle of IVF and one cycle of IUI + gonadotropins.
Multiple pregnancy, an important adverse effect of superovulation, was reported in five studies that compared IVF with IUI + gonadotropins (Bensdorp 2015; Goldman 2014; Goverde 2000; Nandi 2017; van Rumste 2014). Results of the analysis suggest no significant difference in MPRs between women who underwent IUI + gonadotropins compared with IVF, but the numbers of events were small overall. The maximum number of embryos transferred was two among women younger than 35 years, and three in women 35 years of age and older in one study (Goverde 2000); up to two embryos were transferred in the second study (van Rumste 2014). One good‐quality embryo was transferred in one study (van Rumste 2014), and two embryos were transferred if no good‐quality embryos were available. Elective single‐embryo transfer (eSET) was followed in one study (Bensdorp 2015). A further study used American Society for Reproductive Medicine (ASRM) guidelines for day 3 embryo transfers (Goldman 2014). In another study, one embryo was transferred on either day 3 or day 5 if at least one top‐grade embryo was available; participants were given the option to transfer up to two embryos if no top‐grade embryos were available (Nandi 2017). Protocols used for ovarian stimulation also differed among the studies that evaluated this comparison (Goldman 2014; Goverde 2000; Nandi 2017; van Rumste 2014). A long protocol was followed that included a gonadotropin‐releasing hormone (GnRH) agonist and gonadotropins in two studies (Goverde 2000; van Rumste 2014). One study used an IVF protocol consisting of 21 days of an oral contraceptive followed by a microdose GnRH agonist, followed by the addition of gonadotropins at a twice‐daily dosage for three days, beginning on day 3 or 4 of the agonist (Goldman 2014). In another study, the type of protocol (GnRH agonist long or GnRH antagonist protocol with gonadotropin dose of 150 to 450 international units daily) was based on ovarian reserved (as tested by antimüllerian hormone level, basal antral follicle count, and day 2 follicle‐stimulating hormone level) (Nandi 2017). Standardisation of the number of embryos transferred and the protocols used for ovarian stimulation should be considered in trials related to subfertility. Furthermore, studies varied in the number of IUI or IVF cycles and the definition of one IVF cycle, that is whether it concluded one embryo transfer or both fresh and frozen embryo transfers. Information on costs associated with various fertility treatments is also very limited. Reported cost‐effectiveness analyses are lacking in their definitions of outcome measures and extent of cost analysis.
Quality of the evidence
Few high‐quality RCTs have conducted head‐to‐head comparisons of relevant interventions in the context of unexplained subfertility. Most studies are methodologically inadequate. Only nine trials were eligible for inclusion in the final analysis. Meta‐analysis was possible for three comparisons. One comparison was represented by a single trial only. This was compounded by insufficient information on some outcomes. All trials reported LBR per woman or couple, although duration of follow‐up in most trials was limited. Most trials had small sample sizes. Blinding could not be performed in most studies because of the nature of the interventions, but this would be unlikely to affect the outcomes measured in the review. One trial reporting only per‐cycle data was excluded from the review (Crosignani 1991).
The existing trials have several limitations. The definition of unexplained infertility and the clinical procedures and protocols used varied among studies. It is unreasonable to expect absolute experimental uniformity among study centres, and different centres inevitably display variation in the application of assisted reproduction treatments. Duration of follow‐up was limited and unequal between studies. Sample sizes of the studies included in this review were also limited. Most trials show poor methodological quality. Methods of randomisation and reasons for and numbers of dropouts and withdrawals were often not clearly stated. Inadequate methods of randomisation can lead to bias in estimates of treatment effects (Schulz 1995). Allocation concealment was inadequate in some trials. Intention‐to‐treat analysis was not always performed, possibly leading to exaggerated estimates of treatment effect and possible influence on inferences and clinical decisions. Most trials determined clinical pregnancy rates per cycle as the endpoint, but LBR per woman is the most important outcome to the couple.
Clinical heterogeneity between trials was present due to differences between studies in terms of investigation protocols and inclusion criteria. The protocols used for ovarian stimulation also differed, and there could be differences in the laboratory protocols such as use of intracytoplasmic sperm injection, type of culture media, and day of embryo transfer. Some studies did not clearly define timing of IUI and method of sperm preparation. The sample sizes of the included studies were limited. Studies varied in the number of treatment cycles in the IVF and IUI arms and the number of embryo transfer procedures included in their results with each IVF cycle.
We included the following three analyses.
IVF versus expectant management for unexplained subfertility
We downgraded the quality of the evidence for live birth or clinical pregnancy per randomly assigned woman by three levels for very serious imprecision: the 95% CI was too large, and relatively few events were reported in the included studies. Moreover, applicability was questionable (with respect to duration of unexplained infertility and co‐interventions) (Table 1).
IVF versus unstimulated IUI for unexplained subfertility
We downgraded the quality of the evidence for live birth and clinical pregnancy per randomly assigned woman by two and three levels, respectively, for serious imprecision: relatively wide 95% CI, unclear risk of bias, and indirectness. Furthermore, the two trials evaluating this comparison included a limited number of participants (n = 156) (Table 2).
IVF versus IUI + ovarian simulation with gonadotropins or clomiphene citrate for unexplained subfertility
We downgraded the quality of the evidence by two levels for live birth and three levels for clinical pregnancy per randomly assigned women in this comparison due to imprecision (relatively wide 95% CI), unclear risk of bias, indirectness (single study), and inconsistency (statistical heterogeneity) (Table 3).
We identified four studies that evaluated the incidence of ovarian hyperstimulation syndrome (OHSS) in women who underwent IVF and IUI + gonadotropins (Goldman 2014; Goverde 2000; Nandi 2017; van Rumste 2014). However, as data were reported per cycle in one of these trials (van Rumste 2014), only three trials were included in the analysis for this outcome (Goldman 2014; Goverde 2000; Nandi 2017). Although no significant differences were noted in the incidence of OHSS between treatment groups, the sample size was too small to permit any firm conclusions. In one trial that reported OHSS per cycle (van Rumste 2014), two of 48 couples in the IVF group that reached embryo transfer were cancelled as a result of OHSS, and of the 142 started cycles of IUI + gonadotropins, 14 cycles were cancelled because of the risk of multiple pregnancy (10%).
Potential biases in the review process
We performed a comprehensive search to identify all potentially eligible studies for this update. When necessary, we attempted to contact authors for information regarding their published data.
Economic evaluation of fertility treatment is an important factor in decision‐making. Trials evaluating the cost‐effectiveness of available treatments for unexplained infertility are very limited. To date, no studies have compared costs of IVF treatment versus expectant management and CC in the context of RCTs. Only five studies of cost‐effectiveness in assisted reproductive technology were based on RCTs (Goverde 2000; Karande 1998; Nandi 2017; Reindollar 2010; van Rumste 2014). The study of Karande 1998 compared an assumed equity in costs based on mathematical modelling between IVF as first‐line treatment and a traditional treatment algorithm and showed a much higher cost per pregnancy for IVF. Goverde 2000, in a prospective, parallel‐group study, reported that the costs of one IVF treatment cycle were 3.5 and 5 times higher than those of one IUI treatment for stimulated and spontaneous cycles, respectively. van Rumste 2014 reported an additional cost of EUR 600 per couple with IVF with eSET compared with IUI + superovulation. Reindollar 2010 also reported the cost‐effectiveness of various treatments; however, specific costs for IVF and IUI + superovulation could not be extracted from the data provided. Nandi 2017 undertook a simple direct comparison of the cost of three cycles of IUI and one cycle of IVF. In this trial, the cost ratio of IUI/IVF (1:1.3) was higher for one cycle of IVF compared with three cycles of IUI.
Agreements and disagreements with other studies or reviews
A recent Cochrane Review and network meta‐analysis on interventions for unexplained infertility comparing the various treatment options versus expectant management found insufficient evidence of any differences in effectiveness for the comparisons. In a subgroup analysis involving couples with a poor prognosis of natural conception, live birth rates were significantly higher following IUI with ovarian stimulation or IVF versus no treatment (OR 4.48, 95% CI 2.00 to 10.1; moderate‐certainty evidence; OR 4.99, 95 CI 2.07 to 12.04; moderate‐certainty evidence). There was insufficient evidence of a difference in live birth rates between IVF and IUI with ovarian stimulation (OR 1.11, 95% CI 0.78 to 1.60; low‐certainty evidence) (Wang 2019).
Authors' conclusions
Implications for practice.
There is insufficient evidence to permit any firm conclusions as to whether IVF may be associated with higher live birth rates over expectant management. IVF may be associated with higher live birth rates than unstimulated intrauterine insemination (IUI). In women pretreated with IUI + clomiphene citrate, IVF appears to be associated with higher live birth rates than IUI plus gonadotropins. However, there is no conclusive evidence of a difference in live birth rates between IVF and IUI + gonadotropins or between IVF and IUI + clomiphene citrate in women who are treatment‐naive.
We were unable to adequately assess adverse events associated with these interventions owing to lack of evidence.
Clinicians and couples should balance the invasive nature of IVF and related costs against chances of success with other treatment modalities.
Implications for research.
Some of the difficulties encountered in the preparation of this review can be avoided by planning infertility trials that are consistent in terms of study populations, design, and outcomes. Unexplained infertility should be clearly defined, and participant characteristics made explicit (age, duration of infertility, parity, infertility investigations, and previous therapy). Trials should have an adequate duration of follow‐up (e.g. follow‐up of fresh and frozen transfers following IVF). Treatment protocols, methods of sperm preparation, numbers of embryos transferred, and inclusion and exclusion criteria should be clearly stated. This will facilitate pooling of data for statistical meta‐analysis. Large randomised controlled trials with sufficient power are warranted, and future studies should incorporate core outcome sets for consistency of reporting in infertility trials (Duffy 2018).
Outcome measures should include live birth rate per woman. As comparison of cumulative live birth rate (CLBR) is also important, trialists should endeavour to follow participants until frozen transfers accruing from a single started cycle are completed. In trials where ovarian stimulation is used, multiple pregnancy rates and the incidence of ovarian hyperstimulation syndrome should be stated. There should be clear definitions of the numerator and denominator when reporting trial results. Furthermore, in events that are time related such as CLBR, the study endpoint should be specified either as cycles, days, or months from randomisation. The majority of studies included in this review did not report CLBR following IVF cycles as was described in the Types of interventions section.
Future trials should use adequate methods of randomisation, and numbers of and reasons for dropouts and withdrawals should be clearly stated. Allocation concealment should be adequate, and intention‐to‐treat analysis performed. A power calculation should be performed with a clear description of the improvement in treatment outcome that is considered clinically significant. The use of parallel‐group rather than cross‐over trials is favoured in the study of events, as the latter may exaggerate the effectiveness of treatment.
Large randomised controlled trials are required to address clinical effectiveness, safety, and cost‐effectiveness of IVF versus expectant management and IVF versus IUI + ovarian stimulation. New studies should factor in fertility outcomes such as CLBR and time to pregnancy over and above traditionally reported outcomes. It is important to identify patients with certain prognostic profiles who would benefit from proceeding from expectant management to more invasive treatment. The most appropriate time to transition from expectant management in this group should also be identified.
What's new
| Date | Event | Description |
|---|---|---|
| 27 September 2023 | New search has been performed | One new study previously stated as ongoing has been added (Nandi 2017). |
| 27 September 2023 | New citation required but conclusions have not changed | The conclusions of this review have not changed with the addition of new evidence. |
History
Protocol first published: Issue 4, 2001 Review first published: Issue 2, 2002
| Date | Event | Description |
|---|---|---|
| 23 February 2011 | New citation required but conclusions have not changed | Three studies have been excluded: two (Tanbo 1990; Raneiri 1995) because gamete intrafallopian transfer (GIFT) has been removed from the comparisons, as this treatment is rarely used now, and one (Crosignani 1991) as only per‐cycle data were reported. Per‐cycle data from all comparisons have been deleted. One new study has been added to the comparison IVF versus unstimulated IUI (Elzeiny 2014). Two new studies have been added (Goldman 2014; Bensdorp 2015) to the comparison of in vitro fertilisation (IVF) versus intrauterine insemination plus ovarian stimulation (IUI + SO). One new study has been added to the comparison IVF versus IUI + clomiphene (Goldman 2014) |
| 1 September 2010 | New citation required and conclusions have changed | Substantive amendments have been made |
| 12 November 2008 | Amended | This review has been converted to the new review format |
Acknowledgements
We thank Marian Showell (Information Specialist) for running the searches for this review and the Cochrane Gynaecology and Fertility Group for support provided.
We thank Dr Lucy Prentice, Dr Hector Georgiou, and Melissa Vercoe as reviewers, and Lisa Winer of Cochrane Central Production Service for copy editing the draft.
We thank Anupa Nandi for providing additional information for the study Nandi 2017.
Appendices
Appendix 1. Cochrane Gynaecology and Fertility Group Specialised Register search strategy
Procite platform
Searches 10 Novenber 2021
[Keywords CONTAINS "*Embryo Transfer" or "IVF" or "in vitro fertilisation" or "in‐vitro fertilisation procedure" or "in‐vitro fertilisation techniques" or "in vitro fertilization" or "ICSI" or "intracytoplasmic morphologically selected sperm injection" or "intracytoplasmic sperm injection" or "intracytoplasmic sperm injection techniques" or "intracytoplasmic sperm injection cycle" or "zygote intrafallopian transfer" or "zygote intrafallopian tube transfer" or "zygote transfer" or "ET" or Title CONTAINS"*Embryo Transfer" or "IVF" or "in vitro fertilisation" or "in‐vitro fertilisation procedure" or "in‐vitro fertilisation techniques" or "in vitro fertilization" or "ICSI" or "intracytoplasmic morphologically selected sperm injection" or "intracytoplasmic sperm injection" or "intracytoplasmic sperm injection techniques" or "intracytoplasmic sperm injection cycle" or "zygote intrafallopian transfer" or "zygote intrafallopian tube transfer" or "zygote transfer" or "ET"
AND
Keywords CONTAINS "expectant management" or "conservative treatment" or "*Clomiphene" or "clomiphene citrate" or "insemination" or "insemination‐fallopian tube sperm perfusion" or "insemination‐utero tubal" or "insemination, intrauterine " or "insemination, intratubal" or "artificial insemination" or "IUI" or "Intrauterine Insemination" or "intrautero tuboperitoneal insemination" or "waiting group" or "conventional insemination" or "conventional" or "unexplained and endometriosis related infertility" or "uncoded subfertility" or "unexplained infertility" or "unexplained subfertility" or "idiopathic infertility" or "idiopathic subfertility" or "idiopathic‐unexplained" or Title CONTAINS "expectant management" or "conservative treatment" or "*Clomiphene" or "clomiphene citrate" or "insemination" or "insemination‐fallopian tube sperm perfusion" or "insemination‐utero tubal" or "insemination, intrauterine " or "insemination, intratubal" or "artificial insemination" or "IUI" or "Intrauterine Insemination"
(1034 records)
Appendix 2. CENTRAL search strategy
Ovid platform
Searched 10 November 2021 (Issue October 2021)
1 exp embryo transfer/ or exp fertilization in vitro/ or exp sperm injections, intracytoplasmic/ or exp zygote intrafallopian transfer/ (2396) 2 (in Vitro adj2 fertili$).tw. (3616) 3 (ivf or icsi or ZIFT).tw. (7623) 4 (intracytoplas$ adj2 sperm).tw. (1401) 5 zygote intrafallopian transfer$.tw. (10) 6 (embryo transfer$ or ET).tw. (42306) 7 invitro fertili$.tw. (31) 8 or/1‐7 (47895) 9 (expect$ adj2 manage$).tw. (1148) 10 (conservative treat$ or conservative therap$).tw. (4814) 11 exp Clomiphene/ (665) 12 clomi$.tw. (2717) 13 exp insemination, artificial/ or exp insemination, artificial, homologous/ (375) 14 (intrauter$ adj5 inseminat$).tw. (1068) 15 (intra‐uter$ adj5 inseminat$).tw. (146) 16 (artificial adj2 inseminat$).tw. (162) 17 IUI.tw. (1013) 18 (wait adj1 see).tw. (238) 19 (conventional$ adj2 treat$).tw. (11523) 20 (conventional$ adj2 therap$).tw. (8456) 21 exp Infertility/ and unexplained.tw. (316) 22 exp Infertility/ and idiopathic.tw. (151) 23 (unexplain* adj5 infertil*).tw. (773) 24 (unexplain* adj5 subfertil*).tw. (138) 25 (idiopathic adj5 subfertil*).tw. (22) 26 (idiopathic adj5 infertil*).tw. (199) 27 (unknown adj3 infertil*).tw. (25) 28 (unknown adj3 subfertil*).tw. (3) 29 (unexplained adj3 steril*).tw. (3) 30 (idiopathic adj3 steril*).tw. (5) 31 (unknown adj3 steril*).tw. (7) 32 or/9‐31 (28719) 33 8 and 32 (1734)
Appendix 3. MEDLINE search strategy
Ovid platform
Searched from 1946 to 11 November 2021
1 exp embryo transfer/ or exp fertilization in vitro/ or exp sperm injections, intracytoplasmic/ or exp zygote intrafallopian transfer/ (44399) 2 (in Vitro adj2 fertili$).tw. (27230) 3 (ivf or icsi or ZIFT).tw. (29904) 4 (intracytoplas$ adj2 sperm).tw. (8092) 5 zygote intrafallopian transfer$.tw. (88) 6 (embryo transfer$ or ET).tw. (308110) 7 invitro fertili$.tw. (40) 8 or/1‐7 (354480) 9 (expect$ adj2 manage$).tw. (4875) 10 (conservative treat$ or conservative therap$).tw. (41866) 11 exp Clomiphene/ (5346) 12 clomi$.tw. (8615) 13 exp insemination, artificial/ or exp insemination, artificial, homologous/ (12132) 14 (intrauter$ adj5 inseminat$).tw. (2783) 15 (intra‐uter$ adj5 inseminat$).tw. (250) 16 (artificial adj2 inseminat$).tw. (7382) 17 IUI.tw. (1921) 18 (wait adj1 see).tw. (6) 19 (conventional$ adj2 treat$).tw. (30344) 20 (conventional$ adj2 therap$).tw. (25315) 21 exp Infertility/ and unexplained.tw. (2189) 22 exp Infertility/ and idiopathic.tw. (2019) 23 (unexplain* adj5 infertil*).tw. (2466) 24 (unexplain* adj5 subfertil*).tw. (190) 25 (idiopathic adj5 subfertil*).tw. (80) 26 (idiopathic adj5 infertil*).tw. (1514) 27 (unknown adj3 infertil*).tw. (209) 28 (unknown adj3 subfertil*).tw. (14) 29 (unexplained adj3 steril*).tw. (57) 30 (idiopathic adj3 steril*).tw. (57) 31 (unknown adj3 steril*).tw. (53) 32 or/9‐31 (129619) 33 8 and 32 (6924) 34 randomized controlled trial.pt. (549821) 35 controlled clinical trial.pt. (94531) 36 randomized.ab. (539797) 37 placebo.tw. (228980) 38 clinical trials as topic.sh. (198046) 39 randomly.ab. (369417) 40 trial.ti. (250720) 41 (crossover or cross‐over or cross over).tw. (91165) 42 or/34‐41 (1438915) 43 exp animals/ not humans.sh. (4911861) 44 42 not 43 (1322651) 45 33 and 44 (709)
Appendix 4. Embase search strategy
Ovid platform
Searched from 1980 to 11 November 2021
1 exp fertilization in vitro/ (77381) 2 exp intracytoplasmic sperm injection/ (22929) 3 exp embryo transfer/ (34080) 4 (in?Vitro adj2 fertili$).tw. (221) 5 (ivf or icsi or ZIFT).tw. (51742) 6 (intracytoplas$ adj2 sperm).tw. (10902) 7 zygote intrafallopian transfer$.tw. (102) 8 embryo transfer$.tw. (21817) 9 invitro fertili$.tw. (215) 10 or/1‐9 (96767) 11 exp conservative treatment/ (620973) 12 (expect$ adj2 manage$).tw. (7320) 13 (conservative treatment or conservative therap$).tw. (50624) 14 exp clomifene/ (4814) 15 clomi$.tw. (10662) 16 exp artificial insemination/ (18381) 17 (intrauter$ adj5 inseminat$).tw. (4173) 18 (intra‐uter$ adj5 inseminat$).tw. (462) 19 (artificial adj2 inseminat$).tw. (7018) 20 IUI.tw. (3548) 21 (wait adj1 see).tw. (17) 22 (conventional$ adj2 treat$).tw. (43561) 23 (conventional$ adj2 therap$).tw. (36875) 24 (exp infertility/ or exp infertility therapy/) and unexplained.tw. (4575) 25 (exp infertility/ or exp infertility therapy/) and idiopathic.tw. (4006) 26 (unexplain* adj5 infertil*).tw. (3722) 27 (unexplain* adj5 subfertil*).tw. (305) 28 (idiopathic adj5 subfertil*).tw. (97) 29 (idiopathic adj5 infertil*).tw. (2174) 30 (unknown adj3 infertil*).tw. (323) 31 (unknown adj3 subfertil*).tw. (18) 32 (unexplained adj3 steril*).tw. (62) 33 (idiopathic adj3 steril*).tw. (67) 34 (unknown adj3 steril*).tw. (65) 35 or/11‐34 (763854) 36 Clinical Trial/ (1008480) 37 Randomized Controlled Trial/ (678855) 38 exp randomization/ (92283) 39 Single Blind Procedure/ (44229) 40 Double Blind Procedure/ (186381) 41 Crossover Procedure/ (68485) 42 Placebo/ (359565) 43 Randomi?ed controlled trial$.tw. (269882) 44 Rct.tw. (44067) 45 random allocation.tw. (2228) 46 randomly allocated.tw. (39429) 47 allocated randomly.tw. (2697) 48 (allocated adj2 random).tw. (833) 49 Single blind$.tw. (27479) 50 Double blind$.tw. (217635) 51 ((treble or triple) adj blind$).tw. (1424) 52 placebo$.tw. (327833) 53 prospective study/ (723227) 54 or/36‐53 (2427809) 55 case study/ (81899) 56 case report.tw. (455056) 57 abstract report/ or letter/ (1168007) 58 or/55‐57 (1692569) 59 54 not 58 (2369558) 60 10 and 35 and 59 (2766)
Appendix 5. PsycINFO search strategy
Ovid platform
Searched from 1806 to 11 November 2021
1 (in?Vitro adj2 fertili$).tw. (4) 2 (ivf or icsi or ZIFT).tw. (654) 3 (intracytoplas$ adj2 sperm).tw. (66) 4 zygote intrafallopian transfer$.tw. (2) 5 embryo transfer$.tw. (134) 6 invitro fertili$.tw. (4) 7 (expect$ adj2 manage$).tw. (767) 8 (conservative treat$ or conservative therap$).tw. (458) 9 clomi$.tw. (1940) 10 (intrauter$ adj5 inseminat$).tw. (37) 11 (intra‐uter$ adj5 inseminat$).tw. (2) 12 (artificial adj2 inseminat$).tw. (274) 13 IUI.tw. (46) 14 (wait adj1 see).tw. (2) 15 (conventional$ adj2 treat$).tw. (1794) 16 (conventional$ adj2 therap$).tw. (1076) 17 or/1‐6 (755) 18 or/7‐16 (6223) 19 17 and 18 (43) 20 random.tw. (63315) 21 control.tw. (474358) 22 double‐blind.tw. (23938) 23 clinical trials/ (11987) 24 placebo/ (6103) 25 exp Treatment/ (1114409) 26 or/20‐25 (1536680) 27 19 and 26 (17)
Appendix 6. CINAHL search strategy
EBSCO platform
Searched from 1961 to 4 November 2019
| # | Query | Results |
| S35 | S22 AND S34 | 157 |
| S34 | S23 OR S24 OR S25 OR S26 OR S27 OR S28 OR S29 OR S30 OR S31 OR S32 OR S33 | 1,355,071 |
| S33 | TX allocat* random* | 11,048 |
| S32 | (MH "Quantitative Studies") | 23,576 |
| S31 | (MH "Placebos") | 11,472 |
| S30 | TX placebo* | 59,597 |
| S29 | TX random* allocat* | 11,048 |
| S28 | (MH "Random Assignment") | 55,950 |
| S27 | TX randomi* control* trial* | 177,195 |
| S26 | TX ( (singl* n1 blind*) or (singl* n1 mask*) ) or TX ( (doubl* n1 blind*) or (doubl* n1 mask*) ) or TX ( (tripl* n1 blind*) or (tripl* n1 mask*) ) or TX ( (trebl* n1 blind*) or (trebl* n1 mask*) ) | 1,033,048 |
| S25 | TX clinic* n1 trial* | 252,682 |
| S24 | PT Clinical trial | 86,289 |
| S23 | (MH "Clinical Trials+") | 268,391 |
| S22 | S7 AND S21 | 559 |
| S21 | S8 OR S9 OR S10 OR S11 OR S12 OR S13 OR S14 OR S15 OR S16 OR S17 OR S18 OR S19 OR S20 | 22,489 |
| S20 | TX(conventional* N2 therap*) | 4,829 |
| S19 | TX (conventional* N2 treat*) | 5,604 |
| S18 | TX (wait N1 see) | 471 |
| S17 | TX IUI | 338 |
| S16 | TX(artificial* N2 inseminat*) | 777 |
| S15 | TX(intra‐uter* N3 inseminat*) | 29 |
| S14 | TX(intrauter* N3 inseminat*) | 468 |
| S13 | (MM "Insemination, Artificial") | 432 |
| S12 | TX clomi* | 933 |
| S11 | (MM "Clomiphene") | 211 |
| S10 | TX(conservative Therap*) | 1,930 |
| S9 | TX(conservative treat*) | 7,333 |
| S8 | TX(expect* N2 manage*) | 2,014 |
| S7 | S1 OR S2 OR S3 OR S4 OR S5 OR S6 | 9,781 |
| S6 | TX (intracytoplas* N2 sperm) | 903 |
| S5 | TX embryo* N3 transfer* | 3,036 |
| S4 | TX IVF or TX ICSI | 4,917 |
| S3 | (MM "Fertilization in Vitro") | 3,392 |
| S2 | TX vitro fertilization | 6,874 |
| S1 | TX vitro fertilisation | 6,874 |
Data and analyses
Comparison 1. IVF versus expectant management.
| Outcome or subgroup title | No. of studies | No. of participants | Statistical method | Effect size |
|---|---|---|---|---|
| 1.1 Live birth rate per woman | 1 | 51 | Odds Ratio (M‐H, Fixed, 95% CI) | 22.00 [2.56, 189.37] |
| 1.2 Clinical pregnancy rate per woman | 2 | 86 | Odds Ratio (M‐H, Fixed, 95% CI) | 3.24 [1.07, 9.80] |
Comparison 2. IVF versus unstimulated IUI.
| Outcome or subgroup title | No. of studies | No. of participants | Statistical method | Effect size |
|---|---|---|---|---|
| 2.1 Live birth rate per woman | 2 | 156 | Odds Ratio (M‐H, Fixed, 95% CI) | 2.47 [1.19, 5.12] |
| 2.2 Clinical pregnancy rate per woman | 1 | Odds Ratio (M‐H, Fixed, 95% CI) | Subtotals only | |
| 2.3 Multiple pregnancy rate per woman | 1 | 43 | Odds Ratio (M‐H, Fixed, 95% CI) | 1.03 [0.04, 27.29] |
| 2.4 Miscarriage rate | 1 | 43 | Odds Ratio (M‐H, Fixed, 95% CI) | 1.72 [0.14, 21.25] |
Comparison 3. IVF versus IUI + ovarian stimulation with gonadotropins or CC.
| Outcome or subgroup title | No. of studies | No. of participants | Statistical method | Effect size |
|---|---|---|---|---|
| 3.1 Live birth rate per woman | 6 | Odds Ratio (M‐H, Fixed, 95% CI) | Subtotals only | |
| 3.1.1 Treatment‐naive women IVF vs IUI + gonadotropins (1 IVF to 2‐3 IUI cycles) | 3 | 731 | Odds Ratio (M‐H, Fixed, 95% CI) | 1.19 [0.87, 1.61] |
| 3.1.2 Treatment‐naive women IVF vs IUI + gonadotrophins (1 IVF to 1 IUI cycle) | 2 | 221 | Odds Ratio (M‐H, Fixed, 95% CI) | 1.63 [0.91, 2.92] |
| 3.1.3 Treatment‐naive women IVF vs IUI + CC | 1 | 103 | Odds Ratio (M‐H, Fixed, 95% CI) | 2.51 [0.96, 6.55] |
| 3.1.4 Pretreated women IVF vs IUI + gonadotropins | 1 | 280 | Odds Ratio (M‐H, Fixed, 95% CI) | 3.90 [2.32, 6.57] |
| 3.2 Clinical pregnancy rate per woman | 5 | Odds Ratio (M‐H, Fixed, 95% CI) | Subtotals only | |
| 3.2.1 Treatment‐naive women IVF vs IUI + gonadotropins | 3 | 731 | Odds Ratio (M‐H, Fixed, 95% CI) | 1.17 [0.85, 1.59] |
| 3.2.2 Treatment‐naive women IVF vs IUI + gonadotrophins (1 IVF to 1 IUI cycle) | 1 | 103 | Odds Ratio (M‐H, Fixed, 95% CI) | 4.59 [1.86, 11.35] |
| 3.2.3 Treatment‐naive women IVF vs IUI + CC | 1 | 103 | Odds Ratio (M‐H, Fixed, 95% CI) | 3.58 [1.51, 8.49] |
| 3.2.4 Pretreated women IVF vs IUI + gonadotropins | 1 | 280 | Odds Ratio (M‐H, Fixed, 95% CI) | 14.13 [7.57, 26.38] |
| 3.3 Multiple pregnancy rate per woman | 5 | Odds Ratio (M‐H, Fixed, 95% CI) | Subtotals only | |
| 3.3.1 Treatment‐naive women IUI + gonadotropins | 3 | 731 | Odds Ratio (M‐H, Fixed, 95% CI) | 0.82 [0.38, 1.77] |
| 3.3.2 Treatment‐naive women IVF vs IUI + gonadotrophins (1 IVF to 1 IUI cycle) | 2 | 221 | Odds Ratio (M‐H, Fixed, 95% CI) | 0.76 [0.36, 1.58] |
| 3.3.3 Treatment‐naive women IVF vs IUI + CC | 1 | 102 | Odds Ratio (M‐H, Fixed, 95% CI) | 0.64 [0.17, 2.41] |
| 3.4 Incidence of OHSS per woman | 3 | Odds Ratio (M‐H, Random, 95% CI) | Subtotals only | |
| 3.4.1 Treatment‐naive women IVF vs IUI + gonadotropins | 1 | 207 | Odds Ratio (M‐H, Random, 95% CI) | 6.86 [0.35, 134.59] |
| 3.4.2 Treatment‐naive women IVF vs IUI + gonadotrophins (1 IVF to 1 IUI cycle) | 2 | 221 | Odds Ratio (M‐H, Random, 95% CI) | 1.22 [0.36, 4.16] |
| 3.4.3 Treatment‐naive women IVF vs IUI + CC | 1 | 102 | Odds Ratio (M‐H, Random, 95% CI) | 1.53 [0.24, 9.57] |
| 3.5 Miscarriage rate per woman | 2 | Odds Ratio (M‐H, Fixed, 95% CI) | Subtotals only | |
| 3.5.1 Treatment‐naive women IVF vs IUI + gonadotropins | 1 | 207 | Odds Ratio (M‐H, Fixed, 95% CI) | 0.31 [0.03, 3.04] |
| 3.5.2 Treatment‐naive women IVF vs IUI + gonadotrophins (1 IVF to 1 IUI cycle) | 1 | 103 | Odds Ratio (M‐H, Fixed, 95% CI) | 1.16 [0.44, 3.02] |
| 3.5.3 Treatment‐naive women IVF vs IUI + CC | 1 | 102 | Odds Ratio (M‐H, Fixed, 95% CI) | 1.48 [0.54, 4.05] |
Characteristics of studies
Characteristics of included studies [ordered by study ID]
Bensdorp 2015.
| Study characteristics | ||
| Methods | Multicentre, open‐label, 3‐arm, parallel‐group randomised controlled non‐inferiority trial | |
| Participants | 602 couples seeking fertility treatment after ≥ 12 months of unprotected intercourse, with the female partner between 18 and 38 years, an unfavourable prognosis for natural conception and a diagnosis of unexplained or mild male subfertility. Exclusion criteria included anovulation, double‐sided tubal disease, severe endometriosis, premature ovarian failure, and known endocrine disorders (e.g. Cushing syndrome, adrenal hyperplasia). | |
| Interventions | 3 cycles of IVF‐SET (plus subsequent cryo‐cycles), 6 cycles of modified natural cycle IVF, and 6 cycles of IUI‐COH within 12 months after randomisation. Any additional treatments provided during this period were included at follow‐up. | |
| Outcomes | Main outcome measures: the primary outcome was birth of a healthy child resulting from a singleton pregnancy conceived within 12 months after randomisation. Secondary outcomes included live birth, clinical pregnancy, ongoing pregnancy, multiple pregnancy, time to pregnancy, pregnancy complications, and neonatal morbidity and mortality. | |
| Notes | Quote: "During our trial the results of a pilot study, randomising women to three cycles of IUI‐COH or one cycle of IVF‐SET, were published. This pilot study demonstrated that the policy of transferring two embryos when no good quality embryos are available is not effective in preventing multiple pregnancies. The study protocol was amended, and from February 2010, after allocation of 48 women to the IVF‐SET group, a strict single embryo transfer policy (i.e. single embryo transfer was performed irrespective of embryo quality) was implemented" | |
| Risk of bias | ||
| Bias | Authors' judgement | Support for judgement |
| Random sequence generation (selection bias) | Low risk | Randomisation was performed with an "online randomisation program, using biased coin minimisation, stratified for study centre" |
| Allocation concealment (selection bias) | Low risk | "A web based program generated a unique number with allocation code after entry of the patient’s initials and date of birth. Neither the recruiters nor the trial project group could access the randomisation sequence" |
| Blinding (performance bias and detection bias) All outcomes | Unclear risk | Blinding was not possible because of the nature of the interventions |
| Incomplete outcome data (attrition bias) All outcomes | Low risk | 602/602 randomly assigned women were included in the ITT analysis |
| Selective reporting (reporting bias) | Low risk | All expected outcomes were reported |
| Other bias | Low risk | No other potential bias identified |
Elzeiny 2014.
| Study characteristics | ||
| Methods | Randomised controlled parallel trial | |
| Participants | 44 couples Inclusion criteria: adults who had primary or secondary infertility ≥ 1 year in duration with evidence of ovulation and tubal patency, aged 18 to 42 years for females and 18 to 60 years for males Exclusion criteria: IUI or IVF treatment in the previous 12 months, coital disorder, untreated ovulatory disorders or endometriosis (AFS criteria grades 2 to 4), tubal obstruction, abnormal semen analyses (concentration < 20 × 106/mL, progressive motility < 25%, abnormal morphology > 95% or positive sperm antibodies) or any contraindication for multiple pregnancy |
|
| Interventions | IVF vs IUI | |
| Outcomes | Live birth rate, clinical pregnancy rate, multiple pregnancy rate, OHSS, cost per live birth | |
| Notes | Financial support provided by a pharmaceutical company. | |
| Risk of bias | ||
| Bias | Authors' judgement | Support for judgement |
| Random sequence generation (selection bias) | Low risk | "computer‐generated, adaptive‐biased coin randomisation schedule" |
| Allocation concealment (selection bias) | Low risk | "sequentially numbered opaque sealed envelopes" |
| Blinding (performance bias and detection bias) All outcomes | Unclear risk | This was not mentioned |
| Incomplete outcome data (attrition bias) All outcomes | Low risk | 43/44 randomly assigned women were included in the analysis |
| Selective reporting (reporting bias) | Low risk | Study reported primary and secondary treatment outcomes adequately including adverse outcomes |
| Other bias | Low risk | No other potential bias could be observed |
Goldman 2014.
| Study characteristics | ||
| Methods | Randomised controlled parallel trial, with clinicians blinded to outcome determinations. Intention‐to‐treat analysis performed, numbers of and reasons for withdrawals and dropouts stated, clearly defined interventions applied with standardised protocols, couples followed up until discharge from the hospital of both mother and infant(s), if pregnant, or 1 year after completion of treatment protocol. Tables with permuted blocks of varying sizes, stratified by the woman's age (38th to 41st vs 42nd to 43rd birthday) | |
| Participants | 154 couples Inclusion criteria: couples with ≥ 6 months of unexplained infertility and the woman aged between 38 and 42 years; at least 1 ovary and ipsilateral patent fallopian tube confirmed by hysterosalpingogram or laparoscopy; regular menstrual cycles of 21 to 45 days; and no pelvic pathology, ectopic pregnancy, or previous infertility treatment (except up to 3 cycles of clomiphene without IUI). Normal prolactin and thyroid‐stimulating hormone levels and BMI < 38 in the woman; sperm concentration > 15 million total motile sperm or > 5 million total motile sperm at reflex IUI preparation in the male partner Exclusion criteria: age outside the range, prior infertility treatment or not a candidate for study treatments, or not covered by a participating insurer |
|
| Interventions | 3‐arm randomised controlled trial. Couples were randomly assigned to treatment with 2 cycles of CC and IUI, FSH/IUI, or immediate IVF, followed by 3 cycles of IVF if not pregnant. | |
| Outcomes | Live birth, clinical pregnancy, multiple pregnancy, and time to conception were reported. | |
| Notes | Study population consisted of women with relatively advanced reproductive age. | |
| Risk of bias | ||
| Bias | Authors' judgement | Support for judgement |
| Random sequence generation (selection bias) | Low risk | "The allocation sequence was generated by an independent biostatistician", using tables with permuted blocks of varying sizes, stratified by the woman's age (38th to 41st vs 42nd to 43rd birthday).While, the exact method of random sequence generation was not mentioned, we categorized it as low risk of bias for randomization as the available information indicates that randomization sequence was generated. |
| Allocation concealment (selection bias) | Low risk | Remote allocation: "The allocation sequence was implemented by an epidemiologist. Randomization was never conducted by clinical staff" |
| Blinding (performance bias and detection bias) All outcomes | Low risk | All clinical investigators were blinded to outcome determinations |
| Incomplete outcome data (attrition bias) All outcomes | Low risk | 154/154 randomly assigned women were included in the ITT analysis |
| Selective reporting (reporting bias) | Low risk | Live birth, clinical pregnancy, multiple pregnancy and time to conception were reported |
| Other bias | Low risk | No other potential bias could be observed |
Goverde 2000.
| Study characteristics | ||
| Methods | Randomised controlled parallel trial; participants and providers unable to be blinded; intention‐to‐treat analysis performed; numbers of and reasons for withdrawals and dropouts stated; clearly defined interventions applied with standardised protocols; overall duration of follow‐up 6 cycles. Computer‐generated randomisation schedule, administered by numbered masked and sealed envelopes | |
| Participants | 181 women with unexplained or mild male factor infertility of at least 3 years' duration or male subfertility for ≥ 1 year, with no abnormality found during full infertility investigation, which included basal body temperature chart, late luteal phase endometrial biopsy, postcoital test, hysterosalpingogram, diagnostic laparoscopy, and ≥ 2 semen analyses. Exclusion criteria included cycle disorders, untreated endometriosis (AFS grade 2 to 4), and bilateral occluded tubes. | |
| Interventions | IVF vs IUI and IVF vs IUI + OS | |
| Outcomes | LBR per woman/couple | |
| Notes | Power calculation mentioned. Number of dropouts before completion of treatment: IUI, 19 couples out of 86 randomly assigned; IUI + OS, 16 out of 85 randomly assigned; IVF, 39 out of 87 randomly assigned (figures include couples with unexplained subfertility and mild male factor subfertility) |
|
| Risk of bias | ||
| Bias | Authors' judgement | Support for judgement |
| Random sequence generation (selection bias) | Low risk | Randomisation was computer‐generated |
| Allocation concealment (selection bias) | Low risk | "numbered masked and sealed envelopes" |
| Blinding (performance bias and detection bias) All outcomes | Unclear risk | This was not mentioned |
| Incomplete outcome data (attrition bias) All outcomes | Low risk | 172/181 (95%) randomly assigned women with idiopathic subfertility were included in the analysis |
| Selective reporting (reporting bias) | Low risk | Study reported primary and secondary treatment outcomes adequately including adverse outcomes |
| Other bias | Low risk | Pre‐study power calculation was performed, and no other potential bias was observed |
Hughes 2004.
| Study characteristics | ||
| Methods | 139 women in a multicentre RCT. Randomisation was based on a blocked schedule using numbered, sealed, opaque envelopes and stratified by centre; female age (≥ 35 years); and presence or absence of abnormal sperm (total sperm count ≥ 20 million). Power calculation done. Intention‐to‐treat analysis performed. Fisher's exact test used for analysis. Confidence intervals calculated using Mantel‐Haenszel statistics. | |
| Participants | Duration of subfertility ≥ 2 years (defined as no live birth during that time), no previous IVF treatment, female age 18 to 39 years, day 3 serum FSH level ≥ 15 IU/L or standard level for inclusion in an individual centre's IVF programme, whichever level was lower; semen analysis within past 6 months showing adequate sperm number to perform ICSI, evidence of tubal patency by hysterosalpingography or laparoscopy Mean duration of subfertility was 58 months. All couples had exhausted appropriate lower‐intensity treatment options such as ovulation induction and IUI. |
|
| Interventions | First cycle of IVF compared with 90 days of no treatment (expectant management) | |
| Outcomes | Clinically viable pregnancy rate per couple, LBR per couple | |
| Notes | ||
| Risk of bias | ||
| Bias | Authors' judgement | Support for judgement |
| Random sequence generation (selection bias) | Low risk | States: "Random allocation was based". While, the exact method of random sequence generation was not mentioned, we categorized it as low risk of bias for randomization as the available information indicates that randomization sequence was generated. |
| Allocation concealment (selection bias) | Low risk | "Random allocation was based on a blocked schedule using numbered, sealed, opaque envelopes" |
| Blinding (performance bias and detection bias) All outcomes | Unclear risk | This was not mentioned |
| Incomplete outcome data (attrition bias) All outcomes | Low risk | 68/68 randomly assigned women analysed by intention‐to‐treat |
| Selective reporting (reporting bias) | Low risk | Study reported primary and secondary treatment outcomes adequately including adverse outcomes |
| Other bias | Low risk | Pre‐study power calculation was performed and no other potential bias could be observed |
Nandi 2017.
| Study characteristics | ||
| Methods | Single‐centre, parallel‐group RCT with a balanced randomisation (1:1); a simple randomisation procedure was followed. Allocation concealment was achieved using individual, consecutively numbered, opaque envelopes. All randomised couples were analysed in their allocated group as per intention‐to‐treat analysis. All participants were followed until the end of the study duration. Blinding was not possible due to the nature of the trial; however, this is unlikely to affect the objective outcome of the trial. Independent t‐tests or Mann‐Whitney tests were used to compare the 2 groups. Differences in the birth rate per group were expressed as risk ratios with the corresponding 95% confidence intervals. Data were analysed as live birth rates per couple. | |
| Participants | 207 couples were randomised. Inclusion criteria: eligible participants were couples with primary or secondary subfertility, of minimum 1‐year duration. Female partner aged between 23 and 37 completed years, BMI of 19 to 30, with a regular menstrual cycle of 21 to 35 days, day 2 FSH < 10 IU/L, and confirmed bilateral patent tubes. A mid‐luteal serum progesterone level was used to confirm ovulation. Male partner with normal semen parameters (i.e. sperm density > 15 million/mL, progressive motility > 40% and normal forms > 4% (WHO criteria), or total progressive motile sperm count > 5 million) Exclusion criteria: known uterine anomaly, physical disability, or having difficulty in achieving vaginal intercourse, and couples using donor sperm or previous fertility treatment such as IUI or IVF were excluded. Those with confirmed endometriosis of grade II to IV were also excluded. |
|
| Interventions | To evaluate the best first‐line management option for the treatment of unexplained subfertility. 207 couples were randomly assigned to 3 cycles of IUI with gonadotropin stimulation (n = 101) or 1 cycle of IVF (n = 106). | |
| Outcomes | CPR per randomised couple, miscarriage rate, LBR per randomised couple, singleton live birth per randomised couple, multiple pregnancies per live birth, OHSS cases per randomised participant | |
| Notes | Trial registration number: ISRCTN43430382. We contacted the study author, who provided additional information on randomisation. | |
| Risk of bias | ||
| Bias | Authors' judgement | Support for judgement |
| Random sequence generation (selection bias) | Low risk | "Computer generated simple randomisation procedure was followed" |
| Allocation concealment (selection bias) | Low risk | "Allocation concealment was achieved by using individual, consecutively numbered opaque envelopes" |
| Blinding (performance bias and detection bias) All outcomes | Unclear risk | "Due to the nature of the trial, blinding was not possible, this is unlikely to affect the outcome of the trial, as the outcome was objective" |
| Incomplete outcome data (attrition bias) All outcomes | Low risk | 207/207 randomly assigned couples were analysed by intention to treat |
| Selective reporting (reporting bias) | Low risk | Study reported primary and other relevant treatment outcomes adequately including adverse outcomes (multiple pregnancies and OHSS) |
| Other bias | Unclear risk | Sample size calculation was performed and 125 couples were considered to be required in each arm of the study, a total of 250 couples. However, study was terminated prematurely due to funding issues after randomising 207 couples. |
Reindollar 2010.
| Study characteristics | ||
| Methods | RCT using permuted blocks of varying sizes, stratified by woman's age (< 35 vs ≥ 35 years), laparoscopy within past year (yes or no), and study site (Boston IVF or Harvard Vanguard Medical Associates). Allocation sequence was produced by random numbers generated by a congruence method. Investigators were blinded to all outcome determinations. | |
| Participants | 503 couples; women 21 to 39 years of age with unexplained infertility and mild male factor of 12 months' duration | |
| Interventions | Couples in this study were randomly assigned to conventional pathway involving CC + IUI followed by IUI + gonadotropins and then IVF, or accelerated pathway (CC + IUI followed by 6 cycles of IVF). | |
| Outcomes | Pregnancy rate per cycle, pregnancy rate per couple, LBR per cycle, LBR per couple, time to pregnancy, charge data | |
| Notes | We could not include this study for comparison IVF versus IUI + CC, as both arms received CC + IUI. | |
| Risk of bias | ||
| Bias | Authors' judgement | Support for judgement |
| Random sequence generation (selection bias) | Low risk | "The allocation sequence was produced by use of random numbers generated by a congruence method. The sequence was developed by the biostatistician and implemented by the epidemiologist" |
| Allocation concealment (selection bias) | Low risk | Apparently remote allocation: "The sequence was ...implemented by the epidemiologist" |
| Blinding (performance bias and detection bias) All outcomes | Low risk | Investigators were blinded to all outcome determinations; allocation was performed by a biostatistician and was implemented by an epidemiologist |
| Incomplete outcome data (attrition bias) All outcomes | Low risk | 503/503 randomly assigned women analysed by intention‐to‐treat |
| Selective reporting (reporting bias) | Low risk | All the primary and secondary outcomes including cost effectiveness reported. |
| Other bias | Low risk | No other potential biases could be detected |
Soliman 1993.
| Study characteristics | ||
| Methods | RCT; participant and provider could not be blinded. Follow‐up was 1 cycle in the IVF group and 6 months in the expectant management group. | |
| Participants | 245 couples with infertility for 1 year, completed investigation for infertility, woman < 40 years. Mean duration of infertility 65 months, all previously treated by conventional means. Only 35 couples had unexplained infertility and were included in analysis for this review. |
|
| Interventions | IVF vs expectant management. Duration of expectant management was 6 months, during which time other treatments (apart from IVF) were permitted. | |
| Outcomes | Pregnancy rate per woman/couple | |
| Notes | Computer‐generated random number table. 16 cycles (16.2%) cancelled after start of treatment for various reasons. For couples randomly assigned to expectant treatment, any form of infertility treatment other than IVF was permitted for the 6‐month expectant management arm. 78% of couples received some form of infertility treatment except IVF while in the expectant arm. Despite randomisation, a significant difference was noted in mean ages of participants between the 2 study arms. |
|
| Risk of bias | ||
| Bias | Authors' judgement | Support for judgement |
| Random sequence generation (selection bias) | Low risk | Randomisation was computer‐generated |
| Allocation concealment (selection bias) | Unclear risk | This was not mentioned |
| Blinding (performance bias and detection bias) All outcomes | Unclear risk | No blinding was performed because of the nature of the intervention used |
| Incomplete outcome data (attrition bias) All outcomes | High risk | No intention‐to‐treat analysis was performed. 19% of participants overall withdrew (unclear how many with unexplained infertility withdrew) |
| Selective reporting (reporting bias) | Unclear risk | Information was insufficient for judgement of the trial as low risk or high risk |
| Other bias | High risk | Withdrawals were numerous; exact time of withdrawal was not defined, especially for the expectant management group. Groups were not balanced with regard to prognostic factors: IVF group were older and had higher proportion with endometriosis |
van Rumste 2014.
| Study characteristics | ||
| Methods | Multicentre RCT | |
| Participants | 116 couples with unexplained and mild male factor infertility. All couples had a standard fertility workup, including assessment of ovulation by basal temperature curve or ultrasound, a tubal patency test, and sperm analysis. This study included all couples with unexplained or mild male subfertility, female age between 18 and 38 years and poor fertility prospects, defined as a 12‐month prognosis < 30% for natural conception according to the model of Hunault 2004. | |
| Interventions | 1 cycle of IVF‐eSET followed by 1 cryo cycle or 3 cycles of IUI + OS. Results of freeze–thaw cycles were also included in this study, provided the transfer took place within 4 months after randomisation. | |
| Outcomes | Ongoing pregnancy rate per woman/couple, cost per cycle | |
| Notes | We requested additional data on methods and outcomes from lead author. | |
| Risk of bias | ||
| Bias | Authors' judgement | Support for judgement |
| Random sequence generation (selection bias) | Low risk | Central Internet‐based randomisation was stratified by centre |
| Allocation concealment (selection bias) | Low risk | This was not mentioned. However, central web‐based randomisation incorporates allocation concealment, hence we catergorized the study as low risk of bias for allocation concealment |
| Blinding (performance bias and detection bias) All outcomes | Unclear risk | This was not mentioned |
| Incomplete outcome data (attrition bias) All outcomes | Low risk | Intention‐to‐treat analysis was performed |
| Selective reporting (reporting bias) | Low risk | No other reports on the trial could be retrieved |
| Other bias | Low risk | No other potential bias was noted |
AFS: American Fertility Society BMI: body mass index CC: clomiphene citrate CPR: clinical pregnancy rate eSET: elective single‐embryo transfer FSH: follicle‐stimulating hormone ICSI: intracytoplasmic sperm injection IU: international units IUI: intrauterine insemination IUI‐COH: intrauterine insemination‐controlled ovarian hyperstimulation IVF: in vitro fertilisation IVF‐SET: in vitro fertilisation‐single‐embryo transfer LBR: live birth rate OHSS: ovarian hyperstimulation syndrome OS: ovarian stimulation RCT: randomised controlled trial WHO: World Health Organization
Characteristics of excluded studies [ordered by study ID]
| Study | Reason for exclusion |
|---|---|
| Crosignani 1991 | Multicentre RCT comparing the effectiveness of IVF vs IUI + gonadotropins and IVF vs GIFT. Pregnancy rate per cycle and LBR per cycle were reported outcomes. |
| Custers 2012 | Couples with unexplained subfertility and intermediate prognosis of natural conception were randomly allocated to 6 months EM or immediate start with IUI‐COS; no IVF arm. |
| Jarrell 1993 | Diagnostic stratification not done, therefore number of participants with unexplained infertility is not known. Control group could include participants who underwent some form of fertility treatment while awaiting spontaneous pregnancy. |
| Karande 1998 | Diagnostic stratification not done. Study population included all categories of infertile couples. Couples with unexplained infertility were not analysed separately. |
| Leeton 1987 | Although study authors describe the study as RCT, on closer inspection the method of allocation was found to be non‐random. Every second participant was allocated to the GIFT group. |
| Raneiri 1995 | No intervention of interest (GIFT excluded from 2011 review update) |
| Tanbo 1990 | No intervention of interest (GIFT excluded from 2011 review update) |
| Zayed 1997 | Randomisation was not genuine. Study authors describe method of randomisation as pseudo‐randomisation. Allocation of treatment was breached by participant preference. Pregnancy and LBR per woman/couple not reported. |
EM: expectant management COS: controlled ovarian stimulation GIFT: gamete intrafallopian transfer IUI: intrauterine insemination IVF: in vitro fertilisation LBR: live birth rate RCT: randomised controlled trial
Characteristics of ongoing studies [ordered by study ID]
Prentice 2020.
| Study name | IVF and IUI in couples with unexplained infertility (FIIX study): study protocol of a non‐inferiority randomized controlled trial |
| Methods | Randomised controlled trial |
| Participants | Women with unexplained infertility |
| Interventions | IVF vs 4 cycles of IUI + OS with clomiphene citrate in 1 arm |
| Outcomes | Cumulative live birth rate, time to pregnancy, ongoing pregnancy, multiple pregnancy, miscarriage, ectopic pregnancy, incremental cost per live birth, quality of life, hospital admission due to OHSS, serious adverse event |
| Starting date | 02/08/2019 |
| Contact information | Cynthia M Farquhar, Fertility Plus, National Women’s Hospital, Auckland District Health Board, Auckland, New Zealand, Department of Obstetrics and Gynaecology, University of Auckland, Auckland, New Zealand |
| Notes | Trial registration number: ACTRN12619001003167 |
IUI: intrauterine insemination IVF: in vitro fertilisation OHSS: ovarian hyperstimulation syndrome OS: ovarian stimulation
Differences between protocol and review
We removed gamete intrafallopian transfer as an intervention in the review. We replaced the primary outcome of cumulative live birth rate per woman with live birth rate per woman, and the secondary outcome of cumulative pregnancy rate per woman with clinical pregnancy rate per woman, as the majority of in vitro fertilisation (IVF) studies reported live birth and clinical pregnancy following one embryo transfer as the primary outcome. For the comparison IVF versus intrauterine insemination (IUI) + ovarian stimulation with gonadotropins, we performed stratified analysis based on pretreatment status. We added the comparison IVF versus IUI + letrozole.
We edited the definition of live birth (Zegers‐Hochschild 2017).
Contributions of authors
Sesh Kamal Sunkara: screening of studies, data extraction, trial selection, quality assessment, data entry, analysis and updating the review.
Mohan S Kamath: update of the review. He also independently selected trials for inclusion in the review, extracted data, and performed risk of bias assessment and quality assessment of the selected trials.
Zabeena Pandian: development of the protocol, literature search, data extraction, trial selection, quality assessment, data entry, analysis, writing of previous drafts of the review.
Ahmed Gibreel: trial selection, quality assessment, data extraction, and analysis for the updated review.
Siladitya Bhattacharya: initiation of the original review, trial selection, quality assessment, responsible for final draft of the updated review.
Sources of support
Internal sources
-
Department of Obstetrics & Gynaecology, University of Aberdeen, UK
Research time for Prof Bhattacharya
External sources
-
None, Other
None
Declarations of interest
SKS: member European Society of Human Reproduction and Embryology (ESHRE) guideline development group on Unexplained Infertility. Speaker at non‐promotional scientific meetings organised by Ferring, Merck, MSD.
MSK: is an editor of Cochrane Gynaecology and Fertility. He was not involved in the editorial process or decision‐making for this article.
ZP: none in relation to this work.
AG: none in relation to this work.
SB: invited speaker at scientific meetings organised by Ferring, Merck, Organon. Speaker fees paid to University of Aberdeen. Author of a book on infertility (Cambridge University Press) that generates royalties. Member ESHRE guideline development group on Unexplained Infertility.
New search for studies and content updated (no change to conclusions)
References
References to studies included in this review
Bensdorp 2015 {published data only}
- Bensdorp AJ, Tjon-Kon-Fat RI, Bossuyt PMM, Koks CA, Oosterhuis GJ, Hoek A, et al. Prevention of multiple pregnancies in couples with unexplained or mild male subfertility: a randomised controlled trial comparing in vitro fertilisation with single embryo transfer or in vitro fertilisation in a modified natural cycle to intrauterine insemination with controlled ovarian stimulation. BMJ 2015;9(350):g7771. [DOI] [PMC free article] [PubMed] [Google Scholar]
Elzeiny 2014 {published data only}
- Elzeiny H, Garrett C, Toledo M, Stern K, McBain J, William H, et al. A randomised controlled trial of intra-uterine insemination versus in vitro fertilisation in patients with idiopathic or mild male factor. Australian and New Zealand Journal of Obstetrics & Gynaecology 2014;54:156-61. [DOI] [PubMed] [Google Scholar]
Goldman 2014 {published data only}
- Goldman MB, Thornton KL, Ryley D, Alper MM, June L, Fung JL, et al. A randomized clinical trial to determine optimal infertility treatment in older couples: the Forty and Over Treatment Trial (FORT-T). Fertility and Sterility 2014;101(6):1574–81. [DOI] [PMC free article] [PubMed] [Google Scholar]
Goverde 2000 {published data only}
- Goverde AJ, McDonnell J, Vermeiden JPW, Schats R, Rutten FFH, Schoemaker J. Intrauterine insemination or in vitro fertilisation in idiopathic subfertility and male subfertility: a randomised trial and cost-effectiveness analysis. Lancet 2000;355:13-8. [DOI] [PubMed] [Google Scholar]
Hughes 2004 {published data only}
- Hughes EG, Beecroft ML, Wilkie V, Burville L, Claman P, Tummon I, et al. A multicentre randomized controlled trial of expectant management versus IVF in women with fallopian tube patency. Human Reproduction 2004;19(5):1105-9. [DOI] [PubMed] [Google Scholar]
Nandi 2017 {published data only}
- Nandi A, Bhide P, Hooper R, Gudi A, Shah A, Khan K, et al. Intrauterine insemination with gonadotropin stimulation or in vitro fertilization for the treatment of unexplained subfertility: a randomized controlled trial. Fertility and Sterility 2017;107(6):1329-35. [DOI] [PubMed] [Google Scholar]
Reindollar 2010 {published data only}
- Reindollar RH, Regan MM, Neumann PJ, Levine BS, Thornton KL, Alper MM, et al. A randomized clinical trial to evaluate optimal treatment for unexplained infertility: the fast track and standard treatment (FASTT) trial. Fertility and Sterility 2010;94(3):888-99. [DOI] [PubMed] [Google Scholar]
Soliman 1993 {published data only}
- Soliman S, Daya S, Collins J, Jarrell J. A randomized trial of in vitro fertilization versus conventional treatment for infertility. Fertility and Sterility 1993;59(6):1239-44. [DOI] [PubMed] [Google Scholar]
van Rumste 2014 {published data only}
- Custers IM, Konig TE, Broekmans FJ, Hompes P, Kaaijk E, Oosterhuis J, et al. Couples with unexplained subfertility and unfavourable prognosis; a randomized pilot trial comparing the effectiveness of IVF-eSET and IUI-COS. Fertility and Sterility 2011;96(5):1107-11. [DOI] [PubMed] [Google Scholar]
- Rumste MME, Custers IM, Koks CA, Weering HGI, Beckers NGM, Scheffer GJ, et al. IVF with planned single-embryo transfer versus IUI with ovarian stimulation in couples with unexplained subfertility: an economic analysis. Reproductive Biomedicine Online 2014;28(3):336-42. [DOI] [PubMed] [Google Scholar]
- Rumste MME, Custers IM, Koks CA, Weering HGI, Beckers NGM, Scheffer GJ, et al. IVF with single embryo transfer versus IUI with ovarian hyperstimulation in couples with unexplained subfertility, an economic analysis. In: Abstracts of the 25th Annual Meeting of ESHRE; 2009 June 28-July 1; Amsterdam, the Netherlands. 25:0-110 Oral.
References to studies excluded from this review
Crosignani 1991 {published data only}
- Crosignani PG, Walters DE, Soliani A. Addendum to the ESHRE multicentre trial: a summary of the abortion and birth statistics. Human Reproduction 1992;2(7):286-7. [DOI] [PubMed] [Google Scholar]
Custers 2012 {published data only}
- Custers IM, Rumste ME, Steeg JW, Wely M, Hompes PG, Bossuyt P, et al. Long-term outcome in couples with unexplained subfertility and an intermediate prognosis initially randomized between expectant management and immediate treatment. Human Reproduction 2012;27(2):444-50. [DOI] [PubMed] [Google Scholar]
Jarrell 1993 {published data only}
- Jarrell JF, Labelle R, Goeree R, Milner R, Collins J. In vitro fertilisation and embryo transfer: a randomised controlled trial. Online Journal of Current Clinical Trials 1993;Document number 73:73. [PubMed]
Karande 1998 {published data only}
- Karande VC, Korn A, Morris A, Pao R, Balin M, Rinehart J, et al. Prospective randomized trial comparing the outcome and cost of in vitro fertilisation with that of a traditional treatment algorithm as first line therapy for couples with unexplained infertility. Fertility and Sterility 1998;71(3):468-75. [DOI] [PubMed] [Google Scholar]
Leeton 1987 {published data only}
- Leeton J, Rogers P, Caro C, Healy D, Yates C. A controlled study between the use of gamete intrafallopian transfer and in vitro fertilisation and embryo transfer in the management of idiopathic and male infertility. Fertility and Sterility 1987;48(4):605-7. [DOI] [PubMed] [Google Scholar]
Raneiri 1995 {published data only}
- Raneiri M, Beckett VA, Marchant S, Kinis A, Serhal P. Gamete intrafallopian transfer or in vitro fertilisation after failed ovarian stimulation and intrauterine insemination in unexplained infertility. Human Reproduction 1995;10(8):2023-6. [DOI] [PubMed] [Google Scholar]
Tanbo 1990 {published data only}
- Tanbo T, Dale PO, Jarrell J. Assisted fertilization in infertile women with patent fallopian tubes. A comparison of in-vitro fertilization, gamete intra-fallopian transfer and tubal embryo stage transfer. Human Reproduction 1990;3(5):266-70. [DOI] [PubMed] [Google Scholar]
Zayed 1997 {published data only}
- Zayed F, Lenton EA, Cooke ID. Comparison between stimulated in-vitro fertilization and stimulated intrauterine insemination for the treatment of unexplained and mild male factor infertility. Human Reproduction 1997;12(11):2408-13. [DOI] [PubMed] [Google Scholar]
References to ongoing studies
Prentice 2020 {published data only}
- Prentice L, Sadler L, Lensen S, Vercoe M, Wilkinson J, Edlin R, et al. IVF and IUI in couples with unexplained infertility (FIIX study): study protocol of a non-inferiority randomized controlled trial. Human Reproduction Open 2020;2020(3):hoaa037. [DOI] [PMC free article] [PubMed] [Google Scholar]
Additional references
Bhattacharya 2008
- Bhattacharya S, Harrild K, Mollison J, Wordsworth S, Tay C, Harrold A, et al. Clomifene citrate or unstimulated intrauterine insemination compared with expectant management for unexplained infertility: pragmatic randomised controlled trial. BMJ 2008;337:a716. [DOI: 10.1136/bmj] [DOI] [PMC free article] [PubMed] [Google Scholar]
Collins 1995
- Collins JA, Burrows EA, Willan AR. The prognosis for live birth among untreated infertile couples. Fertility and Sterility 1995;64:22-8. [MEDLINE: ] [PubMed] [Google Scholar]
Danhof 2020
- Danhof NA, Wang R, Wely M, Veen F, Mol BWJ, Mochtar MH. IUI for unexplained infertility – a network meta-analysis. Human Reproduction Update 2020;26(1):1-15. [DOI] [PubMed] [Google Scholar]
De Geyter 2018
Deeks 2001
- Deeks JJ, Altman DG, Bradburn MJ. Statistical methods for examining heterogeneity and combining results from several studies in meta-analysis. In: Egger N, Davey Smith G, Altman DG, editors(s). Systematic Reviews in Healthcare: Meta-Analysis in Context. 2nd edition. London: BMJ Publishing Group, 2001:285–312. [Google Scholar]
DerSimonian 1986
- DerSimonian R, Laird N. Meta-analysis in clinical trials. Controlled Clinical Trials 1986;7:177-88. [DOI] [PubMed] [Google Scholar]
Duffy 2018
- Duffy JMN, Bhattacharya S, Curtis C, Evers JLH, Farquharson RG, Franik S, et al. A protocol developing, disseminating and implementing a core outcome set for infertility. Human Reproduction Open 2018;3:1–6. [DOI] [PMC free article] [PubMed] [Google Scholar]
Duffy 2020
- Duffy JMN, AlAhwany H, Bhattacharya S, Collura B, Curtis C, Evers JLH, et al. Developing a core outcome set for future infertility research: an international consensus development study. Human Reproduction 2020;35(12):2725. [DOI] [PMC free article] [PubMed] [Google Scholar]
GRADEpro GDT [Computer program]
- GRADEpro GDT. Version accessed 4 June 2021. Hamilton (ON): McMaster University (developed by Evidence Prime, Inc.). Available from gradepro.org.
Guzick 1999
- Guzick DS, Carson SA, Coutifaris C, Overstreet JW, Factor-Litvak P, Steinkampf MP, et al. Efficacy of superovulation and intrauterine insemination in the treatment of infertility. National Cooperative Reproductive Medicine Network. New England Journal of Medicine 1999;340(3):177-83. [DOI] [PubMed] [Google Scholar]
HFEA 2019
- Human Fertilisation and Embryology Authority. Fertility treatment 2019: trends and figures. www.hfea.gov.uk/about-us/publications/research-and-data/fertility-treatment-2019-trends-and-figures.
Higgins 2011
- Higgins JPT, Altman DG, and Sterne JAC on behalf of the Cochrane Statistical Methods Group and the Cochrane Bias Methods Group. Chapter 8: Assessing risk of bias in included studies. In: Higgins JP, Green S, editor(s). Cochrane Handbook for Systematic Reviews of Interventions Version 5.1.0 (updated March 2011). The Cochrane Collaboration, 2011. Available from training.cochrane.org/handbook/archive/v5.1/.
Higgins 2023
- Higgins JPT, Thomas J, Chandler J, Cumpston M, Li T, Page MJ, Welch AV (editors). Cochrane Handbook for Systematic Reviews of Interventions Version 6.4 (updated August 2023). Cochrane, 2023. Available from www.training.cochrane.org/handbook..
Hughes 2010
- Hughes E, Collins J, Vanderkerchove P. Clomiphene citrate for unexplained subfertility in women. Cochrane Database of Systematic Reviews 2010, Issue 1. Art. No: CD000057. [DOI: 10.1002/14651858.CD000057.pub2] [PMID: PMID: 20091498] [DOI] [PMC free article] [PubMed] [Google Scholar]
Hunault 2004
- Hunault CC, Habbema JD, Eijkemans MJ, Collins JA, Evers JL, te Velde ER. Two new prediction rules for spontaneous pregnancy leading to live birth among subfertile couples, based on the synthesis of three previous models. Human Reproduction 2004;19(9):2019-26. [DOI] [PubMed] [Google Scholar]
Lenton 1977
- Lenton EA, Weston GA, Cooke ID. Long term follow up of apparently normal couple with a complaint of infertility. Fertility and Sterility 1977;28:913-9. [DOI] [PubMed] [Google Scholar]
Maheshwari 2008
- Maheshwari M, Hamilton M, Bhattacharya S. Effect of female age on the diagnostic categories of infertility. Human Reproduction 2008;23:538-42. [DOI] [PubMed] [Google Scholar]
NICE 2013
- National Institute for Health and Care Excellence. Clinical guideline [CG156] Fertility problems: assessment and treatment. https://www.nice.org.uk/guidance/cg156 (accessed 21 November 2021). [PubMed]
Review Manager 2020 [Computer program]
- Review Manager 5 (RevMan 5). Version 5.4. Copenhagen: The Cochrane Collaboration, 2020.
SART 2020
- SART. National Summary Report for 2020. sartcorsonline.com/Csr/Public?ClinicPKID=0&reportingYear=2020&newReport=True#patient-first-attempt (accessed 22 September 2023).
Schulz 1995
- Schulz KF, Chalmers I, Hayes RJ, Altman DG. Empirical evidence of bias. Dimensions of methodological quality associated with estimates of treatment effects in controlled trials. JAMA 1995;273:408-12. [DOI] [PubMed] [Google Scholar]
Snick 1997
- Snick HKA, Snick TS, Evers JLH, Collins JA. The spontaneous pregnancy prognosis in untreated subfertile couples: the Walcheren primary care study. Human Reproduction 1997;12(7):1582-8. [DOI] [PubMed] [Google Scholar]
Steures 2006
- Steures P, Steeg JW, Hompes PG, Habbema JD, Eijkemans MJ, Broekmans FJ, et al. Intrauterine insemination with controlled ovarian hyperstimulation versus expectant management for couples with unexplained subfertility and an intermediate prognosis: a randomised clinical trial. Lancet 2006;368(9531):216-21. [DOI] [PubMed] [Google Scholar]
Steures 2008
- Steures P, Steeg JW, Hompes PG, Bossuyt PM, Veen F, Habbema JD, et al. Intra-uterine insemination with controlled ovarian hyperstimulation compared to an expectant management in couples with unexplained subfertility and an intermediate prognosis: a randomised study. Nederlands Tijdschrift voor Geneeskunde 2008;152(27):1525-31. [PubMed] [Google Scholar]
Wang 2019
- Wang R, Danhof NA, Tjon-Kon-Fat RI, Eijkemans MJ, Bossuyt PM, Mochtar MH, et al. Interventions for unexplained infertility: a systematic review and network meta-analysis. Cochrane Database of Systematic Reviews 2019, Issue 9. Art. No: CD012692. [DOI: 10.1002/14651858.CD012692.pub2] [DOI] [PMC free article] [PubMed] [Google Scholar]
Zegers‐Hochschild 2017
- Zegers-Hochschild F, Adamson GD, Dyer S, Racowsky C, Mouzon J, Sokol R, et al. The International Glossary on Infertility and Fertility Care, 2017. Fertility and Sterility 2017;108(3):393-406. [DOI] [PubMed] [Google Scholar]
References to other published versions of this review
Pandian 2001
- Pandian Z, Bhattacharya S, Nikolaou D, Vale L, Templeton A. In vitro fertilisation for unexplained subfertility. Cochrane Database of Systematic Reviews 2001, Issue 4. Art. No: CD003357. [DOI: 10.1002/14651858.CD003357] [DOI] [PubMed] [Google Scholar]
Pandian 2002
- Pandian Z, Bhattacharya S, Nikolaou D, Vale L, Templeton A. In vitro fertilisation for unexplained subfertility. Cochrane Database of Systematic Reviews 2002, Issue 2. Art. No: CD003357. [DOI: 10.1002/14651858.CD003357] [DOI] [PubMed] [Google Scholar]
Pandian 2005
- Pandian Z, Bhattacharya S, Vale L, Templeton A. In vitro fertilisation for unexplained subfertility. Cochrane Database of Systematic Reviews 2005, Issue 2. Art. No: CD003357. [DOI: 10.1002/14651858.CD003357.pub2] [DOI] [PubMed] [Google Scholar]
Pandian 2012
- Pandian Z, Gibreel A, Bhattacharya S. In vitro fertilisation for unexplained subfertility. Cochrane Database of Systematic Reviews 2012, Issue 4. Art. No: CD003357. [DOI: 10.1002/14651858.CD003357.pub3] [DOI] [PubMed] [Google Scholar]
Pandian 2015
- Pandian Z, Gibreel A, Bhattacharya S. In vitro fertilisation for unexplained subfertility. Cochrane Database of Systematic Reviews 2015, Issue 11. Art. No: CD003357. [DOI: 10.1002/14651858.CD003357.pub4] [DOI] [PMC free article] [PubMed] [Google Scholar]