

SUMMARY
Objective:
There is continued debate as to how engaging in physical activity (PA), including moderate-to-vigorous PA (MVPA), light PA (LPA), and sedentary time (SED), affects one’s risk for knee osteoarthritis (OA). Traditional regression methods do not account for the codependence of these categories of PA, whereby when one category increases, the others must decrease. Thus, we used compositional data analysis (CoDA) to examine time spent in each category of PA, or PA composition, and its association with loss of knee joint space width (JSW), a common indicator of knee OA progression.
Methods:
We performed a secondary analysis of data from a subset of participants in the Osteoarthritis Initiative. These participants had minute-by-minute activity data collected over 7 days at baseline; we then categorized each minute as MVPA, LPA, or SED. Our exposure, PA composition, represented min/day spent in each category. Our outcome, medial JSW loss, was the difference in medial tibiofemoral JSW from baseline to 2 years later. We employed CoDA, using an isometric log-ratio transformation, to examine the association of PA composition with medial JSW loss over 2 years, adjusting for potential confounders.
Results:
We included 969 participants (age: 64.5 years, 56% female, body mass index [BMI]: 28.8 kg/m2). Mean PA composition was: MVPA 9.1 min/day, LPA 278 min/day, SED 690 min/day. Per adjusted regression models, higher MVPA was not associated with greater medial JSW loss (β = −0.0005, P = 0.97), nor was LPA (β = 0.06, P = 0.27) or SED (β = −0.06, P = 0.21).
Conclusion:
Using CoDA, PA composition was not associated with medial JSW loss over 2 years.
Keywords: Osteoarthritis, Physical activity, Compositional data analysis
Introduction
Knee osteoarthritis (OA) is often considered to be a mechanically driven disease. As such, reduced loading of the knees has been considered a possible prevention strategy, which could include limiting daily physical activity (PA). Early studies concluded that higher engagement in PA increased one’s risk for structural progression of knee OA1–3. However, more recent studies have highly mixed findings; they concluded that PA could be harmful4,5, beneficial6–8, or have no effect9–12 on risk for knee OA progression.
Why did these studies, many of which used the same large data sets, yield such mixed findings? One possible explanation relates to how they defined, analyzed, and/or categorized PA. Generally, PA is defined as “any bodily movement produced by skeletal muscle that results in energy expenditure”13, and is often divided into categories based on the intensity of movement: 1) moderate-to-vigorous intensity PA (MVPA), which includes moderate activities like brisk walking and jogging, and more vigorous activities like running; 2) light intensity PA (LPA), which includes slow walking and light housework; and 3) sedentary time (SED), which includes quiet standing, sitting, and reclining14.
Previous studies focused on one or two categories of PA (e.g., MVPA, SED) and examined how they independently affected the knee joint; that is, an assumption was made that one category (MVPA, LPA, and SED) could vary independently of the other categories. However, if a person were to increase time in MVPA, they would also decrease time in LPA and/or SED because the total time in a day is fixed (1,440 min). Thus, to truly understand the effect of higher MVPA on the knees, one must also account for the effects of lower LPA and/or SED. By analyzing the “complete picture” of PA, one can avoid potentially misleading results that occur when categories of PA are examined independently15–17.
Thus, we aimed to evaluate the association of PA composition, which accounts for time in MVPA, LPA, and SED, with loss of knee joint space width (JSW), an indicator of structural progression of knee OA. Specifically, we examined how a simulated difference in a category of PA (and corresponding difference in the other categories) was associated with a difference in JSW loss over the following 2 years. First, we hypothesized that spending more time in MVPA (and less time in LPA and SED) would not be associated with JSW loss over 2 years. This is because previous studies that used our same data set (from the Osteoarthritis Initiative), though they did not use compositional data analysis (CoDA), most consistently found no independent association of MVPA with JSW loss10–12.
Second, we hypothesized that spending more time in LPA (and less time in MVPA and SED) would be associated with lower JSW loss. Previous studies have not examined the independent association of LPA with JSW loss, but it has been suggested that low-impact activities (which often fall in the category of LPA) promote cartilage health18. Third, we hypothesized that spending more time in SED (and less time in MVPA and LPA) would be associated with greater JSW loss. We suspected that unloading the knees during SED, coupled with minimal loading throughout the rest of the day (i.e., less time in MVPA and LPA), could lead to early degenerative changes in knee cartilage4,19 and/or cartilage thinning20–22.
Methods
Study design
We performed a secondary analysis of longitudinal data from the Osteoarthritis Initiative (OAI), an NIH/NIA-funded cohort study of 4,796 adults with (or at risk for) knee OA at enrollment23. OAI data are publicly available at https://nda.nih.gov/oai/.
Setting
Adults enrolled in the OAI between 2004 and 2006 at study sites in Columbus, Ohio, Baltimore, Maryland, Pittsburgh, Pennsylvania, and Pawtucket, Rhode Island. All clinical data and radiographic images were collected at these sites. Institutional review boards at all sites approved the study protocol, and all participants provided written informed consent23.
Participants
Details about recruitment and inclusion/exclusion criteria for the OAI can be found in its study protocol23. Briefly, the OAI enrolled adults aged 45–79 years, who 1) had a radiographic diagnosis and symptoms of knee OA (Progression cohort), or 2) had major risk factors but no diagnosis or symptoms of knee OA (Incidence cohort), or 3) had no major risk factors and no diagnosis or symptoms of knee OA (Reference [Nonexposed] cohort)23.
A subset of 2,127 OAI participants, including adults from all three cohorts, enrolled in an ancillary study24 in which investigators collected their minute-by-minute accelerometry data at the 48-month visit. Because this was the first visit at which accelerometry data were collected, we refer to the 48-month visit as the study baseline.
Key variables
Exposure: PA composition at baseline
To determine the PA composition of each participant, we assessed time (min/day) at baseline in each of the following, mutually exclusive categories: 1) MVPA, 2) LPA, and 3) SED. PA was assessed for 7 days using the ActiGraph GT1M monitor (ActiGraph LLC, Pensacola, FL), a hip-worn accelerometer that produces a weighted sum of activity counts each minute. An activity count is a unit of acceleration (in the vertical plane) that correlates to the speed or intensity of bodily movement, thus allowing us to categorize each minute as MVPA, LPA, or SED. The Actigraph GT1M monitor provides a valid25 and reliable26 assessment of PA in adults, including those with knee OA27.
First, we applied a definition of nonwear (i.e., time that we assumed the participant was not wearing the monitor) that was developed using OAI data27: a period of at least 90 consecutive minutes with zero activity counts, allowing for up to 2 nonconsecutive minutes with low activity counts (<100 counts/min). After removing periods of nonwear, we restricted our analysis to participants who wore the ActiGraph GT1M monitor for 4–7 days28 and at least 10 h/day29, as this is needed to provide a valid representation of their PA.
Next, we categorized each minute of wear time in a day using established cut-points28: 1) MVPA (≥2020 counts/min), 2) LPA (100–2019 counts/min), and SED (0–99 counts/min). We then divided the minutes in each category (MVPA, LPA, and SED) by the total wear time for that day (e.g., 10 h = 600 min). Doing so created a unitless proportion, or component, of wear time for that day; collectively, we refer to these components as PA composition. We determined PA composition (including MVPA, LPA, and SED) for each participant, then used these data to perform CoDA.
Outcome: medial JSW loss from baseline to two years
Over 2,000 OAI participants had radiographs collected and assessed at our study baseline (48-month visit) and 2 years later (72-month visit). In contrast, a much smaller subset of OAI participants had longitudinal magnetic resonance (MR) images assessed and made publicly available through ancillary studies. Therefore, we leveraged the availability of radiographs in the OAI cohort and used JSW in the central medial tibiofemoral (TF) joint, at fixed location χ = 0.25, as a surrogate measure for cartilage morphology (typically measured via MR images). JSW at χ = 0.25 demonstrates the highest reliability (intra-class correlation coefficient [ICC] > 0.98), is most sensitive to change across all grades of OA severity30, and is most likely to represent cartilage thinning31 of the nine JSW locations.
We estimated medial JSW loss (mm) by subtracting JSW at 2 years (mm) from JSW at baseline (mm). JSW loss is considered a valid, quantitative measure of OA progression32. To ensure that only high-quality radiographs were used to estimate medial JSW loss (mm), we excluded radiographs with an improper beam angle (<5° or >15°, variable V0XBMANG) or excessive tibial rim distance (>6.5 mm, variable V0XTPCFDS) at either time point33. We also excluded radiographs with an excessive difference in beam angle (>5°) or tibial rim distance (>1.4 mm) between the two time points33. If radiographs for both knees were considered high-quality, the right knee was randomly selected for inclusion in our analysis (hereafter referred to as the study knee).
Additional inclusion/exclusion criteria
At baseline, we excluded OAI participants for any of the following reasons: 1) they enrolled in the OAI accelerometry study but did not wear and return the Actigraph monitor; 2) they wore the Actigraph monitor, but did not have valid PA data (i.e., they had only 1—3 days of wear time); 3) baseline JSW was missing; 4) baseline JSW was not valid due to the presence of a prosthesis, poor image quality, improper beam angle, and/or excessive tibial rim distance; or 5) baseline JSW was 0 mm (Fig. 1).
Fig. 1.
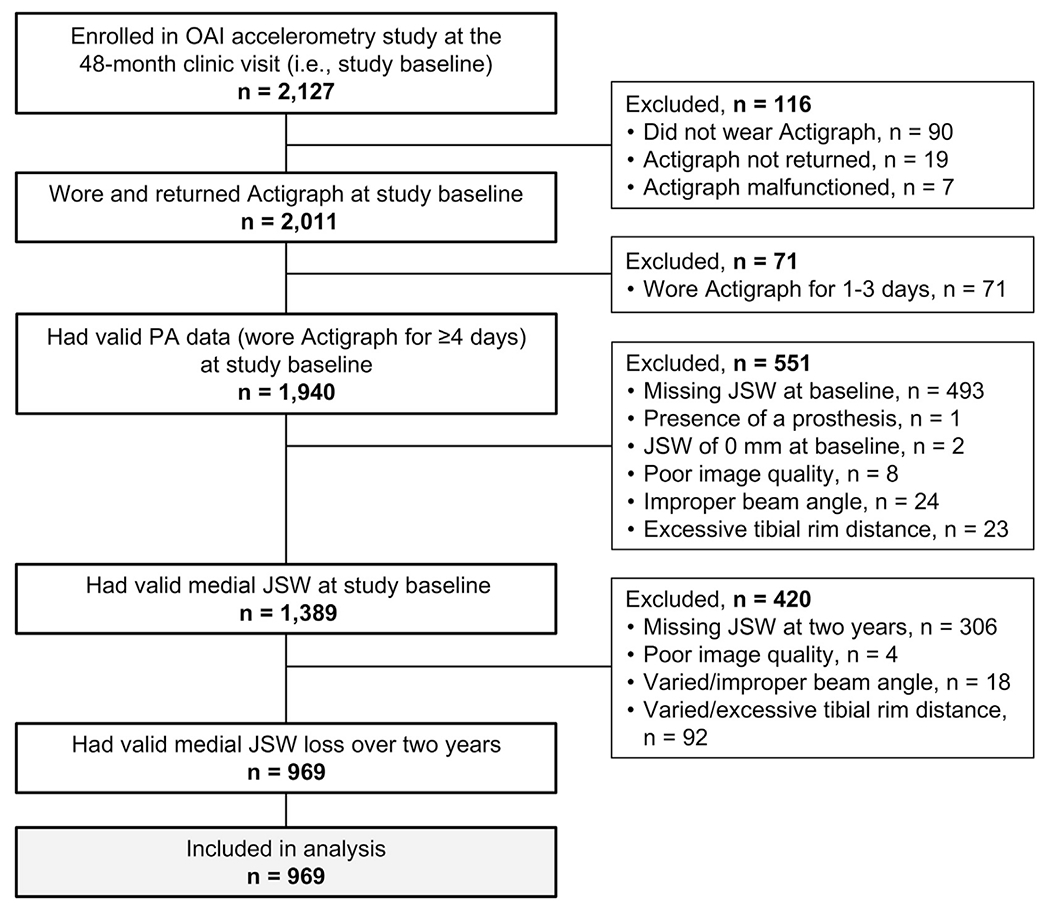
Flow diagram of OAI participants who were included in our analyses.
At 2 years, we excluded OAI participants who did not have valid medial JSW loss because 1) 2-year JSW was missing, 2) 2-year JSW was not valid due to poor image quality, improper beam angle, excessive tibial rim distance, or 3) medial JSW loss was not valid due to excessive variation in beam angle or tibial rim distance from baseline to 2 years (Fig. 1).
Potential confounders
Our primary analysis was adjusted for the following potential confounders, as they could be associated with PA and medial JSW loss in the study knee: age (years)34, sex (male/female)35, body mass index (BMI, kg/m2)34, race (White/Black/Asian/Non-white)35, previous injury that limited walking for at least 2 days (yes/no)36, previous surgery (yes/no)37, baseline medial JSW (mm)38, and lateral JSW loss (mm).
Potential sources of bias
Participants with missing exposure data (PA composition) and/or outcome data (medial JSW loss over 2 years) were excluded from our analyses. To evaluate the potential for selection bias (due to the exclusion of participants with missing data), we described the characteristics of adults who were included vs excluded from our analyses (Supplementary Table 1).
Statistical analysis
We examined the association of PA composition (min/day in MVPA, LPA, and SED) with medial JSW loss (mm) over 2 years using CoDA (see Supplementary File for details). All analyses were performed using SAS Analytics Software 9.4.
Briefly, we used an established isometric log-ratio (ilr) approach to transform each PA component (MVPA, LPA, and SED) into a set of two ilr coordinates39. We entered each set of coordinates as explanatory variables in a multiple linear regression model, adjusting for potential confounders (age, sex, BMI, race, previous knee injury or surgery, baseline medial JSW, and lateral JSW loss).
Thus, we generated a total of three separate compositional regression models in our primary analysis. Model 1 simulated both increasing time in MVPA at intervals of 2 min/day and decreasing the total time spent in LPA and SED at the same intervals (2 min/day). The model did not assume that time in LPA and SED decreased equally (e.g., −1 min/day of LPA, −1 min/day of SED); rather, it used the existing ratio of LPA to SED (e.g., 1:4), and decreased time accordingly (e.g., −0.5 min/day of LPA, −1.5 min/day of SED). The model increased time in MVPA at intervals of 2 min/day until the maximum value of MVPA (in min/day) for the sample was reached. Similarly, the model simulated decreasing time in MVPA at intervals of 2 min/day until the minimum value of MVPA for the sample was reached. Using the full range of values for MVPA from the sample, the model estimated the association of simulated differences in PA composition (i.e., time in MVPA, LPA, and SED) with a difference in medial JSW loss over 2 years.
We repeated the process described above, but simulated increasing (or decreasing) time in LPA (Model 2) and SED (Model 3) at intervals of 10 min/day.
Each model was evaluated using an isotemporal plot (Figs. 2–4). For each plot, the origin for the x-axis (x = 0) corresponded to the mean PA composition for the sample (i.e., min/day in MVPA, LPA, and SED). The origin for the y-axis (y = 0) corresponded to the mean medial JSW loss (mm) for the sample. Thus, each plot depicted differences in a specific PA category (in min/day) relative to the sample’s mean PA composition, then estimated the effect on medial JSW loss relative to the sample’s mean medial JSW loss.
Fig. 2.
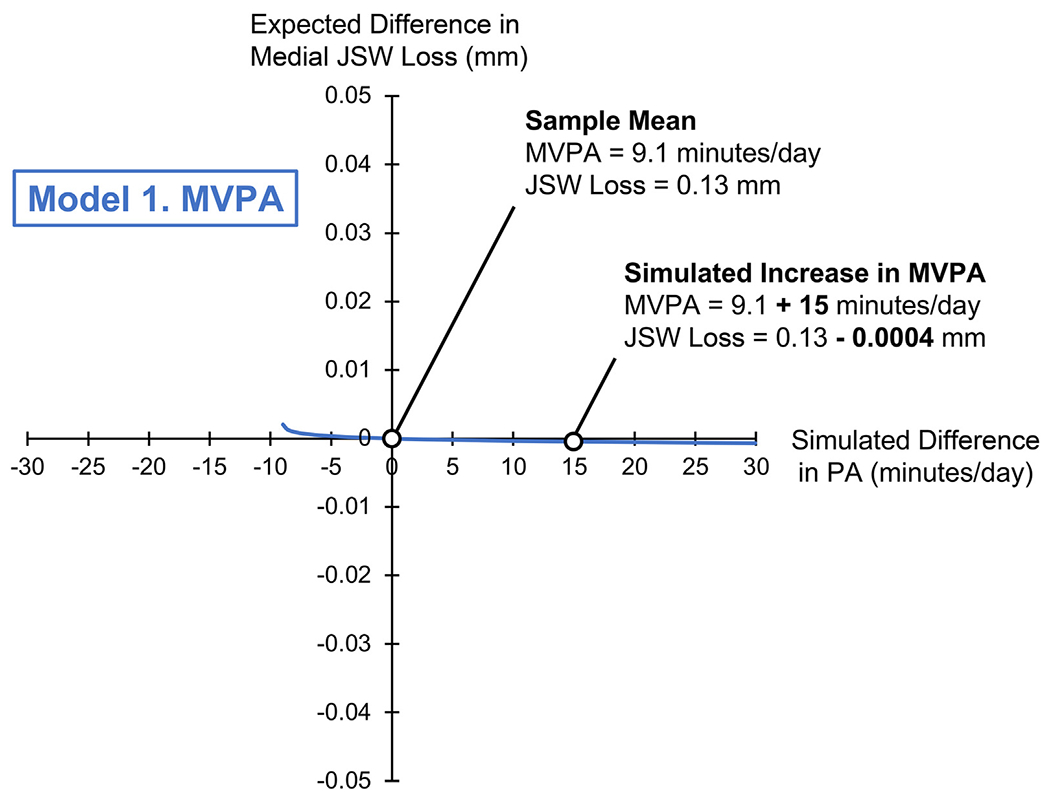
Isotemporal plot for Model 1, simulating a difference in MVPA (on the x-axis, in min/day) and its association with a difference in medial JSW loss (on the y-axis, in mm). The origin (0,0) corresponds to the sample mean composition (MVPA: 9.1, LPA: 278, SED: 690 min/day), and sample mean JSW loss (0.13 ± 0.5 mm). The range of x-values (−9.1 to +30 min/day) indicates a difference in MVPA relative to the sample mean composition. Negative y-values indicate lower medial JSW loss, or a “better” outcome.
Fig. 4.
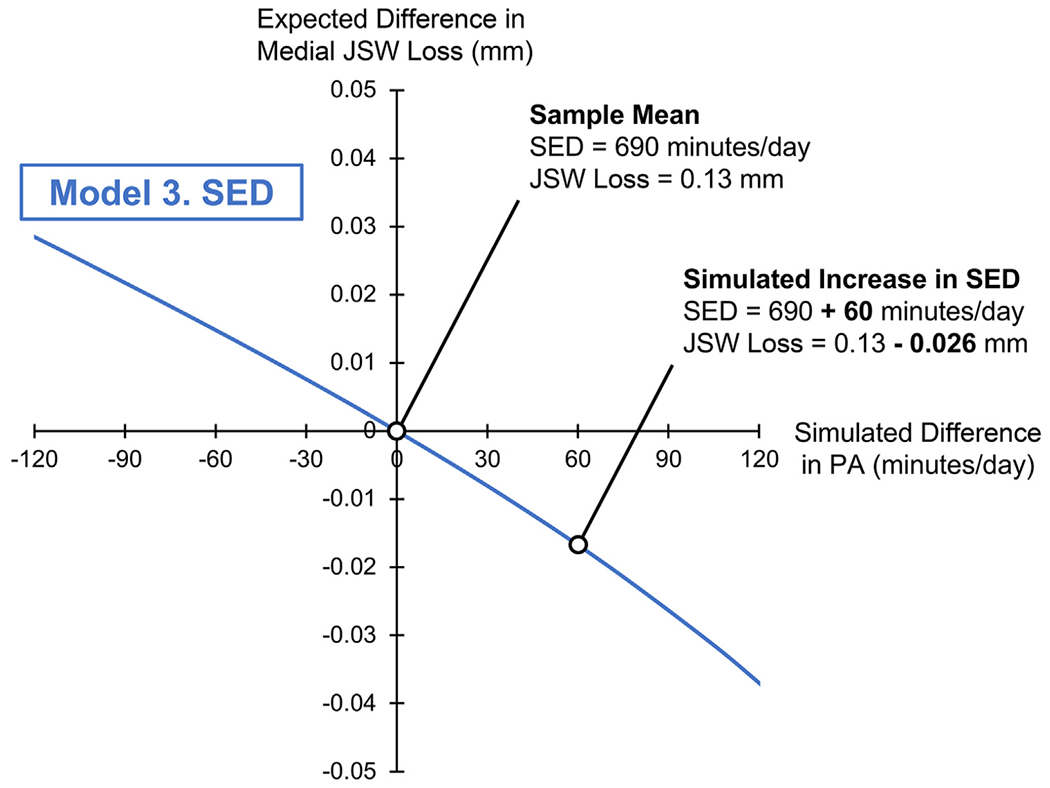
Isotemporal plot for Model 3, simulating a difference in SED (on the x-axis, in min/day) and its association with a difference in medial JSW loss (on the y-axis, in mm). The origin (0,0) corresponds to the sample mean composition (SED: 690, MVPA: 9.1, LPA: 278 min/day), and sample mean JSW loss (0.13 ± 0.5 mm). The range of x-values (−120 to +120 min/day) indicates a difference in SED relative to the sample mean composition. Negative y-values indicate lower medial JSW loss, or a “better” outcome.
We limited the range of values for the x-axis of each isotemporal plot, as follows: MVPA: ±30 min, LPA: ±120 min, SED: ±120 min. This was done to illustrate feasible, yet potentially meaningful, increases or decreases in that specific PA category. However, as mentioned above, the regression coefficients were generated using the complete ranges of values of MVPA, LPA, and SED (min/day) for the sample.
Sensitivity analysis
We separately examined the association of PA composition with lateral JSW loss (fixed location x = 0.75) over 2 years. We applied the same exclusion criteria to radiographs as the primary analysis and adjusted for the same potential confounders.
Results
Sample
We included 969 OAI participants (mean age: 64.5 years, 56% female, mean BMI: 28.8 kg/m2, 83% white) who had valid PA data at baseline and valid medial JSW loss over 2 years (Fig. 1). Characteristics of our sample can be found in Table I. Generally, those included in our analyses had similar characteristics to those who were excluded (Supplementary Table 1).
Table I.
Characteristics of OAI participants included in our analyses (n = 969). Unless indicated otherwise, values represent the mean ± SD or n (%)
| Characteristic | Value |
|---|---|
| Age (years) | 64.5 ± 8.8 |
|
| |
| Sex (female) | 542 (56) |
|
| |
| BMI (kg/m2) | 28.8 ± 4.9 |
|
| |
| Race (white) | 803 (83) |
|
| |
| Previous knee injury (yes, study knee) | 320 (33) |
|
| |
| Previous knee surgery (yes, study knee) | 148 (15) |
|
| |
| OAI cohort assignment | |
| Progression | 298 (31) |
| Incidence | 666 (68) |
| Reference (Nonexposed) | 5 (1) |
|
| |
| PA composition | |
| MVPA (minutes/day, geometric mean (range)) | 9.1 (0-130) |
| LPA (minutes/day, geometric mean (range)) | 278 (39-647) |
| SED (minutes/day, geometric mean (range)) | 690 (222-1017) |
|
| |
| Total wear time (minutes/day, geometric mean (range)) | 977 (635-1365) |
|
| |
| Medial JSW at baseline (mm) | 5.3 ± 1.2 |
|
| |
| Medial JSW loss over two years (mm) | 0.13 ± 0.5 |
|
| |
| Percent medial JSW loss over two years (%) | 2.6 ± 10 |
Primary analysis: PA composition and medial JSW loss (mm)
The mean PA composition for the sample (Table I) indicates that on average, participants spent their wear time as follows: MVPA = 0.9%, LPA = 28%, and SED = 71%, or, in decimal form: MVPA = 0.009, LPA = 0.28, SED = 0.71.
Each model examined a simulated difference in a specific PA category (e.g., MVPA) and the corresponding, simulated differences in the other categories (e.g., LPA and SED), to determine their effect on medial JSW loss over 2 years (mm). In Table II, we report the adjusted regression coefficient (β) for the first ilr coordinate of each model (see Supplementary File for details), which indicates the magnitude and direction of the association.
Table II.
Adjusted regression coefficients, 95% CI limits, and P-values for the first ilr coordinate of each compositional regression model in the primary analysis. To interpret each regression coefficient (β), we used back transformation to calculate the expected difference in medial JSW loss (mm), given a simulated increase in a specific PA category (with corresponding decreases in the other categories)
| Expected Difference in Loss of JSW, mm (95% CI), Given a Simulated Increase of: | |||||
|---|---|---|---|---|---|
| Regression Model |
β (95% CI) p-value |
+30 min | +60 min | +90 min | +120 min |
| Model 1. MVPA (with corresponding differences in LPA and SED) | −0.0005 (−0.03, 0.03) p = 0.97 |
−0.0007 (−0.04, 0.04) | −0.0009 (−0.05, 0.05) | −0.001 (−0.06, 0.06) | −0.001 (−0.07, 0.07) |
|
| |||||
| Model 2. LPA (with corresponding differences in SED and MVPA) | 0.06 (−0.05, 0.2) p = 0.27 |
0.008 (−0.006, 0.02) | 0.015 (−0.01, 0.05) | 0.02 (−0.02, 0.07) | 0.03 (−0.02, 0.09) |
|
| |||||
| Model 3. SED (with corresponding differences in MVPA and LPA) | −0.06 (−0.2, 0.04) p = 0.21 |
−0.008 (−0.03, 0.005) | −0.02 (−0.05, 0.01) | −0.03 (−0.08, 0.02) | −0.04 (−0.1, 0.02) |
Table II also shows the interpretation of each regression coefficient following back transformation; that is, we report the expected difference in medial JSW loss (mm), given an increase in MVPA (Model 1), LPA (Model 2), or SED (Model 3) of 30, 60, 90, or 120 min/day, with corresponding differences in the other categories.
Per Model 1, a simulated increase in MVPA relative to the sample mean (9.1 min/day), with corresponding decreases in LPA and SED, was not associated with a difference in medial JSW loss over 2 years (β = −0.0005, P = 0.97).
Per Model 2, a simulated increase in LPA relative to the sample mean (278 min/day), with corresponding decreases in MVPA and SED, was associated with minimally greater medial JSW loss over 2 years (β = 0.06, P = 0.27), though this did not reach statistical significance. That is, the positive regression coefficient for Model 2 indicated that increased time in LPA was associated with greater medial JSW loss, or a “worse” outcome.
Per Model 3, a simulated increase in SED relative to the sample mean (690 min/day), with corresponding decreases in MVPA and LPA, was associated with minimally lower medial JSW loss over 2 years (β = −0.06, P = 0.21), though this also did not reach statistical significance. That is, the negative regression coefficient for Model 3 indicated that increased time in SED was associated with lower medial JSW loss, or a “better” outcome.
Sensitivity analysis: PA composition and lateral JSW loss (mm)
We generated three additional regression models, replacing medial JSW loss (mm) with lateral JSW loss (mm) as our outcome. We again evaluated each model using the regression coefficient (β) for the first ilr coordinate, and found little to no association between PA composition and lateral JSW loss over 2 years (Supplementary Table 2).
Isotemporal plots
Using back transformation, we created isotemporal plots for each compositional regression model in the primary analysis (Figs. 2–4). Each plot depict a simulated difference in PA composition (on the x-axis) relative to the sample mean PA composition, and the expected difference in medial JSW loss (on the y-axis, in mm) relative to the sample mean JSW loss.
Discussion
In this study, we address an important question: how does PA affect the structural integrity of the knees? This question remains both a topic of debate among researchers40 and a major source of uncertainty for healthcare providers and patients41. Our objective was to comprehensively evaluate PA by accounting for time in all PA categories, i.e., PA composition, since more time in one category (e.g., MVPA) necessarily means less time in others (e.g., LPA and SED).
Overall, PA composition had little to no association with either medial or lateral JSW loss over 2 years, though we will focus our discussion on the findings of the primary analysis (medial JSW loss). First, we found that a simulated increase in MVPA (+120 min/day) beyond the sample mean (9.1 min/day), with corresponding reductions of LPA (−34 min/day) and SED (−86 min/day), was not associated with any appreciable difference in medial JSW loss (−0.001 ± 0.07 mm) over 2 years. Thus, our first hypothesis was supported, as CoDA demonstrated that higher MVPA was not associated with medial JSW loss. Further, our finding is consistent with those of recent observational studies that used traditional regression methods9–12.
Second, we found that a simulated increase in LPA (+120 min/day) beyond the sample mean (278 min/day), with reductions of MVPA (−1.5 min/day) and SED (−118.5 min/day), was associated with minimally greater medial JSW loss (0.03 ± 0.05 mm) over 2 years. That is, adults with higher LPA were expected to lose 0.16 mm of medial JSW over 2 years, as compared with a mean loss of 0.13 mm for the sample. Of note, the standard deviation for the sample was 0.5 mm, and the limits of agreement for medial JSW loss in the OAI (over one to 3 years) are +0.550 mm and −0.637 mm42. Thus, this small magnitude of effect on medial JSW loss has questionable clinical relevance, in addition to not being statistically significant. Further, our second hypothesis, that higher LPA would be associated with lower medial JSW loss, was not supported. Previous studies had not examined the effects of LPA on structural progression of knee OA, but rather focused on MVPA and SED. Therefore, our finding that higher LPA had minimal to no effect on medial JSW loss, made possible using CoDA, is highly novel for this question.
Third, we found that a simulated increase in SED (+120 min/day) beyond the sample mean (690 min/day), with reductions of MVPA (−4 min/day) and LPA (−116 min/day), was associated with minimally lower medial JSW loss (0.04 ± 0.06 mm) over 2 years. Like our finding for LPA, such a small magnitude of effect on medial JSW loss has questionable clinical relevance, in addition to not being statistically significant. Thus, our third hypothesis, that higher SED would be associated with greater medial JSW loss, was not supported. While this finding was generated using CoDA, a similar finding was made in a recent observational study in the OAI that used traditional regression methods to examine SED and worsening KL grade on radiographs11.
Importantly, our findings indicate that adults with knee OA could follow the 2018 PA guidelines from the United States Department of Health and Human Services (DHHS) without raising concerns about accelerating structural OA progression. These guidelines recommend that all adults engage in at least 150 min/week of MVPA, or an average of 22 min/day14. Unfortunately, most adults fail to meet this recommendation, which was true of our sample; 14% engaged in 0 min/day of MVPA and 69% engaged in less than 22 min/day of MVPA. However, our findings indicate that increasing MVPA up to, and beyond, 22 min/day (with consequently less LPA and SED) was not associated with greater medial JSW loss, even when accounting for baseline JSW as a potential confounder. Therefore, adults with knee OA should be encouraged to engage in MVPA; based upon these findings, MVPA does not seem to harm the structural integrity of the knees, and conversely, has well-established benefits in terms of OA-related pain and function40.
The 2018 PA guidelines also recommend that all adults engage in LPA, although there is no time-based recommendation (e.g., min/week). LPA may be more attainable for some adults, and it still offers some functional benefits43. Our findings indicated that like MVPA, higher LPA had little to no association with medial JSW loss and thus, may be safe for adults with knee OA. However, unlike MVPA, LPA may not be associated with improvements knee pain44, nor does it offer the same general health benefits45. That is, while LPA does not appear to be harmful to the structural integrity of the knees based on our findings from CoDA, it may have less overall benefit for adults with knee OA as compared with MVPA.
Finally, we want to acknowledge some limitations of the current study. First, OAI participants were instructed to wear the ActiGraph GT1M monitor during waking hours and remove it while they slept. Therefore, we could not account for all 1,440 min of each day, and it is possible that participants engaged in MVPA, LPA, or SED after they removed the monitor. Second, as with nearly all activity monitors, the ActiGraph GT1M monitor does not distinguish between sitting and quiet standing46, so both are categorized as SED. However, sitting and standing place different magnitudes of load on the knees, so future studies should consider using a monitor that distinguishes between sitting and standing47.
Third, we acknowledge that JSW loss does not solely reflect cartilage degradation, which is ideally measured using MR images, nor does it reflect clinical progression (i.e., worsening symptoms) of knee OA. However, few participants had MR images available, and studies show that medial JSW loss likely represents cartilage thinning and radiographic OA progression31, even if not clinical progression. Fourth, we restricted our follow-up period to 2 years because we felt it most appropriate to examine the short-term effects of PA composition (measured at baseline) since PA habits can change over time (observed in 20% of OAI participants48). Our sample still experienced a mean medial JSW loss of 0.13 ± 0.5 mm over 2 years, which was comparable to that of a previous study (0.14 ± 0.78 mm)49.
Finally, there is some potential for selection bias in this study; for example, we had to exclude ~25% of OAI participants with valid PA data at baseline because they were missing baseline JSW. However, those who were excluded based on the availability and/or quality of their radiographs at baseline or 2 years were similar to those who were ultimately included in our analyses.
Despite these limitations, our study has some notable strengths. First, we used an analytical technique (CoDA) that comprehensively evaluated all categories of PA (i.e., PA composition). Previous studies used traditional regression methods to examine independent associations of one or two categories of PA, and could not account for increases in one category and compensatory decreases in other categories. Since the emergence of CoDA in the field of PA, researchers have expressed concern that applying traditional regression methods to inherently compositional data can yield inconsistent or misleading results15–17. Thus, we leveraged CoDA to account for the compositional nature of PA data, or put another way, the codependence of PA categories.
The second strength of this study relates to generalizability, as the mean PA composition for our sample was highly representative of older adults50 and the distribution of PA composition was wide; MVPA ranged from 0 to 130 min/day, LPA ranged from 39 to 647 min/day (~1 to 11 h/day), and SED ranged from 222 to 1,017 min/day (~4 to 17 h/day). Our findings are generalizable to the many adults, with or at risk for knee OA, who have similar characteristics to those enrolled in the OAI.
The final strength of this study is our use of data from the OAI, a large, well-established cohort study with robust standardized procedures for assessment of PA and JSW loss.
In summary, a simulated increase in MVPA (with reductions in LPA and SED) was not associated with a difference in medial JSW loss over 2 years. Similarly, increases in LPA or SED had minimal effects on medial JSW loss over 2 years, as the magnitudes of difference (in mm) were very small. Thus, we recommend that adults, particularly those with or at risk for knee OA, strive to engage in MVPA, as doing so does not seem to affect structural progression of knee OA.
Supplementary Material
Fig. 3.
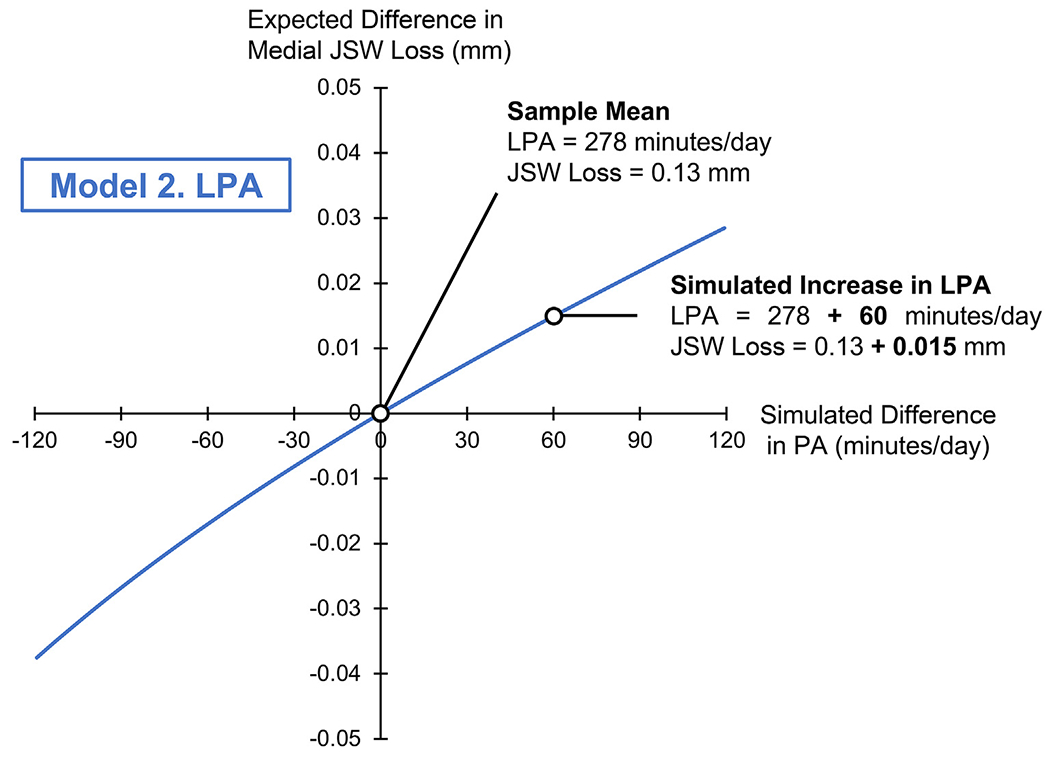
Isotemporal plot for Model 2, simulating a difference in LPA (on the x-axis, in min/day) and its association with a difference in medial JSW loss (on the y-axis, in mm). The origin (0,0) corresponds to the sample mean composition (LPA: 278, SED: 690, MVPA: 9.1 min/day), and sample mean JSW loss (0.13 ± 0.5 mm). The range of x-values (−120 to +120 min/day) indicates a difference in LPA relative to the sample mean composition. Positive y-values indicate greater medial JSW loss, or a “worse” outcome.
Acknowledgments
We want to acknowledge and thank all OAI participants and investigators for their efforts in creating this publicly available data set.
Role of the funding source(s)
The OAI is a public-private partnership comprised of five contracts funded by the National Institutes of Health (NIH) and National Institute of Arthritis and Musculoskeletal and Skin Diseases (NIAMS). Private funding partners include Merck Research Laboratories; Novartis Pharmaceuticals Corporation, GlaxoSmithKline; and Pfizer, Inc.
The authors received funding from NIH T32-HD007490 (Voinier), NIH K24-AR070892 (Neogi), Rheumatology Research Foundation Innovative Research Award (White), and NIH/NIAMS R21-AR07079 (White).
The funding sources had no involvement in the study design, collection, analysis and interpretation of data, writing of the manuscript, and the decision to submit the manuscript for publication.
Financial support:
National Institutes of Health (T32-HD007490, K24-AR070892, R21-AR071079); Rheumatology Research Foundation Innovative Research Award.
Footnotes
Competing interest statement
The authors have no conflicts of interest to disclose.
Supplementary data
Supplementary data to this article can be found online at https://doi.org/10.1016/j.joca.2022.12.012.
References
- 1.McAlindon TE, Wilson PW, Aliabadi P, Weissman B, Felson DT. Level of physical activity and the risk of radiographic and symptomatic knee osteoarthritis in the elderly: the Framingham study. Am J Med 1999;106:151–7. [DOI] [PubMed] [Google Scholar]
- 2.Felson DT, Zhang Y, Hannan MT, Naimark A, Weissman B, Aliabadi P, et al. Risk factors for incident radiographic knee osteoarthritis in the elderly. The Framingham study. Arthritis Rheum 1997;40:728–33. [DOI] [PubMed] [Google Scholar]
- 3.Buckwalter JA, Lane NE. Athletics and osteoarthritis. Am J Sports Med 1997;25:873–81. [DOI] [PubMed] [Google Scholar]
- 4.Hovis KK, Stehling C, Souza RB, Haughom BD, Baum T, Nevitt M, et al. Physical activity is associated with magnetic resonance imaging-based knee cartilage t2 measurements in asymptomatic subjects with and those without osteoarthritis risk factors. Arthritis Rheum 2011;63:2248–56. [DOI] [PMC free article] [PubMed] [Google Scholar]
- 5.Stehling C, Lane NE, Nevitt MC, Lynch J, McCulloch CE, Link TM. Subjects with higher physical activity levels have more severe focal knee lesions diagnosed with 3t mri: analysis of a non-symptomatic cohort of the osteoarthritis initiative. Osteoarthritis Cartilage 2010;18:776–86. [DOI] [PMC free article] [PubMed] [Google Scholar]
- 6.Racunica TL, Teichtahl AJ, Wang Y, Wluka AE, English DR, Giles GG, et al. Effect of physical activity on articular knee joint structures in community-based adults. Arthritis Care Res 2007;57:1261–8. [DOI] [PubMed] [Google Scholar]
- 7.Roos EM, Dahlberg L. Positive effects of moderate exercise on glycosaminoglycan content in knee cartilage: a four-month, randomized, controlled trial in patients at risk of osteoarthritis. Arthritis Rheum 2005;52:3507–14. [DOI] [PubMed] [Google Scholar]
- 8.Manninen P, Riihimaki H, Heliovaara M, Suomalainen O. Physical exercise and risk of severe knee osteoarthritis requiring arthroplasty. Rheumatology 2001;40:432–7. [DOI] [PubMed] [Google Scholar]
- 9.Oiestad BE, Quinn E, White D, Roemer F, Guermazi A, Nevitt M, et al. No association between daily walking and knee structural changes in people at risk of or with mild knee osteoarthritis. Prospective data from the multicenter osteoarthritis study. J Rheumatol 2015;42:1685–93. [DOI] [PMC free article] [PubMed] [Google Scholar]
- 10.Kretzschmar M, Lin W, Nardo L, Joseph GB, Dunlop DD, Heilmeier U, et al. Association of physical activity measured by accelerometer, knee joint abnormalities, and cartilage t2 measurements obtained from 3t magnetic resonance imaging: data from the osteoarthritis initiative. Arthritis Care Res 2015;67:1272–80. [DOI] [PMC free article] [PubMed] [Google Scholar]
- 11.Jayabalan P, Kocherginsky M, Chang A, Rouleau GW, Koloms KL, Lee J, et al. Physical activity and worsening of radiographic findings in persons with or at higher risk of knee osteoarthritis. Arthritis Care Res 2019;71(2): 198–20. [DOI] [PMC free article] [PubMed] [Google Scholar]
- 12.Qin J, Barbour KE, Nevitt MC, Helmick CG, Hootman JM, Murphy LB, et al. Objectively measured physical activity and risk of knee osteoarthritis. Med Sci Sports Exerc 2017;50(2): 277–83. [DOI] [PMC free article] [PubMed] [Google Scholar]
- 13.Caspersen CJ, Powell KE, Christenson GM. Physical activity, exercise, and physical fitness: definitions and distinctions for health-related research. Public Health Rep 1985;100:126–31. [PMC free article] [PubMed] [Google Scholar]
- 14.2018 Physical Activity Guidelines Advisory Committee. 2018 Physical Activity Guidelines Advisory Committee Scientific Report. Washington, DC: U.S. Department of Health and Human Services; 2018. [Google Scholar]
- 15.Chastin SFM, Palarea-Albaladejo J, Dontje ML, Skelton DA. Combined effects of time spent in physical activity, sedentary behaviors and sleep on obesity and cardio-metabolic health markers: a novel compositional data analysis approach. PLoS One 2015;10:e0139984. [DOI] [PMC free article] [PubMed] [Google Scholar]
- 16.Dumuid D, Stanford TE, Martin-Fernández J-A, Pedišić Ž, Maher CA, Lewis LK, et al. Compositional data analysis for physical activity, sedentary time and sleep research. Stat Methods Med Res 2017;27:3726–38. [DOI] [PubMed] [Google Scholar]
- 17.Gupta N, Mathiassen SE, Mateu-Figueras G, Heiden M, Hallman DM, Jørgensen MB, et al. A comparison of standard and compositional data analysis in studies addressing group differences in sedentary behavior and physical activity. Int J Behav Nutr Phys Activ 2018;15:53. [DOI] [PMC free article] [PubMed] [Google Scholar]
- 18.Roos EM, Arden NK. Strategies for the prevention of knee osteoarthritis. Nat Rev Rheumatol 2016;12:92–101. [DOI] [PubMed] [Google Scholar]
- 19.Lin W, Alizai H, Joseph GB, Srikhum W, Nevitt MC, Lynch JA, et al. Physical activity in relation to knee cartilage t2 progression measured with 3 t mri over a period of 4 years: data from the osteoarthritis initiative. Osteoarthritis Cartilage 2013;21:1558–66. [DOI] [PMC free article] [PubMed] [Google Scholar]
- 20.Souza RB, Baum T, Wu S, Feeley BT, Kadel N, Li X, et al. Effects of unloading on knee articular cartilage t1rho and t2 magnetic resonance imaging relaxation times: a case series. J Orthop Sports Phys Ther 2012;42:511–20. [DOI] [PMC free article] [PubMed] [Google Scholar]
- 21.Hinterwimmer S, Krammer M, Krotz M, Glaser C, Baumgart R, Reiser M, et al. Cartilage atrophy in the knees of patients after seven weeks of partial load bearing. Arthritis Rheum 2004;50:2516–20. [DOI] [PubMed] [Google Scholar]
- 22.Vanwanseele B, Eckstein F, Knecht H, Stussi E, Spaepen A. Knee cartilage of spinal cord-injured patients displays progressive thinning in the absence of normal joint loading and movement. Arthritis Rheum 2002;46:2073–8. [DOI] [PubMed] [Google Scholar]
- 23.Lester G Clinical research in oa-the nih osteoarthritis initiative. J Musculoskelet Neuronal Interact 2008;8:313–4. [PubMed] [Google Scholar]
- 24.Dunlop DD, Song J, Semanik PA, Chang RW, Sharma L, Bathon JM, et al. Objective physical activity measurement in the osteoarthritis initiative: are guidelines being met? Arthritis Rheum 2011;63:3372–82. [DOI] [PMC free article] [PubMed] [Google Scholar]
- 25.Melanson JE, Freedson PS. Validity of the computer science and applications, inc.(csa) activity monitor. Med Sci Sports Exerc 1995;27:934–40. [PubMed] [Google Scholar]
- 26.Welk GJ, Schaben JA, Morrow JR Jr. Reliability of accelerometry-based activity monitors: a generalizability study. Med Sci Sports Exerc 2004;36:1637–45. [PubMed] [Google Scholar]
- 27.Song J, Semanik P, Sharma L, Chang RW, Hochberg MC, Mysiw WJ, et al. Assessing physical activity in persons with knee osteoarthritis using accelerometers: data from the osteoarthritis initiative. Arthritis Care Res 2010;62:1724–32. [DOI] [PMC free article] [PubMed] [Google Scholar]
- 28.Troiano RP, Berrigan D, Dodd KW, Masse LC, Tilert T, McDowell M. Physical activity in the United States measured by accelerometer. Med Sci Sports Exerc 2008;40:181–8. [DOI] [PubMed] [Google Scholar]
- 29.Masse LC, Fuemmeler BF, Anderson CB, Matthews CE, Trost SG, Catellier DJ, et al. Accelerometer data reduction: a comparison of four reduction algorithms on select outcome variables. Med Sci Sports Exerc 2005;37:S544–54. [DOI] [PubMed] [Google Scholar]
- 30.Neumann G, Hunter D, Nevitt M, Chibnik LB, Kwoh K, Chen H, et al. Location specific radiographic joint space width for osteoarthritis progression. Osteoarthritis Cartilage 2009;17:761–5. [DOI] [PMC free article] [PubMed] [Google Scholar]
- 31.Crema MD, Nevitt MC, Guermazi A, Felson DT, Wang K, Lynch JA, et al. Progression of cartilage damage and meniscal pathology over 30 months is associated with an increase in radiographic tibiofemoral joint space narrowing in persons with knee oa-the most study. Osteoarthritis Cartilage 2014;22:1743–7. [DOI] [PMC free article] [PubMed] [Google Scholar]
- 32.Conaghan PG, Hunter DJ, Maillefert JF, Reichmann WM, Losina E. Summary and recommendations of the oarsi fda osteoarthritis assessment of structural change working group. Osteoarthritis Cartilage 2011;19:606–10. [DOI] [PMC free article] [PubMed] [Google Scholar]
- 33.Driban JB, Lo GH, Eaton CB, Lapane KL, Nevitt M, Harvey WF, et al. Exploratory analysis of osteoarthritis progression among medication users: data from the osteoarthritis initiative. Ther Adv Musculoskelet Dis 2016;8:207–19. [DOI] [PMC free article] [PubMed] [Google Scholar]
- 34.Du Y, Liu B, Sun Y, Snetselaar LG, Wallace RB, Bao W. Trends in adherence to the physical activity guidelines for Americans for aerobic activity and time spent on sedentary behavior among us adults, 2007 to 2016. JAMA Netw Open 2019;2:e197597. [DOI] [PMC free article] [PubMed] [Google Scholar]
- 35.Yang L, Cao C, Kantor ED, Nguyen LH, Zheng X, Park Y, et al. Trends in sedentary behavior among the us population, 2001-2016. JAMA 2019;321:1587–97. [DOI] [PMC free article] [PubMed] [Google Scholar]
- 36.Snoeker B, Turkiewicz A, Magnusson K, Frobell R, Yu D, Peat G, et al. Risk of knee osteoarthritis after different types of knee injuries in young adults: a population-based cohort study. Br J Sports Med 2020;54:725–30. [DOI] [PubMed] [Google Scholar]
- 37.Rongen JJ, Rovers MM, van Tienen TG, Buma P, Hannink G. Increased risk for knee replacement surgery after arthroscopic surgery for degenerative meniscal tears: a multi-center longitudinal observational study using data from the osteoarthritis initiative. Osteoarthritis Cartilage 2017;25:23–9. [DOI] [PubMed] [Google Scholar]
- 38.Benichou OD, Hunter DJ, Nelson DR, Guermazi A, Eckstein F, Kwoh K, et al. One-year change in radiographic joint space width in patients with unilateral joint space narrowing: data from the osteoarthritis initiative. Arthritis Care Res 2010;62:924–31. [DOI] [PMC free article] [PubMed] [Google Scholar]
- 39.Aitchison J In: A Concise Guide to Compositional Data Analysis. Girona: CDA Workshop; 2003. 2003. [Google Scholar]
- 40.Kraus VB, Sprow K, Powell KE, Buchner D, Bloodgood B, Piercy K, et al. Effects of physical activity in knee and hip osteoarthritis: a systematic umbrella review. Med Sci Sports Exerc 2019;51:1324–39. [DOI] [PMC free article] [PubMed] [Google Scholar]
- 41.Maserejian NN, Fischer MA, Trachtenberg FL, Yu J, Marceau LD, McKinlay JB, et al. Variations among primary care physicians in exercise advice, imaging, and analgesics for musculoskeletal pain: results from a factorial experiment. Arthritis Care Res 2014;66:147–56. [DOI] [PMC free article] [PubMed] [Google Scholar]
- 42.Duryea J. Project 20 Test-Retest Reliability of Joint Space Width Measurements from Knee Radiographs 2012. [Google Scholar]
- 43.White DK, Lee J, Song J, Chang RW, Dunlop D. Potential functional benefit from light intensity physical activity in knee osteoarthritis. Am J Prev Med 2017;53:689–96. [DOI] [PMC free article] [PubMed] [Google Scholar]
- 44.Song J, Chang AH, Chang RW, Lee J, Pinto D, Hawker G, et al. Relationship of knee pain to time in moderate and light physical activities: data from osteoarthritis initiative. Semin Arthritis Rheum 2018;47:683–8. [DOI] [PMC free article] [PubMed] [Google Scholar]
- 45.Saint-Maurice PF, Troiano RP, Berrigan D, Kraus WE. Matthews CE. Volume of light versus moderate-to-vigorous physical activity: similar benefits for all-cause mortality? J Am Heart Assoc 2018;7, e008815. [DOI] [PMC free article] [PubMed] [Google Scholar]
- 46.Carr LJ, Mahar MT. Accuracy of intensity and inclinometer output of three activity monitors for identification of sedentary behavior and light-intensity activity. J Obes 2012;2012, 460271. [DOI] [PMC free article] [PubMed] [Google Scholar]
- 47.Edwardson CL, Winkler EAH, Bodicoat DH, Yates T, Davies MJ, Dunstan DW, et al. Considerations when using the activpal monitor in field-based research with adult populations. J Sport Health Sci 2017;6:162–78. [DOI] [PMC free article] [PubMed] [Google Scholar]
- 48.Chang AH, Lee J, Chmiel JS, Almagor O, Song J, Sharma L. Association of long-term strenuous physical activity and extensive sitting with incident radiographic knee osteoarthritis. JAMA Netw Open 2020;3:e204049. [DOI] [PMC free article] [PubMed] [Google Scholar]
- 49.Vignon E, Piperno M, Le Graverand MPH, Mazzuca SA, Brandt KD, Mathieu P, et al. Measurement of radiographic joint space width in the tibiofemoral compartment of the osteoarthritic knee: comparison of standing anteroposterior and Lyon schuss views. Arthritis Rheum 2003;48:378–84. [DOI] [PubMed] [Google Scholar]
- 50.Fishman EI, Steeves JA, Zipunnikov V, Koster A, Berrigan D, Harris TA, et al. Association between objectively measured physical activity and mortality in nhanes. Med Sci Sports Exerc 2016;48:1303–11. [DOI] [PMC free article] [PubMed] [Google Scholar]
Further reading
- 51.Aitchison J The statistical analysis of compositional data. J R Stat Soc Series B Stat Methodol 1982;44:139e–77. [Google Scholar]
Associated Data
This section collects any data citations, data availability statements, or supplementary materials included in this article.