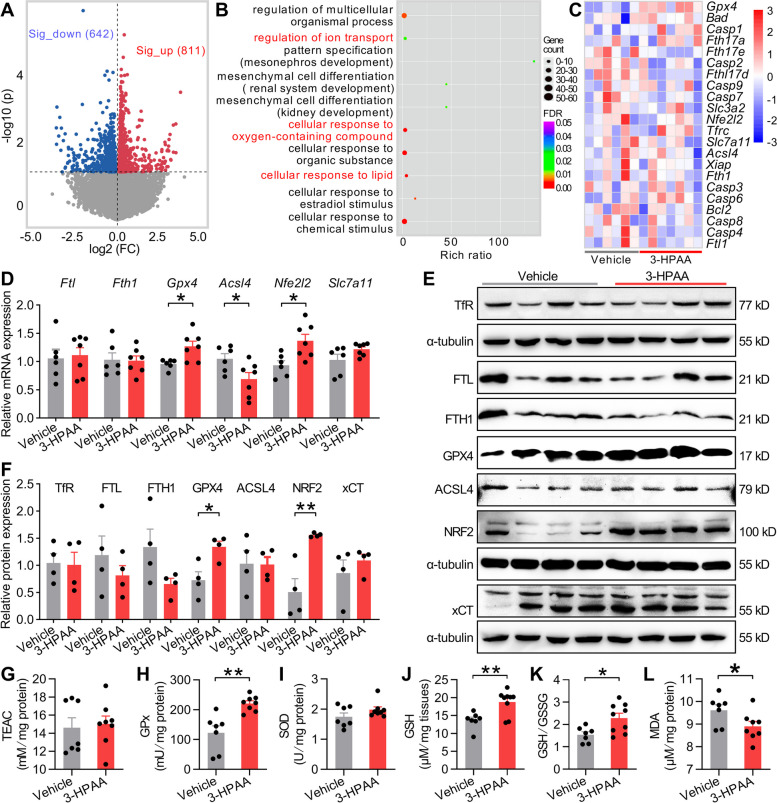
Fig. 5.
3-HPAA treatment promotes spermatogenesis of old mice through restraint of ferroptosis. A The volcano plots of RNA sequencing data showed 642/811 significantly downregulated (blue points) or upregulated (red points) genes in the testis tissues of 3-HPAA mice (n = 6–7 mice per group). Significantly regulated genes between groups were determined by absolute FC (fold change) > 1 and p value < 0.05. B Gene Ontology (GO) analysis of biological process (GO, BP) between 3-HPAA and vehicle mice. The size of bubble indicates gene counts, the color of bubble represents FDR and the important GO categories are highlighted in red. C The heat map of genes associated with apoptosis and ferroptosis from RNA sequencing data. Red indicates high abundance and blue indicates low abundance. D qRT-PCR validation of mRNA expression of ferroptosis-associated genes including Ftl, Fth1, Gpx4, Acsl4, Nrf2, and Slc7a11 in the testis of the two groups and the expression of these mRNA was compared with the housekeeping gene β-actin (n = 6–7 mice per group). E, F Protein expression of TfR, FTL, FTH1, GPX4, ACSL4, NRF2, and xCT in the testis tissues of the two groups (n = 4 mice per group). Protein expressions were determined by comparison with α-tubulin on their own gels. G–L Oxidative stress-related indicators including total antioxidant capacity represented by trolox-equivalent antioxidant capacity (TEAC) (G), total glutathione peroxidase (GPx) (H), SOD activities (I), level of GSH (J), ratio of GSH/GSSG (reduced glutathione, GSH; oxidized glutathione disulfide, GSSG) (K), and malondialdehyde (MDA) (L) (n = 7–9 mice per group). All data are presented as mean ± SEM. *P < 0.05; **P < 0.01 and data are analyzed by two-tailed unpaired Student’s t test

