

Abstract
Objective:
Fingers, hands, and wrists (FHW) are the most frequently injured body parts in work-related injuries. This study described and compared FHW injuries among enlisted, officer, and civilian U.S. Air Force (USAF) personnel to those in the U.S. workforce.
Methods:
All work-related, non-combat FHW injuries (>1 lost workday) and demographics among USAF personnel and U.S. workforce (2008–2018) were included. USAF FHW injury rates were age-adjusted to the U.S. employment and compared by gender, source, event, and nature of the injuries.
Results:
FHW injuries were significantly lower among the USAF personnel and among females. In both populations FHW injuries from falls were higher and increased with age group among females. Males had higher overall FHW injuries from contact with objects and equipment.
Conclusions:
Prevention efforts should focus on understanding risk factors and sharing successful prevention activities.
Keywords: Finger, hand, wrist, enlisted, officers, civilian, military, occupational injuries
1. Objective
Fingers, hands, and wrists (FHW) are anatomically complex and injuries to FHW can impair a worker’s function not only at work but also in their daily life activities at home. Impairments from FHW injuries can result in not only physical difficulties but social and emotional impacts and lead to a decreased quality of life. The high rate of FHW injuries continues to be a challenge for occupational safety across the country. FHW were the most commonly injured body part among work-related emergency department visits and the second most common body part injured among all emergency department injury visits in the United States (U.S.)1–3. FHW are also among the most frequently injured body parts in the U.S. military4–6. They are one of the most costly injuries and most of those costs are related to lost workdays2. While the majority of FHW injuries have a short recovery period, these injuries can result in long periods of rehabilitation, impact combat readiness among active-duty military, and can even lead to permanent or partial disability7.
There is a dearth of research on FHW injuries. To develop efforts aimed at preventing FHW injuries and understanding the risk factors involved in FHW, the U.S. Air Force (USAF) worked collaboratively with the National Institute for Occupational Safety and Health (NIOSH) to examine FHW injuries occurring in the USAF. The objective of this exploratory study was to broadly understand FHW injuries as a leading injured body part in the USAF (enlisted, officer and civilian) and how these injuries compare to the U.S. worker population. While this paper does not present solutions, this first step is necessary to understanding how future prevention methods can be prioritized through a comparison of the workplace for FHW injuries among these two populations.
2. Methods
This study examined non-fatal work-related FHW injuries across two surveillance systems from 2008 through 2018: the Air Force Safety Automated System (AFSAS) and the Bureau of Labor Statistics (BLS) Survey of Occupational Injuries and Illnesses (SOII). Fiscal year (October 1 to September 30) was used to select FHW injuries from AFSAS for the study timeframe while calendar year was used for SOII. While this approach created a small time discrepancy between the two datasets, it allowed for analysis of the greatest number of data years and matched timeframes previously used when reporting analyses from the respective datasets.
2.1. Air Force Safety Automated System (AFSAS)
The event and injury surveillance system, AFSAS, captures USAF military and civilian work-related mishaps which are reported by local safety professionals. The Department of Defense Instruction (DODI) policy 6055.07 outlines the requirements for mishap notification, investigation, reporting, and record keeping injuries to be reported10. In the U.S. military, mishaps are defined as an injury to a person or property damage resulting from an unplanned event11, 12. The mishap events obtained in AFSAS are unintentional injuries, and therefore exclude suicides, homicides, or combat-related injuries. This analysis was limited to USAF enlisted, officer and civilian personnel. This dataset does not include enlisted and officer personnel completing basic military training. The inclusion and exclusion criteria of AFSAS are listed in Figure 1. Mishaps that resulted in property damage but resulted in no injury were excluded from this analysis. Mishap events can include multiple personnel injured in an event; this study included all personnel injured in the event and was not limited to just the primary person injured in the event. AFSAS includes on and off duty mishaps among active-duty military personnel, and only on-duty mishaps for civilian personnel. Since this study is related to work-related injuries, the data were limited to on-duty injuries for military personnel. Since the commencement of the study, mishap Class costs have changed and will continue to change. Mishaps captured include USAF Class A-E mishaps: Class A resulting in fatality, 100% permanent disability or >$2 million; Class B resulting in permanent partial disability or >$500,000; Class C resulting in at least 1 day away from work beyond the day of injury; Class D resulting in medical treatment beyond first aid; and Class E resulting from minor injuries and close calls13. In AFSAS, Class E injuries are not required to be reported, however, they allow for Air Force-wide tracking and trending purposes in support of mishap prevention efforts or to meet OSHA recordkeeping requirements. This analysis was limited to injuries resulting in at least one day away from work (Class A, B, or C). The analytic sample was also limited to injuries in the categories: ground, aviation, and motor vehicle. Injury categories excluded from analysis are those related to afloat, weapons, and workplace violence related injuries. Since AFSAS does not routinely include events related to criminal activity, self-harm, or worker dependents, workplace violence related injuries were excluded. Afloat and weapons related injuries were excluded since they are related to military unique tasks. FHW injuries were coded based on the body part of injury for “finger” and “hand/wrist”. FHW injuries were combined since hand and wrist injuries can affect the use of fingers and there could be coding inconsistencies with how finger and hand/wrist injuries were coded (e.g., knuckle injuries could be coded as finger in some and hand/wrist in others).
Figure 1.
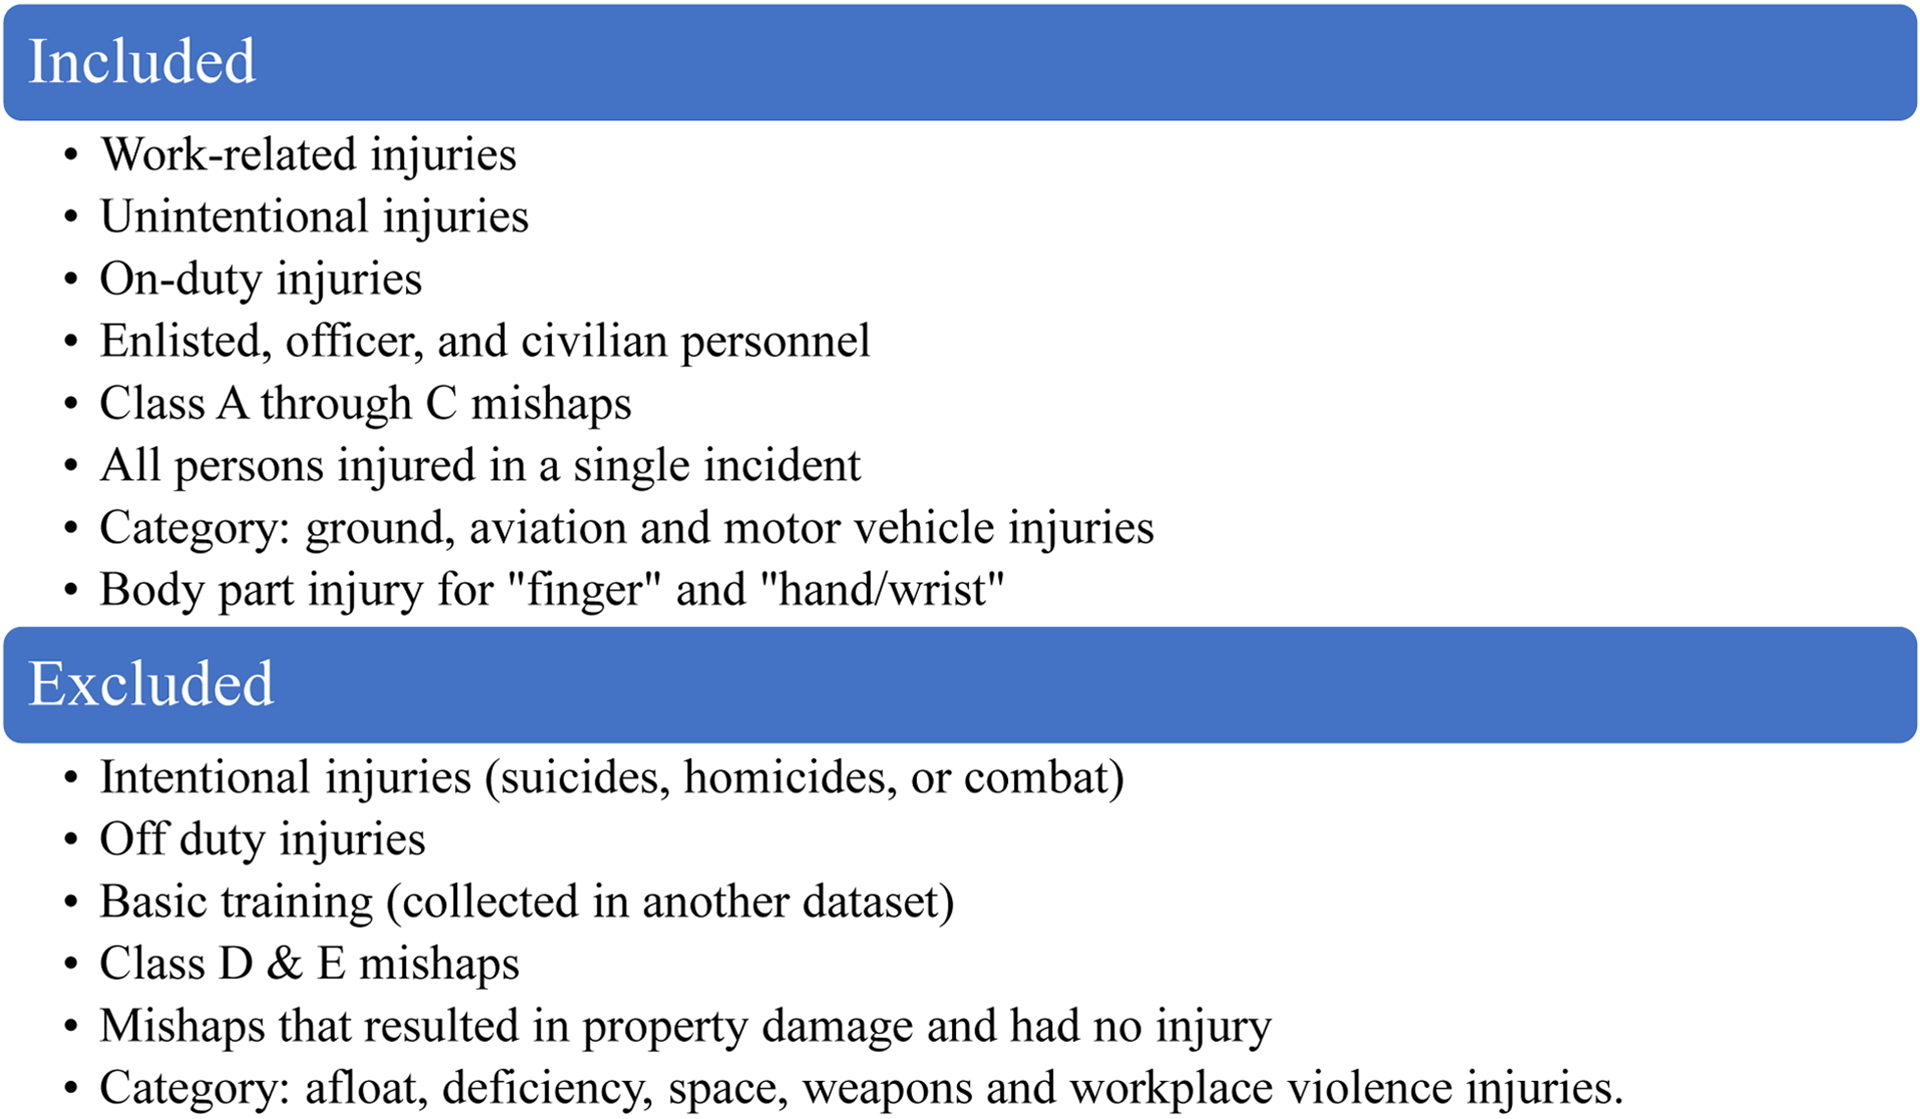
AFSAS FHW injuries inclusion and exclusion list.
2.2. The Survey of Occupational Injuries and Illnesses (SOII)
SOII is collected from employers by the BLS and provides national estimates of detailed characteristics of reported nonfatal injuries and illnesses, involving at least one day away from work. These data are collected annually from a sample of approximately 230,000 private, state, and local government employers14, 15. The sample selection uses employment sources, largely the Quarterly Census of Employment and Wages15. It includes wage and salary workers, self-employed, part-time workers, and unpaid workers in family run enterprises14, 15. The stratified sample created covers all employment in the U.S., with a few notable exceptions. Federal government workers, self-employed workers, volunteers, and workers on farms with 10 or less employees are not included in the SOII dataset. Selected establishments provide information on summary case counts for OSHA recordable cases that involved days away from work, however larger establishments provide a subsample of cases that occurred in a specific time period to reduce the reporting burden15. The sample of cases are collected by state agencies from employers on behalf of BLS.
For this analysis, SOII was limited to all cases among workers 16 years or older to match the USAF population. All FHW injuries in SOII from 2011–2018 were obtained from BLS through a data request which included data on age, gender, event, source, and nature of injury. An additional SOII data request provided event, source, and nature of injury for all FHW injuries for the study time frame of 2011 to 2018; earlier data (2008–2010) were not available for analysis.
2.3. Measures
2.3.1. Air Force personnel population
The demographic data for the USAF were obtained from the USAF Interactive Demographic Analysis System (IDEAS). The personnel data in IDEAS are updated monthly and capture the entire USAF population. Annual counts by age and gender for enlisted, officers and civilian personnel were obtained in this study for 2008 through 2018, inclusively. Job series codes which identify occupations were used to identify enlisted, officers and civilian personnel.
2.3.2. United States civilian worker population
Annual denominator data were extracted from the BLS Current Population Survey (CPS) for 2008 through 2018. The CPS is a monthly survey used to create a nationally representative estimate of the civilian non-institutionalized labor workforce. CPS estimates were limited to state government, local government, and private employees since SOII excludes federal and self-employed workers.
2.4. Statistical Analysis
2.4.1. Rate and Adjusted Rate calculations
Injury rates were compared between the USAF enlisted, officers and civilian personnel to the U.S. workforce population for 2008 through 2018. Additionally, event, source, and nature of injury were compared between the USAF and the U.S. workforce population for 2011 through 2018. USAF rates were calculated per 10,000 workers using the population numbers from USAF IDEAS. U.S. population rates were calculated per 10,000 workers using the population estimates from CPS. USAF rates were age adjusted to that of the U.S. population and examined by gender. The rates for AFSAS were calculated using PROC SURVEYMEANS in SAS 9.4 using direct age-adjustment and were examined by gender and year. Unadjusted confidence intervals (CI) for AFSAS were calculated assuming a Poisson distribution with mean and variance equal to the number of injuries for a specific calculation.
The annual SOII U.S. workforce FHW cases for years 2008 through 2018 were summed, and some age groups were collapsed for analysis due to insufficient sample size (i.e., 16–19 was combined with 20–24 and 55–64 was combined with 65 and over). The annual relative standard errors (RSE) obtained from SOII were used to calculate the 95% CI of injuries. SOII FHW event (the way the injury or illness occurred), source (what was responsible for producing or inflicting injury), and nature (physical characteristics of the injury) data were aligned to the AFSAS dataset for 2011 through 2018 where possible (see Table 1). SOII injuries and illnesses were coded using the Occupational Injury and Illness Classification System (OIICS), Version 2.0116. The variable Injury mechanism from AFSAS lists the way the injury occurred and was matched to the OIICS event codes for falls and contact with objects and equipment. Additional injury events did not have enough injuries to be reportable and were therefore excluded from analysis. The variables Object type tier 1 and Object type tier 2 from AFSAS lists what produced or inflicted the injury and were matched to the OIICS source codes for: containers, furniture, and fixtures; machinery; parts and materials; tools, instruments, and equipment; and vehicles. The AFSAS variable Injury type was matched to the OIICS nature codes for burns, contusions, crush, fracture, sprains and strains, and open wounds. Some nature of injury groups were collapsed or excluded from the analysis because of the small number of injuries.
Table 1.
Nature, event, and source matching between the Air Force Safety Automated System and the BLS Occupational Injuries and Illnesses Classification System (v2.01)
| Containers; Furnishings/Appliances | 2 Containers - furniture and fixtures |
| Construction/Building Materials, Directed Energy Device; Electrical/Communications Equipment; Ground Based Space Systems; Ground Control Station (GCS); Nonpowered AGE; PYRO/CART/CAD-PAD; Powered AGE; Towed Equipment; Calibration Equipment; Cart/Dolly; Cleaning Equipment; Crowbar/Pry Bar/Breaker Bar/Cheater Bar; Garden Tool; Hammer; Jack; Manual Hand Tool, Other; Ramp, Portable; Saw; Screwdriver; Sewer Cleaner (Snake); Shovel/Spade; Wrench | 3 Machinery |
| Aircraft/RPA Component; Airfield/Airfield Components; Bomb Components ; Buildings and Structure Components; Buildings and Structures; Missile Components; Roadway / Roadway Components; Vehicle Components; Aircraft/RPA Engine | 4 Parts and materials |
| Ammunition; Bomb Rack/Launcher/Pylon; Bomb/Weapon; Demolition Explosives; Grenades/Mines/GBS; Handgun/Rifle; Missile/MSE; Weapon/Weapon System Support Equipment; Air Compressor; Air Hose; Auxiliary Power Unit (not AGE); Computer (And All Components); Cutting Tool; Drill; Grinder; Lathe (All); Mechanical Machine, Other; Nail Gun “Planer (All); Powered Hand Tool, Other; Powered Machine, Other; Powered Office Machine, Other; Press; Pump; Riveter; Sander; Snow Blower; Socket Set/Speed Handle/Ratchet; Welder; Winch | 7 Tools, instruments and equipment |
| Aircraft; Vehicles; Watercraft; Remotely Piloted Aircraft | 8 Vehicles |
| Injury mechanism tier 1 1st injury | OIICS codes |
|---|---|
| Falls (Not associated with running for aerobic training) | 4 Falls, slips and trips |
| Objects; Tools/Machines | 6 Contact with objects and equipment |
| Injury type - 1st injury only | OIICS codes |
| Burns | 184 Burns and other injuries- except fractures; 15 Burns and corrosions |
| Contusion | 143 Bruises- contusions |
| Crush | 1971 Crushing injuries |
| Fracture | 111 Fractures” |
| Sprains And Strains | 123 Sprains- strains- tears without 1231 Major tears to muscles- tendons- ligaments |
| Open Wound | 13 Open wounds; 131 Amputations- avulsions- enucleations |
2.4.2. Trend modeling
To evaluate time trends, generalized linear models were employed with a log link function and a negative binomial error structure. Generalized estimating equations (GEE) were also employed in this model to adjust for serial correlation using an autoregressive, AR1, structure by year. The number of FHW injuries were modeled as a function of gender, age category, personnel, and year. An offset using the logarithm of the number of workers in each respective strata was used so that rates were modeled. Separate models were constructed for the USAF data and the U.S. worker data. Rate Ratios (RR) were calculated by exponentiating the parameters for each variable in the models. The average annual percentage change in rates was calculated as (RR-1)*100% using the RR for year. All models were estimated using PROC GENMOD in SAS 9.4.
3. Results
3.1. Demographics
The total number of reported FHW injuries in the U.S. workforce from 2008 through 2018 was greater than 2 million. The U.S. workforce population estimate annual average was 120,747,838 for the study period. After applying exclusion criteria to AFSAS, 1,720 FHW injuries were reported during the 11-year study period. The USAF had an annual average of 474,470 enlisted, officers, and civilians for the study period.
Table 2 presents the age and gender distributions for both the USAF and all U.S. workers. For the USAF, enlisted made up over half (54%) of the study population and the large majority were under 35 years-old (81%) and male (81%). Officers were a much smaller proportion of the study population (13%) and over half were under 35 years-old (55%) and the majority male (80%). While there are set age requirements for enlisted and officers joining the USAF there are no such requirements for civilian personnel. The USAF civilian population was older (84%, 35 and older) than the enlisted personnel and officers. In contrast, the U.S. workforce population was 55% male and only 35% were under 35 years old.
Table 2.
Average annual demographic characteristics of the U.S. workforce and U.S. Air Force population, 2008–2018
| USAF | |||||
|---|---|---|---|---|---|
| Characteristics | U.S. workforce | All USAF | Civilian | Enlisted | Officers |
| # (%) | # (%) | # (%) | # (%) | # (%) | |
| Total | 120,747,838 | 474,470 | 152,957 | 258,162 | 63,351 |
| Gender | |||||
| Female | 54,295,205 (45%) | 108,614 (23%) | 46,459 (30%) | 49,698 (19%) | 12,457 (20%) |
| Male | 66,452,633 (55%) | 365,856 (77%) | 106,498 (70%) | 208,465 (81%) | 50,893 (80%) |
| Age Group | |||||
| 16–24 years | 13,695,355 (11%) | 106,161 (22%) | 2,822 (2%) | 97,450 (38%) | 5,888 (9%) |
| 25–34 years | 28,877,406 (24%) | 160,998 (34%) | 20,892 (14%) | 110,913 (43%) | 29,192 (46%) |
| 35–44 years | 27,406,124 (23%) | 97,383 (21%) | 30,626 (20%) | 45,535 (18%) | 21,223 (34%) |
| 45–54 years | 27,738,580 (23%) | 67,741 (14%) | 56,979 (37%) | 4,248 (2%) | 6,513 (10%) |
| 55+ years | 23,030,373 (19%) | 42,188 (9%) | 41,637 (27%) | 16 (0%) | 535 (1%) |
3.2. Differences between FHW injury rates in U.S. workforce and USAF
FHW injuries were significantly higher among the U.S. workforce (15.71 per 10,000 workers, 95% CI: 15.69, 15.73) compared to the USAF (3.30 per 10,000 workers, 95% CI: 3.14, 3.45). FHW injury rates were significantly higher among the U.S. workforce male workers and female workers compared to the USAF personnel (Table 3) even after age adjusting the USAF rates. Additionally, males in the U.S. workforce and USAF civilian personnel had a significantly higher rate of FHW injuries than females. USAF civilian males had significantly higher rates of FHW injuries compared to enlisted male personnel.
Table 3.
Differences in FHW injury rates between U.S. workforce and age-adjusted U.S. Air Force by gender, 2008–2018
| Females | Males | |||
|---|---|---|---|---|
| # injuries | Rate per 10,000 (CI) | # injuries | Rate per 10,000 (CI) | |
| All US workforce | 744,810 | 12.47 (12.44, 12.50) | 1,341,560 | 18.35 (18.32, 18.38) |
| All USAF | 294 | 2.46 (2.18, 2.74) | 1,426 | 3.54 (3.36, 3.73) |
| Civilian | 135 | 2.64 (2.20, 3.09) | 438 | 3.74(3.39, 4.09) |
| Enlisted | 148 | 2.71 (2.27, 3.14) | 944 | 4.12 (3.85, 4.38) |
| Officers | 11 | 0.80 (0.67, 0.93) | 44 | 0.79 (0.75, 0.82) |
| Age-adjusted All USAF | 2.53 (2.14, 2.92) | 3.14 (2.81, 3.46) | ||
| Age-adjusted Civilian | 2.53 (1.83, 3.24) | 4.36 (3.72, 5.00) | ||
| Age-adjusted Enlisted | 2.57 (1.36, 3.77) | 2.28 (1.72, 2.85) |
Note: “All USAF” includes: officers, enlisted and civilians. Age-adjusted rates were not calculated for officers since the group size was too small.
CI= 95% Confidence interval
3.3. FHW injuries source
All sources of FHW injuries among U.S. workforce male workers had significantly higher rates compared to U.S. workforce female workers (Table 4). The leading sources of FHW injuries differ between U.S. workforce and USAF personnel by gender (Table 4). The leading source of FHW injury among U.S. workforce female workers was from containers, furniture, and fixtures with those aged 16–24 years old having the highest rate of injury (2.39 per 10,000 workers, 95% CI: 2.30, 2.47). Tools, instruments, and equipment was the leading source of FHW injuries among U.S. workforce male workers and there was a significant decreasing rate of injury with the increase in age group. The leading source of FHW injuries among USAF female personnel was from parts and materials with those over 55 years having the highest rate of injury (1.29 per 10,000 workers, 95% CI: 0.59, 1.99). The rate of USAF female personnel FHW injuries from parts and materials was higher than U.S. workforce female workers. The leading source of FHW injuries among male USAF personnel was from vehicles with personnel aged 16–24 having the highest rate of injury (1.49 per 10,000 workers, 95% CI: 1.20, 1.78). The majority of FHW injuries involving vehicles among USAF males were from aircraft (63.9%).
Table 4.
Source, event, and nature of FHW injuries among U.S. workforce and age-adjusted U.S. Air Force personnel, 2011–2018
| U.S. Workforce rate | USAF Age-adjusted rate | |||
|---|---|---|---|---|
| Females | Males | Females | Males | |
| Rate (CI) | Rate (CI) | Rate (CI) | Rate (CI) | |
| Source | ||||
| Containers, furniture, and fixtures | 1.66 (1.64, 1.68) | 1.82 (1.80, 1.85) | 0.31 (0.11, 0.51) | 0.21 (0.16, 0.25) |
| Machinery | 1.17 (1.15, 1.19) | 2.96 (2.93, 2.99) | 0.20 (0.10, 0.30) | 0.51 (0.31, 0.71) |
| Parts and materials | 0.38 (0.37, 0.39) | 2.82 (2.79, 2.84) | 0.54 (0.14, 0.93) | 0.41 (0.30, 0.53) |
| Tools, instruments, and equipment | 1.64 (1.61, 1.66) | 3.98 (3.95, 4.01) | 0.23 (0.08, 0.38) | 0.38 (0.27, 0.50) |
| Vehicles | 0.45 (0.44, 0.46) | 1.05 (1.03, 1.07) | 0.21 (0.05, 0.37) | 0.69 (0.41, 0.98) |
| Event | ||||
| Falls | 1.81 (1.79, 1.84) | 1.50 (1.48, 1.52) | 1.08 (0.09, 2.07) | 0.49 (0.30, 0.68) |
| Contact with objects | 4.98 (4.94, 5.03) | 12.20 (12.14, 12.26) | 1.00 (0.58, 1.42) | 1.85 (1.29, 2.40) |
| Nature | ||||
| Burn | 0.44 (0.43, 0.45) | 0.55 (0.54, 0.56) | 0.08 (0.00, 0.16) | 0.15 (0.06, 0.24) |
| Contusion | 0.93 (0.91, 0.95) | 0.88 (0.86, 0.92) | 0.13 (0.06, 0.19) | 0.13 (0.07, 0.19) |
| Crush | 0.25 (0.24, 0.26) | 0.90 (0.89, 0.92) | 0.07 (0.02, 0.11) | 0.15 (0.09, 0.20) |
| Fracture | 1.61 (1.59, 1.64) | 2.55 (2.52, 2.58) | 1.28 (0.66, 1.89) | 1.09 (0.79, 1.38) |
| Sprains And Strains | 2.15 (2.12, 2.18) | 1.65 (1.63, 1.67) | 0.34 (0.12, 0.56) | 0.28 (0.23, 0.34) |
| Open Wound | 2.85 (2.81, 2.88) | 7.11 (7.05, 7.16) | 0.54 (0.39, 0.68) | 0.97 (0.72, 1.22) |
CI= 95% Confidence interval
3.4. FHW injuries event
The rate of FHW injuries from falls was higher among females compared to males among both the U.S. workforce and USAF personnel (Table 4). The rate of FHW injuries from falls was twice as high among females in the USAF compared to males in the USAF. The rate of falls increased with age group among females in the U.S. workforce and USAF.
The rate of FHW injuries from contact with objects and equipment was significantly higher among males in both the U.S. and the USAF. Additionally, the rate of FHW injuries from the event contact with objects and equipment decreased with age group among U.S. workforce males.
3.5. FHW injuries nature
The leading nature of FHW injuries for the U.S. workforce was open wounds (Table 4). U.S. workforce males had an open wound injury rate two and a half times higher than females in the U.S. workforce. Open wounds were the second leading nature of FHW injuries among the USAF personnel with males having a higher rate of injury than females. Fractures were the leading nature of FHW injuries among USAF personnel. The rate of fracture injuries among females was highest among those 55 and older (U.S. workforce females 3.57 per 10,000 workers, 95% CI: 3.49, 3.65; USAF females 2.57 per 10,000 workers, 95% CI: 1.59, 3.56).
USAF male personnel had a rate twice as high as USAF female personnel for crushing FHW injuries. U.S. workforce males had a rate for crushing FHW injuries more than 3.5 times as high as U.S. workforce female workers. Males in both the U.S. workforce and USAF aged 16–24 had higher rates from all nature of FHW injury compared to all other age groups, except for USAF males with nature of injuries from contusions and sprains and strains.
3.6. Statistical modeling
3.6.1. Trend analysis
A trend analysis (GEE) of FHW injuries among USAF workers while controlling for age, gender, and personnel category (enlisted, officer and civilian) found a significant year-to-year average reduction of 3.91% (95% CI: −5.32%, −2.48, p-value <0.0001) for males. While females also showed an average year to year reduction, this reduction was not significant (−2.11%; 95% CI: −4.81%, 0.67%, p-value 0.14). The difference between the USAF trends in male and female was not significant (p-value 0.25). A trend analysis (GEE) of FHW injuries among U.S. workforce while controlling for age and gender found a significant year-to-year reduction of 2.46% (95% CI: 3.16%, 1.75%) for males and 2.22% (95% CI: 2.75%, 1.68%) for females during the study period. There was no significant difference between the trends in males and females (p-value 0.59).
3.6.2. Model adjusted rate ratios
Among the U.S. workforce males, the incidence rate of FHW injuries among males was 1.55 times higher than the incident rate for females (see Table 5). Compared to the U.S. workforce age group of 35–44 years, workers 16–24 had an incidence rate of FHW injuries that was 1.53 times higher. All other age groups in the U.S. workforce (25–34, 45–54, and 55+ years) had an incidence rate similar to the reference group (35–44 years). Among USAF personnel, males had an incidence rate of FHW injuries that was 1.63 times higher than females. Compared to the USAF personnel age group of 35–44 years, workers 16–24 had 2.74 times higher incidence rate of FHW injuries. Also, those aged 25–34 years had 1.72 times higher incidence rate of FHW injuries than those 35–44 years. All other age groups in the U.S. workforce (45–54, and 55+ years) have an incidence rate similar to the reference group (35–44 years). The incident rate for USAF enlisted personnel was 3.77 times higher than that of officers. The USAF civilian personnel incidence rate was 5.68 times higher than the incidence rate for officers.
Table 5.
Model adjusted rate ratio of U.S. workforce and U.S. Air Force personnel
| GEE model for U.S. workforce | GEE model for USAF | |||
|---|---|---|---|---|
| RR (CI) | P-Value | RR (CI) | P-Value | |
| Gender | ||||
| Female | ref | ref | ||
| Male | 1.55 (1.32, 1.82) | <.0001 | 1.63 (1.20, 2.22) | 0.0019 |
| Age Group | ||||
| 16–24 years | 1.53 (1.21, 1.93) | 0.0004 | 2.74 (2.02, 3.71) | <0.0001 |
| 25–34 years | 1.08 (0.96, 1.22) | 0.20 | 1.72 (1.28, 2.31) | 0.0003 |
| 35–44 years | ref | ref | ||
| 45–54 years | 1.13 (0.95, 1.34) | 0.16 | 1.07 (0.77, 1.47) | 0.70 |
| 55+ years | 1.10 (0.90, 1.35) | 0.36 | 1.27 (0.74, 2.20) | 0.39 |
| Air Force Group | ||||
| Officers | ref | |||
| Enlisted | 3.77 (2.74, 5.19) | <0.0001 | ||
| Civilian | 5.68 (4.04, 8.00) | <0.0001 | ||
| Slope (year-to-year) | ||||
| Female | 0.978 (0.975, 0.983) | <0.0001 | 0.979 (0.952, 1.007) | <0.14 |
| Male | 0.975 (0.968, 0.983) | <0.0001 | 0.961 (0.947, 0.975) | <0.0001 |
RR = Model adjusted rate ratio
CI = 95% Confidence interval
4. Discussion
The main objective of this exploratory study was to describe and compare FHW injuries in the USAF to the U.S. workforce, identifying any differences in injury risk factors which contributed to these injuries. This analysis provided an 11-year overview of FHW injuries in the USAF and the U.S. workforce. There are several interesting and significant findings from this study. FHW injuries decreased during this study timeframe for both populations, which aligns with the findings of a recent study of acute injuries in the U.S. military for a similar timeframe5.
Although FHW injuries remain a top concern for the USAF, our analysis found that rates of FHW injuries were substantially lower compared to the U.S. workforce, even after adjusting for age and gender. Few studies have compared these populations to understand the risk differences and none of those studies have examined this area.
One possible explanation for the different rates between U.S. workers and USAF workers could be explained by injury risk differences by tasks and occupations. We did not have the detailed information available for both injuries and employee numbers by occupation to adjust by occupational risk differences available in our data. Further, occupational definitions and classification systems vary greatly between the U.S. and military data. Future research in this area needs to develop a crosswalk between these two systems so that future analyses can control for occupational risk differences between the U.S. and military injury surveillance systems.
More specifically the analysis revealed that a higher rate of FHW injuries occurred among males than females in the USAF and the U.S. workforce. This is consistent with the findings of other studies that showed higher rates of FHW injuries among males in the military and civilians2, 5. However, other studies have found a higher rate of all other injuries among females18. Female USAF recruits and other military personnel have reported injury rates twice as high as males for all injury categories19–21. A meta-analysis of military personnel found females were more than twice as likely to have injuries compared to males22. Additionally, studies of the civilian and military populations have suggested that females are more likely than males to report injuries and seek medical care21. Based on our findings and what has been published in the literature, males should be a primary target of prevention efforts to reduce FHW injuries.
Females had a higher rate of FHW injuries from falls in both study populations and that rate increased with age. This is consistent with previous research of all fall injuries in military and civilian populations23–25, which has been found across all work sectors26. There is an increased risk for older workers since they are more likely to have severe injuries from falls which indicates the need for more and improved interventions to reduce falls among older workers27, 28.
While this study found differences in the rate of FHW injuries among younger and older workers based on the type of nature, source, and event of injury, more commonly the rates for FHW injuries were higher among those aged 16–24. Similar findings of higher rates of FHW injuries among younger workers have been observed in other military and civilian populations5. Consistent with this study, younger workers have been found to have higher rates of FHW injuries from contact with objects and equipment24. Similarly, males and females in the USAF aged 16–24 had high rates of FHW injuries from vehicles, primarily from aircraft. Future studies of the USAF might examine FHW injuries among specific occupations and USAF groups (enlisted, officer and civilian) by severity to understand more detailed risk factors for FHW injuries.
Consistent with this study, open wounds have been found to be a leading FHW injury in the military and civilian populations5, 29. Also, previous studies found fractures accounted for a large proportion of FHW injuries in the USAF, other military agencies and among civilians6, 8, 20, 29. Additionally, as we found in this study with females in the USAF, fractures have been found to be higher among those 55 and older supporting the need for interventions specific to this group24, 29.
4.1. Limitations
This study was limited to traumatic injuries, but there are other FHW injuries among military and civilian injuries which are not classified as traumatic injuries such as physical training-related overuse and musculoskeletal injuries which are not captured in these datasets9. These injuries can be the result of the compilation of effects of micro-traumas from activities such as overexertion, repetitive movements, and prolonged stationary positions over an extended time and can be recurrent. Additionally, there could be an underestimate of FHW injuries if they were self-treated, treatment was received outside of the USAF healthcare network, injuries not reported to their employer or if treatment for the injury was not sought30.
Another limitation of this study was that the SOII data were provided by predetermined age groups and there are very few USAF personnel aged 16 to 17, which are part of the age group for younger workers. Additionally, AFSAS (fiscal year) and SOII (annual year) used different annual time frames to capture injury data. This could result in seasonal effects but no direct year-to-year comparisons that would be impacted by those effects were made in this analysis. By using 11 years of data, these effects were limited throughout the time frame of our study. Due to the definitional differences of classified incidences in the data sets, there were limitations in the ability to match all AFSAS and SOII FHW injuries for source, event and nature and some categories had too few injuries to report. Also, capturing the initial FHW injury does not account for the full extent of the impact of the injury, such as further medical visits and rehabilitation and lost work time. Additionally, we were not able to capture lost duty time for FHW injuries in AFSAS, which would have provided information on the impact of the injury.
4.2. Conclusion
Given the difference in the nature of FHW injuries between the two populations, efforts should focus on understanding risk factors and sharing successful prevention activities. Although activities should be initiated to prevent FHW injuries for both males and females across all age groups, one of the focus areas should be on reducing work-related falls among older females, especially since this is a known high-risk group for this kind of injury. Another focus area should examine why workers 16–24 have a higher risk of FHW injuries compared to workers in higher age groups. Also, information on the cause of injury data can be utilized to target prevention of FHW injuries among risky activities.
SMART Learning Outcomes.
Identify the leading natures, sources, and events related to finger, hand, and wrist injuries among the U.S. Air Force personnel and U.S. workforce and use those to propose the development of more specific research and prevention efforts.
Compare finger, hand, and wrist injuries between U.S. Air Force personnel and U.S. workforce and identify areas of similarity where prevention efforts can be shared.
Acknowledgements
This research was funded by the National Institute for Occupational Safety and Health (NIOSH) National Occupational Research Agenda (NORA) Research Grant. The study represents a collaborative effort between NIOSH and the US Air Force. NIOSH owes a debt of gratitude to the US Air Force (USAF) for their hard work to make this project a reality. The USAF is to be commended for their innovative efforts to improve safety culture throughout the USAF. The authors wish to recognize the following colleagues for their insightful review of the manuscript: Jennifer Bell (NIOSH/DSR), Anna Schuh Renner (U.S. Army Public Health Center), and Sara Wuellner (Washington State Department of Labor and Industries).
Footnotes
Conflict of Interest
None declared
Disclaimer:
The findings and conclusions in this presentation are those of the authors and do not necessarily represent the official position of the National Institute for Occupational Safety and Health, Centers for Disease Control and Prevention, Department of Navy or United States Air Force.
References
- 1.Cairns C, Kang K, Santo L National Hospital Ambulatory Medical Care Survey: 2019 emergency department summary tables. . In: Statistics NCfH, editor.; 2021. [Google Scholar]
- 2.De Putter CE, Van Beeck EF, Polinder S, Panneman MJM, Burdorf A, Hovius SER, et al. Healthcare costs and productivity costs of hand and wrist injuries by external cause : A population-based study in working-age adults in the period 2008–2012. Injury 2016;47(7):1478–1482. [DOI] [PubMed] [Google Scholar]
- 3.National Institute for Occupational Safety and Health. Estimated number of nonfatal occupational injuries and illnesses treated in U.S. hospital emergency departments. 2020 October 2, 2020; Available from: https://wwwn.cdc.gov/wisards/workrisqs/workrisqs_estimates_results.aspx
- 4.Armed Forces Health Surveillance Branch. Ambulatory Visits, Active Component, U.S. Armed Forces, 2019. 2020 March 1, 2020.
- 5.Stahlman S, Taubman SB. Incidence of acute injuries, active component, U.S. Armed Forces, 2008–2017. Msmr 2018;25(7):2–9. [PubMed] [Google Scholar]
- 6.Hebert DJ, Pasque CB. Orthopedic injuries during carrier battle group deployments. Mil Med 2004;169(3):176–80. [DOI] [PubMed] [Google Scholar]
- 7.Alessa FM, Nimbarte AD, Sosa EM. Incidences and severity of wrist, hand, and finger injuries in the U.S. mining industry. Safety Science 2020;129. [Google Scholar]
- 8.Sundstrom JN, Webber BJ, Delclos GL, Herbold JR, Gimeno Ruiz de Porras D. Musculoskeletal Injuries in US Air Force Security Forces, January 2009 to December 2018. J Occup Environ Med 2021;63(8):673–678. [DOI] [PMC free article] [PubMed] [Google Scholar]
- 9.Hauret KG, Jones BH, Bullock SH, Canham-Chervak M, Canada S. Musculoskeletal injuries description of an under-recognized injury problem among military personnel. Am J Prev Med 2010;38(1 Suppl):S61–70. [DOI] [PubMed] [Google Scholar]
- 10.Defense. Do. Mishap Notification, Investigation, Reporting, and Record Keeping. In; 2021. p. 1–52.
- 11.Naval Postgraduate School. Mishap Reporting. [August 10, 2021]; Available from: https://www.nps.edu/web/safety/mishap-reporting#:~:text=A%20Mishap%20is%20defined%20as%20any%20unplanned%20event,details%20can%20be%20found%20below%20on%20this%20page.
- 12.United States Air Force Aviation Safety Center. Proactive aviation safety: from the Chief of Aviation Safety. [cited August 10, 2021]; Available from: https://www.safety.af.mil/Divisions/Aviation-Safety-Division/Proactive-Aviation-Safety/
- 13.Copley GB, Burnham BR, Shim MJ, Kemp PA. Using safety data to describe common injury-producing events examples from the U.S. Air force. Am J Prev Med 2010;38(1 Suppl):S117–25. [DOI] [PubMed] [Google Scholar]
- 14.Wiatrowski WJ. The BLS survey of occupational injuries and illnesses: a primer. Am J Ind Med 2014;57(10):1085–9. [DOI] [PubMed] [Google Scholar]
- 15.Bureau of Labor Statistics. Survey of Occupational Injuries and Illnesses: Design. October 30, 2020; Available from: https://www.bls.gov/opub/hom/soii/design.htm
- 16.Bureau of Labor Statistics. Occupational Injury and Illness Classification Manual. February 3, 2021; Available from: https://www.bls.gov/iif/oshoiics.htm
- 17.Pan W Akaike’s information criterion in generalized estimating equations. Biometrics 2001;57(1):120–5. [DOI] [PubMed] [Google Scholar]
- 18.Grimm PD, Mauntel TC, Potter BK. Combat and Noncombat Musculoskeletal Injuries in the US Military. Sports Med Arthrosc Rev 2019;27(3):84–91. [DOI] [PubMed] [Google Scholar]
- 19.Snedecor MR, Boudreau CF, Ellis BE, Schulman J, Hite M, Chambers B. U.S. Air force recruit injury and health study. Am J Prev Med 2000;18(3 Suppl):129–40. [DOI] [PubMed] [Google Scholar]
- 20.Nye NS, Pawlak MT, Webber BJ, Tchandja JN, Milner MR. Description and Rate of Musculoskeletal Injuries in Air Force Basic Military Trainees, 2012–2014. J Athl Train 2016;51(11):858–865. [DOI] [PMC free article] [PubMed] [Google Scholar]
- 21.Kucera KL, Marshall SW, Wolf SH, Padua DA, Cameron KL, Beutler AI. Association of Injury History and Incident Injury in Cadet Basic Military Training. Med Sci Sports Exerc 2016;48(6):1053–61. [DOI] [PMC free article] [PubMed] [Google Scholar]
- 22.Dos Santos Bunn P, de Oliveira Meireles F, de Souza Sodré R, Rodrigues AI, da Silva EB. Risk factors for musculoskeletal injuries in military personnel: a systematic review with meta-analysis. Int Arch Occup Environ Health 2021;94(6):1173–1189. [DOI] [PubMed] [Google Scholar]
- 23.Timsina LR, Willetts JL, Brennan MJ, Marucci-Wellman H, Lombardi DA, Courtney TK, et al. Circumstances of fall-related injuries by age and gender among community-dwelling adults in the United States. PLoS One 2017;12(5):e0176561. [DOI] [PMC free article] [PubMed] [Google Scholar]
- 24.Centers for Disease Control and Prevention. Nonfatal occupational injuries and illnesses among older workers --- United States, 2009. MMWR Morb Mortal Wkly Rep 2011;60(16):503–8. [PubMed] [Google Scholar]
- 25.Hauschild VD, Schuh A, Taylor BJ, Canham-Chervak M, Jones BH. Identification of specific activities associated with fall-related injuries, active component, U.S. Army, 2011. Msmr 2016;23(6):2–9. [PubMed] [Google Scholar]
- 26.Scott KA, Fisher GG, Barón AE, Tompa E, Stallones L, DiGuiseppi C. Same-level fall injuries in US workplaces by age group, gender, and industry. Am J Ind Med 2018;61(2):111–119. [DOI] [PubMed] [Google Scholar]
- 27.Bravo G, Viviani C, Lavallière M, Arezes P, Martínez M, Dianat I, et al. Do older workers suffer more workplace injuries? A systematic review. Int J Occup Saf Ergon 2022;28(1):398–427. [DOI] [PubMed] [Google Scholar]
- 28.Son HM, Kim SH, Shin SD, Ryoo HW, Ryu HH, Lee JH. Occupational fall injuries presenting to the emergency department. Emerg Med Australas 2014;26(2):188–93. [DOI] [PubMed] [Google Scholar]
- 29.Kim YH, Choi JH, Chung YK, Kim SW, Kim J. Epidemiologic study of hand and upper extremity injuries by power tools. Arch Plast Surg 2019;46(1):63–68. [DOI] [PMC free article] [PubMed] [Google Scholar]
- 30.Hauschild VD, Schuh-Renner A, Lee T, Richardson MD, Hauret K, Jones BH. Using causal energy categories to report the distribution of injuries in an active population: An approach used by the U.S. Army. J Sci Med Sport 2019;22(9):997–1003. [DOI] [PubMed] [Google Scholar]