

Abstract
Rationale & Objective:
Ultraprocessed foods are widely consumed in the US and are associated with cardiovascular disease (CVD), mortality, and kidney function decline in the general population. We investigated associations between ultraprocessed food intake and chronic kidney disease (CKD) progression, all-cause mortality, and incident CVD in adults with CKD.
Study Design:
Prospective cohort study.
Setting & Participants:
Chronic Renal Insufficiency Cohort (CRIC) Study participants who completed baseline dietary questionnaires.
Exposure:
Ultraprocessed food intake (servings/day), classified according to the NOVA system
Outcomes:
CKD progression [≥50% decline in estimated glomerular filtration rate (eGFR) or initiation of kidney replacement therapy], all-cause mortality, and incident cardiovascular disease (myocardial infarction, congestive heart failure, or stroke).
Analytical Approach:
Cox proportional hazards models adjusted for demographic, lifestyle, and health covariates.
Results:
There were 1047 CKD progression events observed over a median follow-up of 7 years. Greater ultraprocessed food intake was associated with higher risk of CKD progression (tertile 3 vs. 1: HR 1.22, 95% CI: 1.04, 1.42; P-trend=0.01). The association differed by baseline kidney function, such that greater intake was associated with higher risk among people with CKD stages 1 and 2 (eGFR≥60 mL/min/1.73 m2; tertile 3 vs. 1: HR 2.61, 95% CI: 1.32, 5.18) but not stages 3a-5 (eGFR<60 mL/min/1.73 m2; P-interaction=0.003). There were 1104 deaths observed over a median follow-up of 14 years. Greater ultraprocessed food intake was associated with higher risk of mortality (tertile 3 vs. 1: HR 1.21, 95% CI: 1.04, 1.40; P-trend=0.004).
Limitations:
Self-reported diet.
Conclusions:
Greater ultraprocessed food intake may be associated with CKD progression in earlier stages of CKD, and is associated with higher risk of all-cause mortality in adults with CKD.
Keywords: CRIC study, dietary intake, epidemiology, kidney disease, nutrition, NOVA, ultraprocessed foods
Plain Language Summary
Ultra-processed foods are industrial formulations produced using ingredients and processes that are not commonly used in culinary preparations and contain few, if any, intact unprocessed foods. Ultra-processed foods are widely consumed in the US, and high intakes of such foods have been linked to cardiovascular disease, kidney disease, and mortality in the general population. In this study, we found that greater intake of ultra-processed foods was associated with higher risk of kidney disease progression and mortality in adults with chronic kidney disease. Our findings suggest that patients with kidney disease may benefit from greater consumption of fresh, whole, and homemade or hand-prepared foods and fewer highly processed foods.
Introduction
Ultra-processed foods are industrial formulations produced through chemical and physical modifications of foods that typically contain nonculinary ingredients and additives.1 These foods are often higher in salt, sugar, and unhealthy fats, and lower in fiber than less processed foods.1 More than half of the calories consumed by Americans come from ultra-processed foods.2,3 Greater consumption of ultra-processed foods is associated with adverse health outcomes including cardiovascular disease (CVD) incidence and mortality,4–8 all-cause mortality,9–13 and kidney function decline14–16 in general population cohorts.
The higher sodium content and highly bioavailable inorganic phosphate additives in ultra-processed foods may be particularly harmful to people with chronic kidney disease (CKD), due to the effects of these nutrients on blood pressure, fluid balance, and bone mineral metabolism.17,18 However, such foods may be favored for their convenience, palatability, and affordability. Whether higher ultra-processed food intake is associated with worse disease prognosis in people with CKD is unknown. Therefore, we assessed ultra-processed food intakes in a cohort of US adults with CKD and investigated the association between greater ultra-processed food consumption and risk of CKD progression, all-cause mortality, and incident CVD.
Methods
Study Population
The Chronic Renal Insufficiency Cohort (CRIC) Study is a multicenter prospective cohort study.19 The original cohort (n=3939) consisted of adults (21–74 years) with reduced estimated glomerular filtration rate (eGFR; 20–70 mL/min/1.73 m2) enrolled between 2003 and 2008 at seven US clinical centers. Follow-up occurred every 6 months, with annual in-person clinic visits and interim 6-month telephone calls. The institutional review board at each clinical site approved the study protocol, and participants provided informed consent. Procedures were followed in accordance with the Declaration of Helsinki.
Our analytic sample excluded participants who skipped >12 items on the baseline diet assessment or had implausible energy intakes (men: <800 or >5000 kcal; women: <600 or >4000 kcal) (Figure S1). We further excluded participants with missing covariates, leaving 2778 participants for the analysis of all-cause mortality. For the analysis of CKD progression, we further excluded 162 participants who did not attend any clinic visits after the baseline visit, as in-person visits were required to estimate GFR. For the analysis of incident CVD, we excluded 897 participants with prevalent CVD at baseline and 13 people who were not followed beyond baseline. The final sample sizes were 2616 for CKD progression, 2778 for all-cause mortality, and 1868 for incident CVD.
Dietary Assessment and Classification of Ultra-Processed Foods
Usual dietary intake was assessed at baseline, year 2, and year 4 using the Diet History Questionnaire (DHQ)-1, a validated food frequency questionnaire developed by the National Cancer Institute.20,21 Using paper forms, participants selected the portion size and consumption frequency of 124 foods and beverages over the past year. Responses were converted into average daily nutrient and Pyramid food group serving totals through linkage to the DHQ nutrient and food group database using Diet*Calc software (Diet*Calc Analysis Program, Version 1.4.3; National Cancer Institute, Epidemiology and Genomics Research Program).
We averaged dietary data across all visits (baseline, year 2, and year 4) to improve estimation of usual intake.22 Only baseline dietary data was used for participants who died, were lost to follow-up, or experienced the event of interest (CKD progression or CVD) within the first 2 study years. Baseline and year 2 data were averaged for participants who died, were lost to follow-up, or experienced an event between year 2 and year 4. Dietary data from all three visits were averaged for all other participants.
We categorized items into four groups using the NOVA classification system, which groups foods according to the degree and purpose of processing.1 We chose the NOVA classification system because it is the most well described and commonly used processing classification system in the published literature. Group 1 consists of unprocessed or minimally processed foods, which are derived from nature with no or minimal alteration. Group 2 consists of processed culinary ingredients, which are derived from Group 1 foods (e.g. by pressing, milling, and refining) and used in culinary preparations. Group 3 consists of processed foods, which are made by combining foods from Groups 1 and 2 to preserve or enhance the palatability of Group 1 foods. Group 4 consists of ultra-processed foods, which are industrial formulations of substances extracted from foods combined with additives and processed using methods not typically used in culinary preparations (e.g. hydrogenation, extrusion). Two researchers independently categorized all items, with substantial agreement (Cohen’s kappa=0.73). Discordantly classified items were conservatively assigned to the lesser processed group. In a sensitivity analysis, assigning these items to the more processed group did not substantially change estimated associations (Table S1).
Total ultra-processed food consumption was defined as daily average servings of Group 4 foods. Serving sizes were based on reference amounts customarily consumed.23 We adjusted for total energy intake using the residual method24 and divided participants into tertiles based on their energy-adjusted intake of ultra-processed foods.
Outcome Ascertainment
The primary outcome was CKD progression, defined as 50% reduction in eGFR from baseline or initiation of kidney replacement therapy (KRT; dialysis or transplant). GFR was estimated based on age, sex, and serum creatinine using the 2021 CKD-EPI equation.25 To calculate time to eGFR halving, a linear decline in eGFR between visits was assumed.26,27 KRT was self-reported, confirmed by review of dialysis unit or hospital records, and supplemented by data from the US Renal Data System.
Secondary outcomes included all-cause mortality and incident CVD. Deaths were ascertained by report from next of kin, death certificates, hospital records, and linkage to the Social Security Death Master File. Incident CVD was defined as a composite of myocardial infarction, congestive heart failure, or stroke.19,29 Cardiovascular events were ascertained by self-report of cardiovascular-related hospitalizations, outpatient tests, and interventions every 6 months. Events were adjudicated by at least 2 study physicians by medical record review.
Covariate Assessment
Sociodemographic information (age, sex, race/ethnicity, education, income), smoking status, and medication use were self-reported on questionnaires at baseline. Physical activity was assessed using the Typical Week Physical Activity Survey and expressed in total weekly metabolic equivalent of task (MET)-hours. Body mass index (BMI) was calculated from weight and height measured at clinic visits. Seated blood pressure was measured according to a standardized protocol, and the average of three readings was calculated. Diabetes was defined by meeting any of the following criteria: fasting blood glucose ≥126 mg/dL, non-fasting glucose ≥200 mg/dL, or use of insulin or oral anti-diabetes medications. Diet quality was scored using the Healthy Eating Index-2015, which assesses adherence to the 2015–2020 Dietary Guidelines for Americans, with higher scores indicating better alignment with dietary guidelines.30
Statistical Analyses
Participant characteristics and dietary intakes were summarized as means (± standard deviation) or medians (25th-75th percentiles) and proportions. We used multivariable Cox proportional hazards models to assess the association between ultra-processed food intake and CKD progression, all-cause mortality, and incident CVD, with person-years calculated from study baseline until the date of an event, study withdrawal, or administrative censoring (May 2020). Analyses of CKD progression and incident CVD were also censored for death. The primary analysis compared participants according to tertiles of ultra-processed food intake, with tertile 1 as the reference group. We tested for trends across tertiles using the median value within each tertile. Model 1 adjusted for age (continuous), sex, total energy intake (continuous), race/ethnicity (non-Hispanic white, non-Hispanic black, or other), education (less than high school, high school graduate, some college, or college graduate), income (<$20,000, $20,001–50,000, $50,001–100,000, >$100,000, or “do not wish to answer”), smoking status (current, former, never), physical activity (continuous MET-min/week), and study site. We considered model 1 as the main model for interpretation of results. Model 2 adjusted for model 1 covariates plus baseline eGFR (linear spline with knots at 30, 45, and 60 mL/min/1.73 m2) and proteinuria (<0.1, 0.1-<0.5, 0.5-<1.5, ≥1.5 g/day). Model 3 adjusted for model 2 covariates plus BMI (continuous), systolic blood pressure (continuous), number of blood pressure medications (continuous), diabetes (yes/no), antiplatelet medication use (yes/no), and lipid-lowering medication use (yes/no). Model 4 adjusted for HEI-2015 scores in addition to our main model (model 1) covariates to understand whether associations were explained by diet quality. We tested the proportional hazards assumption using Schoenfeld residuals. We also examined associations between continuous ultra-processed food intake (servings/day) and outcomes and visualized associations using a restricted cubic spline with knots at the 5th, 35th, 65th, and 95th percentiles.31
We assessed the consistency of findings across subgroups defined by sex, diabetes status, hypertensive status (defined as systolic/diastolic blood pressure ≥140/≥90 mmHg), CKD stage (stages 1 and 2 [eGFR≥60 mL/min/1.73 m2] versus stages 3a to 5 [eGFR<60 mL/min/1.73 m2)]), and proteinuria (<1.5 versus ≥1.5 g/day) using likelihood ratio tests that compared model 1 with an interaction term to model 1 without an interaction term. As the rate of CKD progression and its association with other dietary factors differs in these subgroups, we hypothesized that the relative risk associated with ultra-processed food consumption might differ according to these groups.
In order to understand whether associations between ultra-processed foods and outcomes were driven by particular types of foods, we examined associations with individual ultra-processed foods. In a secondary analysis, we also investigated associations between energy-adjusted servings of unprocessed or minimally processed foods (NOVA Group 1) and outcomes.
All statistical tests were two-sided with a 0.05 level of significance. Analyses were performed using Stata version 16.1 (StataCorp, LLC).
Results
Among the 2616 participants included in the analysis of CKD progression, the median ultra-processed food intake was 5.6 servings/day (25th-75th percentile: 3.7–8.0). Beverages were the primary type of ultra-processed food consumed (25%), followed by snacks and sweets (20%) and grains (19%) (Figure 1).
Figure 1.
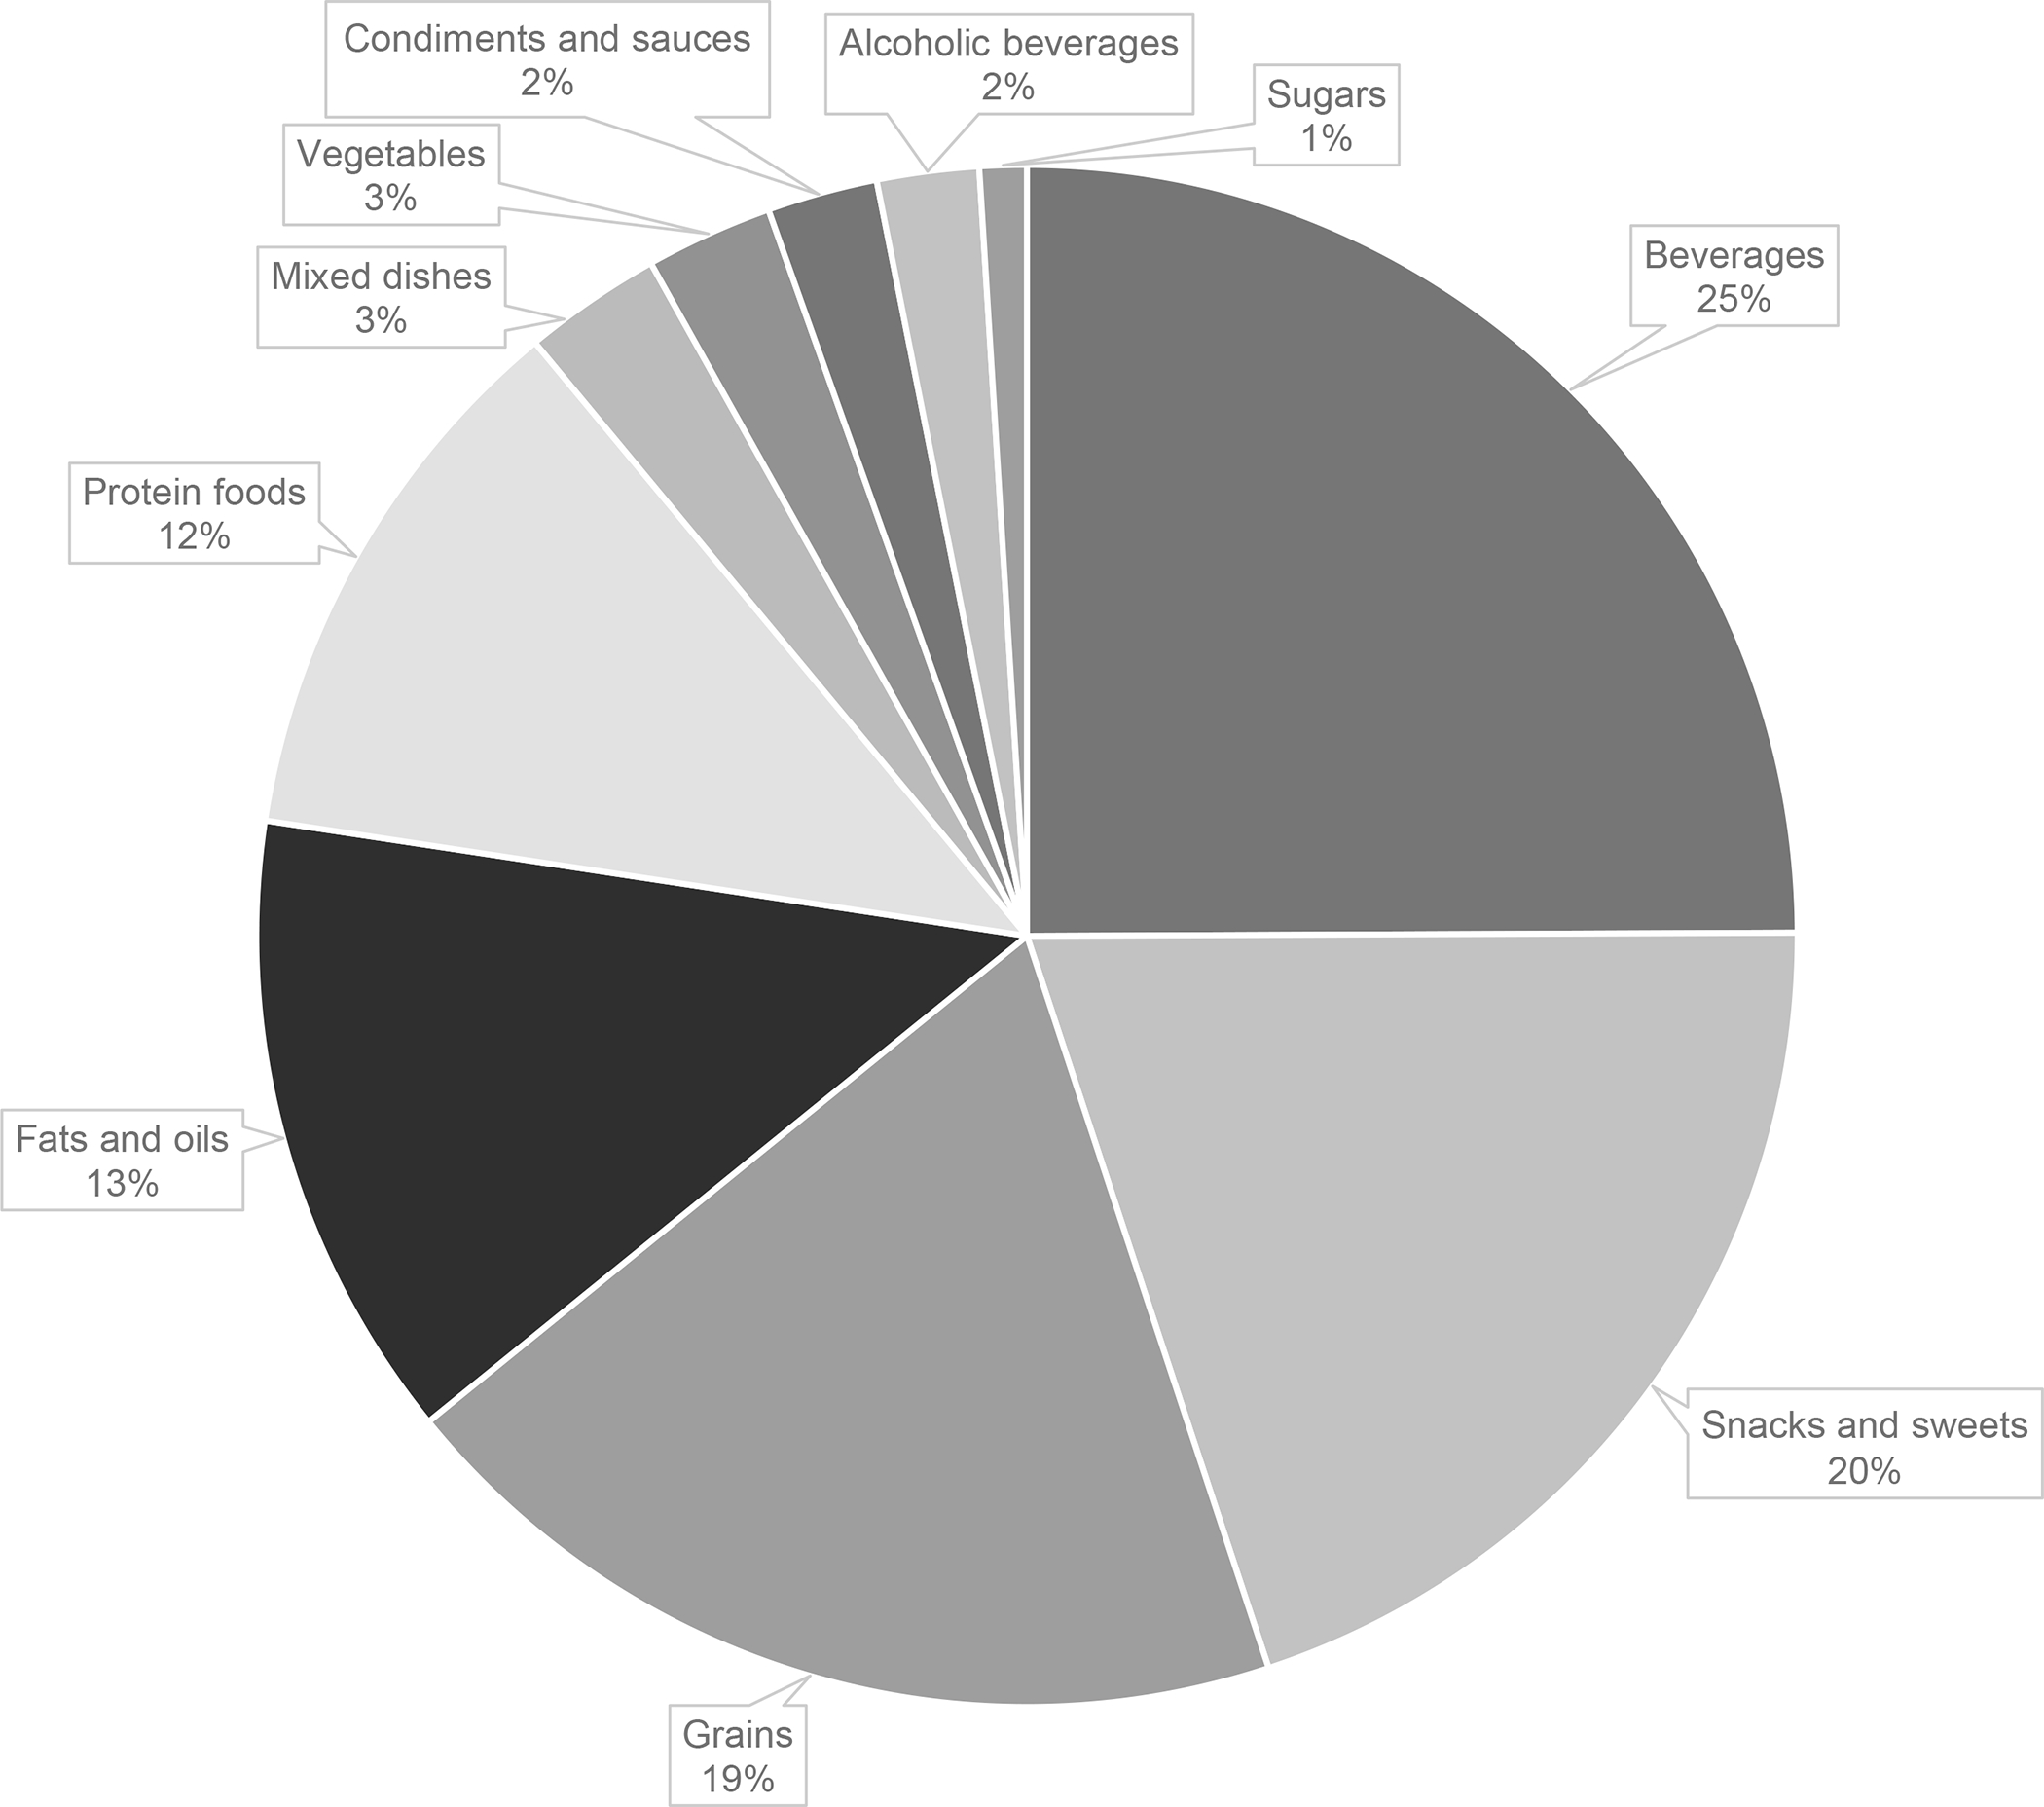
Proportion of total ultra-processed foods (servings/day) contributed by each food category in the Chronic Renal Insufficiency Cohort Study.
Beverages: fruit drinks, meal replacement beverages, soft drinks; snacks and sweets: crackers, potato chips, corn chips, pretzels, energy bars, frozen yogurt, ice cream, cake, cookies, brownies, doughnuts, sweet rolls, Danish, fruit crisp/cobbler, pies, chocolate candy, other candy; grains: ready-to-eat breakfast cereals, bagels, English muffins, bread, rolls, corn bread, biscuits, sweet muffins, dessert breads; fats and oils: salad dressing, margarine, cream cheese, mayonnaise, non-dairy creamer; protein foods: roast beef, poultry cold cuts, deli-style ham, other cold cuts, hot dogs, bacon, sausage, fish sticks, fried fish, tofu* and soy meat products, egg substitute; mixed dishes: stuffing, dumplings, chili, Mexican foods, pizza; vegetables: French fries, home fries, hash browned potatoes, tater tots; condiments and sauces: cheese sauce, catsup, gravy; alcoholic beverages: liquor, mixed drinks; sugars: jams, jellies, honey*.
*While not ultra-processed, intake of these foods were queried in conjunction with other ultra-processed foods and could not be separately quantified.
Participants with the highest ultra-processed food intakes were less educated, had higher BMI and lower eGFR, and were more likely to identify as female, have diabetes, and use lipid-lowering medications compared to those with the lowest intakes (Table 1). Participants with higher ultra-processed food intakes had lower diet quality, lower intakes of dietary fiber, potassium, and phosphorus, and higher intakes of sodium and added sugars than participants with lower ultra-processed food intakes (Table 2).
Table 1.
Participant characteristics by tertile of energy-adjusted servings/day of ultra-processed food consumption in the Chronic Renal Insufficiency Cohort Study (n=2616).a
| Participant characteristic | Tertile 1 (n=872) | Tertile 2 (n=872) | Tertile 3 (n=872) | P-valueb |
|---|---|---|---|---|
| Ultra-processed food intake, servings/dayc | 4.5 (3.6–5.0) | 6.2 (5.8–6.5) | 8.3 (7.5–9.8) | |
| Age, y | 58 ± 10 | 59 ± 11 | 57 ± 11 | <0.001 |
| Female, n (%) | 378 (43) | 438 (50) | 439 (50) | 0.004 |
| Race/ethnicity, n (%) | <0.001 | |||
| Non-Hispanic white | 429 (49) | 440 (50) | 460 (53) | |
| Non-Hispanic black | 324 (37) | 371 (43) | 368 (42) | |
| Other | 119 (14) | 61 (7) | 44 (5) | |
| College graduate, n (%) | 415 (48) | 297 (34) | 277(32) | <0.001 |
| Income, n (%) | 0.05 | |||
| >$50,000 | 315 (36) | 307 (35) | 282 (32) | |
| Do not wish to answer | 147 (17) | 117 (13) | 143 (16) | |
| Total energy intake, kcal/d | 1914 ± 758 | 1556 ± 621 | 1824 ± 734 | <0.001 |
| Physical activity, MET-min/wk | 209 ± 135 | 196 ± 126 | 205 ± 139 | 0.1 |
| Body mass index, kg/m2 | 31.0 ± 7.2 | 31.8 ± 7.4 | 33.1 ± 8.5 | <0.001 |
| eGFR, mL/min/1.73 m2 | 47 ± 16 | 44 ± 14 | 44 ± 15 | <0.001 |
| Proteinuria ≥1.5 g/day, n (%) | 127 (15) | 146 (17) | 164 (19) | 0.07 |
| Smoking status, n (%) | 0.05 | |||
| Current smoker | 96 (11) | 110 (13) | 129 (15) | |
| Former smoker | 353 (40) | 370 (42) | 376 (43) | |
| Diabetes, n (%) | 354 (41) | 372 (43) | 435 (50) | <0.001 |
| Systolic blood pressure, mmHg | 127 ± 22 | 127 ± 21 | 126 ± 20 | 0.9 |
| Diastolic blood pressure, mmHg | 72 ± 12 | 71 ± 12 | 71 ± 12 | 0.1 |
| Blood pressure medications, number | 2 ± 2 | 3 ± 2 | 3 ± 1 | <0.001 |
| Lipid-lowering medication use, n (%) | 478 (55) | 547 (63) | 546 (63) | 0.001 |
| Antiplatelet medication use, n (%) | 411 (47) | 419 (48) | 398 (46) | 0.6 |
Values are median (25th-75th percentile) or mean ± standard deviation
P-values for chi-square tests (categorical variables) or analysis of variance tests (continuous variables) comparing values across tertiles
Energy-adjusted intakes standardized at mean energy intake
Abbreviations: eGFR, estimated glomerular filtration rate; MET, metabolic equivalent of task
Table 2.
HEI-2015 scores and nutrient intakes by tertile of energy-adjusted servings/day of ultra-processed food consumption in the Chronic Renal Insufficiency Cohort Study (n=2616).a
| Nutritional factor | Tertile 1 (n=872) | Tertile 2 (n=872) | Tertile 3 (n=872) | P-valueb |
|---|---|---|---|---|
| HEI-2015 score | 68.7 ± 9.5 | 65.1 ± 8.9 | 60.6 ± 9.0 | <0.001 |
| HEI-2015 component scores | ||||
| Total fruits | 4.3 ± 1.2 | 4.3 ± 1.2 | 3.9 ± 1.4 | <0.001 |
| Whole fruits | 4.5 ± 1.2 | 4.4 ± 1.1 | 4.2 ± 1.3 | <0.001 |
| Total vegetables | 4.3 ± 1.1 | 4.0 ± 1.1 | 3.6 ± 1.3 | <0.001 |
| Greens and beans | 3.6 ± 1.6 | 3.0 ± 1.6 | 2.4 ± 1.5 | <0.001 |
| Whole grains | 3.4 ± 2.2 | 3.7 ± 2.2 | 3.6 ± 2.4 | 0.02 |
| Dairy | 4.7 ± 2.8 | 4.5 ± 2.5 | 4.3 ± 2.5 | 0.005 |
| Total protein foods | 4.7 ± 0.7 | 4.7 ± 0.7 | 4.6 ± 0.8 | <0.001 |
| Seafood and plant proteins | 4.3 ± 1.1 | 4.1 ± 1.2 | 3.8 ± 1.3 | <0.001 |
| Fatty acids | 6.3 ± 2.9 | 5.9 ± 2.6 | 5.7 ± 2.6 | <0.001 |
| Refined grains | 8.8 ± 1.8 | 8.4 ± 1.9 | 7.8 ± 2.3 | <0.001 |
| Sodium | 4.8 ± 2.7 | 4.4 ± 2.6 | 4.3 ± 3.1 | <0.001 |
| Added sugars | 8.2 ± 2.2 | 7.0 ± 2.8 | 6.2 ± 3.5 | <0.001 |
| Saturated fats | 6.8 ± 2.9 | 6.4 ± 2.8 | 6.2 ± 2.9 | <0.001 |
| Protein, g/kg body weight | 0.9 ± 0.4 | 0.7 ± 0.3 | 0.7 ± 0.4 | <0.001 |
| Protein, %kcal | 16 ± 3 | 16 ± 3 | 15 ± 4 | <0.001 |
| Carbohydrate, %kcal | 50 ± 10 | 51 ± 9 | 51 ± 10 | 0.1 |
| Total fat, %kcal | 34 ± 7 | 34 ± 7 | 34 ± 7 | 0.3 |
| Saturated fat, %kcal | 10 ± 3 | 11 ± 3 | 11 ± 3 | <0.001 |
| MUFA, %kcal | 13 ± 3 | 13 ± 3 | 13 ± 3 | 0.9 |
| PUFA, %kcal | 8 ± 2 | 8 ± 2 | 8 ± 2 | 0.2 |
| Alcohol, g/day | 8 ± 19 | 4 ± 9 | 5 ± 15 | <0.001 |
| Alcohol, g/1000 kcal | 4 ± 7 | 3 ± 5 | 3 ± 7 | 0.001 |
| Dietary fiber, g/1000 kcal | 11 ± 4 | 10 ± 3 | 9 ± 3 | <0.001 |
| Potassium, mg/1000 kcal | 1876 ± 448 | 1742 ± 374 | 1549 ± 401 | <0.001 |
| Phosphorus, mg/1000 kcal | 663 ± 133 | 638 ± 115 | 629 ± 141 | <0.001 |
| Sodium, mg/1000 kcal | 1571 ± 307 | 1605 ± 264 | 1621 ± 358 | 0.003 |
| Added sugar, %kcal | 9 ± 5 | 12 ± 6 | 15 ± 11 | <0.001 |
Values are mean ± standard deviation. HEI-2015 ranges from 0–100.
P-value for analysis of variance comparing mean intakes across tertiles
Abbreviations: HEI, Healthy Eating Index; MUFA, monounsaturated fatty acids; PUFA, polyunsaturated fatty acids
Compared to our study sample, those who were excluded from our analysis were similar in age, BMI, and smoking status (Table S2). Among excluded participants who had dietary data, average energy intakes and ultra-processed food intakes were comparable to our study sample. Those who were excluded were more commonly men and were less likely to identify as non-Hispanic white, attain college-level education, or report income >$50,000. They also reported lower physical activity, had lower eGFR, higher proteinuria, and higher systolic blood pressure, and were more likely to have diabetes.
CKD Progression
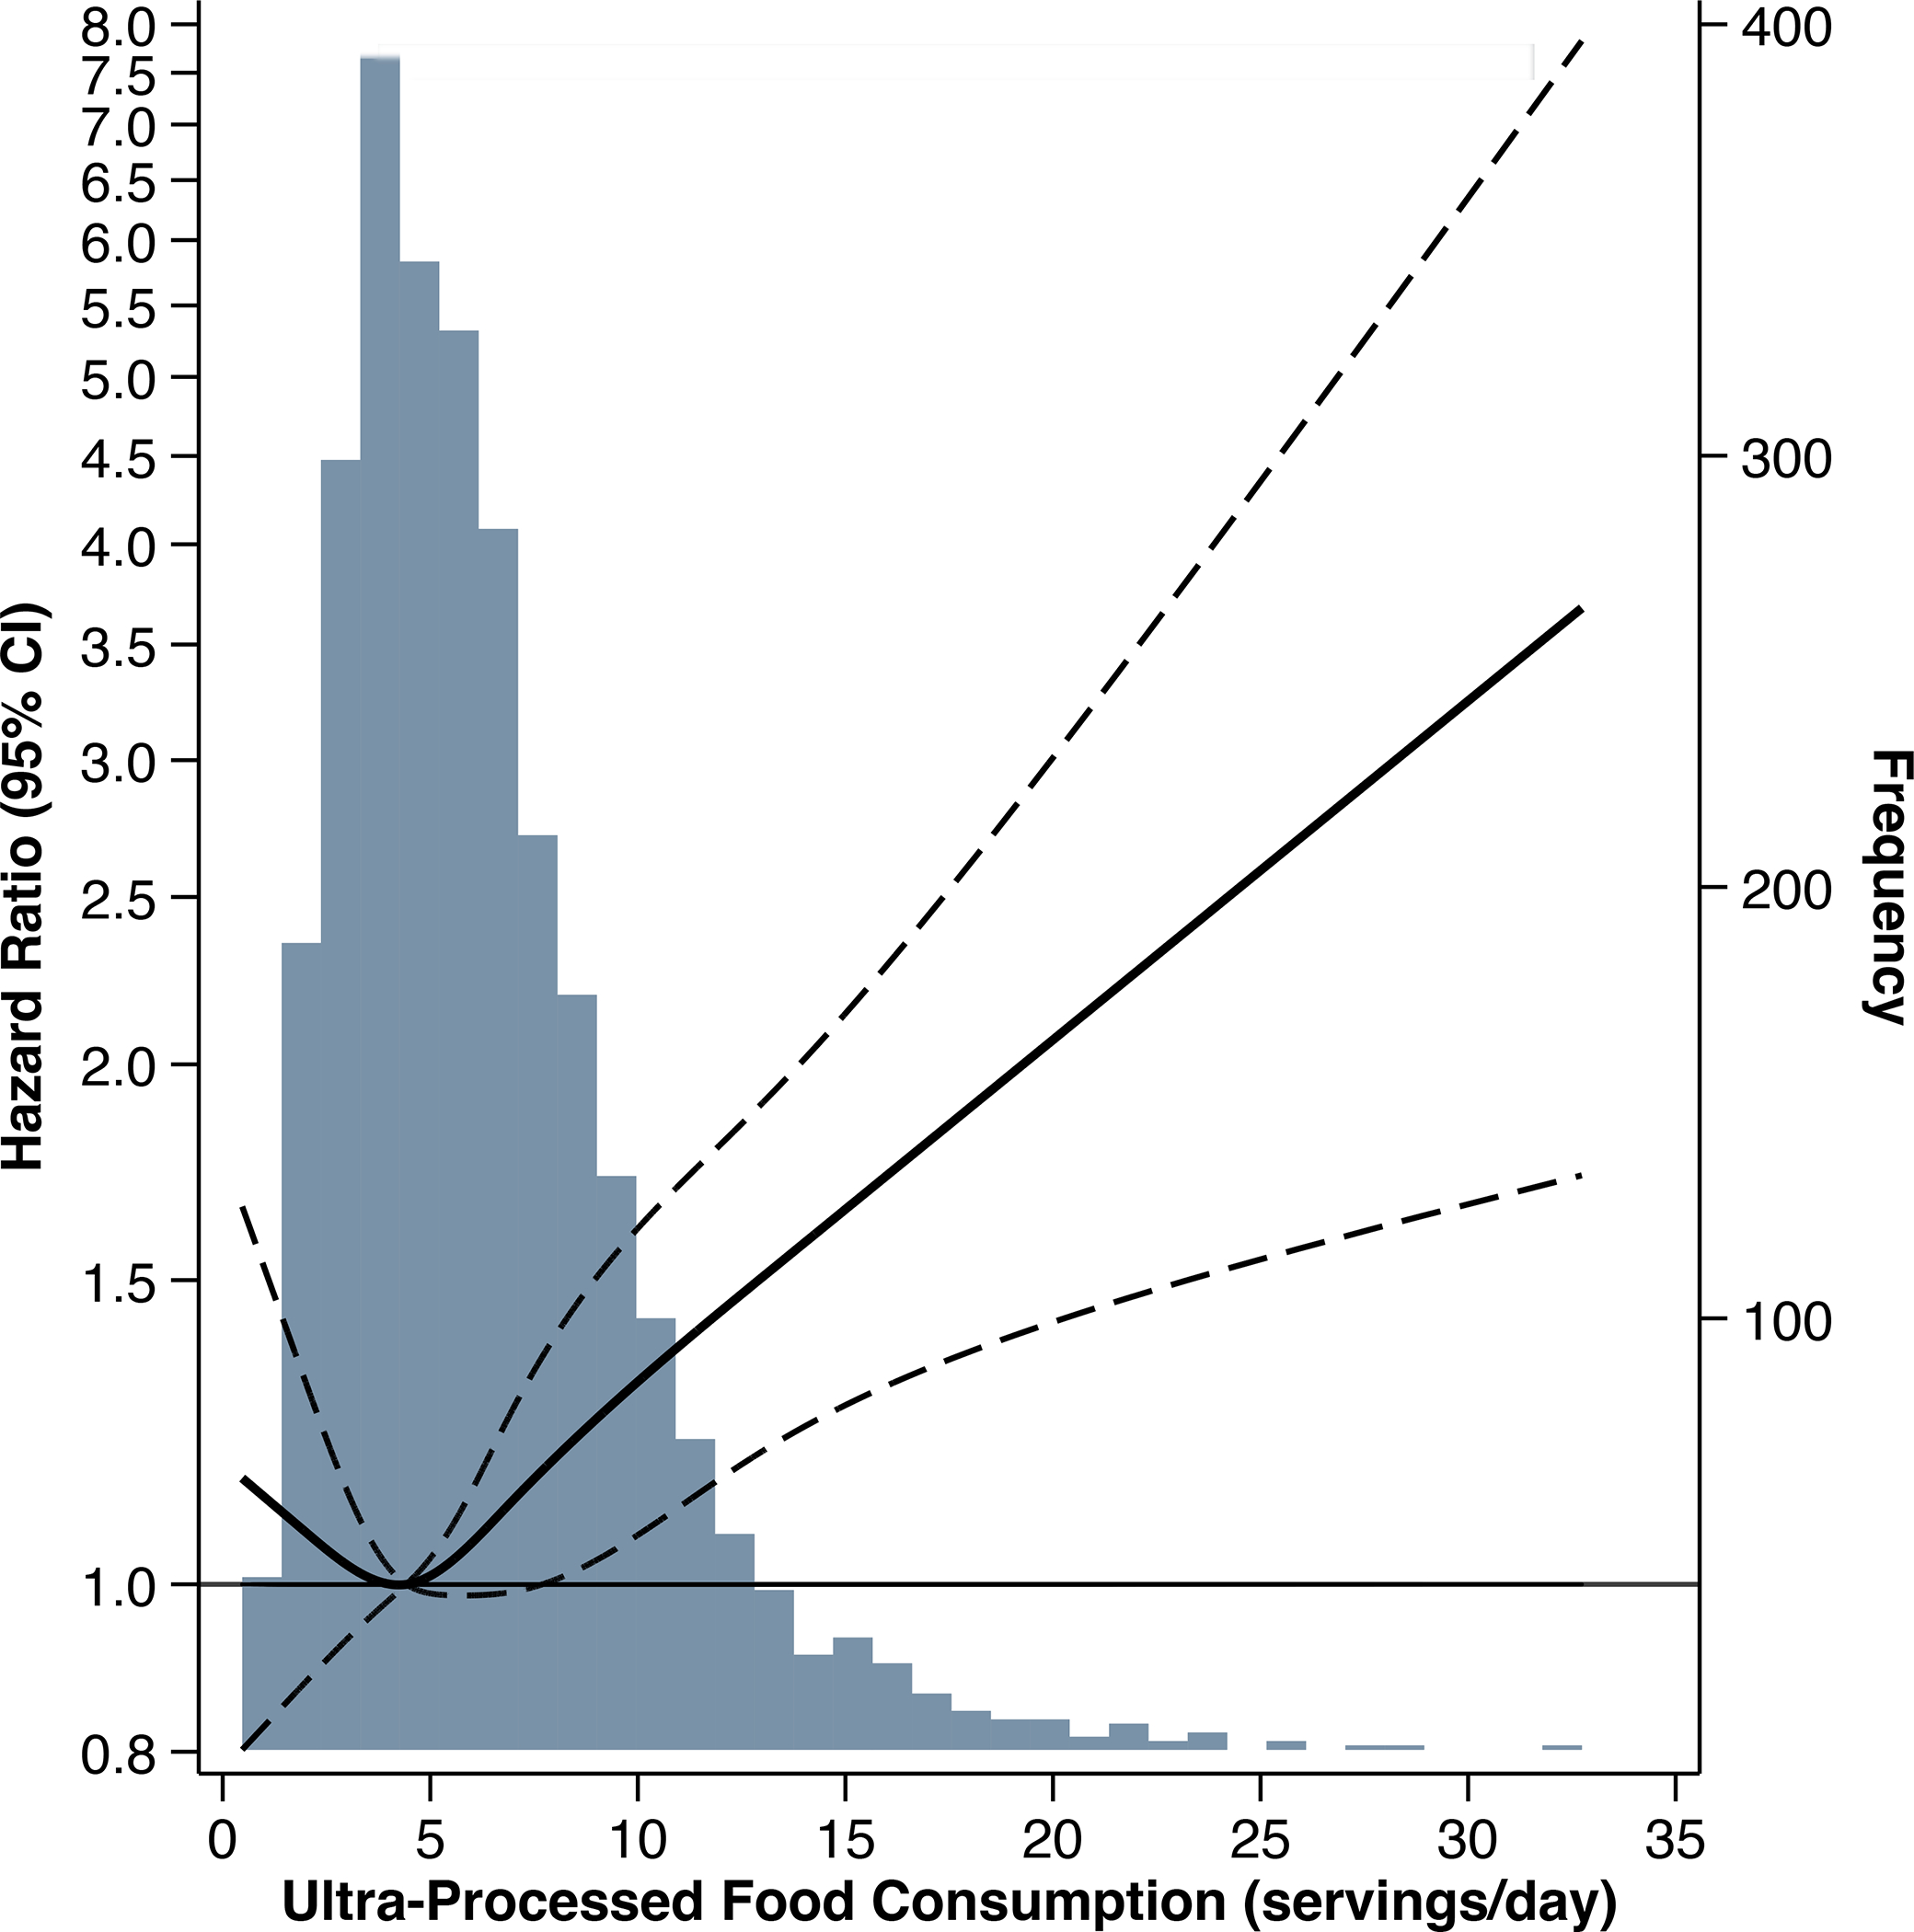
There were 1047 CKD progression events (of which 837 were KRT initiation) observed over a median follow-up of 7 years. Higher ultra-processed food consumption was associated with a 33% higher risk of CKD progression, comparing tertile 3 versus 1 (Table 3). After accounting for demographic characteristics (age, sex, race/ethnicity, education, income), lifestyle covariates (smoking status, physical activity), energy intake, and study site (model 1), higher ultra-processed food consumption remained significantly associated with a higher risk of CKD progression (tertile 3 versus 1: HR 1.22, 95% CI: 1.04, 1.42; P-trend: 0.01). The association was approximately linear, such that each additional serving/day was associated with a 3% higher risk of CKD progression (Figure 2). The association was no longer significant after adjustment for baseline kidney function (eGFR and proteinuria; model 2). Hazard ratios were only marginally altered by further adjustment for other potential mediators (model 3). Additionally adjusting our main model for diet quality attenuated associations (tertile 3 versus 1: HR 1.15, 95% CI: 0.97, 1.36; P-trend: 0.1).
Table 3.
Hazard ratios for chronic kidney disease progression, all-cause mortality, and incident cardiovascular disease by tertile of energy-adjusted servings/day of ultra-processed food consumption in the Chronic Renal Insufficiency Cohort Study.a
| Tertile 1 | Tertile 2 | Tertile 3 | P-valueb | |
|---|---|---|---|---|
| CKD progression | ||||
| Events (IR per 1000 py) | 312 (43.8) | 354 (50.4) | 381 (58.3) | |
| Crude | 1 (reference) | 1.15 (0.98, 1.33) | 1.33 (1.14, 1.54) | <0.001 |
| Model 1 | 1 (reference) | 1.10 (0.93, 1.29) | 1.22 (1.04, 1.42) | 0.01 |
| Model 2 | 1 (reference) | 1.05 (0.89, 1.23) | 1.09 (0.93, 1.28) | 0.3 |
| Model 3 | 1 (reference) | 1.08 (0.92, 1.27) | 1.07 (0.91, 1.25) | 0.5 |
| Model 4 | 1 (reference) | 1.06 (0.90, 1.25) | 1.15 (0.97, 1.36) | 0.1 |
| All-cause mortality | ||||
| Events (IR per 1000 py) | 343 (31.4) | 347 (32.2) | 414 (39.8) | |
| Crude | 1 (reference) | 1.03 (0.88, 1.19) | 1.28 (1.11, 1.47) | 0.001 |
| Model 1 | 1 (reference) | 0.93 (0.80, 1.09) | 1.21 (1.04, 1.40) | 0.004 |
| Model 2 | 1 (reference) | 0.95 (0.81, 1.12) | 1.24 (1.07, 1.44) | 0.002 |
| Model 3 | 1 (reference) | 0.97 (0.83, 1.13) | 1.21 (1.04, 1.40) | 0.006 |
| Model 4 | 1 (reference) | 0.89 (0.76, 1.04) | 1.12 (0.96, 1.31) | 0.07 |
| Incident cardiovascular disease | ||||
| Events (IR per 1000 py) | 123 (18.5) | 139 (21.6) | 144 (23.0) | |
| Crude | 1 (reference) | 1.16 (0.91, 1.48) | 1.24 (0.98, 1.58) | 0.08 |
| Model 1 | 1 (reference) | 1.02 (0.79, 1.31) | 1.09 (0.85, 1.40) | 0.5 |
| Model 2 | 1 (reference) | 1.06 (0.82, 1.38) | 1.08 (0.83, 1.39) | 0.6 |
| Model 3 | 1 (reference) | 1.06 (0.82, 1.38) | 1.05 (0.81, 1.36) | 0.7 |
| Model 4 | 1 (reference) | 0.97 (0.75, 1.26) | 1.01 (0.77, 1.32) | 0.9 |
Estimates are hazard ratios (95% confidence interval) from Cox proportional hazard models. Model 1 adjusted for age, sex, total energy intake, race/ethnicity, education, income, smoking status, physical activity, and study site. Model 2 adjusted for model 1 covariates plus estimated glomerular filtration rate and proteinuria. Model 3 adjusted for model 2 covariates plus body mass index, systolic blood pressure, number of blood pressure medications, diabetes status, antiplatelet medication use, and lipid-lowering medication use. Model 4 adjusted for model 1 covariates plus Healthy Eating Index (HEI)-2015 scores.
Boldface denotes P-value<0.05.
P-value for test of trend using median value within each tertile
Abbreviations: CKD, chronic kidney disease; IR, incidence rate; py, person-years
Figure 2.
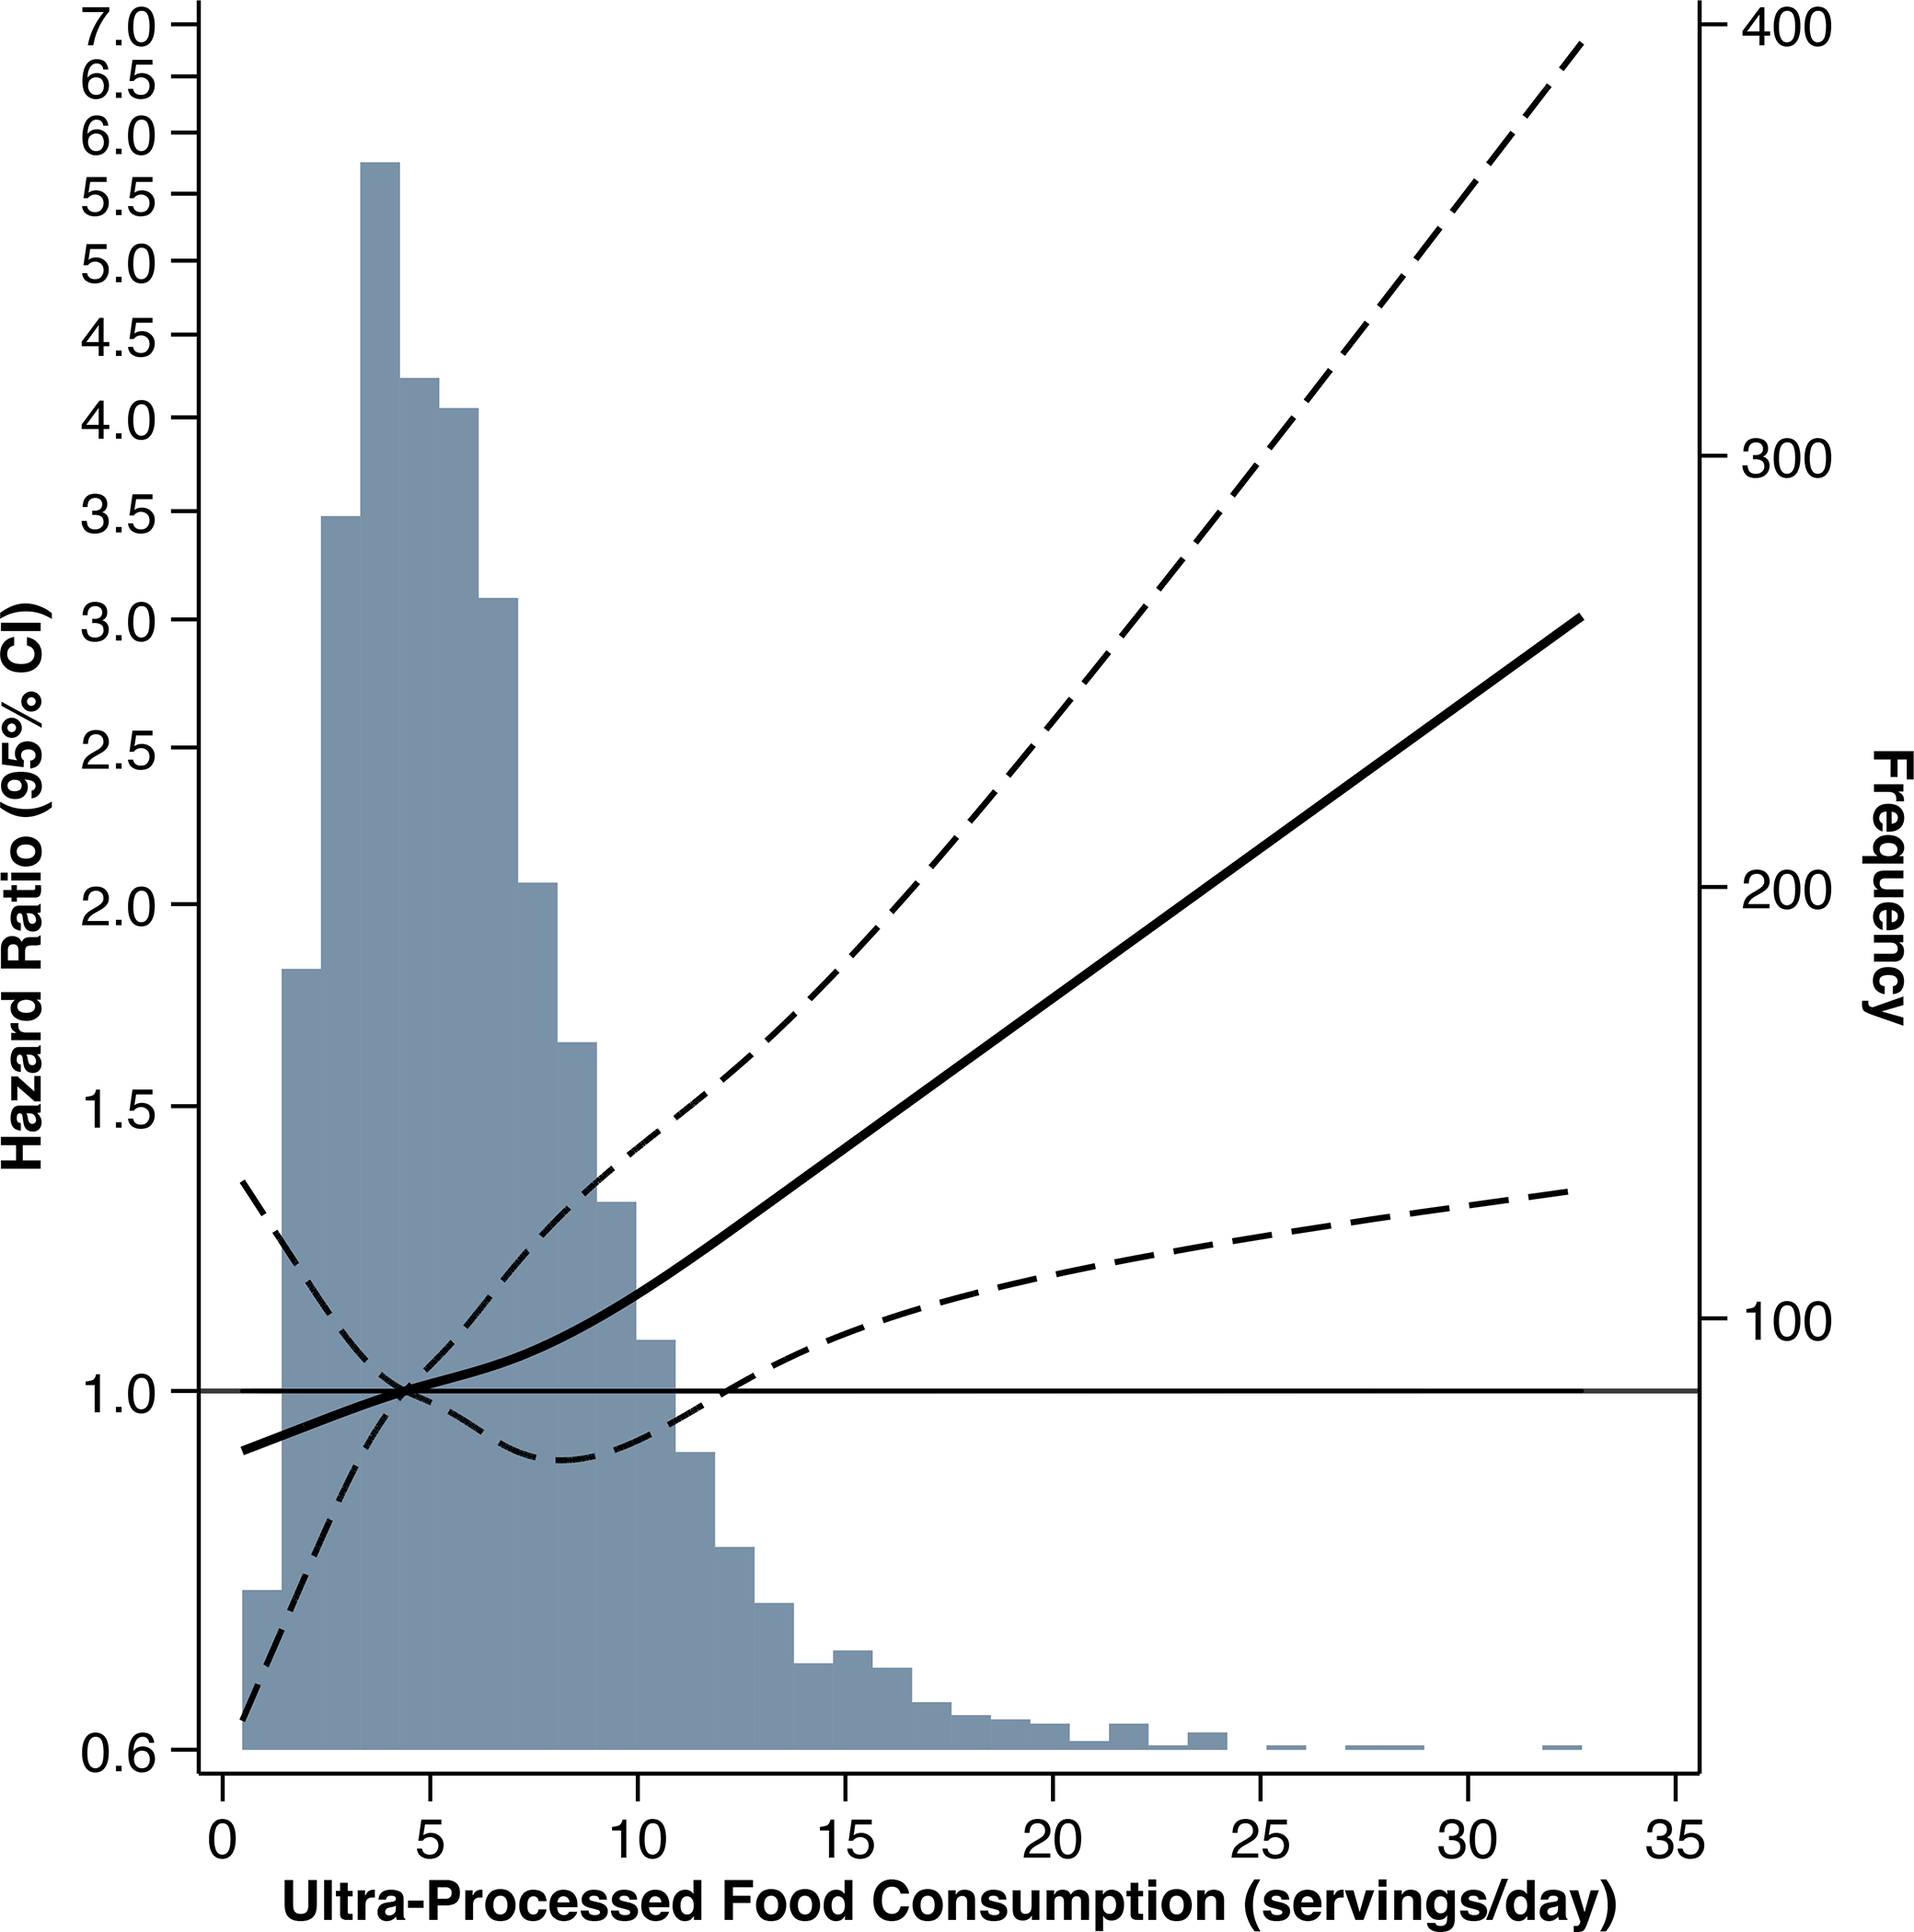
Hazard ratio and 95% confidence interval for risk of chronic kidney disease progression associated with ultra-processed food consumption in the Chronic Renal Insufficiency Cohort Study. Solid line represents the hazard ratio, modeled using restricted cubic spline with knots at the 5th, 35th, 65th, and 95th percentiles of ultra-processed food consumption (servings/day). Dashed lines represent 95% confidence intervals for hazard ratios. The reference level was set at the 35th percentile of intake. Hazard ratios adjusted for age, sex, total energy intake, race/ethnicity, education, income, smoking status, physical activity, and study site. The underlying grey histogram presents the distribution of participants’ ultra-processed food consumption (servings/day).
When we assessed associations with individual ultra-processed foods, greater intakes of ultra-processed beverages and fats and oils were associated with higher risk of CKD progression (Table S3). Unprocessed or minimally processed food consumption was not associated with CKD progression (Table S4).
Associations differed by CKD stage (P=0.003), whereas results were similar for subgroups defined by sex, diabetes status, hypertensive status, and proteinuria (Figure 3). Among participants with CKD stages 3a to 5 (eGFR<60 mL/min/1.73 m2), there was no association between ultra-processed food consumption and CKD progression (tertile 3 versus 1: HR 1.12, 95% CI: 0.95, 1.32). Among those with CKD stages 1 and 2 (eGFR≥60 mL/min/1.73 m2), greater ultra-processed food consumption was associated with a higher risk of CKD progression (tertile 3 versus 1: HR 2.61, 95% CI: 1.32, 5.18), and the association persisted after further adjustment for diet quality (tertile 3 versus 1: HR 2.95, 95% CI: 1.41, 6.16).
Figure 3.
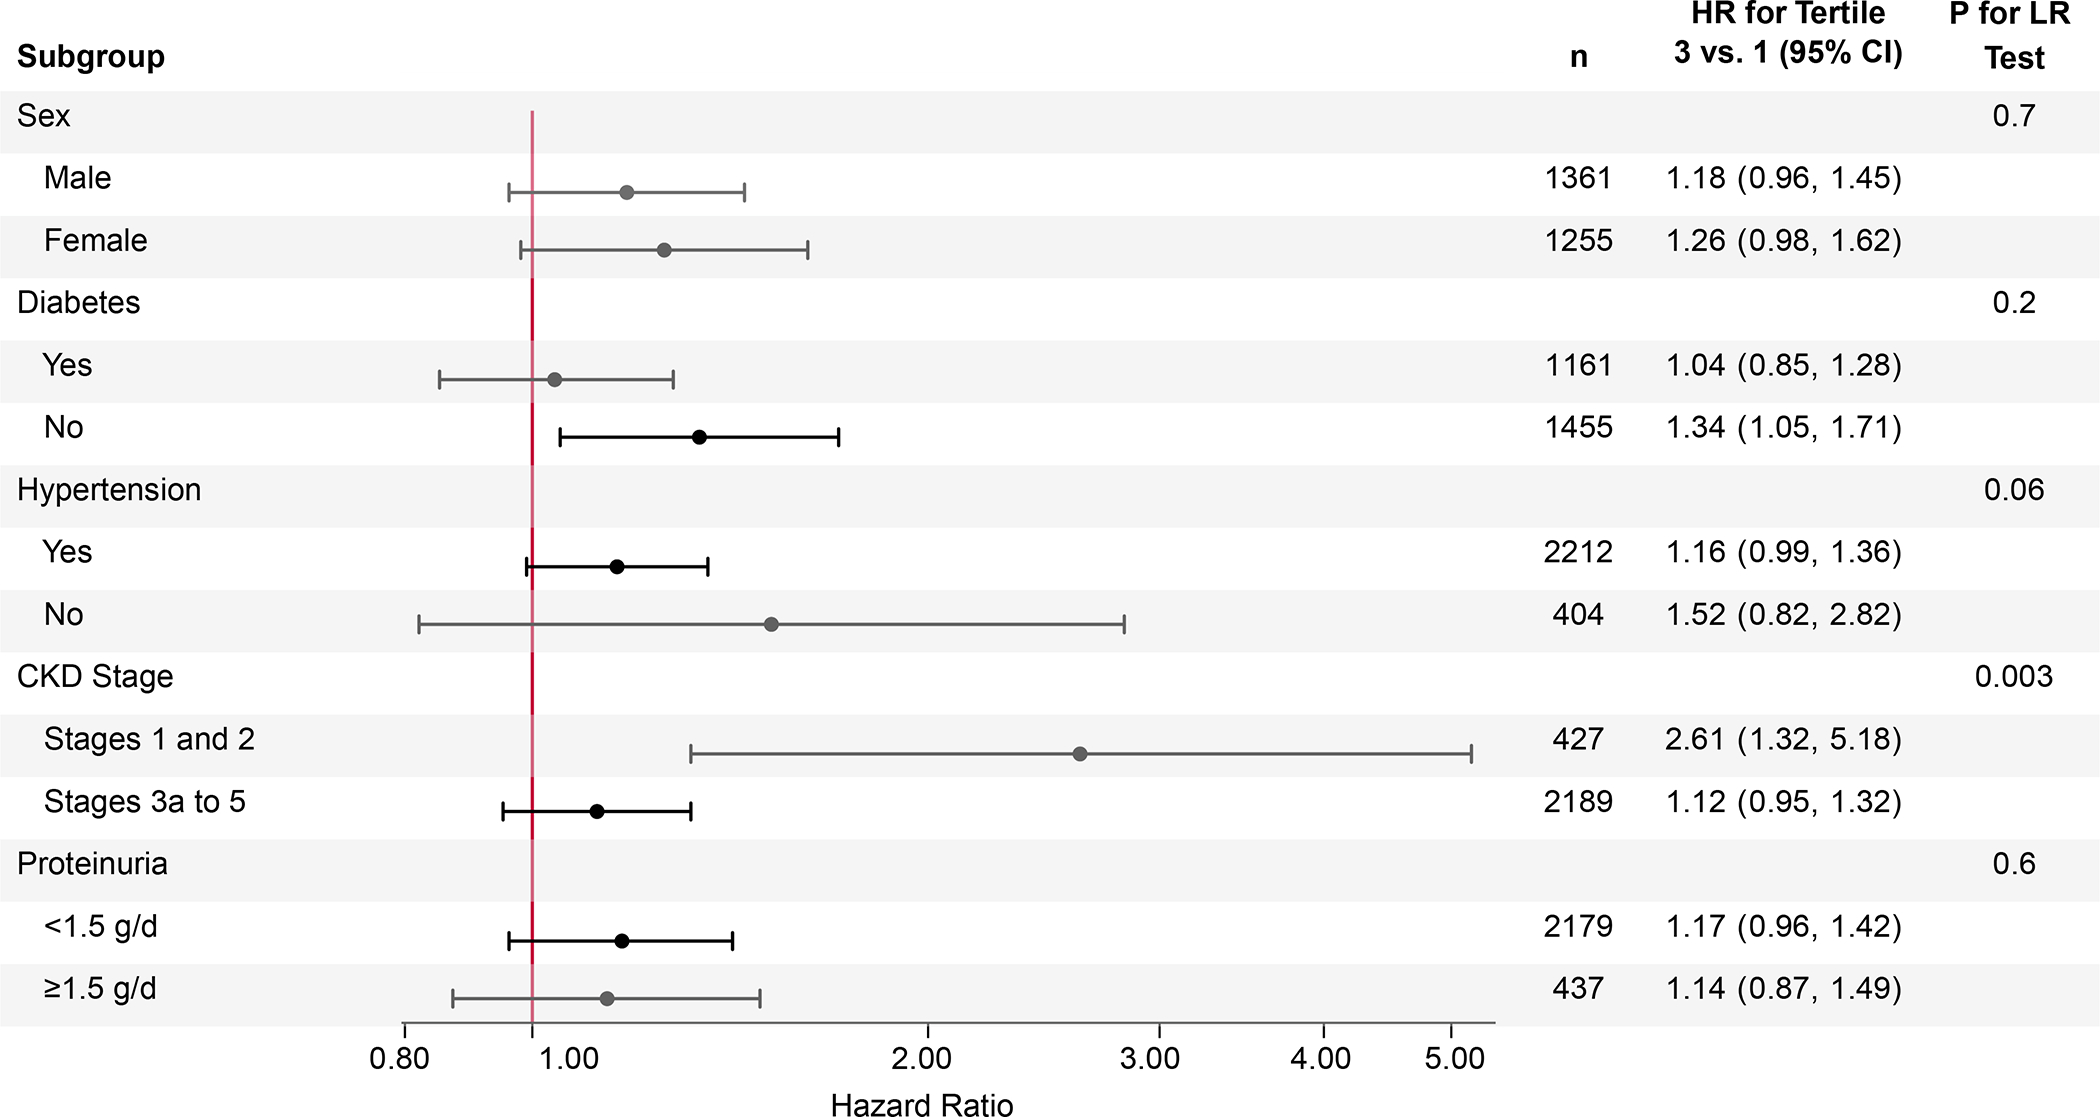
Association between ultra-processed food consumption and risk of chronic kidney disease progression in subgroups. Hazard ratios for tertile 3 versus tertile 1 adjusted for age, sex, total energy intake, race/ethnicity, education, income, smoking status, physical activity, and study site. P-values for likelihood ratio tests comparing adjusted models with versus without interaction terms for subgroups. Abbreviations: CI, confidence interval; CKD, chronic kidney disease; eGFR, estimated glomerular filtration rate; HR, hazard ratio; LR, likelihood ratio
All-Cause Mortality
There were 1104 deaths observed over a median follow-up of 14 years. Death was more common in the highest tertile of ultra-processed food consumption compared to the lowest tertile (HR 1.28, 95% CI: 1.11, 1.47) (Table 3). After adjustment for model 1 covariates, tertile 3 had a 21% higher risk of all-cause mortality compared to tertile 1. The association remained statistically significant after further adjustment for baseline kidney function (model 2, tertile 3 versus 1: 1.24, 95% CI: 1.07, 1.44; P-trend=0.002) and other potential mediators (model 3, tertile 3 versus 1: HR 1.21, 95% CI: 1.04, 1.40; P-trend=0.006). Further adjusting model 1 for diet quality attenuated the association (HR 1.12, 95% CI: 0.96, 1.31). Associations were consistent across subgroups (all P-interaction>0.05).
There was an approximately linear association between ultra-processed food intake and all-cause mortality beyond the 35th percentile of intake, such that each additional serving of ultra-processed food intake was associated with a 7% higher risk of mortality (HR 1.07, 95% CI: 1.04, 1.10; P<0.001) (Figure 4).
Figure 4.
Hazard ratio and 95% confidence interval for risk of all-cause mortality associated with ultra-processed food consumption in the Chronic Renal Insufficiency Cohort Study. Solid line represents the hazard ratio, modeled using restricted cubic spline with knots at the 5th, 35th, 65th, and 95th percentiles of ultra-processed food consumption (servings/day). Dashed lines represent 95% confidence intervals for hazard ratios. The reference level was set at the 35th percentile of intake. Hazard ratios adjusted for age, sex, total energy intake, race/ethnicity, education, income, smoking status, physical activity, and study site. The underlying grey histogram presents the distribution of participants’ ultra-processed food consumption (servings/day).
Considering specific types of ultra-processed foods individually, greater intakes of ultra-processed beverages were significantly associated with higher risk of death (Table S3). Greater consumption of unprocessed or minimally processed foods was not associated with lower risk of all-cause mortality (model 1, tertile 3 vs. 1: HR 0.91, 95% CI: 0.78, 1.06, P-trend=0.2; Table S4).
Incident CVD
Over a median follow-up of 12 years, 406 participants developed CVD. Ultra-processed food consumption was not significantly associated with incident CVD (Table 3; Figure S2). Associations were consistent across subgroups (all P-interaction>0.05). Unprocessed and minimally processed food consumption was not associated with incident CVD (Table S4).
Discussion
Greater ultra-processed food consumption was associated with a higher risk of CKD progression in this cohort of adults with CKD, overall. The association differed by baseline kidney function, such that ultra-processed food consumption was associated with a higher risk of CKD progression among people with higher baseline kidney function but was not associated in people with more advanced CKD. Greater ultra-processed food intake was also associated with a higher risk of all-cause mortality, but was not associated with incident CVD.
Previous studies reported an association between greater ultra-processed food consumption and higher odds of kidney function decline and incident kidney disease among adults with eGFR ≥60 mL/min/1.73 m2.14–16 This is consistent with our observation that greater ultra-processed food intake was associated with CKD progression in adults with higher baseline kidney function (eGFR ≥60 mL/min/1.73 m2). Greater ultra-processed food consumption has also been associated with increased all-cause mortality in general population cohorts,8–13,32 which aligns with our findings in people with CKD. In contrast, we did not replicate the association between ultra-processed food intake and incident CVD that was observed in healthy populations.4–6 However, the high baseline prevalence of CVD in our study population substantially limited our sample size for the analysis of incident CVD. Our study contributes to the mounting evidence implicating ultra-processed foods as contributors to non-communicable disease morbidity and mortality.32,33
Several potential mechanisms may explain associations between ultra-processed food intake, CKD progression, and mortality. Many ultra-processed foods are of poor nutritional value – high in sodium and added sugars and low in fiber and overall diet quality – and may thereby contribute to adverse clinical outcomes such as CKD progression and cardiovascular disease,34 the leading cause of death in CKD.35 We observed that people with higher ultra-processed food intakes had lower diet quality, consumed less potassium and fiber, and more sodium and added sugars. The nutrient profile and altered food matrix of highly processed diets may adversely affect gut microbial composition, thereby increasing inflammation36 and production and absorption of uremic toxins.37 Novel compounds formed during processing, such as advanced glycation end products, may also increase gut permeability, contributing to inflammation and kidney damage.38,39 In addition, highly processed foods commonly contain phosphate additives,40 which may be particularly problematic in the context of CKD due to dysregulated phosphorus homeostasis and its association with vascular calcification,41,42 CKD progression, and mortality.43 Though we did not observe higher phosphorus intakes with greater ultra-processed food consumption, inorganic phosphate additives are more bioavailable (90–100%) than plant-derived organic phosphates (<50%),44 resulting in proportionally more phosphate absorption from highly processed foods. It is also likely that phosphate contents reported in nutrient databases are incomplete,45,46 as the Food and Drug Administration does not require manufacturers to report phosphorus content.47
Finally, while dietary patterns rich in fruits, vegetables, whole grains, lean proteins, low-fat dairy, nuts, and legumes have been associated with reduced risk of CKD progression and mortality in people with CKD,48,49 the highest proportions of ultra-processed foods are often consumed in the context of low-quality diets.50,51 We observed that participants in the highest tertile of ultra-processed food intake had lower diet quality, explained by lower scores for nearly all food groups. Displacement of healthier foods by ultra-processed foods may partly explain the association with mortality, as adjustment for diet quality attenuated the association between ultra-processed food intake and all-cause mortality. However, diet quality did not appear to explain the association between ultra-processed food intake and CKD progression among adults with higher baseline kidney function. Improved understanding of the mechanisms by which ultra-processed foods contribute to kidney function decline is needed to inform effective strategies to minimize their harms.52
The lack of association between ultra-processed food intake and CKD progression among people with lower eGFR is surprising. We hypothesize that this finding could be explained by reverse causation, as people with poor kidney function may be limiting consumption of ultra-processed foods to manage more severe disease and related complications (e.g. hyperphosphatemia). A previously reported paradoxical inverse association between ultra-processed sweet snack foods and incident diabetes risk was similarly explained, as people with higher baseline diabetes risk avoided consuming ultra-processed sweets.53 It is also possible that the lower protein intakes associated with greater ultra-processed food intake may help to slow CKD progression in people with more advanced CKD,54 thereby counterbalancing the harms and resulting in a null association.
Strengths of our study include the prospective design, with nearly 17 years of follow-up, in a geographically and racially diverse study sample and incorporation of repeat dietary assessments to improve estimation of ultra-processed food intakes. However, several limitations must be acknowledged. First, self-reported dietary intakes are subject to both random and systematic measurement error. However, we adjusted for total energy intakes to reduce bias55 and averaged multiple diet assessments to reduce random error.22 Second, the DHQ was not designed to assess ultra-processed food intake. Consequently, composite dishes could not be disaggregated into component ingredients, and assumptions about food preparation, source, and ingredients were made when classifying foods into NOVA groups. Though misclassification is possible, a sensitivity analysis reclassifying discordant classifications did not meaningfully change results. Third, residual confounding by unmeasured factors may have contributed to observed associations. For instance, ultra-processed foods generally have a lower per-calorie cost than minimally processed foods56 and consumption is greater among people with food insecurity.57 Though we adjusted for income and education, these covariates may not fully characterize food security status or related factors, such as neighborhood-level disparities in access to healthy foods, that may explain associations between ultra-processed food consumption and outcomes. Finally, we excluded individuals with missing or unreliable dietary data, which may have introduced selection bias.
In conclusion, greater consumption of ultra-processed foods was associated with CKD progression in this sample of adults with CKD. Specifically, greater ultra-processed food intake was associated with higher risk of CKD progression in people with higher baseline kidney function but not later stages of CKD. Ultra-processed food intake was also associated with greater risk of all-cause mortality, which may be partly mediated by lower diet quality. Consistent with current guidance for CKD management54,58,59 and CVD risk reduction,60 these findings reinforce the potential value of encouraging patients to favor fresh, whole, and homemade or hand-prepared foods and fewer highly processed foods.
Supplementary Material
Figure S1. Derivation of study population from the Chronic Renal Insufficiency Cohort.
Figure S2. Hazard ratio and 95% confidence interval for risk of incident cardiovascular disease associated with ultra-processed food consumption in the Chronic Renal Insufficiency Cohort Study.
Table S1. Results of sensitivity analysis reassigning discordantly classified foods to more processed category.
Table S2. Baseline characteristics of study sample versus excluded Chronic Renal Insufficiency Cohort participants.
Table S3. Hazard ratios for chronic kidney disease progression and all-cause mortality by tertile of energy-adjusted servings/day of specific types of ultra-processed foods consumed in the Chronic Renal Insufficiency Cohort Study.
Table S4. Hazard ratios for chronic kidney disease progression, all-cause mortality, and incident cardiovascular disease by tertile of energy-adjusted servings/day unprocessed or minimally processed food consumption in the Chronic Renal Insufficiency Cohort Study.
Acknowledgements:
The authors thank the CRIC Study staff and participants for their contributions to this study, as well as Daohang Sha for preparing the datasets for statistical analyses.
Support:
Dr. Sullivan was supported by grant T32 HL007024 from the National Heart, Lung, and Blood Institute. Dr. Rebholz was supported by grants from the National, Heart, Lung, and Blood Institute (R01 HL153178) and the National Institute of Diabetes and Digestive and Kidney Diseases (R03 DK128386). MD is supported by RO1 HL141846 from the National Heart, Lung, and Blood Institute. Funding for the CRIC Study was obtained under a cooperative agreement from National Institute of Diabetes and Digestive and Kidney Diseases (U01DK060990, U01DK060984, U01DK061022, U01DK061021, U01DK061028, U01DK060980, U01DK060963, U01DK060902 and U24DK060990). In addition, this work was supported in part by: the Perelman School of Medicine at the University of Pennsylvania Clinical and Translational Science Award NIH/NCATS UL1TR000003, Johns Hopkins University UL1 TR-000424, University of Maryland GCRC M01 RR-16500, Clinical and Translational Science Collaborative of Cleveland, UL1TR000439 from the National Center for Advancing Translational Sciences (NCATS) component of the National Institutes of Health and NIH roadmap for Medical Research, Michigan Institute for Clinical and Health Research (MICHR) UL1TR000433, University of Illinois at Chicago CTSA UL1RR029879, Tulane COBRE for Clinical and Translational Research in Cardiometabolic Diseases P20 GM109036, Kaiser Permanente NIH/NCRR UCSF-CTSI UL1 RR-024131, Department of Internal Medicine, University of New Mexico School of Medicine Albuquerque, NM R01DK119199. The funders had no role in the study design; collection, analysis, and interpretation of these data; writing the report; and the decision to submit the report for publication.
Footnotes
CRIC Study Investigators: Debbie L. Cohen, MD; Harold I. Feldman, MD, MSCE; Alan S. Go, MD; Robert G. Nelson, MD, PhD, MS; Mahboob Rahman, MD; Vallabh O. Shah, PhD, MS.
Additional Information: Authors LJA, MLU, JPL, JS, PSR, and JC are CRIC Study Investigators.
Financial Disclosure: The authors declare that they have no relevant financial interests.
Peer Review: Received September 6, 2022. Evaluated by 3 external peer reviewers and a statistician, with editorial input from an Acting Editor-in-Chief (Editorial Board Member L. Ebony Boulware, MD). Accepted in revised form December 22, 2022. The involvement of an Acting Editor-in-Chief to handle the peer-review and decision-making processes was to comply with AJKD’s procedures for potential conflicts of interest for editors, described in the Information for Authors & Journal Policies.
Publisher's Disclaimer: This is a PDF file of an unedited manuscript that has been accepted for publication. As a service to our customers we are providing this early version of the manuscript. The manuscript will undergo copyediting, typesetting, and review of the resulting proof before it is published in its final form. Please note that during the production process errors may be discovered which could affect the content, and all legal disclaimers that apply to the journal pertain.
References
- 1.Monteiro CA, Cannon G, Moubarac JC, Levy RB, Louzada MLC, Jaime PC. The UN Decade of Nutrition, the NOVA food classification and the trouble with ultra-processing. Public Health Nutr. 2018;21(1):5–17. doi: 10.1017/S1368980017000234 [DOI] [PMC free article] [PubMed] [Google Scholar]
- 2.Martínez Steele E, Baraldi LG, Louzada ML da C, Moubarac JC, Mozaffarian D, Monteiro CA. Ultra-processed foods and added sugars in the US diet: evidence from a nationally representative cross-sectional study. BMJ Open. 2016;6(3). doi: 10.1136/BMJOPEN-2015-009892 [DOI] [PMC free article] [PubMed] [Google Scholar]
- 3.Baraldi LG, Martinez Steele E, Canella DS, Monteiro CA. Consumption of ultra-processed foods and associated sociodemographic factors in the USA between 2007 and 2012: evidence from a nationally representative cross-sectional study. BMJ Open. 2018;8(3). doi: 10.1136/BMJOPEN-2017-020574 [DOI] [PMC free article] [PubMed] [Google Scholar]
- 4.Srour B, Fezeu LK, Kesse-Guyot E, et al. Ultra-processed food intake and risk of cardiovascular disease: prospective cohort study (NutriNet-Santé). BMJ. 2019;365:l1451. doi: 10.1136/BMJ.L1451 [DOI] [PMC free article] [PubMed] [Google Scholar]
- 5.Du S, Kim H, Rebholz CM. Higher ultra-processed food consumption is associated with increased risk of incident coronary artery disease in the Atherosclerosis Risk in Communities Study. J Nutr. 2021;151(12):3746–3754. doi: 10.1093/JN/NXAB285 [DOI] [PMC free article] [PubMed] [Google Scholar]
- 6.Juul F, Vaidean G, Lin Y, Deierlein AL, Parekh N. Ultra-processed foods and incident cardiovascular disease in the Framingham Offspring Study. J Am Coll Cardiol. 2021;77(12):1520–1531. doi: 10.1016/J.JACC.2021.01.047 [DOI] [PubMed] [Google Scholar]
- 7.Zhong GC, Gu HT, Peng Y, et al. Association of ultra-processed food consumption with cardiovascular mortality in the US population: long-term results from a large prospective multicenter study. Int J Behav Nutr Phys Act. 2021;18(1). doi: 10.1186/S12966-021-01081-3 [DOI] [PMC free article] [PubMed] [Google Scholar]
- 8.Bonaccio M, Costanzo S, di Castelnuovo A, et al. Ultra-processed food intake and all-cause and cause-specific mortality in individuals with cardiovascular disease: the Molisani Study. Eur Heart J. 2022;43(3):213–224. doi: 10.1093/eurheartj/ehab783 [DOI] [PubMed] [Google Scholar]
- 9.Blanco-Rojo R, Sandoval-Insausti H, López-Garcia E, et al. Consumption of ultra-processed foods and mortality: a national prospective cohort in Spain. Mayo Clin Proc. 2019;94(11):2178–2188. doi: 10.1016/j.mayocp.2019.03.035 [DOI] [PubMed] [Google Scholar]
- 10.Kim H, Hu EA, Rebholz CM. Ultra-processed food intake and mortality in the United States: results from the Third National Health and Nutrition Examination Survey (NHANES III 1988–1994). Public Health Nutr. 2019;22(10):1777. doi: 10.1017/S1368980018003890 [DOI] [PMC free article] [PubMed] [Google Scholar]
- 11.Rico-Campà A, Martínez-González MA, Alvarez-Alvarez I, et al. Association between consumption of ultra-processed foods and all cause mortality: SUN prospective cohort study. BMJ. 2019;365:l1949. doi: 10.1136/bmj.l1949 [DOI] [PMC free article] [PubMed] [Google Scholar]
- 12.Schnabel L, Kesse-Guyot E, Allès B, et al. Association between ultraprocessed food consumption and risk of mortality among middle-aged adults in France. JAMA Intern Med. 2019;179(4):490–498. doi: 10.1001/JAMAINTERNMED.2018.7289 [DOI] [PMC free article] [PubMed] [Google Scholar]
- 13.Romero Ferreiro C, Martín-Arriscado Arroba C, Cancelas Navia P, Lora Pablos D, Gómez de la Cámara A. Ultra-processed food intake and all-cause mortality: DRECE cohort study. Public Health Nutr. Published online August 5, 2021. doi: 10.1017/S1368980021003256 [DOI] [PMC free article] [PubMed] [Google Scholar]
- 14.Cai Q, Duan MJ, Dekker LH, et al. Ultra-processed food consumption and kidney function decline in a population-based cohort in the Netherlands. Am J Clin Nutr. 2022;72(3):694–701. doi: 10.1093/AJCN/NQAC073 [DOI] [PMC free article] [PubMed] [Google Scholar]
- 15.Du S, Kim H, Crews DC, White K, Rebholz CM. Association Between Ultraprocessed Food Consumption and Risk of Incident CKD: A Prospective Cohort Study. Am J Kidney Dis. 2022;80(5):589–598. doi: 10.1053/J.AJKD.2022.03.016 [DOI] [PMC free article] [PubMed] [Google Scholar]
- 16.Rey-García J, Donat-Vargas C, Sandoval-Insausti H, et al. Ultra-processed food consumption is associated with renal function decline in older adults: a prospective cohort study. Nutrients. 2021;13(2):428. doi: 10.3390/NU13020428 [DOI] [PMC free article] [PubMed] [Google Scholar]
- 17.Chang AR, Anderson C. Dietary Phosphorus Intake and the Kidney. Annu Rev Nutr. 2017;37:321–346. doi: 10.1146/annurev-nutr-071816-064607 [DOI] [PMC free article] [PubMed] [Google Scholar]
- 18.McMahon EJ, Campbell KL, Bauer JD, Mudge DW, Kelly JT. Altered dietary salt intake for people with chronic kidney disease. Cochrane Database Syst Rev. 2021;6(6):CD010070. doi: 10.1002/14651858.CD010070.PUB3 [DOI] [PMC free article] [PubMed] [Google Scholar]
- 19.Feldman HI, Appel LJ, Chertow GM, et al. The Chronic Renal Insufficiency Cohort (CRIC) Study: design and methods. J Am Soc Nephrol. 2003;14(7 Suppl 2):S148–53. doi: 10.1097/01.asn.0000070149.78399.ce [DOI] [PubMed] [Google Scholar]
- 20.Thompson FE, Subar AF, Brown CC, et al. Cognitive research enhances accuracy of food frequency questionnaire reports: results of an experimental validation study. J Am Diet Assoc. 2002;102(2):212–225. doi: 10.1016/S0002-8223(02)90050-7 [DOI] [PubMed] [Google Scholar]
- 21.Subar AF, Thompson FE, Kipnis V, et al. Comparative validation of the Block, Willett, and National Cancer Institute food frequency questionnaires : the Eating at America’s Table Study. Am J Epidemiol. 2001;154(12):1089–1099. doi: 10.1093/AJE/154.12.1089 [DOI] [PubMed] [Google Scholar]
- 22.Hu FB, Stampfer MJ, Rimm E, et al. Dietary fat and coronary heart disease: a comparison of approaches for adjusting for total energy intake and modeling repeated dietary measurements. Am J Epidemiol. 1999;149(6):531–540. doi: 10.1093/OXFORDJOURNALS.AJE.A009849 [DOI] [PubMed] [Google Scholar]
- 23.Office of Nutrition and Food Labeling, U.S. Department of Health and Human Services, Food and Drug Administration, Center for Food Safety and Applied Nutrition. Reference Amounts Customarily Consumed: List of Products for Each Product Category: Guidance for Industry. https://www.fda.gov/media/102587/download
- 24.Willett W, Stampfer M. Total energy intake: implications for epidemiologic analyses. Am J Epidemiol. 1986;124(1):17–27. doi: 10.1093/OXFORDJOURNALS.AJE.A114366 [DOI] [PubMed] [Google Scholar]
- 25.Inker LA, Eneanya ND, Coresh J, et al. New creatinine- and cystatin C-based equations to estimate GFR without race. New Engl J Med. 2021;385(19):1737–1749. doi: 10.1056/NEJMoa2102953. [DOI] [PMC free article] [PubMed] [Google Scholar]
- 26.Yang W, Xie D, Anderson AH, et al. Association of kidney disease outcomes with risk factors for CKD: findings from the Chronic Renal Insufficiency Cohort (CRIC) Study. Am J Kidney Dis. 2014;63(2):236–243. doi: 10.1053/J.AJKD.2013.08.028 [DOI] [PMC free article] [PubMed] [Google Scholar]
- 27.Levey AS, Stevens LA, Schmid CH, et al. A new equation to estimate glomerular filtration rate. Ann Intern Med. 2009;150(9):604–612. [DOI] [PMC free article] [PubMed] [Google Scholar]
- 28.Inker LA, Eneanya ND, Coresh J, et al. New creatinine- and cystatin C–based equations to estimate GFR without race. N Engl J Med. 2021;385(19):1737–1749. doi: 10.1056/NEJMoa2102953 [DOI] [PMC free article] [PubMed] [Google Scholar]
- 29.Lash JP, Go AS, Appel LJ, et al. Chronic Renal Insufficiency Cohort (CRIC) Study: baseline characteristics and associations with kidney function. Clin J Am Soc Nephrol. 2009;4(8):1302. doi: 10.2215/CJN.00070109 [DOI] [PMC free article] [PubMed] [Google Scholar]
- 30.Krebs-Smith SM, Pannucci TRE, Subar AF, et al. Update of the Healthy Eating Index: HEI-2015. J Acad Nutr Diet. 2018;118(9):1591–1602. doi: 10.1016/j.jand.2018.05.021 [DOI] [PMC free article] [PubMed] [Google Scholar]
- 31.Harrell FE Jr. Regression Modeling Strategies. 2nd ed. Springer; Cham; 2001. [Google Scholar]
- 32.Taneri PE, Wehrli F, Roa Diaz ZM, et al. Association between ultra-processed food intake and all-cause mortality: a systematic review and meta-analysis. Am J Epidemiol. 2022;191(7):1323–1335. doi: 10.1093/aje/kwac039 [DOI] [PubMed] [Google Scholar]
- 33.Pagliai G, Dinu M, Madarena MP, Bonaccio M, Iacoviello L, Sofi F. Consumption of ultra-processed foods and health status: a systematic review and meta-analysis. Br J Nutr. 2021;125(3):308–318. doi: 10.1017/S0007114520002688 [DOI] [PMC free article] [PubMed] [Google Scholar]
- 34.Micha R, Shulkin ML, Peñalvo JL, et al. Etiologic effects and optimal intakes of foods and nutrients for risk of cardiovascular diseases and diabetes: systematic reviews and meta-analyses from the Nutrition and Chronic Diseases Expert Group (NutriCoDE). PLoS One. 2017;12(4):e0175149. doi: 10.1371/journal.pone.0175149 [DOI] [PMC free article] [PubMed] [Google Scholar]
- 35.Jankowski J, Floege J, Fliser D, Böhm M, Marx N. Cardiovascular disease in chronic kidney disease: pathophysiological insights and therapeutic options. Circulation. 2021;143(11):1157–1172. doi: 10.1161/CIRCULATIONAHA.120.050686 [DOI] [PMC free article] [PubMed] [Google Scholar]
- 36.Onal EM, Afsar B, Covic A, Vaziri ND, Kanbay M. Gut microbiota and inflammation in chronic kidney disease and their roles in the development of cardiovascular disease. Hypertens Res. 2019;42(2):123–140. doi: 10.1038/s41440-018-0144-z [DOI] [PubMed] [Google Scholar]
- 37.Mafra D, Borges NA, Lindholm B, Shiels PG, Evenepoel P, Stenvinkel P. Food as medicine: targeting the uraemic phenotype in chronic kidney disease. Nat Rev Nephrol. 2021;17(3):153–171. doi: 10.1038/s41581-020-00345-8 [DOI] [PubMed] [Google Scholar]
- 38.Bettiga A, Fiorio F, di Marco F, et al. The modern Western diet rich in advanced glycation end-products (AGEs): an overview of its impact on obesity and early progression of renal pathology. Nutrients. 2019;11(8):1748. doi: 10.3390/nu11081748 [DOI] [PMC free article] [PubMed] [Google Scholar]
- 39.Snelson M, Tan SM, Clarke RE, et al. Processed foods drive intestinal barrier permeability and microvascular diseases. Sci Adv. 2021;7(14):eabe4841. doi: 10.1126/SCIADV.ABE4841 [DOI] [PMC free article] [PubMed] [Google Scholar]
- 40.León JB, Sullivan CM, Sehgal AR. The prevalence of phosphorus-containing food additives in top-selling foods in grocery stores. J Ren Nutr. 2013;23(4):265–270.e2. doi: 10.1053/j.jrn.2012.12.003 [DOI] [PMC free article] [PubMed] [Google Scholar]
- 41.Adeney KL, Siscovick DS, Ix JH, et al. Association of serum phosphate with vascular and valvular calcification in moderate CKD. J Am Soc Nephrol. 2009;20(2):381–387. doi: 10.1681/ASN.2008040349 [DOI] [PMC free article] [PubMed] [Google Scholar]
- 42.Bundy JD, Chen J, Yang W, et al. Risk factors for progression of coronary artery calcification in patients with chronic kidney disease: The CRIC study. Atherosclerosis. 2018;271:53–60. doi: 10.1016/j.atherosclerosis.2018.02.009 [DOI] [PMC free article] [PubMed] [Google Scholar]
- 43.Da J, Xie X, Wolf M, et al. Serum phosphorus and progression of CKD and mortality: a meta-analysis of cohort studies. Am J Kidney Dis. 2015;66(2):258–265. doi: 10.1053/j.ajkd.2015.01.009 [DOI] [PubMed] [Google Scholar]
- 44.Karp H, Ekholm P, Kemi V, et al. Differences among total and in vitro digestible phosphorus content of plant foods and beverages. J Ren Nutr. 2012;22(4):416–422. doi: 10.1053/j.jrn.2011.04.004 [DOI] [PubMed] [Google Scholar]
- 45.Calvo MS, Moshfegh AJ, Tucker KL. Assessing the health impact of phosphorus in the food supply: issues and considerations. Adv Nutr. 2014;5(1):104–113. doi: 10.3945/an.113.004861 [DOI] [PMC free article] [PubMed] [Google Scholar]
- 46.Sullivan CM, Leon JB, Sehgal AR. Phosphorus-containing food additives and the accuracy of nutrient databases: implications for renal patients. J Ren Nutr. 2007;17(5):350–354. doi: 10.1053/j.jrn.2007.05.008 [DOI] [PMC free article] [PubMed] [Google Scholar]
- 47.Kalantar-Zadeh K, Gutekunst L, Mehrotra R, et al. Understanding sources of dietary phosphorus in the treatment of patients with chronic kidney disease. Clin J Am Soc Nephrol. 2010;5(3):519–530. doi: 10.2215/CJN.06080809 [DOI] [PubMed] [Google Scholar]
- 48.Kelly JT, Palmer SC, Wai SN, et al. Healthy dietary patterns and risk of mortality and ESRD in CKD: a meta-analysis of cohort studies. Clin J Am Soc Nephrol. 2017;12(2):272–279. doi: 10.2215/CJN.06190616 [DOI] [PMC free article] [PubMed] [Google Scholar]
- 49.Hu EA, Coresh J, Anderson CAM, et al. Adherence to healthy dietary patterns and risk of CKD progression and all-cause mortality: findings from the CRIC (Chronic Renal Insufficiency Cohort) Study. Am J Kidney Dis. 2021;77(2):235–244. doi: 10.1053/J.AJKD.2020.04.019 [DOI] [PMC free article] [PubMed] [Google Scholar]
- 50.Martini D, Godos J, Bonaccio M, Vitaglione P, Grosso G. Ultra-processed foods and nutritional dietary profile: a meta-analysis of nationally representative samples. Nutrients. 2021;13(10):3390. doi: 10.3390/nu13103390 [DOI] [PMC free article] [PubMed] [Google Scholar]
- 51.Liu J, Steele EM, Li Y, et al. Consumption of ultraprocessed foods and diet quality among U.S. children and adults. Am J Prev Med. 2022;62(2):252–264. doi: 10.1016/j.amepre.2021.08.014 [DOI] [PMC free article] [PubMed] [Google Scholar]
- 52.Tobias DK, Hall KD. Eliminate or reformulate ultra-processed foods? Biological mechanisms matter. Cell Metab. 2021;33(12):2314–2315. doi: 10.1016/j.cmet.2021.10.005 [DOI] [PubMed] [Google Scholar]
- 53.Duan MJ, Vinke PC, Navis G, Corpeleijn E, Dekker LH. Ultra-processed food and incident type 2 diabetes: studying the underlying consumption patterns to unravel the health effects of this heterogeneous food category in the prospective Lifelines cohort. BMC Med. 2022;20(1):7. doi: 10.1186/s12916-021-02200-4 [DOI] [PMC free article] [PubMed] [Google Scholar]
- 54.Ikizler T, Burrowes J, Byham-Gray L, et al. KDOQI Clinical Practice Guideline for Nutrition in CKD: 2020 Update. Am J Kidney Dis. 2020;76(3 Suppl 1):S1–S107. doi: 10.1053/J.AJKD.2020.05.006 [DOI] [PubMed] [Google Scholar]
- 55.Subar AF, Freedman LS, Tooze JA, et al. Addressing current criticism regarding the value of self-report dietary data. J Nutr. 2015;145(12):2639–2645. doi: 10.3945/jn.115.219634 [DOI] [PMC free article] [PubMed] [Google Scholar]
- 56.Gupta S, Hawk T, Aggarwal A, Drewnowski A. Characterizing ultra-processed foods by energy density, nutrient density, and cost. Front Nutr. 2019;6:70. doi: 10.3389/FNUT.2019.00070/BIBTEX [DOI] [PMC free article] [PubMed] [Google Scholar]
- 57.Leung CW, Fulay AP, Parnarouskis L, Martinez-Steele E, Gearhardt AN, Wolfson JA. Food insecurity and ultra-processed food consumption: the modifying role of participation in the Supplemental Nutrition Assistance Program (SNAP). Am J Clin Nutr. 2022;116(1):197–205. doi: 10.1093/ajcn/nqac049 [DOI] [PMC free article] [PubMed] [Google Scholar]
- 58.Kidney Disease: Improving Global Outcomes (KDIGO) Diabetes Work Group. KDIGO 2020 Clinical Practice Guideline for Diabetes Management in Chronic Kidney Disease. Kidney Int. 2020;98(4S):S1–S115. doi: 10.1016/j.kint.2020.06.019 [DOI] [PubMed] [Google Scholar]
- 59.Kidney Disease: Improving Global Outcomes (KDIGO) CKD-MBD Update Work Group. KDIGO 2017 Clinical Practice Guideline Update for the Diagnosis, Evaluation, Prevention, and Treatment of Chronic Kidney Disease-Mineral and Bone Disorder (CKD-MBD). Kidney Int Suppl. 2017;7:1–59. doi: 10.1016/j.kisu.2017.04.001 [DOI] [PMC free article] [PubMed] [Google Scholar]
- 60.Lichtenstein AH, Appel LJ, Vadiveloo M, et al. 2021 Dietary Guidance to Improve Cardiovascular Health: A Scientific Statement from the American Heart Association. Circulation. 2021;144(23):e472–e487. doi: 10.1161/CIR.0000000000001031 [DOI] [PubMed] [Google Scholar]
Associated Data
This section collects any data citations, data availability statements, or supplementary materials included in this article.
Supplementary Materials
Figure S1. Derivation of study population from the Chronic Renal Insufficiency Cohort.
Figure S2. Hazard ratio and 95% confidence interval for risk of incident cardiovascular disease associated with ultra-processed food consumption in the Chronic Renal Insufficiency Cohort Study.
Table S1. Results of sensitivity analysis reassigning discordantly classified foods to more processed category.
Table S2. Baseline characteristics of study sample versus excluded Chronic Renal Insufficiency Cohort participants.
Table S3. Hazard ratios for chronic kidney disease progression and all-cause mortality by tertile of energy-adjusted servings/day of specific types of ultra-processed foods consumed in the Chronic Renal Insufficiency Cohort Study.
Table S4. Hazard ratios for chronic kidney disease progression, all-cause mortality, and incident cardiovascular disease by tertile of energy-adjusted servings/day unprocessed or minimally processed food consumption in the Chronic Renal Insufficiency Cohort Study.