



Abstract
Background:
Small coronary arteries containing stents pose a challenge in CT imaging due to metal induced blooming artifact. High spatial resolution imaging capability is needed as presence of highly attenuating materials limits noninvasive assessment of luminal patency.
Purpose:
The purpose of this study was to quantify the effective lumen diameter within coronary stents using a clinical photon-counting-detector (PCD) CT in concert with a convolutional neural network (CNN) denoising algorithm, compared to an energy-integrating-detector (EID) CT system.
Methods:
Seven coronary stents of different materials and inner diameters between 3.43–4.72 mm were placed in plastic tubes of diameters 3.96–4.87 mm containing 20 mg/mL of iodine solution, mimicking stented contrast-enhanced coronary arteries. Tubes were placed parallel with or perpendicular to the scanner’s z-axis in an anthropomorphic phantom emulating an average-sized patient and scanned with a clinical EID-CT and PCD-CT. EID scans were performed using our standard coronary computed tomography angiography (cCTA) protocol (120kV, 180 quality reference mAs). PCD scans were performed using the ultra-high-resolution (UHR) mode (120×0.2 mm collimation) at 120 kV with tube current adjusted so that CTDIvol was matched to that of EID scans. EID images were reconstructed per our routine clinical protocol (Br40, 0.6 mm thickness), and with the sharpest available kernel (Br69). PCD images were reconstructed at a thickness of 0.6 mm and a dedicated sharp kernel (Br89) which is only possible with the PCD UHR mode. To address increased image noise introduced by the Br89 kernel, an image-based CNN denoising algorithm was applied to the PCD images of stents scanned parallel to the scanner’s z-axis. Stents were segmented based on full width half maximum thresholding and morphological operations, from which effective lumen diameter was calculated and compared to reference sizes measured with a caliper.
Results:
Substantial blooming artifacts were observed on EID Br40 images, resulting in larger stent struts and reduced lumen diameter (effective diameter underestimated by 41 and 47% for parallel and perpendicular orientations, respectively). Blooming artifacts were observed on EID Br69 images with 19 and 31% underestimation of lumen diameter compared to the caliper for parallel and perpendicular scans, respectively. Overall image quality was substantially improved on PCD, with higher spatial resolution and reduced blooming artifacts, resulting in clearer delineation of stent struts. Effective lumen diameters were underestimated by 9 and 19% relative to the reference for parallel and perpendicular scans respectively. CNN reduced image noise by about 50% on PCD images without impacting lumen quantification (< 0.3% difference).
Conclusion:
The PCD UHR mode improved in-stent lumen quantification for all seven stents as compared to EID images due to decreased blooming artifacts. Implementation of CNN denoising algorithms to PCD data substantially improved image quality.
Keywords: Photon counting detector, Computed Tomography, Convolutional neural network, Denoising, Coronary artery stents
Introduction
Heart disease is the leading cause of death in the world, accounting for over 600,000 deaths per year in the United States alone1,2. Coronary artery stents are implanted percutaneously to open stenotic arteries. Accurate luminal assessment is important to identify in-stent restenosis (ISR) and disease progression3–5. Computed Tomography (CT) has been widely used in assessment of coronary artery diseases6. However, due to the high attenuation of metals, small coronary artery stents and associated luminal patency are often difficult to visualize with CT due to blooming artifacts and beam hardening effects3,7–9.
Currently, most clinical CT scanners use energy integrating detectors (EID). EIDs utilize indirect conversion technology where incoming X-ray photons pass through a solid-state scintillator and are converted to visible light6. The visible light then travels toward a photodiode and is converted to an electronic signal. In recent years, photon-counting detector (PCD) CT has been widely studied. PCD utilizes direct conversion technology, where X-ray photons hitting the semiconductor are directly converted to electron hole pairs10. This allows for many benefits, such as lack of septa and increased geometric efficiency of the detector, energy discrimination capabilities, elimination of electronic noise, and an ultra-high resolution (UHR) of maximum in-plane spatial resolution of 125 microns achieved by smaller detector pixel size10–13. These features are especially advantageous in coronary artery imaging, where visualization of small arteries and discrimination of high attenuating materials such as iodine and calcium are clinically relevant. Studies using prototype PCD-CT systems (SOMATOM CounT and Count Plus, Siemens Healthineers) demonstrated improved stent visibility as compared to EID scanners3,7,14–16. In September of 2021, the first clinical dual source PCD-CT scanner was FDA approved, which has the smallest available detector pixel size (0.2 mm) and improved spatial resolution17. Here, our study has built off previous works to use the high resolution clinical PCD-CT system and a dedicated UHR sharp reconstruction kernel of Br89, taking full advantage of the small detector pixel size such that image resolution is not limited by the kernel sharpness.
We hypothesize that PCD will outperform EID for in-stent lumen visibility in coronary artery stents. With UHR acquisition and reconstruction using a dedicated UHR sharp kernel and thin slices comes substantially increased image noise18,19. To address this, we employed an image-based convolutional neural network (CNN) denoising algorithm to further improve image quality. Therefore, the purpose of our phantom study is to quantify lumen size (in terms of effective lumen diameter) within coronary stents using a clinical UHR PCD-CT system and compare to that of EID-CT.
Methods
Coronary artery stent phantom
Seven coronary stents made from different materials and inner diameters ranging between 3.43–4.72 mm were inflated and deployed in plastic tubes (Figure 1) of diameter 3.96–4.87 mm containing 20 mg/mL of iodine solution mimicking contrast-enhanced, stented coronary arteries.
Figure 1.
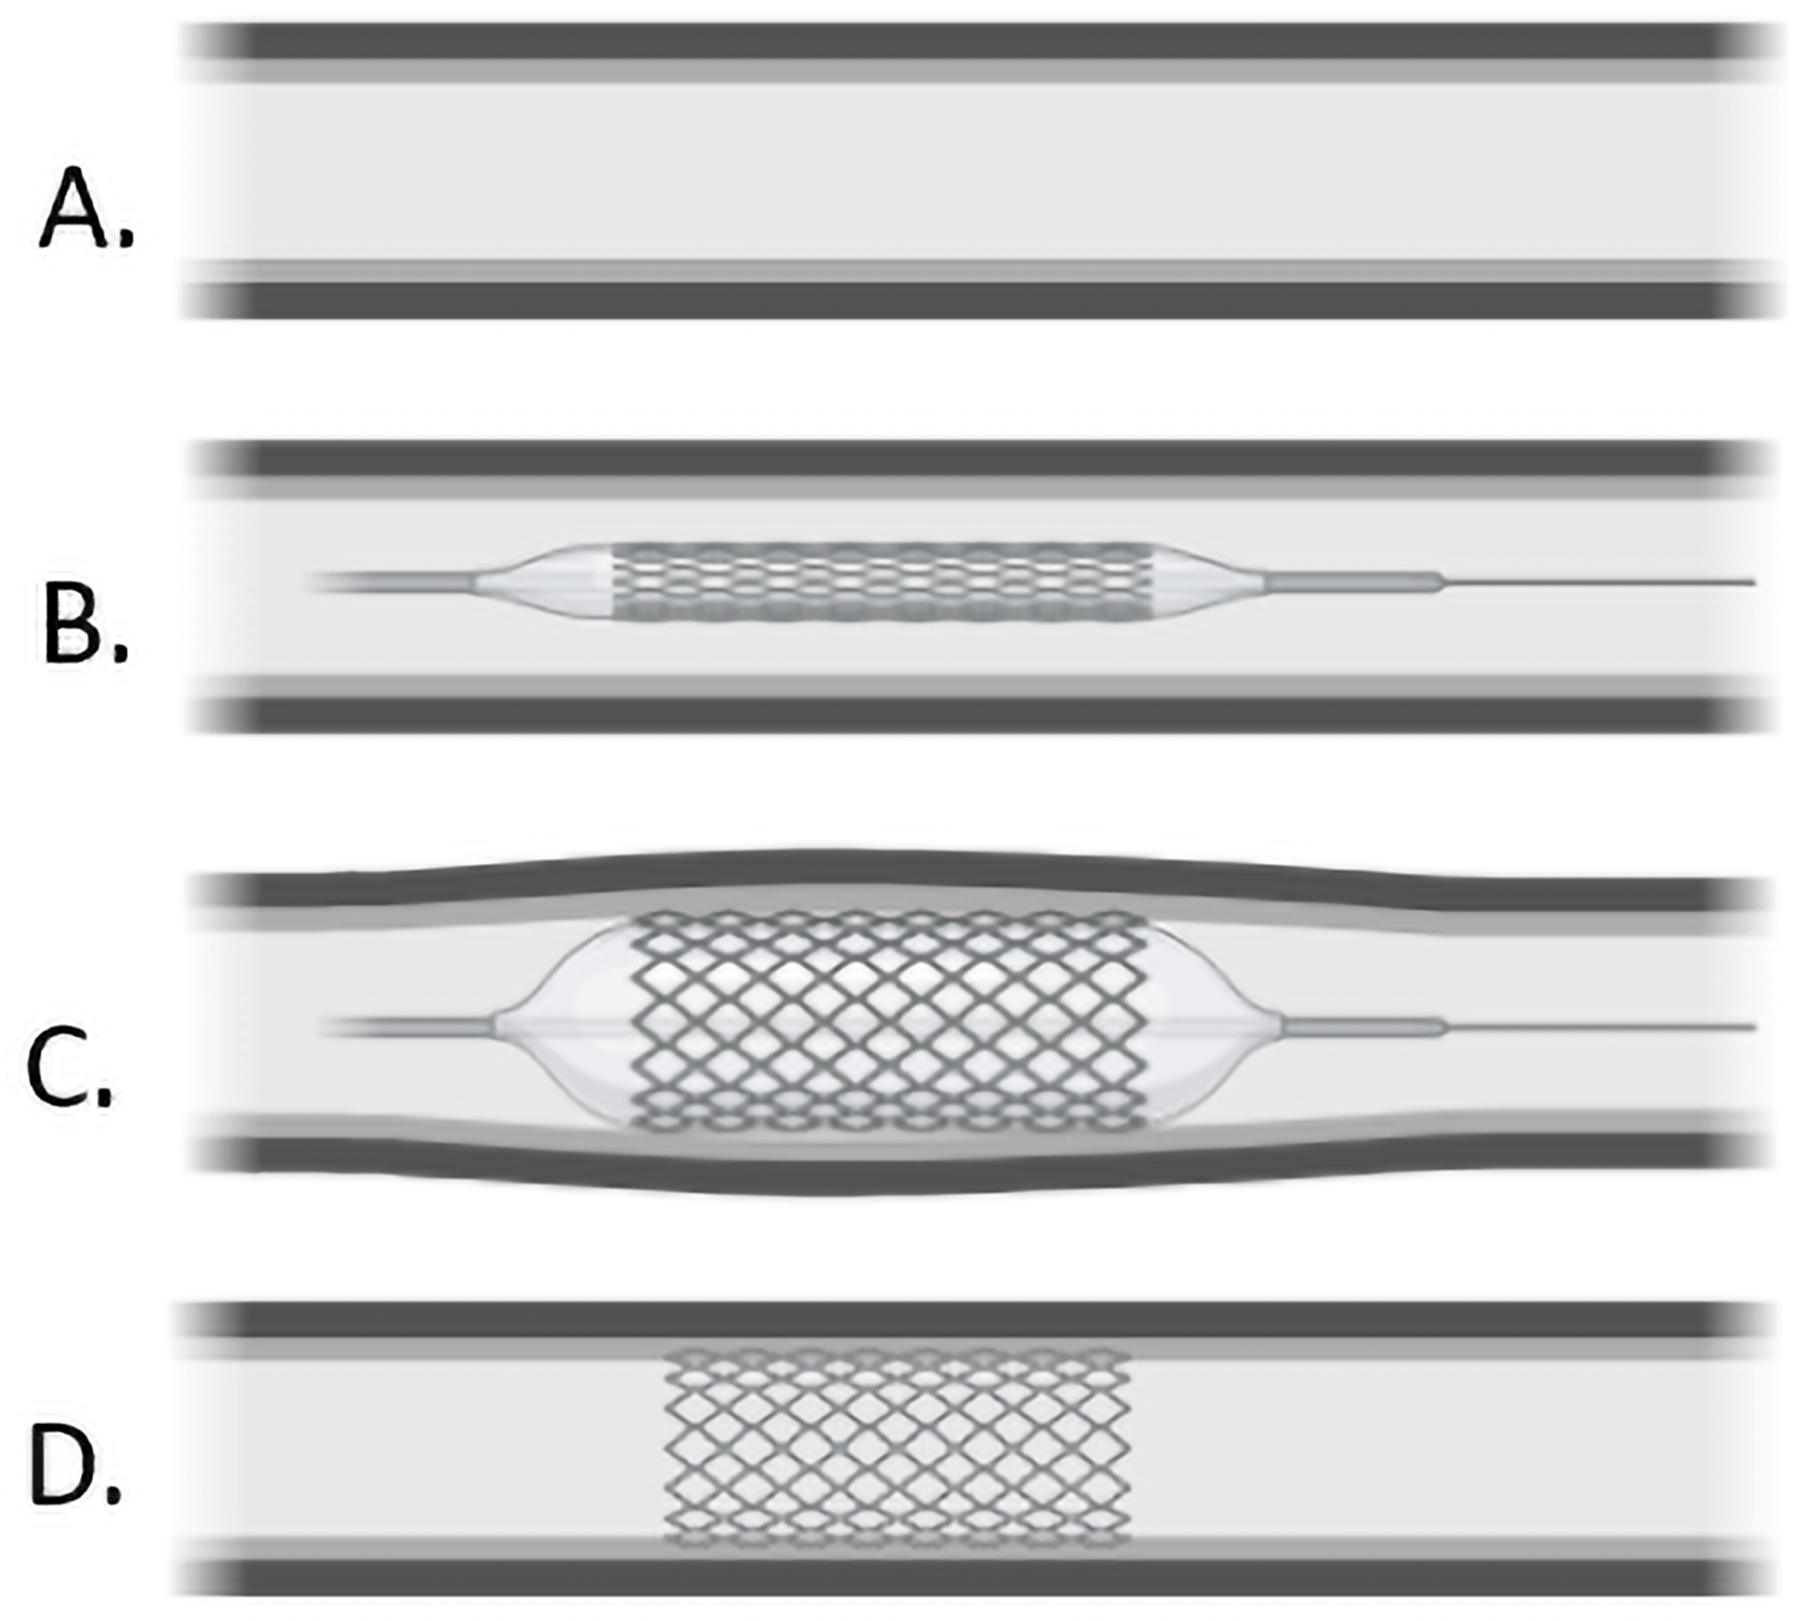
Example of the process of coronary artery balloon angioplasty (A-D) used in inflation and deployment of stents in plastic tubes. Figure created using Biorender™.
Stent materials and manufacturers are detailed in Table 1. Stent inner diameters were measured with a caliper after inflation for a reference standard. Tubes were submerged in a 10 cm water tank and placed in a semi-anthropomorphic thorax phantom (QRM GmbH, Möhrendorf, Germany) (Figure 2) simulating an average-sized adult patient (25 cm x 35 cm) and scanned on an EID (SOMATOM Force, Siemens Healthineers) and a PCD (NAEOTOM Alpha, Siemens Healthineers) systems.
Table 1:
Manufacturer and material information of the stents used in this study
| Stent Number | Manufacturer | Primary Material |
|---|---|---|
| 1 | Medtronic | Stainless Steel |
| 2 | Boston Scientific | Platinum Chromium Alloy |
| 3 | Medtronic | Cobalt-Based Alloy |
| 4 | Abbott | Stainless Steel |
| 5 | Abbott | Cobalt Chromium |
| 6 | Medtronic | Cobalt-Based Platinum Iridium Alloy |
| 7 | Medtronic | Cobalt-Based Alloy |
Figure 2.
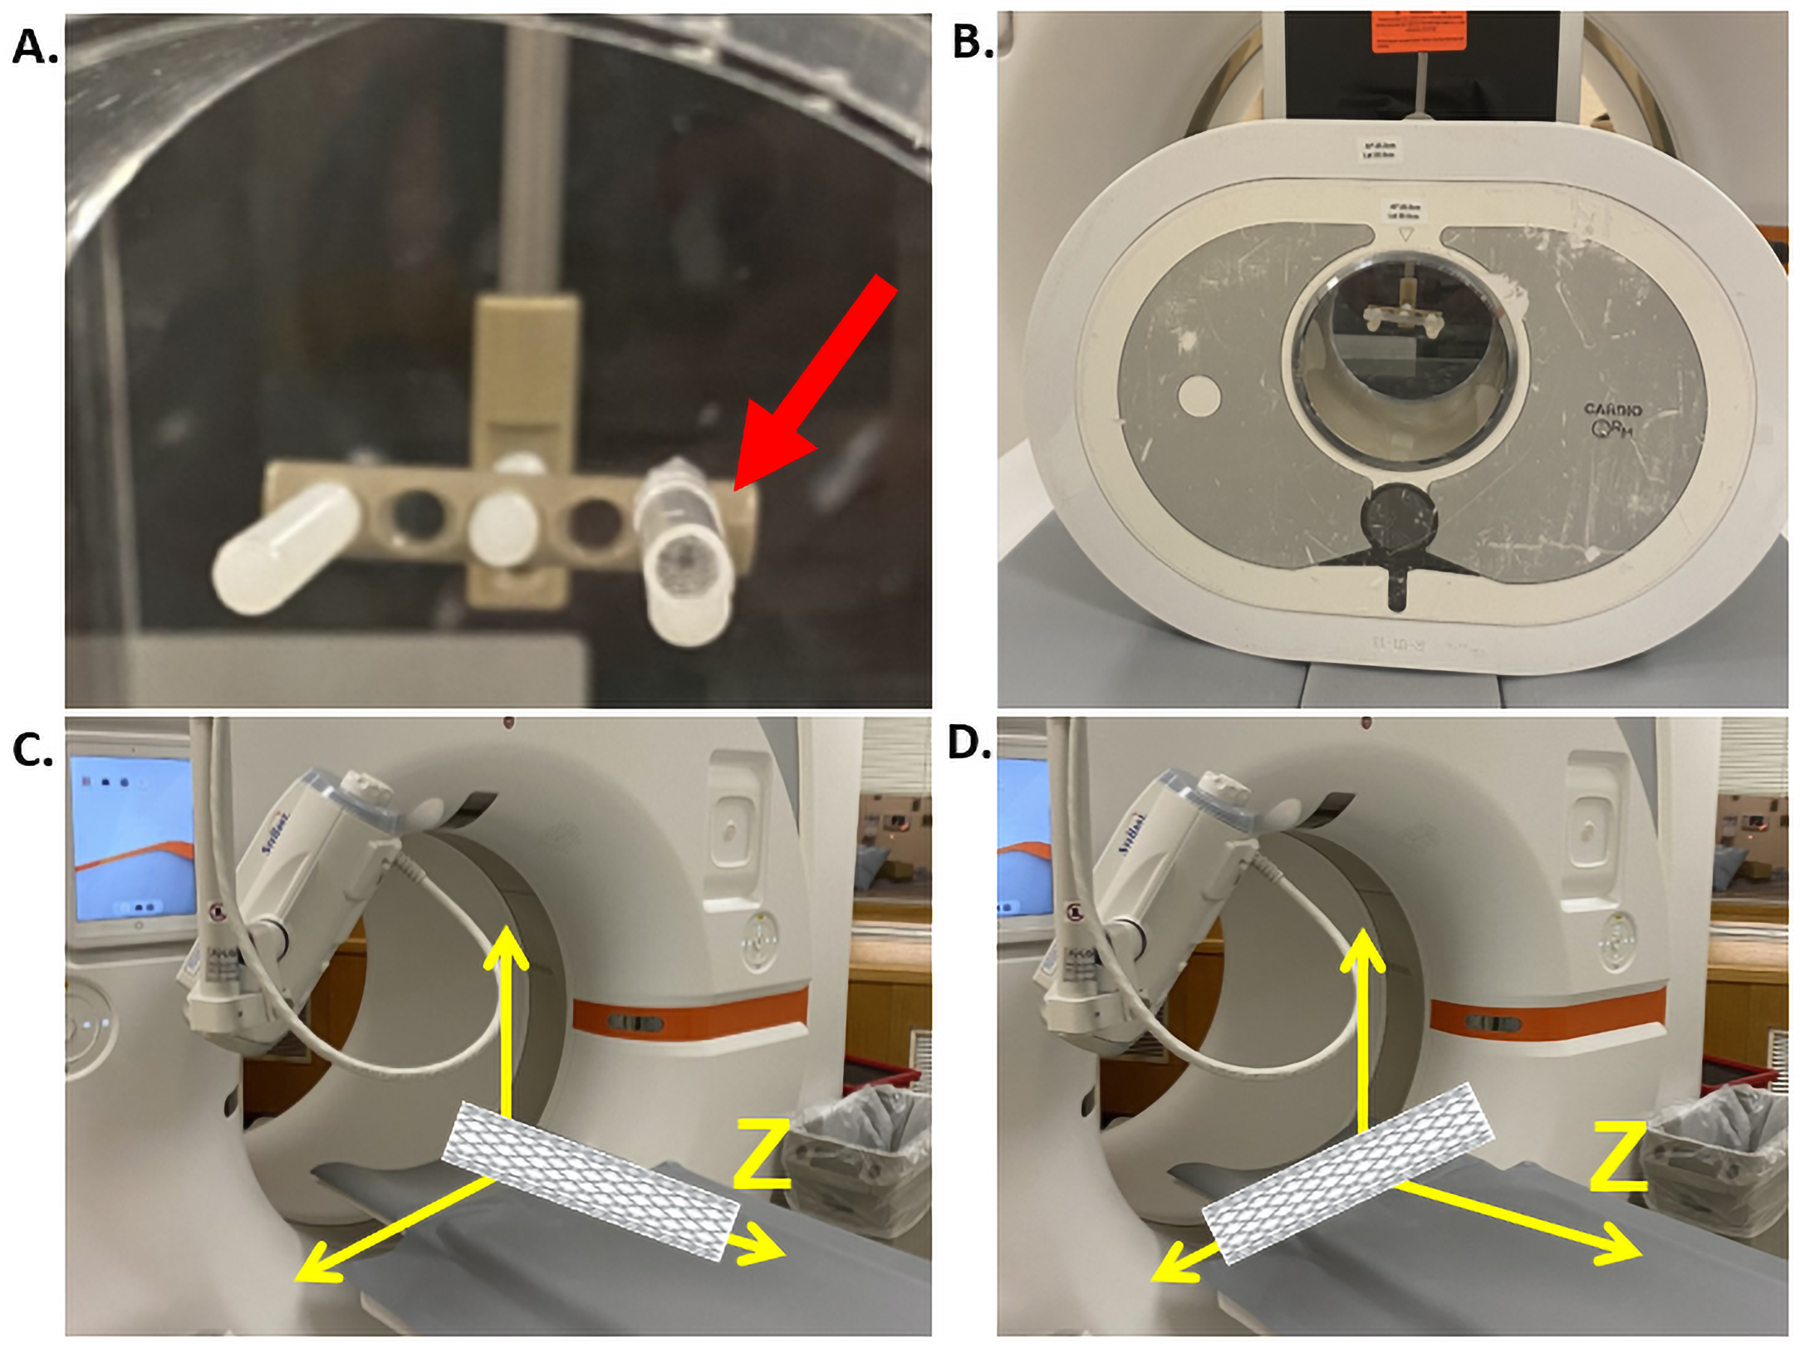
Close up image of stent on holder in axial position in the water cylinder (red arrow, A). Image of experimental setup with water cylinder in an anthropomorphic phantom and submerged stents (B). Stents scanned parallel (C) and perpendicular (D) to the scanner’s z-axis. Figure created using Biorender™.
Data Acquisition and Image Reconstruction
Stent phantoms were placed at 0 degrees (parallel) and 90 degrees (perpendicular) to the scanner’s z-axis (Figure 2). EID scans were performed using the standard coronary CT angiography (cCTA) protocol in our practice (120kV, 196 × 0.6mm collimation, 180 quality reference mAs - a Siemens specific CAREDose4D tube current modulation parameter selected by user to determine desired image quality level20). PCD scans were performed in UHR mode (120 × 0.2 mm collimation) at 120 kV, with tube current adjusted such that the CTDIvol was matched to that of EID scans (5.5–6mGy). Both EID and PCD images were reconstructed with a field of view of 55 mm centered around the stent. EID images were reconstructed first following the clinical protocol at our institution with a 512 × 512 matrix size, a slice thickness of 0.6mm, and a medium smooth kernel (Br40) and an iterative reconstruction algorithm (ADMIRE, Siemens Healthineers) at strength 3, following the clinical protocol at our institution. In addition, EID images were reconstructed under the above parameters but with 1024 × 1024 matrix size, and the sharpest available kernel (Br69). PCD images were reconstructed with a 1024 × 1024 matrix size, a slice thickness of 0.6 mm, and a sharp kernel (Br89) that is only possible with the PCD UHR mode. Two reconstructions were performed for PCD images: one with quantum iterative reconstruction algorithm (QIR; Siemens Healthineers) at strength 3, and the other with filtered backprojection (FBP) algorithm, with all other parameters matched. The QIR images are used for stent imaging, and the difference of FBP and QIR images are used to create noise images for training of an image-based CNN denoising algorithm (to be discussed at next section).
Image-Based CNN Denoising
To address increased noise introduced by the dedicated sharp Br89 kernel, an image-based CNN denoising algorithm reported by Huber et al. was trained and applied to the PCD images of stents parallel to the scanner’s z-axis19. Specifically, all training data for the image-based CNN denoising algorithm were derived from the FBP and QIR reconstructions of the PCD-CT images (Figure 3). The difference between these inputs created a noise-only image. Afterwards, the noise-only images and QIR images from 3 adjacent slices were split into 50,000 patches (size: 64×64×3) for training. Noise-only and QIR patches were added to generate the noisy training input. The corresponding training targets were QIR patches without noise insertion. A U-Net architecture with four max pooling and upconvolutional layers, 64 filters at the first convolutional layer, exponential linear unit (ELU) activation were used for the network with a loss function combined with a VGG feature loss and mean-squared-error (MSE) loss (Figure 3)21. The CNN was trained with Adam optimizer of a scheduled descending learning rate (0.001 to 0.00001) within 100 epochs. After training, the CNN was applied to the reconstructed FBP images for noise reduction making the PCD + CNN image data.
Figure 3.
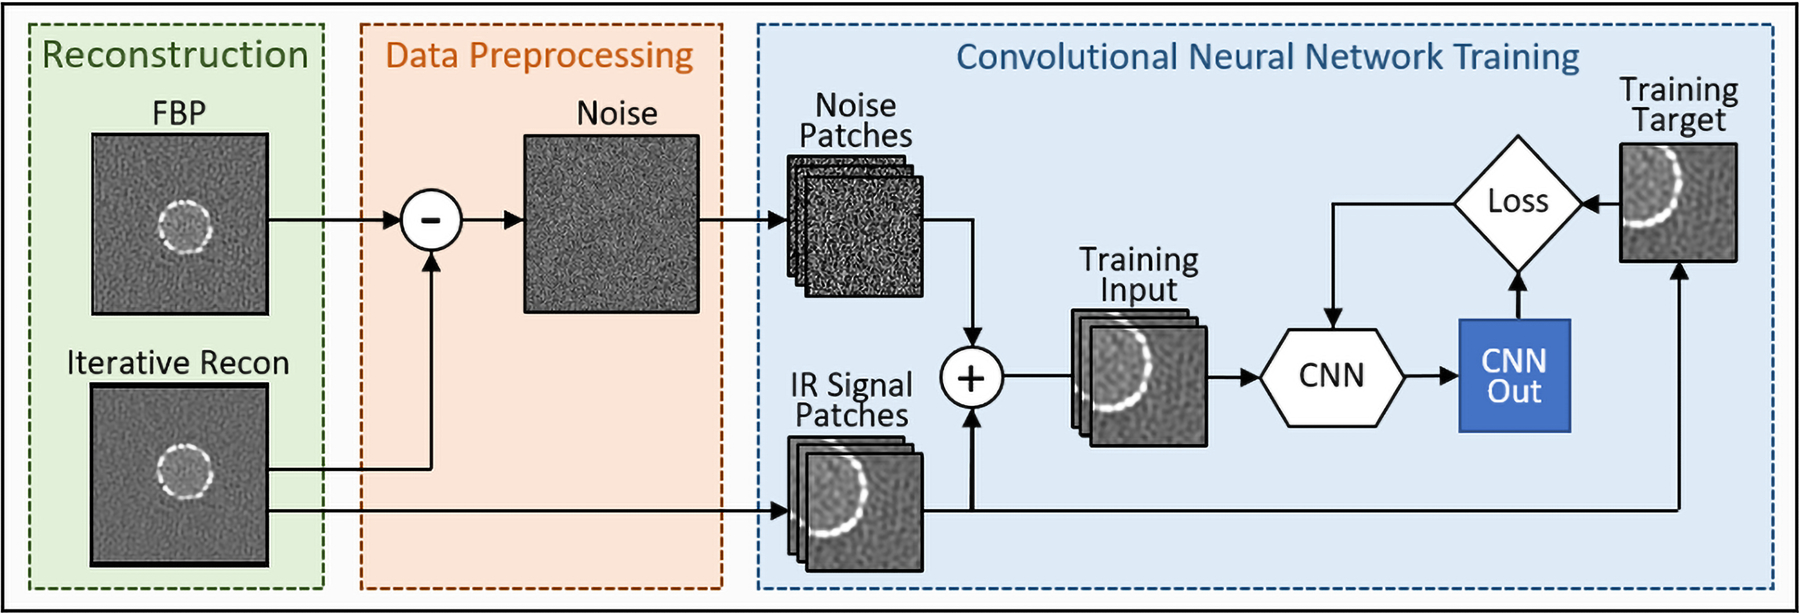
A schematic of CNN denoising training framework. Training data included filtered-back projections (FBP) and quantum iterative reconstruction (QIR) images.
Processing and Image Analysis
Stents were segmented using a custom Matlab script (MATLAB 2019b, The MathWorks, Inc., Natick, MA) based on full width half maximum (FWHM) thresholding and morphological operations (Figure 4). Axial and sagittal images were used for stent data acquired parallel and perpendicular to the scanner’s z-axis, respectively. Then, the script identified relevant image slices containing stents. From this, a binary image was created using FWHM Hounsfield unit (HU) thresholds based on CT numbers of the inner lumen and metal from a given slice. Using the morphological toolkit in Matlab, neighboring pixels of the stent were connected to form a circle where struts were visibly separated. The lumen of the stent was then filled, struts were subtracted, and pixels in the lumen were counted by the algorithm to calculate inner lumen area (A). The effective diameter of the inner lumen (DE) was then estimated based on the following equation:
| (1) |
Figure 4.

Process pipeline for automated segmentation algorithm. Axial images with stents were extracted and stent location was identified. Binary images were created from stent images and connected using morphological operations. Areas inside the stents were filled for calculation of inner lumen effective diameter.
This process was repeated for EID, PCD, and PCD + CNN images. Inner lumen effective diameter was compared to reference sizes measured with a caliper. After processing, outliers in the EID, PCD, and PCD + CNN images where the algorithm included pixels far from the stent were manually excluded from the calculation. Image noise was measured as standard deviation of CT numbers in region of interest (ROI) and compared among EID, PCD, and PCD+CNN images.
Lumen measurements were calculated for each stent using the segmentation pipeline for EID, PCD, and PCD + CNN, respectively. These values were then compared to caliper measurements for each scanning orientation by calculating percent difference:
| (2) |
where is the average lumen diameter measured from the segmentation pipeline of EID, PCD, or PCD + CNN, and is the caliper-measured diameter. Percent difference was calculated for each stent, and values were averaged across all stents and reported for EID, PCD, and PCD + CNN, respectively.
Statistical Analysis
Two-sample t-test was performed using Matlab to evaluate the difference between two variables: effective diameter of EID Br40 and Br69 versus PCD for both parallel and perpendicular orientations. Additionally, effective diameter of EID versus PCD + CNN, and effective diameter of PCD versus PCD + CNN for parallel stent scans was evaluated, respectively. A p-value < 0.05 was considered statistically significant. Standard deviation was calculated for diameter measurements for all images along the z-axis used in overall effective diameter calculation. Standard deviation values were used as error bars in plotted data.
Results
Substantial blooming artifacts were observed in both EID Br40 and Br69 images, resulting in stents appearing larger than the true size and reduced lumen sizes (Figure 5 and 6). The stent appeared as a primarily continuous piece of metal without visibility of individual struts. This was observed on axial, coronal, and volume rendered images. In addition, EID images reconstructed with Br69 kernel introduced a strong patchy noise texture and dark rings around the stent borders (Figure 5 and 6), which affected areas that could hold critical information regarding the diagnosis of in-stent restenosis and obstruct view of relevant neighboring pathology. Overall image quality was substantially improved on PCD images, with higher spatial resolution and reduced blooming artifacts compared to EID images. This resulted in clearer delineation of stent struts. From this, the lumen inside the stent appears to be more open compared to that of EID images. The original PCD images directly reconstructed from the scanner had high image noise (SD = 420 HU) due to very sharp kernel (Br89). Image noise was substantially reduced by approximately 50% (from 420 HU down to 240 HU) using the CNN model.
Figure 5.
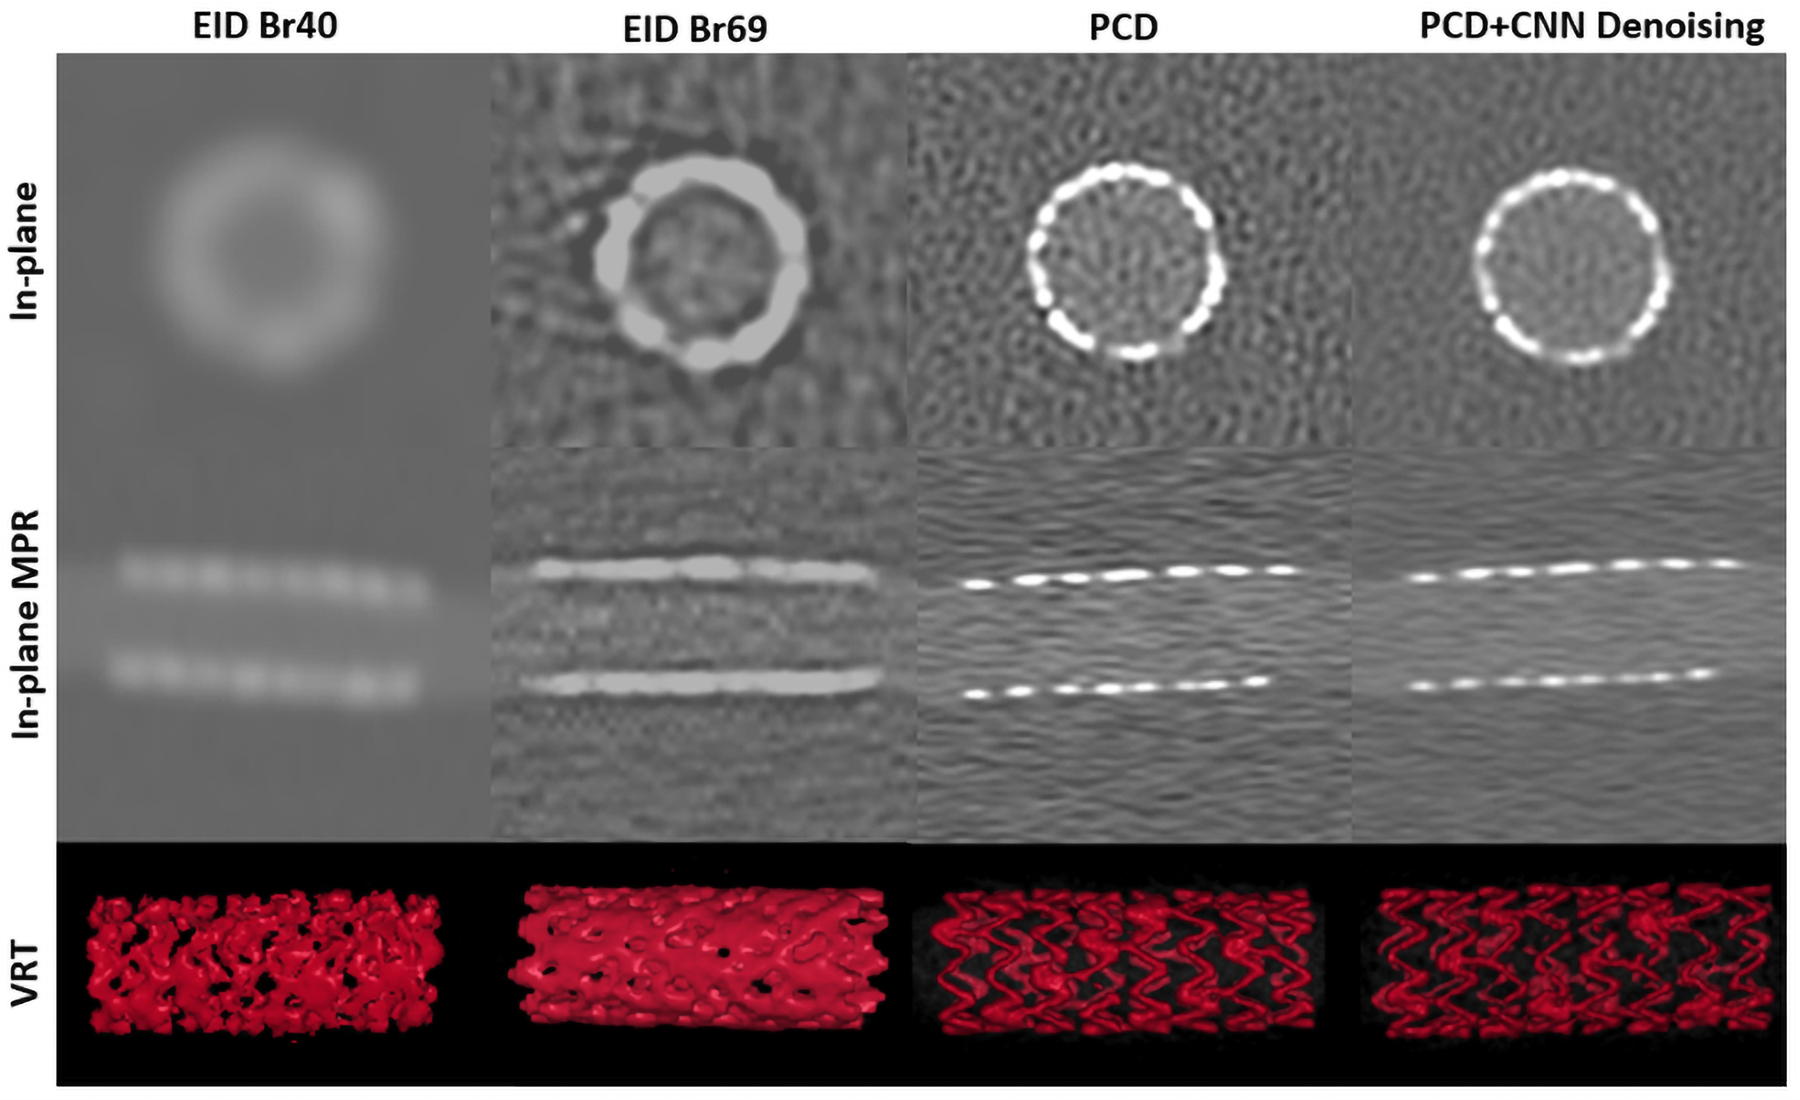
Evaluation of EID Br40 images (left), EID Br69 (left middle), PCD (right middle) and PCD+CNN Denoising (right) for in-plane with scanner’s z-axis (top), multi-planar reformat (MPR, middle), and volume rendering technique (VRT, bottom). PCD images shown were reconstructed with QIR. WW/WL = 1000/10000 HU.
Figure 6.
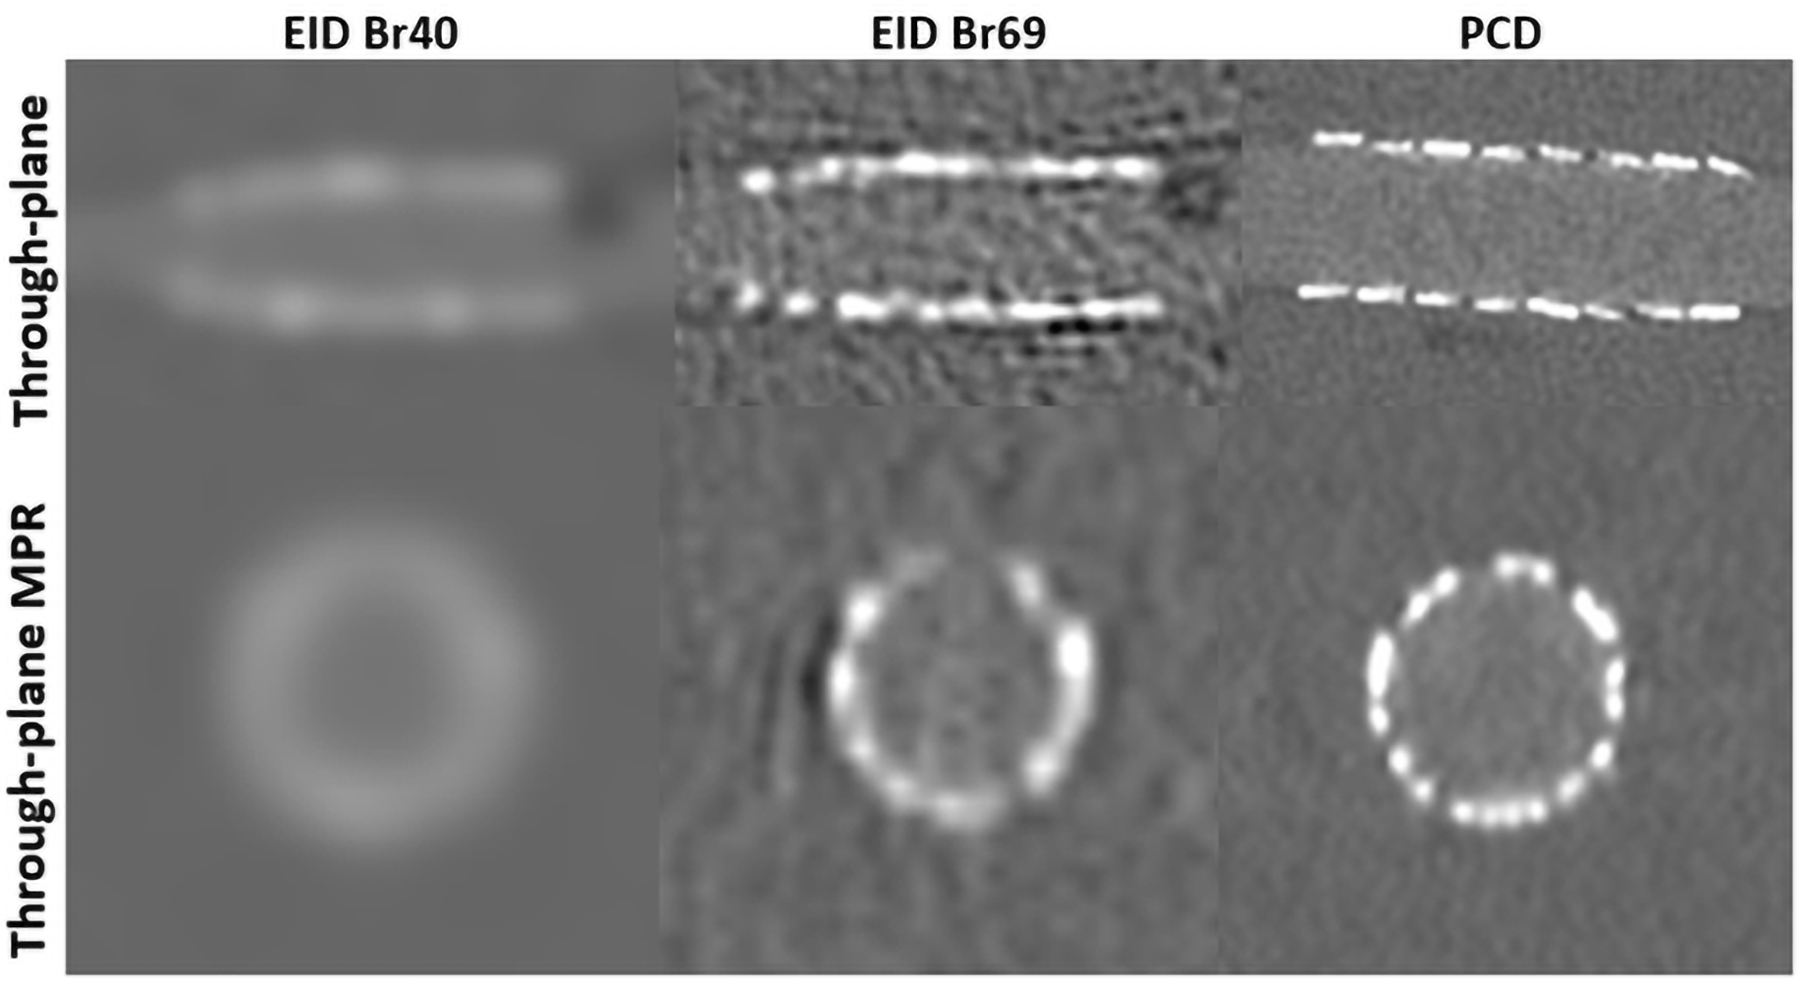
Evaluation of EID Br40 images (left), EID Br69 (left middle), PCD (right middle) and PCD+CNN Denoising (right) for through-plane with scanner’s z-axis (top) and MPR (bottom). PCD images shown were reconstructed with QIR. WW/WL = 1000/10000 HU.
For quantitative measurements, effective diameter of stents was underestimated by 41 and 47% in EID Br40 images relative to caliper measurements for parallel and perpendicular scan orientations respectively (Figure 7A and B), while EID Br69 images were underestimated by 19 and 31% with respect to the caliper for parallel and perpendicular orientations. Effective lumen diameters of PCD images had an underestimation of 9 and 19%, matching the caliper reference more closely. The CNN denoising algorithm reduced noise by 50% on PCD images without significantly impacting luminal diameter measurements (<0.3% difference in comparison to PCD images, p=0.943). Implementation of CNN denoising substantially improved image quality through noise reduction (Figure 5).
Figure 7.
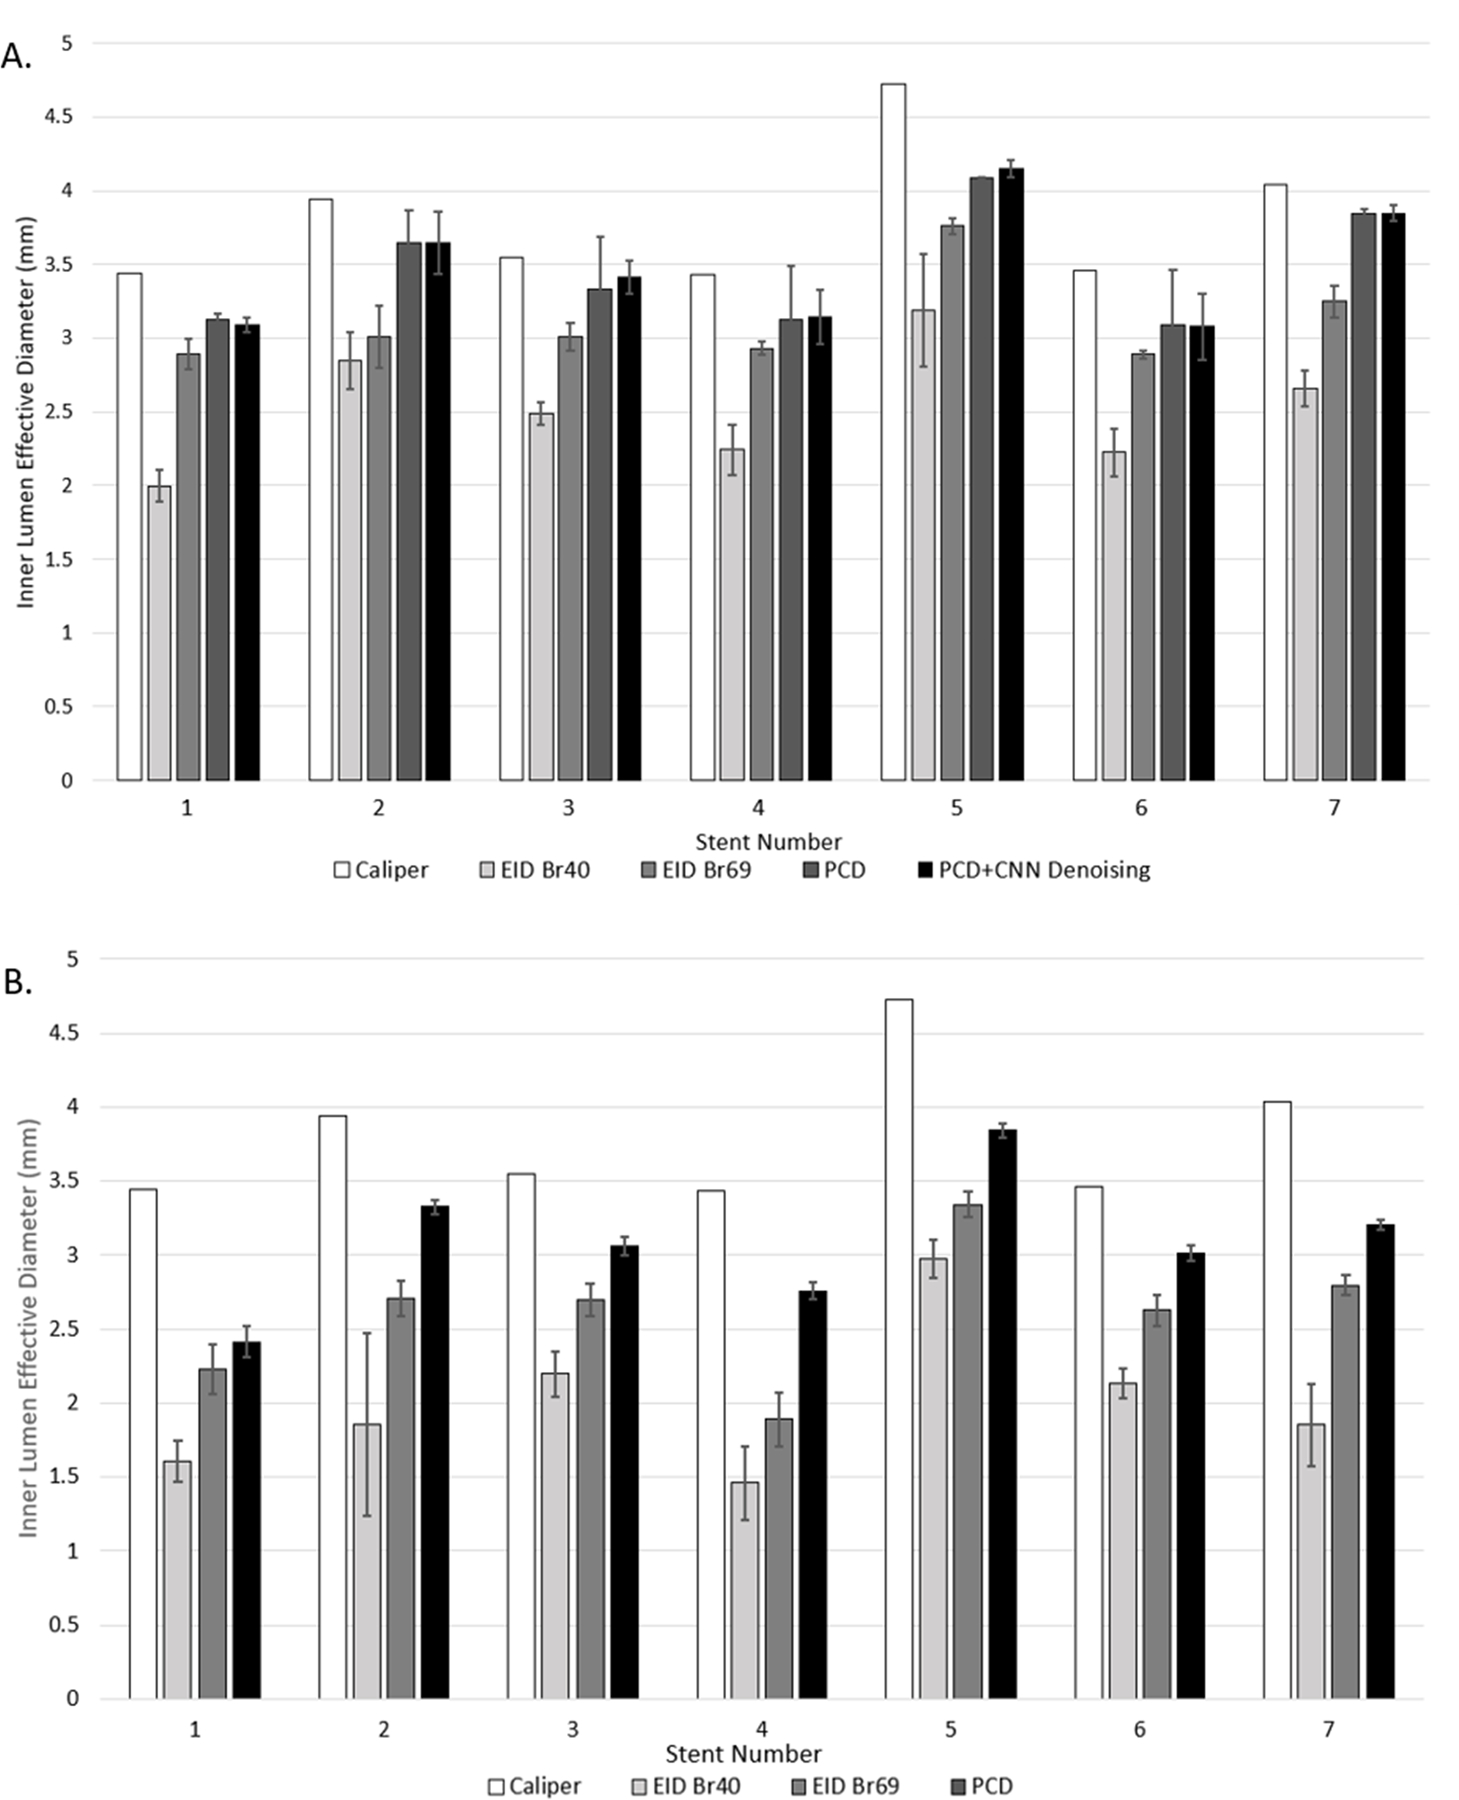
Results of segmented inner stent lumen effective diameter (mm) for EID Br40, EID Br69, PCD, and PCD + CNN Denoising for all seven stents parallel to the scanner’s z-axis (A) and results for EID Br40, EID Br69, and PCD perpendicular to the scanner’s z-axis (B). Error bars represent standard deviation of values used in effective diameter calculation for each stent.
Effective lumen diameter of EID Br40 images were statistically different (p<0.001) than those of PCD and PCD + CNN images for images acquired parallel to the scanner’s z-axis (Table 2A). Effective lumen diameter from EID Br69 images were smaller than those of from PCD and PCD + CNN for each of the 7 stents, but the difference was not statistically significantly (p = 0.089, p = 0.087, Table 2A). Similar trends were observed for stents scanned perpendicular to the scanner’s z-axis: effective lumen diameters measured from EID Br40 images were significantly different than those from the PCD images (p = 0.001, Table 2B); effective lumen diameters measured from the Br69 images were smaller than those from PCD but not statistically significant (p = 0.074, Table 2B). Effective lumen diameter measurements were larger with PCD for all seven stents scanned in both orientations as compared to EID.
Table 2A.
Stent lumen diameter measurements from caliper and segmentation pipeline for parallel to scanner’s z-axis images of EID Br40, EID Br69, PCD, and PCD + CNN.
| Stent Number | Caliper (mm) | EID Br40 (mm) | EID Br69 (mm) | PCD (mm) | PCD + CNN (mm) |
|---|---|---|---|---|---|
| 1 | 3.44 | 2.00 | 2.89 | 3.13 | 3.09 |
|
| |||||
| 2 | 3.94 | 2.85 | 3.01 | 3.65 | 3.65 |
|
| |||||
| 3 | 3.55 | 2.49 | 3.01 | 3.33 | 3.42 |
|
| |||||
| 4 | 3.43 | 2.24 | 2.93 | 3.13 | 3.14 |
|
| |||||
| 5 | 4.72 | 3.19 | 3.76 | 4.09 | 4.15 |
|
| |||||
| 6 | 3.46 | 2.22 | 2.89 | 3.09 | 3.08 |
|
| |||||
| 7 | 4.04 | 2.66 | 3.25 | 3.84 | 3.85 |
| P-Values: | |||||
|
| |||||
| EID Br40 v. PCD | p < 0.001 | ||||
|
| |||||
| EID Br69 v. PCD | p = 0.089 | ||||
|
| |||||
| EID Br40 v. PCD + CNN | p < 0.001 | ||||
|
| |||||
| EID Br69 v. PCD + CNN | P = 0.087 | ||||
|
| |||||
| PCD v. PCD + CNN | p = 0.943 | ||||
Table 2B.
Stent lumen diameter measurements from caliper and segmentation pipeline for perpendicular to scanner’s z-axis images for EID Br40, EID Br69, and PCD.
| Stent Number | Caliper (mm) | EID Br40 (mm) | EID Br69 (mm) | PCD (mm) |
|---|---|---|---|---|
| 1 | 3.44 | 1.61 | 2.22 | 2.41 |
|
| ||||
| 2 | 3.94 | 1.85 | 2.71 | 3.24 |
|
| ||||
| 3 | 3.55 | 2.19 | 2.70 | 3.06 |
|
| ||||
| 4 | 3.43 | 1.46 | 1.89 | 2.76 |
|
| ||||
| 5 | 4.72 | 2.98 | 3.34 | 3.84 |
|
| ||||
| 6 | 3.46 | 2.13 | 2.63 | 3.01 |
|
| ||||
| 7 | 4.04 | 1.85 | 2.80 | 3.21 |
| P-Values: | ||||
|
| ||||
| EID Br40 v. PCD | p = 0.001 | |||
|
| ||||
| EID Br69 v. PCD | p = 0.074 | |||
Discussion
The ultra-high resolution achieved from the use of novel PCD-CT technology and sharp kernel (Br89) notably improved the visualization of the stent and quantification of inner lumen size as compared to EID images in this phantom study. The use of metallic stents is associated with up to 40% occurrence of ISR22,23. Although introduction of drug-eluting stents (DES) has reduced rates of ISR, its prevalence remains significant at about 10% occurance24. Here, our study demonstrated that use of PCD-CT scanning and dedicated sharp kernel (Br89) outperforms the clinical EID CT scanner for both Br40 and Br69 in terms of inner stent lumen quantification allowing for improved assessment of luminal patency. Reconstruction with Br69 improved effective lumen diameter measurements compared to the clinical reconstruction with Br40. However, use of Br69 for EID reconstructions introduced a strong patchy noise texture and dark ring artifacts around the stent borders (Figure 5 and 6). The affected area could hold critical information regarding the diagnosis of in-stent restenosis and obstruct view of relevant neighboring pathology. Although they provide more accurate quantitative measurements of the stent size, these images are not clinically acceptable due to these limitations. In contrary, these artifacts are not observed in PCD images as the smaller detector size supports the sharp kernel used in this study.
Stent imaging in patients using PCD-CT has been reported using an investigational, prototype spectral PCD-CT scanner (SPCCT; Philips Healthcare) with 270 um detector pixel pitch at the isocenter, demonstrating image quality improvements in stents25–27. Sigovan et al. and Bratke et al. have exhibited improved vascular imaging in ex vivo vessel models containing stents with and without calcifications using this system9,28. Previous work by Petritsch et al. demonstrated the benefit of using PCD over EID for stent visualization using an investigational PCD CT scanner (SOMATOM Count Plus, Siemens Healthineers) reconstructing with a non-UHR Bv60 sharp kernel16. More accurate physical dimension measurements compared to EID using a high resolution (0.25 mm detector collimation) prototype PCD system (SOMATOM CounT; Siemens Healthineers) was exhibited by Rajagopal et al15. Koons et al. evaluated use of PCD-CT UHR mode on the clinical scanner (NAOTOM Alpha, Siemens Healthineers) with phantom vessels mimicking blood and iodinated lumens with varied degree of stenosis29. Mergen et al. recently demonstrated the benefits of this clinical PCD-CT system and UHR mode in patients with coronary artery calcification visualization30. Here, our study quantitatively evaluated visualization of coronary artery stent inner lumen with the first clinical PCD-CT using the 0.2 mm detector pixels, a dedicated UHR sharp kernel, and an applied image-based CNN denoising algorithm. The investigated PCD-CT system has a UHR focal spot (0.4×0.5 mm2) to accommodate the small detector size. The PCD-CT system used in this study has a reported limiting spatial resolution of 125 microns in-plane with the scanner’s z-axis spatial resolution verified by the modulation transfer function (MTF) and a limiting through-plane with respect to the scanner’s z-axis of 0.3 mm measured by the section sensitivity profile (with nominal slice thickness of 0.2 mm) 13. This is the highest in and through-plane spatial resolution for clinically available CT scanners to date. In this study, stents were placed at 2 orientations relative to the scanner’s z-axis to test the impact of the difference of in-plane and through-plane resolution on lumen diameter assessment. This was done with the consideration that stent could be in any direction in patient scans. As expected, lumen diameter quantification performed the best when stents were oriented parallel to the scanner’s z-axis as this solely relies on the in-plane resolution which is superior to through-plane resolution. Nonetheless, PCD-CT outperformed EID-CT for both parallel and perpendicular orientations due to better resolution of PCD-CT in all directions. In addition, a dedicated UHR kernel (Br89) that is only available in the UHR mode was used in this study to take full advantage of the system resolution provided by the small detector and focal spot. As expected, image noise increased substantially with the high-resolution imaging mode and sharp reconstruction kernel, which negatively impacts image quality and may dampen the benefits of ultra-high resolution. This increase in image noise, while not significantly affecting lumen diameter measurements, may jeopardize qualitative information of intraluminal structures. Therefore, it is critical to control image noise while maintaining the ultra-high spatial resolution. In this study, we demonstrated that a CNN-based denoising algorithm can achieve approximately 50% noise reduction for UHR PCD-CT images.
There are several limitations of our study. In an animal or human model, motion artifacts may present a noteworthy challenge. Our study was restricted to use of a static model, as UHR mode was not available in electrocardiogram-gated (ECG-gated) cardiac scans at the time of this work. Future directions will implement the ECG-gated cardiac motion feature using the QRM cardiac motion phantom. Our phantom study was also limited to the seven evaluated stents; however, a range of stent materials were included in the study. Future work including more devices as well as recruitment of patients with coronary artery stents is underway.
Conclusions
Our study demonstrated that improved lumen visibility in stented coronary arteries is achieved with PCD-CT technology, and allows more accurate non-invasive assessment of ISR. The use of PCD-CT cCTA for assessment of intraluminal patency could be used to potentially avoid unnecessary interventional procedures.
Acknowledgements
This study was supported in part by the National Institutes of Health under award number R01 EB028590 and supported by Siemens Healthineers GmbH, who own the evaluated system under the terms of a sponsored research agreement with the Mayo Clinic. The content is solely the responsibility of the authors and does not necessarily represent the views of the National Institutes of Health. Additional support was provided from the Department of Radiology at the Mayo Clinic, the CT Clinical Innovation Center, and Mayo Clinic Graduate School of Biomedical Sciences.
Footnotes
Selected sections presented at 2021 RSNA Annual Meeting
Conflict of Interest Statement
Cynthia McCollough is the recipient of a research grant to the institution from Siemens Healthcare GmbH. The other authors have no relevant conflicts of interest to disclose.
References
- 1.(CDC) CfDC. Heart Disease Facts. In: CDC; 2022.
- 2.Organization WH. Cardiovascular Diseases Published 2022. Updated June 2022. Accessed July 2022.
- 3.Mannil M, Hickethier T, von Spiczak J, et al. Photon-counting CT: high-resolution imaging of coronary stents. Investigative radiology 2018;53(3):143–149. [DOI] [PubMed] [Google Scholar]
- 4.Chan PS, Patel MR, Klein LW, et al. Appropriateness of percutaneous coronary intervention. Jama 2011;306(1):53–61. [DOI] [PMC free article] [PubMed] [Google Scholar]
- 5.Virani SS, Alonso A, Aparicio HJ, et al. Heart disease and stroke statistics—2021 update: a report from the American Heart Association. Circulation 2021;143(8):e254–e743. [DOI] [PMC free article] [PubMed] [Google Scholar]
- 6.Flohr T, Petersilka M, Henning A, Ulzheimer S, Ferda J, Schmidt B. Photon-counting CT review. Physica Medica 2020;79:126–136. [DOI] [PubMed] [Google Scholar]
- 7.von Spiczak J, Mannil M, Peters B, et al. Photon counting computed tomography with dedicated sharp convolution kernels: tapping the potential of a new technology for stent imaging. Investigative radiology 2018;53(8):486–494. [DOI] [PubMed] [Google Scholar]
- 8.Gilard M, Cornily J-C, Pennec P-Y, et al. Assessment of coronary artery stents by 16 slice computed tomography. Heart 2006;92(1):58–61. [DOI] [PMC free article] [PubMed] [Google Scholar]
- 9.Sigovan M, Si-Mohamed S, Bar-Ness D, et al. Feasibility of improving vascular imaging in the presence of metallic stents using spectral photon counting CT and K-edge imaging. Scientific reports 2019;9(1):1–9. [DOI] [PMC free article] [PubMed] [Google Scholar]
- 10.Leng S, Bruesewitz M, Tao S, et al. Photon-counting detector CT: system design and clinical applications of an emerging technology. Radiographics 2019;39(3):729–743. [DOI] [PMC free article] [PubMed] [Google Scholar]
- 11.Leng S, Yu Z, Halaweish A, et al. Dose-efficient ultrahigh-resolution scan mode using a photon counting detector computed tomography system. Journal of Medical Imaging 2016;3(4):043504. [DOI] [PMC free article] [PubMed] [Google Scholar]
- 12.Taguchi K, Iwanczyk JS. Vision 20/20: Single photon counting x‐ray detectors in medical imaging. Medical physics 2013;40(10):100901. [DOI] [PMC free article] [PubMed] [Google Scholar]
- 13.Rajendran K, Petersilka M, Henning A, et al. First clinical photon-counting-detector CT system: Technical evaluation. Radiology 2022;303(1):130. [DOI] [PMC free article] [PubMed] [Google Scholar]
- 14.Symons R, De Bruecker Y, Roosen J, et al. Quarter-millimeter spectral coronary stent imaging with photon-counting CT: initial experience. Journal of cardiovascular computed tomography 2018;12(6):509–515. [DOI] [PubMed] [Google Scholar]
- 15.Rajagopal JR, Farhadi F, Richards T, et al. Evaluation of coronary plaques and stents with conventional and photon-counting CT: benefits of high-resolution photon-counting CT. Radiology: Cardiothoracic Imaging 2021;3(5). [DOI] [PMC free article] [PubMed] [Google Scholar]
- 16.Petritsch B, Petri N, Weng AM, et al. Photon-counting computed tomography for coronary stent imaging: in vitro evaluation of 28 coronary stents. Investigative Radiology 2021;56(10):653–660. [DOI] [PubMed] [Google Scholar]
- 17.FDA Clears First Major Imaging Device Advancement for Computed Tomography in Nearly a Decade [press release] fda.gov: FDA2021.
- 18.Boas FE, Fleischmann D. CT artifacts: causes and reduction techniques. Imaging Med 2012;4(2):229–240. [Google Scholar]
- 19.Huber NR, Ferrero A, Rajendran K, et al. Dedicated convolutional neural network for noise reduction in ultra-high-resolution photon-counting detector computed tomography. Physics in Medicine & Biology 2022;67(17):175014. [DOI] [PMC free article] [PubMed] [Google Scholar]
- 20.Hansen SL, Bebbington NA. Estimation of CARE Dose 4D quality reference mAs conversion factors for child to adult reference patient in child protocols on Siemens Symbia SPECT-CT systems. Nuclear Medicine Communications 2021;42(1):107. [DOI] [PMC free article] [PubMed] [Google Scholar]
- 21.Ronneberger O, Fischer P, Brox T. U-net: Convolutional networks for biomedical image segmentation Paper presented at: International Conference on Medical image computing and computer-assisted intervention2015. [Google Scholar]
- 22.Buccheri D, Piraino D, Andolina G, Cortese B. Understanding and managing in-stent restenosis: a review of clinical data, from pathogenesis to treatment. Journal of thoracic disease 2016;8(10):E1150. [DOI] [PMC free article] [PubMed] [Google Scholar]
- 23.Farooq V, Gogas BD, Serruys PW. Restenosis: delineating the numerous causes of drug-eluting stent restenosis. Circulation: Cardiovascular Interventions 2011;4(2):195–205. [DOI] [PubMed] [Google Scholar]
- 24.Dangas GD, Claessen BE, Caixeta A, Sanidas EA, Mintz GS, Mehran R. In-stent restenosis in the drug-eluting stent era. Journal of the American College of Cardiology 2010;56(23):1897–1907. [DOI] [PubMed] [Google Scholar]
- 25.Si-Mohamed SA, Boccalini S, Lacombe H, et al. Coronary CT angiography with photon-counting CT: first-in-human results. Radiology 2022;303(2):303–313. [DOI] [PubMed] [Google Scholar]
- 26.Boccalini S, Si-Mohamed SA, Lacombe H, et al. First in-human results of computed tomography angiography for coronary stent assessment with a spectral photon counting computed tomography. Investigative Radiology 2022;57(4):212. [DOI] [PMC free article] [PubMed] [Google Scholar]
- 27.Si-Mohamed S, Boccalini S, Rodesch P-A, et al. Feasibility of lung imaging with a large field-of-view spectral photon-counting CT system. Diagnostic and Interventional Imaging 2021;102(5):305–312. [DOI] [PubMed] [Google Scholar]
- 28.Bratke G, Hickethier T, Bar-Ness D, et al. Spectral photon-counting computed tomography for coronary stent imaging: evaluation of the potential clinical impact for the delineation of in-stent restenosis. Investigative radiology 2020;55(2):61–67. [DOI] [PubMed] [Google Scholar]
- 29.Koons E, VanMeter P, Rajendran K, Yu L, McCollough C, Leng S. Improved quantification of coronary artery luminal stenosis in the presence of heavy calcifications using photon-counting detector CT Paper presented at: Proceedings of SPIE--the International Society for Optical Engineering2022. [DOI] [PMC free article] [PubMed] [Google Scholar]
- 30.Mergen V, Sartoretti T, Baer-Beck M, et al. Ultra-High-Resolution Coronary CT Angiography With Photon-Counting Detector CT: Feasibility and Image Characterization. Investigative Radiology 10.1097. [DOI] [PMC free article] [PubMed]