Abstract
Background:
Hepatitis B virus (HBV) RNA and hepatitis B core-related antigen (HBcrAg), reflecting transcriptional activity of covalently closed circular DNA, are gaining traction as important markers to assess viral activity. Whether their expression differs under viral suppression by HIV co-infection status is unknown.
Aim:
Among adults with chronic HBV on antiviral therapy, we sought to determine if the expression of HBV markers (specialized and well-established) differ between HBV-HIV co-infection vs. HBV mono-infection.
Methods:
We compared HBV marker levels among 105 participants in the Hepatitis B Research Network (HBRN) HBV-HIV Ancillary Study and 105 participants in the HBRN mono-infected Cohort Study, matched for HBeAg status and HBV DNA suppression on therapy.
Results:
Among HBeAg+ participants (N=58 per group), after adjusting for age, sex, race, ALT and HBV DNA, viral markers were higher (p<.05) in the HBV-HIV versus the HBV-only sample (HBeAg: 1.05 vs. 0.51 log10 IU/mL; HBsAg: 3.85 vs. 3.17 log10 IU/mL; HBV RNA: 5.60 vs. 3.70 log10 U/mL; HBcrAg: 6.59 vs. 5.51 log10 U/mL). Conversely, among HBeAg(−) participants (N=47 per group), HBsAg (2.00 vs. 3.04 log10 IU/mL) and HBV RNA (1.87 vs. 2.66 log10 U/mL) were lower (p<.05) in HBV-HIV vs. HBV-only; HBcrAg levels were similar (4.14 vs. 3.64 log10 U/mL; p=.27).
Conclusion:
Among adults with chronic HBV with suppressed viremia on antiviral therapy, viral markers tracked with HIV co-infection status and associations differed inversely by HBeAg status. The greater sensitivity and specificity of HBV RNA compared to HBcrAg allows for better discrimination of transcriptional activity regardless of HBeAg status.
Keywords: HBV, HIV, HBV RNA, HBcrAg, serum biomarkers
Introduction
The nucleos(t)ide analogues (NAs) tenofovir disoproxil fumarate (TDF) and tenofovir alafenamide (TAF) are the backbone of combination antiretroviral therapy (cART) used in patients with the human immunodeficiency virus (HIV), and first line options to suppress hepatitis B virus (HBV) replication.
HBV RNA levels are not substantially affected by NAs and interferon treatment, and they correlate with cccDNA levels among virally suppressed patients1–7. HBV RNA levels may be predictive of HBeAg seroconversion during treatment with NAs and be a helpful marker for the safe discontinuation of HBV therapy1–4. Hepatitis B core-related antigen (HBcrAg) also correlates in both treated and untreated patients with cccDNA levels. HBcrAg level varies during the different phases of chronic HBV infection, is a useful marker of virus reactivation in occult viral carriers and re-infection after liver transplantation and predicts HBeAg seroconversion5–7.
Measuring and comparing HBV RNA and HBcrAg levels, with other routine HBV serologic and molecular markers (HBV DNA, serum HBsAg/anti-HBs and HBeAg/anti-HBe) in patients with HBV-only and HBV-HIV co-infection receiving antiviral therapy may be relevant to better understanding viral expression and course of infection in the setting of HBV-only and HBV-HIV.
To fill this knowledge gap, we compared HBV RNA and HBcrAg levels, as well as other traditional HBV markers, among adults with chronic hepatitis B (CHB) on antiviral therapy, at a single assessment by co-infection status (HBV-HIV co-infection versus HBV-only), stratified by HBeAg status. We hypothesized that independently of sex, age, race, HBeAg status and HBV DNA level, HBV markers (specialized [HBV RNA and HBcrAg] and well-established [HBV DNA, serum HBsAg and HBeAg]) would be expressed at higher levels in adults with HBV-HIV co-infection compared to mono-infection, but that correlations between viral markers (HBeAg, HBsAg, HBcrAg and HBV RNA) would not differ by HIV infection status.
METHODS
Hepatitis B Research Network (HBRN)
The HBRN comprised 28 clinical sites throughout the U.S. and Canada, initiated to study the natural history of CHB. Between 2012 and 2017, the Adult Cohort study (NCT01263587) enrolled HBsAg positive adults ≥18 years who were not receiving antiviral therapy and did not have a history of hepatic decompensation, hepatocellular carcinoma (HCC), solid organ or bone marrow transplantation, or HIV co-infection. Between 2014 and 2017, the HBV-HIV Co-infection Ancillary Study (NCT01924455) enrolled anti-HIV, HBsAg positive adults ≥18 years from 8 of the HBRN sites who were currently receiving anti-retroviral therapy (cART) which included an anti-HBV NA and also did not have a history of hepatic decompensation, hepatocellular carcinoma (HCC), solid organ or bone marrow transplantation. In both studies, participants underwent evaluations at study entry, at weeks 12, 24, and every 24 weeks thereafter14-15. During follow-up, antiviral treatment could be stopped, initiated, or changed per standard of care at the discretion of a treating physician. Follow-up ended in January 2019.
Participant and Time Point Selection
To be included in this report participants could not have HCV or HDV co-infection and must have stored serum available (to test for HBV RNA and HBcrAg), HBV DNA level <10,000 IU/mL and receiving antiviral therapy for a minimum of 24 weeks. All HBV-HIV participants meeting eligibility criteria were selected. Of 135 HBV-HIV participants, 12 were excluded for HCV or HDV co-infection, 2 because they were not on antiviral therapy for at least 24 weeks, 7 because HBV DNA ≥10,000 IU/mL at all assessments (suggesting nonadherence to cART), and 9 because stored serum was unavailable at assessments meeting the previously stated criteria, leaving 105 HBV-HIV participants (58 HBeAg(+) and 47 HBeAg(−)). An equal number (N=105) of participants with HBV-only who were virally suppressed were selected, matched for age by decade and HBeAg positivity distributions status as the HBV-HIV sample (58 HBeAg(+) and 47 HBeAg(−)). Due to differences in the cohort demographics, it was not possible to match the two groups on sex or race.
As this was a cross sectional analysis, HBV-HIV participants’ baseline assessment was selected except when inclusion criteria were not met at baseline but were met at a later assessment. Because HBRN Adult Cohort participants were not on HBV therapy at study entry, follow-up assessment was considered when selecting the HBV-only comparison group. In general, serologies were assessed using serum collected from a single day. However, because quantitative HBsAg was only measured once every 48 weeks and ALT was measured via local laboratory, if they were unavailable on the day that HBV DNA and quantitative HBeAg had been measured, the closest values within 24 weeks of the other laboratory measures were selected.
Characteristics of HBV-HIV sample.
Most participants were male (HBeAg+: 88%; HBeAg−: 100%) and non-Hispanic white or black (HBeAg(+): 88%, HBeAg(−): 91%). Median age of HBeAg(+) and HBeAg(−) participants was 50 (IQR: 45-56) years and 49 (IQR: 44-56) years, respectively (Table 1). Median estimated duration of HIV infection for HBeAg(+) and HBeAg(−) participants was 21 (IQR: 15-26) years and 19.5 (IQR: 10-25) years, respectively. Median CD4 (cells/mm3) was 529 (IQR: 366-678) for HBeAg(+) participants and 621 (IQR: 416.5-782.5) for HBeAg(−) participants. Among HBeAg(+), 87% had HIV RNA <20 copies/mL (100% <400); among HBeAg(−), 72% had HIV RNA <20 copies/mL (87% <400). Although the lifetime duration of HBV therapy was unknown due to participants not recalling their medication history, most HBV-HIV participants were on therapy for much longer than 24 weeks at the selected assessment (83.8% [88/105], were on HBV therapy at least 48 weeks).
Table 1.
Characteristics of the HBV-HIV co-infected versus HBV mono-infected North American adult samples, stratified by HBeAg status.
| HBeAg(+) | HBeAg(−) | |||||
|---|---|---|---|---|---|---|
|
|
||||||
| HBV-HIV N=58 |
HBV-only N=58 |
P | HBV-HIV N=47 |
HBV-only N=47 |
P | |
| Age (years) | 0.84 | 0.74 | ||||
| Median (25th, 75th) | 50 (45, 56) | 49 (43, 58) | 49 (44, 56) | 47 (43, 57) | ||
| Sex, n (%) | <.001 | |||||
| Male | 51 (87.9) | 31 (53.4) | 47 (100.0) | 47 (100.0) | ||
| Female | 7 (12.1) | 27 (46.6) | 0 (0.0) | 0 (0.0) | ||
| Race, n (%) | n=57 | <.001 | n=46 | <.001 | ||
| Non-Hispanic White | 24 (42.1) | 8 (13.8) | 16 (34.8) | 5 (10.6) | ||
| Non-Hispanic Black | 26 (45.6) | 3 (5.2) | 26 (56.5) | 5 (10.6) | ||
| Non-Hispanic Asian | 2 (3.5) | 45 (77.6) | 3 (6.5) | 36 (76.6) | ||
| Other | 5 (8.8) | 2 (3.4) | 1 (2.2) | 1 (2.1) | ||
| Estimated transmission mode | n=53 | n=45 | <.001 | n=38 | n=28 | <.001 |
| Vertical | 0 (0.0) | 30 (66.7) | 1 (2.6) | 15 (53.6) | ||
| Horizontal | 53 (100.0) | 14 (31.1) | 37 (97.4) | 13 (46.4) | ||
| Other | 0 (0.0) | 1 (2.2) | 0 (0.0) | 0 (0.0) | ||
| Estimated years of HBV | n=43 | n=42 | <.001 | n=36 | n=26 | <.001 |
| Median (25th, 75th) | 15 (8, 20) | 39 (29, 53) | 13 (8, 22.5) | 37 (21, 47) | ||
| HBV therapy, n (%) | 0.049 | 0.008 | ||||
| Tenofovir alone/combination | 52 (89.7) | 44 (75.9) | 41 (87.2) | 29 (61.7) | ||
| Entecavir alone/or with Lamivudine | 6 (10.3) | 14 (24.1) | 3 (6.4) | 16 (34.0) | ||
| Emtricitabine alone | 0 (0.0) | 0 (0.0) | 1 (2.1) | 0 (0.0) | ||
| Lamivudine alone | 0 (0.0) | 0 (0.0) | 2 (4.3) | 2 (4.3) | ||
| ALT x ULN | n=57 | 0.68 | n=44 | n=46 | 0.18 | |
| ≤1 | 32 (56.1) | 23 (39.7) | 26 (59.1) | 19 (41.3) | ||
| >1-2 | 16 (28.1) | 32 (55.2) | 15 (34.1) | 24 (52.2) | ||
| >2-5 | 8 (14.0) | 2 (3.4) | 3 (6.8) | 3 (6.5) | ||
| >5 | 1 (1.8) | 1 (1.7) | 0 (0.0) | 0 (0.0) | ||
| AST (U/L) | n=57 | n=55 | 0.97 | n=44 | n=46 | 0.80 |
| Median (25th, 75th) | 29 (22, 33) | 28 (23, 33) | 26.5 (21, 42) | 28 (23, 35) | ||
| Total Bilirubin (mg/dL) | n=56 | n=56 | 0.07 | n=44 | n=46 | 0.006 |
| Median (25th, 75th) | 0.5 (0.3, 0.7) | 0.6 (0.4, 0.8) | 0.4 (0.3, 0.7) | 0.7 (0.5, 0.9) | ||
| Albumin (g/dL) | n=57 | n=54 | 0.02 | n=44 | n=45 | 0.03 |
| Median (25th, 75th) | 4.4 (4.1, 4.7) | 4.3 (4.0, 4.5) | 4.3 (4.1, 4.5) | 4.5 (4.3, 4.7) | ||
| Platelets (x103/mm3) | n=57 | n=38 | 0.13 | n=44 | n=32 | 0.34 |
| Median (25th, 75th) | 201 (182, 261) | 198.5 (163, 247) | 203 (175.5, 228.5) | 190.5 (164, 229.5) | ||
| HBV DNA (IU/mL) | 0.24 | 0.01 | ||||
| <20 | 31 (53.4) | 34 (58.6) | 39 (83.0) | 46 (97.9) | ||
| 20 - <1000 | 20 (34.5) | 22 (37.9) | 8 (17.0) | 1 (2.1) | ||
| 1000-<10,000 | 7 (12.1) | 2 (3.4) | 0 (0.0) | 0 (0.0) | ||
Acronyms: ALT, Alanine Aminotransferase; AST, Aspartate aminotransferase; DNA, Deoxyribonucleic acid; HBV, Hepatitis B virus; HCV, HIV, Human immunodeficiency virus;
Assessments
Demographics, medical history, and current health status were assessed by self-report and interviewer-administered questionnaires, a physical examination and blood tests, as previously described8–9. Duration of HIV and HBV and current and past cART use was collected but could not be verified in many participants due to the fragmented care received from different health providers at various sites between the time of diagnosis and enrollment. Relevant clinical, laboratory, and radiological data were extracted from medical records, including standard of care test from local laboratories (i.e., liver panel, HIV RNA, HBV DNA level, and HBV serologies). ALT x ULN was categorized as ≤1, >1-2, >2-5, and >5, with ULN defined as 30 U/L for men and 19 U/L for women10. HIV RNA <20 copies/mL was considered suppressed. HBV DNA was categorized as <20 (unquantifiable), 20-<1000 (suppressed), 1000-<20000, and ≥20000 IU/mL (not suppressed).
Research blood samples were collected at each assessment, processed, and stored at −70°C. Quantitative HBV DNA and HBeAg and quantitative HBsAg were tested by the University of Washington, Seattle, WA. HBV DNA levels were determined using a real-time PCR assay (COBAS Ampliprep/COBAS TaqMan HBV Test, v2.0; Roche Molecular Diagnostics, Branchburg, NJ) with a lower limit of detection (LLOD) of 10 IU/mL and lower limit of quantification (LLOQ) of 20 IU/mL. Quantitative HBsAg and HBeAg were tested using the Roche Diagnostics Elecsys platform with LLOD of 0.05 IU/mL for HBsAg and LLOD of 0.3 IU/mL for HBeAg. When central laboratory results were missing, local laboratory results were used for qualitative HBsAg and HBeAg, determined using commercially available enzyme immunoassays, and genotype. Quantitative HBsAg, quantitative HBeAg and HBV DNA, are expressed as log10 IU/mL.
Quantitative HBV RNA and HBcrAg were tested centrally by Abbott Diagnostics, Abbott Park, IL. HBV RNA was isolated from plasma and amplified as described by Butler et al.11, using the m2000 system and quantified as log10 U/mL. Levels below quantification (<1.65 log10 U/mL), were randomly imputed using a uniform distribution (0.01-<1.65 log10 U/mL). Non-detected HBV RNA levels were set to 0 log10 U/mL. HBcrAg serum concentrations were measured using a chemiluminescence enzyme immunoassay (Lumipulse G® HBcrAg assay by Fujirebio Europe, Ghent, Belgium). The assay has a linear measurement range of 3.0 log10 to 6.8 log10 U/ml, with 3 log10 U/ml being the detection limit. Dilution was not performed for samples with concentration >6.8 log10 U/ml. Due to a high proportion of unquantifiable values, HBcrAg levels were categorized as <3, 3-<4, 4-<5, 5-<6, 6-<6.8, ≥6.8 log10 U/ml.
Analysis
Due to differences in associations between viral markers by HBeAg status18, the two samples were split into four groups: HBV-HIV HBeAg(+), HBV-HIV HBeAg−, HBV-only HBeAg(+) and HBV-only HBeAg(−). Demographic, clinical, and virologic characteristics of each group are presented using frequencies and percentages for categorical variables and medians and quartiles for continuous variables. Differences by co-infection status among participants who were HBeAg(+) and HBeAg(−), respectively, were tested with the Chi-square test or its exact equivalent for categorical variables, the Cochran-Armitage trend test for ordinal variables and the Wilcoxon rank-sum test for continuous variables.
Linear regression analysis was conducted among HBeAg+ and HBeAg− participants, respectively, with HBV RNA (log10 U/mL) as the dependent variable and group indicator (HBV-HIV versus HBV-only) as the primary independent variable, with and without control for age, sex, race, ALT category and HBV DNA category as fixed effects. Similar models were tested with HBcrAg, qHBsAg, and qHBeAg, respectively, as dependent variable. A model of qHBeAg was not applicable in HBeAg− participants. Unadjusted and adjusted modeled means in each group and mean differences between groups, with 95% confidence intervals (CI) and p-values are reported. The modeled mean of each group is also reported.
HBV duration was not included as a co-variate because it was missing in a high percentage of participants. However, modeling was repeated with its inclusion in the subset with this data to evaluate whether associations between co-infection status and HBV biomarkers differed in a meaningful way with this added adjustment.
Correlations between HBV biomarkers (HBV RNA, HBcrAg, qHBsAg, qHBeAg) among each of the four groups were tested with Spearman’s rank order correlation with a Fisher adjustment to calculate 95% CI of the correlation coefficient, which were compared among the HBeAg specific HBV-HIV versus HBV-only groups to determine if correlations were significantly different.
Results
Characteristics of HBV-HIV sample.
Most participants were male (HBeAg+: 88%; HBeAg−: 100%) and non-Hispanic white or black (HBeAg(+): 88%, HBeAg(−): 91%). Median age of HBeAg(+) and HBeAg(−) participants was 50 (IQR: 45-56) years and 49 (IQR: 44-56) years, respectively (Table 1). Median estimated duration of HIV infection for HBeAg(+) and HBeAg(−) participants was 21 (IQR: 15-26) years and 19.5 (IQR: 10-25) years, respectively. Median CD4 (cells/mm3) was 529 (IQR: 366-678) for HBeAg(+) participants and 621 (IQR: 416.5-782.5) for HBeAg(−) participants. Among HBeAg(+), 87% had HIV RNA <20 copies/mL (100% <400); among HBeAg(−), 72% had HIV RNA <20 copies/mL (87% <400). Although the lifetime duration of HBV therapy was unknown due to participants not recalling their medication history, most HBV-HIV participants were on therapy for much longer than 24 weeks at the selected assessment (83.8% [88/105], were on HBV therapy at least 48 weeks).
Comparison of HBV-HIV versus HBV-only samples.
Characteristics of the HBV-HIV versus HBV-only samples, stratified by HBeAg status, are reported in Table 1. Among HBeAg(+) and HBeAg(−) participants, age distributions were similar by co-infection status; however, in HBV-only versus HBV-HIV participants Asian race and vertical transmission had higher representation and estimated duration of HBV was longer. Additionally, among HBeAg(+) participants, there was a higher percentage of males among HBV-HIV (88%) versus HBV-only (53%) participants (p<.001). All HBeAg(−) participants were male.
Genotyping was unavailable in most HBV-HIV participants due to HBV suppression at study entry. Among the HBV-only participants, the major genotype was B (22.4% among HBeAg[+], 51.7% among HBeAg[−]) or C (43.5% among HBeAg[+], 32.6% among HBeAg[−]), followed by genotype A (19% among HBeAg+, 10.9% among HBeAg[−]).
Descriptive statistics for HBeAg, HBsAg, HBV RNA, HBcrAg by co-infection status are provided in supplementary material, sTable 1 and in sFigure 1. Among HBeAg(+) participants, 100% of HBV-HIV and 93% of HBV-only samples had quantifiable HBV RNA, and 64% of HBV-HIV and 79% of HBV-only samples had quantifiable HBcrAg. Among HBeAg(−) participants, 53% of HBV-HIV and 70% of HBV-only samples had quantifiable HBV RNA, and 66% of HBV-HIV and 60% of HBV-only samples had quantifiable HBcrAg.
Unadjusted and adjusted modeled means and 95% CI of HBV markers (HBeAg, HBsAg, HBV RNA, HBcrAg) in the HBV-HIV and HBV-only samples, stratified by HBeAg status, are reported in Table 2. Modeled mean differences between groups, also stratified by HBeAg status, are reported in Table 2 and in Figure 1. Among HBeAg(+) participants, after adjusting for age, sex, race, ALT and HBV DNA, HBeAg (p=.05), HBsAg (p=.03), HBV RNA (p<.001) and HBcrAg (p=.01), were higher in the HBV-HIV versus the HBV-only sample. In contrast, among HBeAg(−) participants, HBsAg (p=.002) and HBV RNA (p=.048) were lower in HBV-HIV versus HBV-only participants, and HBcrAg levels were similar (p=.27).
Table 2.
Unadjusted and adjusted* modeled means (95% CI) of HBV serum markers in HBV-HIV co-infected versus HBV mono-infected North American adults, stratified by HBeAg status.
| HBeAg(+) | HBeAg(−) | |||||||||
|---|---|---|---|---|---|---|---|---|---|---|
|
|
||||||||||
| N | HBV-HIV | HBV only | Difference** | P | N | HBV-HIV | HBV only | Difference** | P | |
|
|
|
|||||||||
| mean (95% CI) | mean (95% CI) | |||||||||
| HBeAg (log10 IU/mL) | 112 | NA | NA | |||||||
|
| ||||||||||
| Unadjusted | 1.00 (0.74-1.27) |
0.89 (0.60-1.18) |
0.12 (−0.27-0.51) |
0.55 | ||||||
|
| ||||||||||
| Adjusted | 1.05 (0.45-1.66) |
0.51 (−0.19-1.22) |
0.54 (−0.01-1.08) |
0.051 | NA | |||||
| HBsAg (log10 IU/mL) | 101 | 88 | ||||||||
|
| ||||||||||
| Unadjusted | 3.49 (3.27-3.70) |
3.27 (2.93-3.61) |
0.21 (−0.18-0.61) |
0.28 | 2.41 (2.03-2.79) |
2.78 (2.46-3.09) |
−0.37 (−0.85-0.12) |
0.13 | ||
|
| ||||||||||
| Adjusted | 3.85 (3.35-4.35) |
3.17 (2.48-3.86) |
0.68 (0.05-1.31) |
0.03 | 2.00 (1.18-2.82) |
3.04 (2.13-3.94) |
−1.04 (−1.69- −0.38) |
0.002 | ||
| HBcrAg (log10 U/mL) | 116 | 94 | ||||||||
|
| ||||||||||
| Unadjusted | 6.67 (6.23-7.11) |
6.25 (5.88-6.62) |
0.42 (−0.15-0.99) |
0.15 | 3.36 (2.86-3.86) |
2.80 (2.39-3.21) |
0.56 (−0.08-1.19) |
0.09 | ||
|
| ||||||||||
| Adjusted | 6.59 (5.42-7.75) |
5.51 (4.24-6.79) |
1.08 (0.25-1.90) |
0.01 | 4.14 (3.14-5.15) |
3.64 (2.45-4.83) |
0.50 (−0.40-1.40) |
0.27 | ||
| HBV RNA (log10 U/mL) | 116 | 94 | ||||||||
|
| ||||||||||
| Unadjusted | 4.99 (4.62-5.36) |
4.33 (3.85-4.81) |
0.67 (0.07-1.27) |
0.03 | 1.63 (1.21-2.06) |
2.11 (1.75-2.47) |
−0.48 (−1.02-0.07) |
0.09 | ||
|
| ||||||||||
| Adjusted | 5.60 (4.72-6.48) |
3.70 (2.66-4.73) |
1.90 (1.10-2.71) |
<.001 | 1.87 (0.95-2.78) |
2.66 (1.60-3.72) |
−0.80 (−1.59- −0.01) |
0.048 | ||
Acronyms: HBcrAg, Hepatitis B core-related antigen; HBeAg, Hepatitis B e antigen; HBsAg, Hepatitis B surface antigen; HBV, Hepatitis B virus; HIV, Human immunodeficiency virus; HBeAg, Hepatitis B e-antigen; NH, Non-Hispanic; RNA, Ribonucleic acid.
For age, sex (HBeAg+ models only), race (NH White, NH Black, NH Asian and other/missing), ALT category (≤1, >1-2, >2) and HBV DNA category (<20, 20-<1000, ≥1000-10000).
Mean (95%CI) difference in HBV-HIV co-infected versus HBV mono-infected participants.
Figure 1.
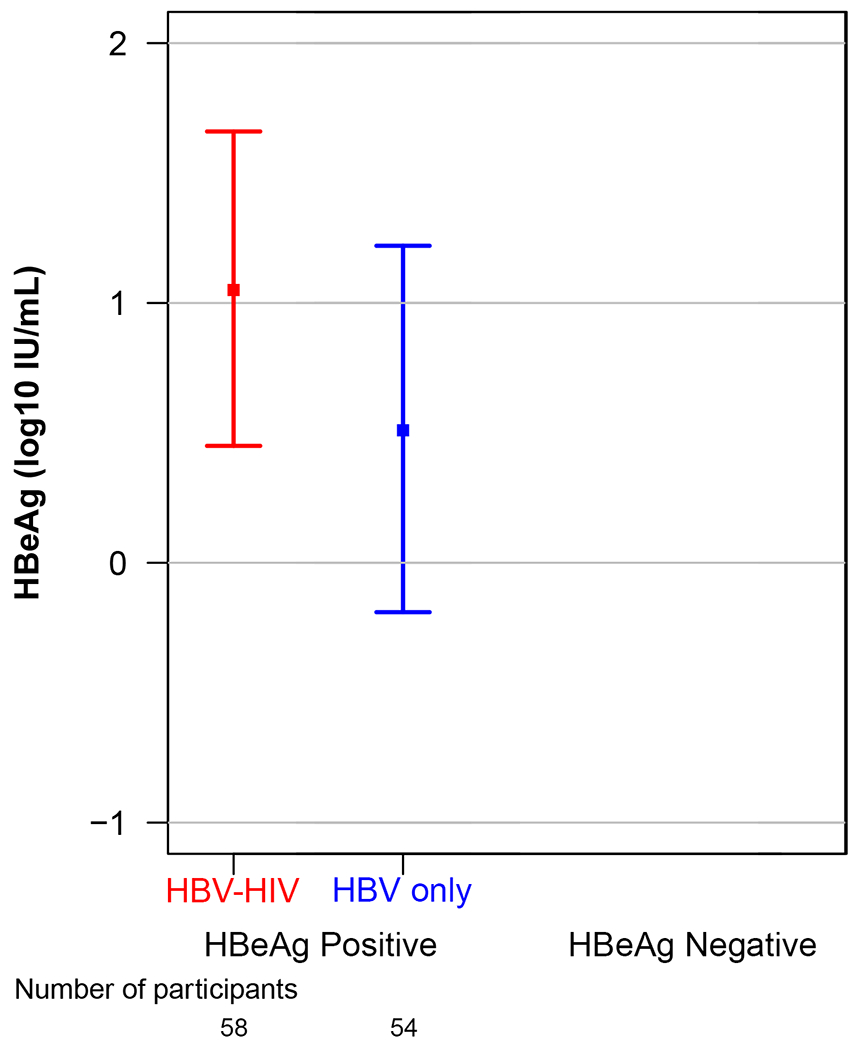
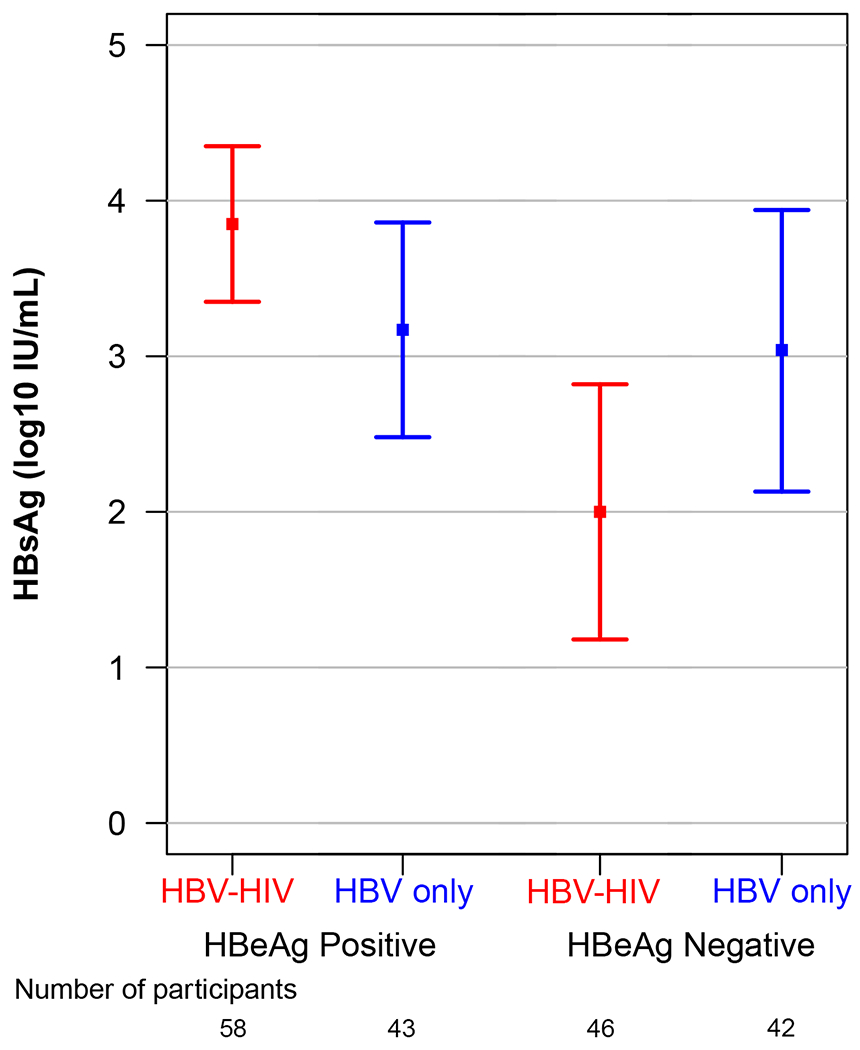
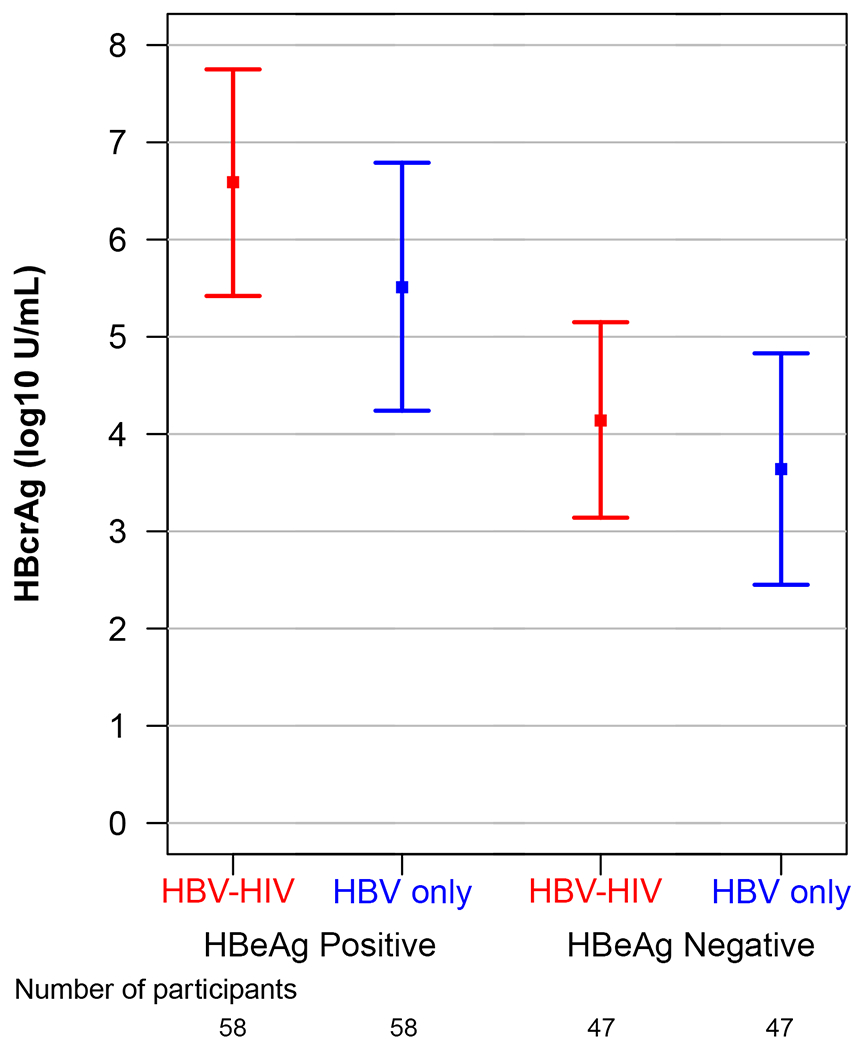
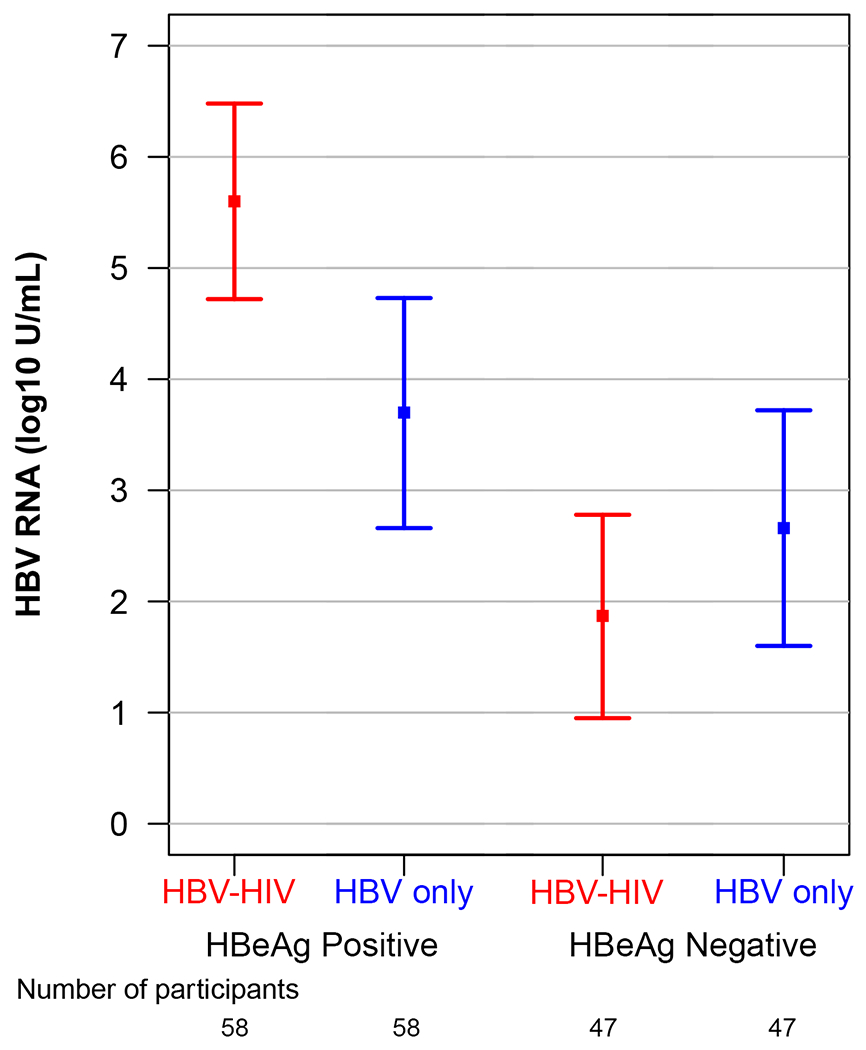
Adjusted modeled means* and 95% CI of HBV serum markers by co-infection status (HBV-HIV co-infection versus HBV mono-infection) stratified by HBeAg status.
Acronyms: ALT, Alanine Aminotransferase; HBcrAg, Hepatitis B core-related antigen; HBeAg, Hepatitis B e antigen; HBsAg, Hepatitis B surface antigen; HBV, Hepatitis B virus; HIV, Human immunodeficiency virus; HBeAg, Hepatitis B e-antigen; HBsAg, Hepatitis B surface antigen; RNA, Ribonucleic acid.
*Adjusted for age, sex, race, ALT category and HBV DNA category.
In a sensitivity analysis, modeling was repeated including and excluding duration of HBV infection data as a covariate, to evaluate association differences between co-infection status and HBV serum markers differed (sTable 2). Among HBeAg(+) and HBeAg(−) participants, estimates of the difference in HBV markers by HIV infection status were similar with and without control for duration of HBV infection and duration of HBV infection was not significantly associated with HBV marker values, with one exception; duration of HBV infection was negatively associated with HBV RNA (−0.15 log10 U/mL per 5 years longer duration of HBV; p=.04).
Correlations between HBsAg, HBeAg, HBV RNA and HBcrAg in HBV-HIV co-infection versus HBV-only among HBeAg(+) participants are shown in Figure 2. Correlations between HBV RNA with both HBcrAg and HBeAg were strong among both co-infected and HBV mono-infected participants. Correlations between HBcrAg and HBeAg were also strong among both groups, but stronger in HBV mono-infected participants. While correlations between HBsAg with HBV RNA and HBeAg were stronger in co-infected versus HBV-only participants, the 95% CI for correlation coefficients overlapped. Correlations between HBV RNA and HBcrAg with HBsAg among HBeAg(−) participants were weak and not statistically significant (supplementary material, sTable 3). However, HBV RNA and HBcrAg were correlated (ρ=0.52, P<.001 in HBV-HIV; ρ=0.31, P=.03 in HBV-only).
Figure 2.
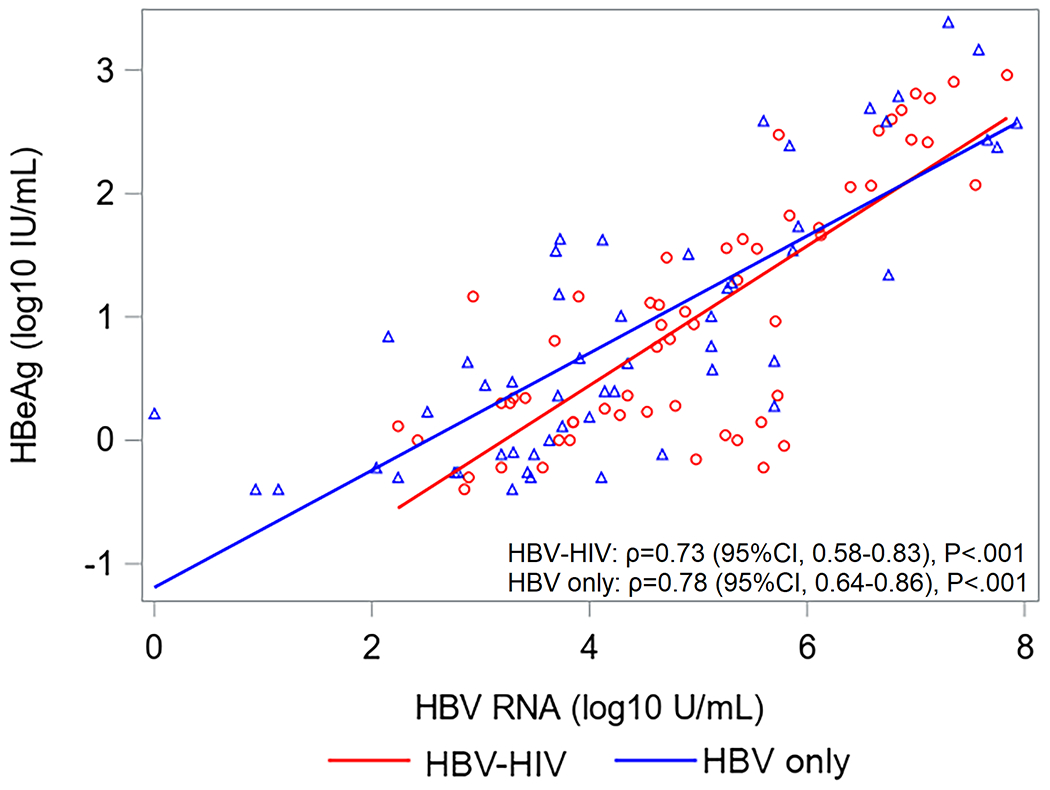
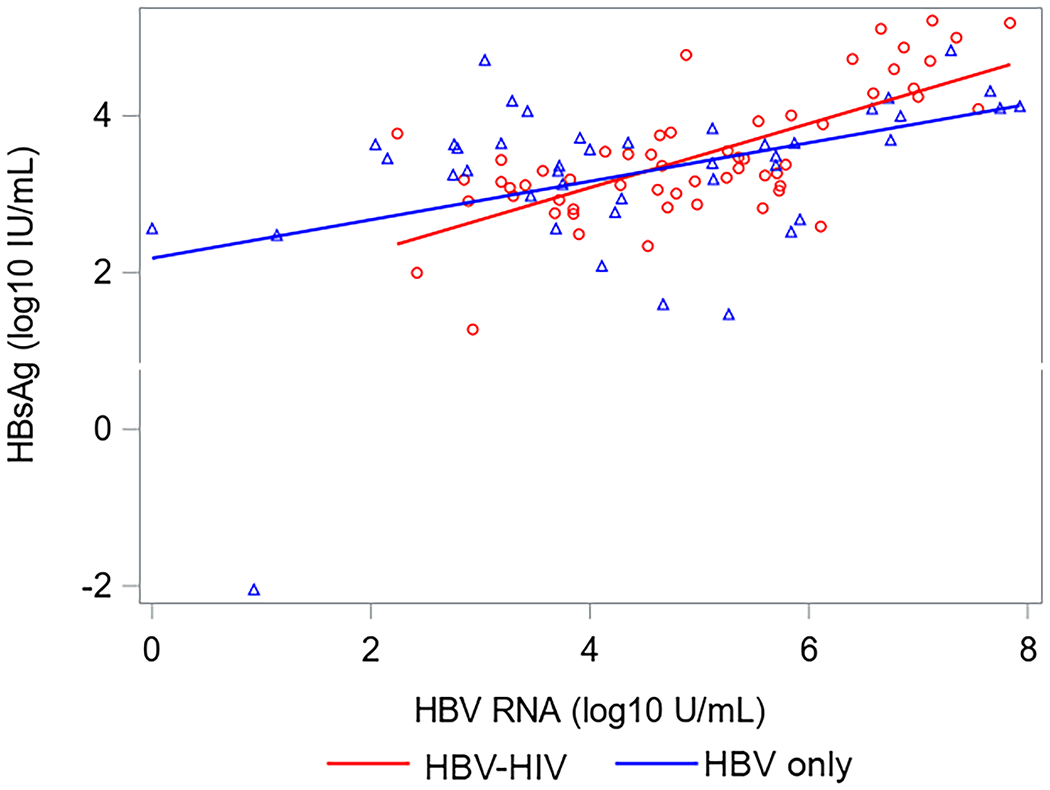
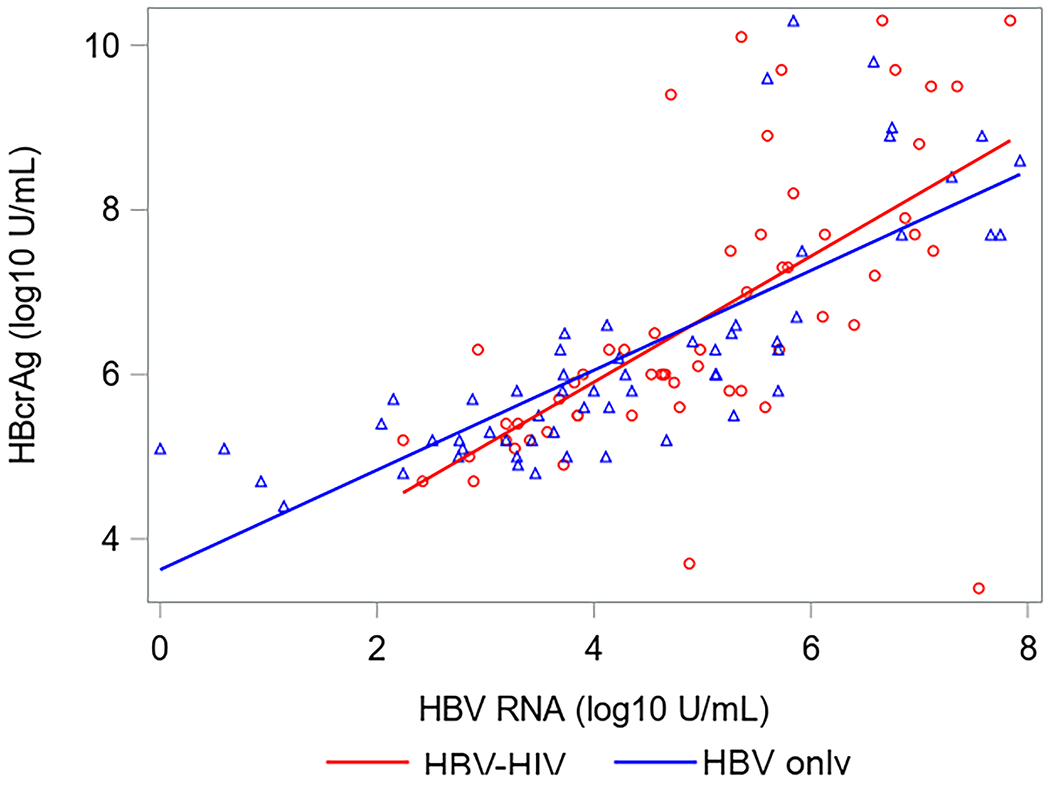
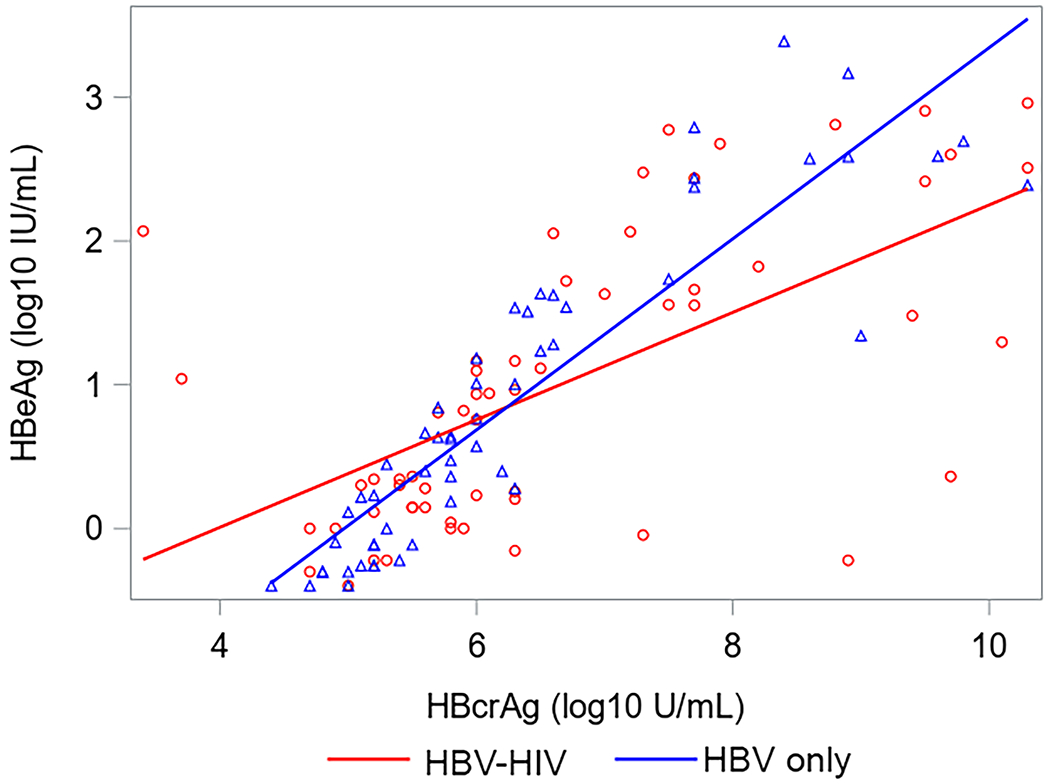
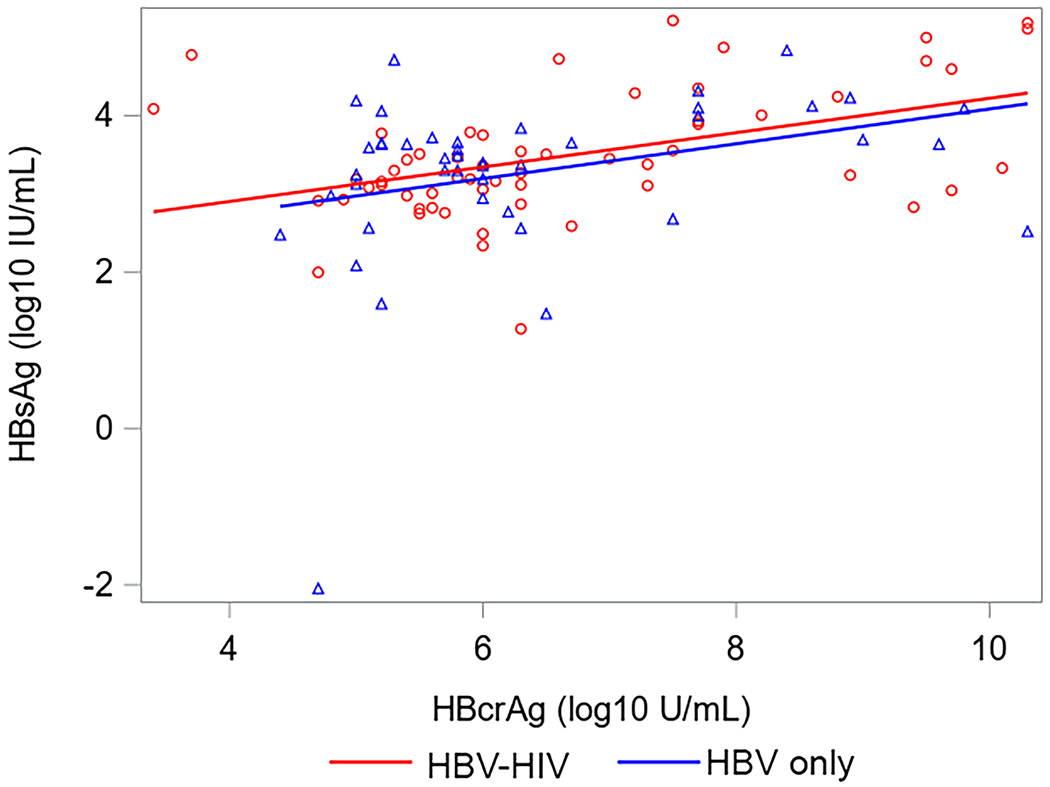
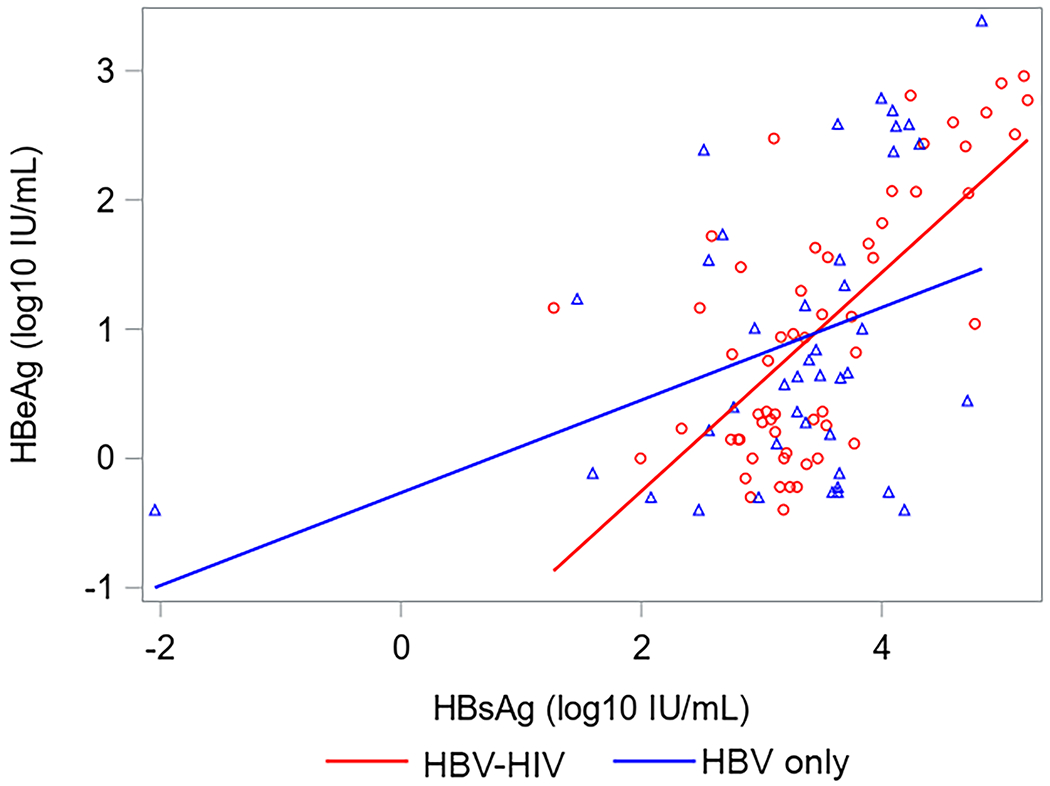
Correlations (with 95% CI) between HBV serum markers by co-infection status among HBeAg+ North American adults.
Acronyms: HBcrAg, Hepatitis B core-related antigen; HBeAg, Hepatitis B e antigen;HBsAg, Hepatitis B surface antigen; HBV, Hepatitis B virus; HIV, Human immunodeficiency virus; HBeAg, Hepatitis B e-antigen; HBsAg, Hepatitis B surface antigen; RNA, Ribonucleic acid.
Discussion
In this cross-sectional study we aimed to determine if the expression of HBV serum viral markers among adults with HBV on antiviral therapy differed between HIV-HBV co-infection versus mono-infection. Building on findings from our earlier studies that established the differential effect of HBeAg status on associations of other viral markers with one another12 and with clinical outcomes13,14 we evaluated the expression of HBV viral markers separately in HBeAg(+) and HBeAg(−) patients. In agreement with our hypotheses among HBeAg(+) adults on antiviral treatment, those with HBV-HIV co-infection versus HBV mono-infection had higher levels of HBeAg, HBsAg, HBV RNA and HBcrAg, independent of age, sex, race, and HBV DNA suppression status. Among HIV-HBV co-infected or HBV mono-infected adults on treatment, correlations between these viral markers differed by HBeAg status; they were moderate to high in HBeAg(+) adults and nonexistent or weak in HBeAg(−) adults. Notably, among HBeAg(−) adults, those with HBV-HIV versus HBV mono-infection had lower levels of HBsAg and HBV RNA and similar levels of HBcrAg. However, it should be emphasized that because HBcrAg predominantly detects HBeAg, it is not surprising for it to be present at low levels in HBeAg(−) persons, regardless of HIV status.
We found a significant elevation in the levels of HBV viral markers reflective of ongoing transcription and translation among HBeAg(+) HIV co-infected persons compared to HBeAg(+) mono-infected comparators who exhibited similar levels of antiviral-mediated HBV suppression. These data suggest that among people harboring replicative HBV, HIV co-infection alters levels of cccDNA, the levels of transcription and translation from that template, or both. They also corroborate our prior studies demonstrating high levels of intrahepatic HBV protein staining in HIV co-infection compared with HBV mono-infection13. They further support the concept that despite long-term suppression of viral replication on NA there is minimal effect on viral transcription particularly among HBeAg positive individuals. Further studies are needed to determine if high levels of viral transcription in the absence of replication is associated with worse outcomes compared to complete suppression of transcription and replication. If so, this may be a possible utility for these markers in monitoring HBV disease in HBeAg(+), HIV-co-infected persons. They also underscore the crucial need for functional curative strategies for HBV, particularly in HIV co-infection.
In contrast, however, we found no or even the opposite correlation of these markers between HIV co-infection and HBV mono-infection in HBeAg(−) participants, in that levels of HBsAg and HBV RNA were possibly lower in co-infection and there was no correlation between HBsAg levels and those of HBV RNA and HBcrAg. We speculate that these findings reflect the predominant extent to which HBsAg is produced from integrated HBV in HBeAg(−) infection, whether HIV co-infected or not. Translation to HBsAg from this integrated DNA would be expected to be insensitive to the effects of antiviral therapy, targeting the reverse transcriptase function of the HBV polymerase. A corollary to this speculation is that the extent to which integration occurs in HIV co-infection may not differ substantially from HBV mono-infection. The finding that HBV RNA and HBcrAg levels were unchanged or even lower in HBV-HIV co-infection suggests that the immunological milieu associated with HBeAg(−) disease in co-infection is more favorable for HBV cccDNA transcription/translation. Another possibility is that less HBsAg may be derived from cccDNA in the HIV-co-infected group, who were infected as adults and likely began antiviral treatment sooner than HBV mono-infected group. Further explication of these findings awaits more detailed characterization of both cccDNA and integrated HBV DNA in these populations. Collectively, these data also underscore the diminished utility of HBcrAg to monitor HBV disease in HBeAg(−) chronic HBV infection. Alternatively, the lower expression of HBV RNA and HBcrAg among the HBeAg(−) co-infected participants may relate to differences in genotypes between the two groups. Although we could not assess HBV genotype among HIV-HBV co-infected participants they were more likely to be Caucasian or Black compared to HBV mono-infected participants who were more likely to be Asian. The predominant genotype among North American Caucasians or Blacks is either A or D in contrast among Asians it is B or C. It has been reported that HBV RNA and HBcrAg levels are higher among genotype C potentially explaining the higher levels among HBeAg(−) mono-infected participants compared to HBeAg(−) co-infected participants.
The following limitations should be considered when interpreting these results. First, given the difference in demographics between our HBV-HIV versus HBV-only cohorts (e.g., relatively more males versus females and White and Black versus Asian co-infected versus mono-infected participants), we were unable to match the groups by sex, race and vertical vs horizontal transmission. Additionally, due to the inclusion requirement of antiviral therapy use, we could not match groups by HBV DNA suppression status (as few HBV-only participants had HBV DNA ≥20 IU/mL) or genotype (relevant for both HBeAg(−) and HBeAg(+) patients considering race differences between groups). However, we controlled for these factors when comparing levels of HBV markers. Second, although we evaluated 210 participants, after stratification by HBeAg status we had modest sample sizes in the comparison groups (58 HBeAg(+) and 47 HBeAg(−) HBV-HIV and HBV only participants), which led to relatively large confidence intervals around our estimates. However, this is the first study to evaluate how co-infection with HIV might influence HBV RNA and HBcrAg levels in adults with HBV and provides new important information.
In conclusion, among adults with HBV on antiviral therapy, most of whom have suppressed HBV DNA, for those who were HBeAg(+), those with HBV-HIV co-infection versus HBV mono-infection had higher levels of HBeAg, HBsAg, HBV RNA and HBcrAg, likely due to higher cccDNA transcription levels among co-infected participants. In contrast, for those who were HBeAg(−), those with HBV-HIV versus HBV-only had lower levels of HBsAg and HBV RNA and similar levels of HBcrAg. This apparent discrepancy may be related to the detection by the HBcrAg assay of small quantities of HBeAg. These data suggest diminished control of HBV in HBeAg(+) disease in HIV-HBV co-infection and highlights the need for more effective treatment beyond HBV DNA suppression with cART in this population. There appears to be diminished utility of HBcrAg to monitor HBV disease in HBeAg(−) chronic HBV infection. In contrast, the greater sensitivity and specificity of HBV RNA compared to HBcrAg allows for better discrimination of transcriptional activity regardless of HBeAg status. The role of these markers as monitoring tools during treatment or for treatment discontinuation, need to be further defined.
Supplementary Material
Acknowledgements:
The authors acknowledge the use of HBRN samples and data as the sole contribution of the HBRN. The HBRN was funded as a Cooperative Agreement between the National Institute of Diabetes and Digestive and Kidney Diseases (NIDDK) and the following investigators: Mark Sulkowski, MD (K24 DA034621), Lewis R. Roberts, MB, ChB, PhD (U01-DK082843), Anna Suk-Fong Lok, MD (U01-DK082863), Steven H. Belle, PhD, MScHyg (U01-DK082864), Kyong-Mi Chang, MD (U01-DK082866), Michael W. Fried, MD (U01-DK082867), Adrian M. Di Bisceglie, MD (U01-DK082871), William M. Lee, MD (U01-DK082872), Harry L. A. Janssen, MD, PhD (U01-DK082874), Daryl T-Y Lau, MD, MPH (U01-DK082919), Richard K. Sterling, MD, MSc (U01-DK082923), Steven-Huy B. Han, MD (U01-DK082927), Robert C. Carithers, MD (U01-DK082943), Mandana Khalili, MD (U01-DK082944), an interagency agreement with NIDDK: Lilia M. Ganova-Raeva, PhD (A-DK-3002-001) and support from the intramural program, NIDDK, NIH: Marc G. Ghany, MD, Intramural Research Program, NIDDK, NIH. Additional funding to support this study was provided to Kyong-Mi Chang, MD, the Immunology Center, (NIH/NIDDK Center of Molecular Studies in Digestive and Liver Diseases P30DK50306, NIH Public Health Service Research Grant M01-RR00040), Richard K. Sterling, MD, MSc (UL1TR000058, NCATS (National Center for Advancing Translational Sciences, NIH), Mandana Khalili, MD, MAS (CTSA Grant Number UL1TR000004), Michael W. Fried, MD (CTSA Grant Number UL1TR001111), and Anna Suk-Fong Lok (CTSA Grant Number UL1RR024986, U54TR001959.) Additional support was provided by Gilead Sciences, Inc. and Roche Molecular Systems via a CRADA through the NIDDK. Raymond T Chung, MD was supported by the MGH Research Scholars Program.
Likewise, the authors acknowledge the use of HBV-HIV Co-infection Research Network samples as the sole contribution of the study, which was funded by National Institute of Diabetes and Digestive and Kidney Diseases (R01-DK94818).
The authors also acknowledge the contributions of Jeffrey Gersch and Mark Anderson, Abbott Diagnostics, who performed the HBV RNA and HBcrAg testing.
We thank the study patients and coordinators who helped make this study possible. We also thank the HBRN Steering Committee and NIDDK for their support and guidance.
Funding:
This work was supported by Abbott Diagnostics as an ancillary study of the Hepatitis B Research Network (HBRN) and the HBV HIV Co-infection Research Network to Dr. Richard K. Sterling. Dr Mandana Khalili was partially supported by NIH K24AA022523.
Grant Numbers/ClinicalTrials.gov numbers:
Adult cohort HBV study (NCT01263587)
HBV-HIV co-infection study (NCT01924455)
Contributor Information
Mauricio Lisker-Melman, Division of Gastroenterology, Washington University School of Medicine and John Cochran VA Medical Center, St. Louis, MO. USA.
Wendy C. King, School of Public Health University of Pittsburgh, Pittsburgh, PA, USA.
Marc G. Ghany, Liver Diseases Branch, NIDDK, NIH, Bethesda, MD, USA.
Raymond T. Chung, Massachusetts General Hospital, Boston, MA, USA.
Amanda S. Hinerman, Epidemiology department, School of Public Health University of Pittsburgh, Pittsburgh, PA, USA.
Gavin A. Cloherty, Abbott Diagnostics, Abbott Park, USA.
Mandana Khalili, Department of Medicine, Division of Gastroenterology and HUniversity of California at San Francisco, San Francisco, CA, USA.
Mamta K. Jain, Department of Medicine, Division of Gastroenterology, UT Southwestern Medical Center & Parkland Health & Hospital System. Dallas, TX, USA.
Mark Sulkowski, Department of Medicine, Division of Infectious Diseases, Johns Hopkins University, Baltimore, MD, USA.
Richard K. Sterling, Division of Gastroenterology, Hepatology, and Nutrition, Virginia Commonwealth University, Richmond, VA, USA.
References
- 1.Tsuge M, Murakami E, Imamura M, et al. Serum HBV RNA and HBeAg are useful markers for the safe discontinuation of nucleotide analogue treatments in chronic hepatitis B patients. Journal of gastroenterology. 2013;48(10):1188–1204. [DOI] [PubMed] [Google Scholar]
- 2.Malmström S, Larsson SB, Hannoun C, Lindh M. Hepatitis B viral DNA decline at loss of HBeAg is mainly explained by reduced cccDNA load--down-regulated transcription of PgRNA has limited impact. PloS one. 2012;7(7):e36349. [DOI] [PMC free article] [PubMed] [Google Scholar]
- 3.van Bömmel F, Bartens A, Mysickova A, et al. Serum hepatitis B virus RNA levels as an early predictor of hepatitis B envelope antigen seroconversion during treatment with polymerase inhibitors. Hepatology (Baltimore, Md.). 2015;61(1):66–76. [DOI] [PubMed] [Google Scholar]
- 4.Wang J, Shen T, Huang X, et al. Serum hepatitis B virus RNA is encapsidated pregenome RNA that may be associated with persistence of viral infection and rebound. Journal of hepatology. 2016;65(4):700–710. [DOI] [PubMed] [Google Scholar]
- 5.Matsumoto A. Hepatitis B core-related antigen: a strong indicator for cessation of nucleos(t)ide analog therapy in patients with chronic hepatitis B. Journal of gastroenterology. 2017;52(1):127–128. [DOI] [PubMed] [Google Scholar]
- 6.Song G, Yang R, Rao H, et al. Serum HBV core-related antigen is a good predictor for spontaneous HBeAg seroconversion in chronic hepatitis B patients. Journal of medical virology. 2017;89(3):463–468. [DOI] [PubMed] [Google Scholar]
- 7.Seto WK, Wong DK, Chan TS, et al. Association of Hepatitis B Core-Related Antigen With Hepatitis B Virus Reactivation in Occult Viral Carriers Undergoing High-Risk Immunosuppressive Therapy. The American journal of gastroenterology. 2016;111(12):1788–1795. [DOI] [PubMed] [Google Scholar]
- 8.Ghany MG, Perrillo R, Li R, et al. Characteristics of adults in the hepatitis B research network in North America reflect their country of origin and hepatitis B virus genotype. Clin Gastroenterol Hepatol. 2015;13(1):183–192. [DOI] [PMC free article] [PubMed] [Google Scholar]
- 9.Sterling RK, Wahed AS, King WC, et al. Spectrum of Liver Disease in Hepatitis B Virus (HBV) Patients Co-infected with Human Immunodeficiency Virus (HIV): Results of the HBV-HIV Cohort Study. The American journal of gastroenterology. 2019;114(5):746–757. [DOI] [PMC free article] [PubMed] [Google Scholar]
- 10.Prati D, Taioli E, Zanella A, et al. Updated definitions of healthy ranges for serum alanine aminotransferase levels. Annals of internal medicine. 2002;137(1):1–10. [DOI] [PubMed] [Google Scholar]
- 11.Butler EK, Gersch J, McNamara A, et al. Hepatitis B Virus Serum DNA andRNA Levels in Nucleos(t)ide Analog-Treated or Untreated Patients During Chronic and Acute Infection. Hepatology (Baltimore, Md.). 2018;68(6):2106–2117. [DOI] [PubMed] [Google Scholar]
- 12.Ghany MG, King WC, Lisker-Melman M, et al. Comparison of HBV RNA and Hepatitis B Core Related Antigen With Conventional HBV Markers Among Untreated Adults With Chronic Hepatitis B in North America. Hepatology (Baltimore, Md.). 2021;74(5):2395–2409. [DOI] [PMC free article] [PubMed] [Google Scholar]
- 13.Lisker-Melman M, Wahed AS, Ghany MG, et al. HBV transcription and translation persist despite viral suppression in HBV-HIV co-infected patients on antiretroviral therapy. Hepatology (Baltimore, Md.). 2022. Jun 30. doi: 10.1002/hep.32634. Online ahead of print. [DOI] [PMC free article] [PubMed] [Google Scholar]
- 14.Chung RT, King WC, Ghany MG, et al. A Prospective Cohort Study of Novel Markers of Hepatitis B Virus Replication in Human Immunodeficiency Virus Coinfection. Clin Gastroenterol Hepatol. 2021. Dec 29;S1542-3565(21)01362-8. doi: 10.1016/j.cgh.2021.12.038. Online ahead of print. [DOI] [PMC free article] [PubMed] [Google Scholar]
Associated Data
This section collects any data citations, data availability statements, or supplementary materials included in this article.


