Abstract
Background:
Artificial intelligence (AI) models applied to 12-lead electrocardiogram (ECG) waveforms can predict atrial fibrillation (AF), a heritable and morbid arrhythmia. However, the factors forming the basis of risk predictions from AI models are usually not well understood. We hypothesized that there might be a genetic basis for ECG-AI-based risk estimates.
Methods:
We applied a validated ECG-AI model for predicting incident AF to ECGs from 39,986 UK Biobank participants without AF. We then performed a genome-wide association study (GWAS) of the predicted AF risk and compared it to an AF GWAS and a GWAS of risk estimates from a clinical variable model.
Results:
In the ECG-AI GWAS, we identified three signals (P < 5×10⁻⁸) at established AF susceptibility loci marked by the sarcomeric gene TTN and sodium channel genes SCN5A and SCN10A. We also identified two novel loci near the genes VGLL2 and EXT1. In contrast, the clinical variable model prediction GWAS indicated a different genetic profile. In genetic correlation analysis, the prediction from the ECG-AI model was estimated to have a higher correlation with AF than that from the clinical variable model.
Conclusions:
Predicted AF risk from an ECG-AI model is influenced by genetic variation implicating sarcomeric, ion channel, and body height pathways. ECG-AI models may identify individuals at risk for disease via specific biological pathways.
Introduction
Atrial fibrillation (AF) is a heritable arrhythmia associated with substantial morbidity, including stroke, heart failure, dementia, and mortality.1-3 Identifying individuals at high risk of developing AF may enable early detection via cardiac rhythm monitoring and treatment, or behavioral modification to prevent AF altogether. Artificial intelligence (AI) algorithms applied to 12-lead electrocardiogram (ECG) waveforms can predict AF.4-6 Algorithms that predict AF risk from ECGs have practical appeal given the ubiquity and inexpensive nature of ECGs, and lack of requirement for manual data input for risk estimation. Whether risk estimates derived from AI algorithms reflect specific underlying genetic pathways that increase susceptibility to AF is unclear.
Understanding the biological basis for risk estimates from machine learning models could aid model interpretability, rationalize model outputs, promote clinician confidence, and potentially enable identification of individuals with specific mechanistic pathways that lead to AF. We recently developed and validated an AI algorithm for predicting the 5-year risk of new-onset AF using 12-lead ECGs (“ECG-AI”).7 In the present study, we conducted genetic association testing with AF risk estimates generated from the ECG-AI model to assess the genetic underpinnings reflected by the output. As a comparator, we assessed the genetic basis of a widely validated clinical risk factor model for predicting AF, the CHARGE-AF score (Cohorts for Aging and Research in Genomic Epidemiology–AF).8
Methods
The study overview is presented in Figure 1. Full methods are available in Supplemental Material. The data and code that support the findings of the present study are available from the corresponding author upon reasonable request. We used data from the UK Biobank9,10 for the analysis in this article. All participants provided electronic signed consent at recruitment, and the study protocol was approved by the UK Biobank Research Ethics Committee (reference number 11/NW/0382). Use of data (under UK Biobank application 7089) for the current study was approved by the Mass General Brigham (MGB) Institutional Review Board.
Figure 1.
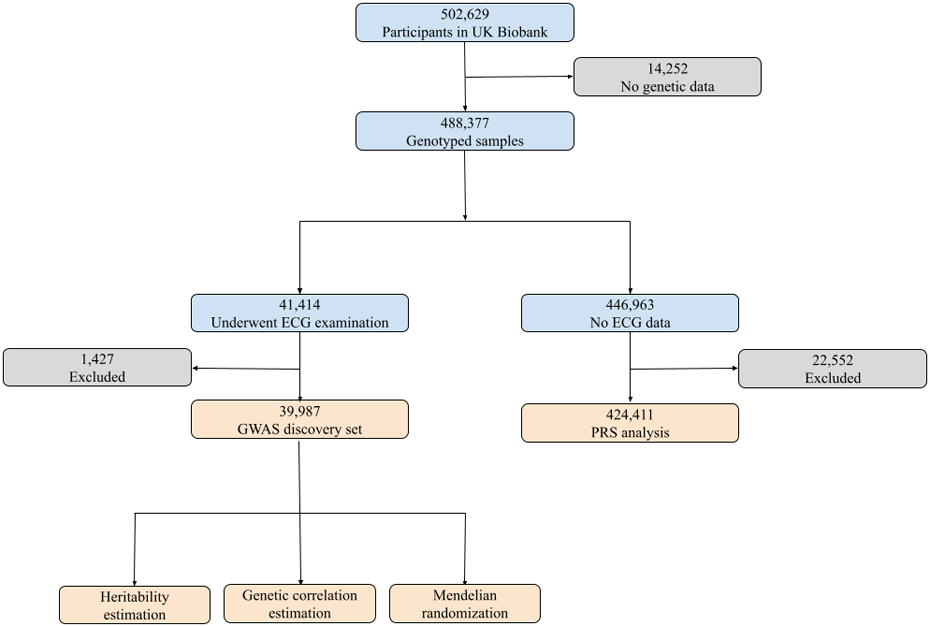
Study overview. We applied our validated ECG-AI model to samples with ECG data in the UK Biobank. After excluding participants who withdrew consent, had missing CHARGE-AF components, were diagnosed with atrial fibrillation (AF) before ECG examination, did not have follow-up information or failed sample QC procedures, 39,987 remained in the discovery set, in which we performed GWAS and post-GWAS analyses. Among the 446,963 remaining genotyping samples, 424,411 did not withdraw consent, were not < 3rd-degree relatives with individuals in the GWAS set, were not diagnosed with AF before enrollment, had follow-up information, and did not fail sample QC procedures. We calculated polygenic risk scores (PRS) using the GWAS results and associated the PRS with incident AF in this subset.
Results
Sample characteristics
A flowchart showing the process of selecting participants in the derivation (39,986) and validation (424,411) analysis is presented in Figure 1. The mean age of the 39,986 participants included in the GWAS was 64.0 +/− 7.7 years at the time of ECG acquisition and 52% were female. The median follow-up time (starting from ECG visit) for this subset was 2.8 years (quartile 1: 1.9, quartile 3: 4.3). 510 individuals developed incident AF within 5 years of follow-up, corresponding to a cumulative incidence of AF of 2.12%. The mean age of the 424,411 participants included in the polygenic risk score application analysis who did not have ECGs was 57.1 +/− 8.1 years at the time of study enrollment and 55% were female. The median follow-up time (starting from study enrollment) for this subset was 11.1 years (quartile 1: 10.4, quartile 3: 11.8). 7,077 individuals developed incident AF within 5 years of follow up, corresponding to a cumulative AF incidence of 1.70%. Participant characteristics are presented in Table 1.
Table 1.
Characteristics of the UK Biobank cohort participants.
| Variable | GWAS discovery set (N=39,986) |
PRS testing set (N=424,411) |
|---|---|---|
| Enrollment age | 55.6 (7.6) | 57.1 (8.1) |
| ECG age | 64.0 (7.7) | Not applicable |
| Female | 20,809 (52.0%) | 232,654 (54.8%) |
| Race (White British) | 38,617 (96.6%) | 370,121 (87.2%) |
| Height (cm) | 169.1 (9.2) | 168.3 (9.3) |
| Weight (kg) | 76.0 (15.2) | 78.0 (16.0) |
| Systolic blood pressure | 138.3 (18.6) | 138.1 (18.7) |
| Diastolic blood pressure | 79.1 (10.1) | 82.4 (10.2) |
| Smoking (current) | 1,446 (3.6%) | 46,433 (11.0%) |
| Antihypertensive medication use (Yes) | 4,275 (10.7%) | 88,887 (18.6%) |
| Diabetes (Yes) | 1,546 (3.9%) | 11,089 (2.6%) |
| Heart failure (Yes) | 186 (0.5%) | 1,701 (0.4%) |
| Myocardial infarction (Yes) | 916 (2.3%) | 9,657 (2.3%) |
Clinical variables were ascertained at baselines. For the genome-wide association studies (GWAS) discovery set, baseline refers to the time of electrocardiogram (ECG) visit. For the polygenic risk scores (PRS) testing set, baseline refers to the time of study enrollment. Descriptive statistics of enrollment age, female, race, and history of diabetes, heart failure and myocardial infarction for the PRS testing set were calculated using the complete sample (N=424,411). Height, weight, systolic blood pressure and diastolic blood pressure were summarized in a subset with the data available (N=423,044). The sample size for participants who self-reported their smoking status and medication use were 423,919 and 477,644, respectively.
Genome-wide association analyses
The GWAS of ECG-AI predicted AF risk did not demonstrate any inflation (λgc=1.04). Four genome-wide significant (P < 5×10⁻⁸) loci were identified (Figure 2 and Supplemental Table I). Two of the top SNVs were in close proximity to genes previously reported to be associated with AF, including TTN and SCN10A.11,12 The nearest genes at the other two loci were VGLL2 and EXT1. A conditional analysis detected an additional independent association signal at the SCN5A locus (Supplemental Table I), which has also been reported to be associated with AF in previous studies.11,13 We provide the summary statistics from a prior AF GWAS11 for SNPs in high LD (r2 >= 0.8) with the top SNPs at the two novel loci implicated in our ECG-AI GWAS (rs9689288 for VGLL2 and rs35186392 for EXT1) in Supplemental Table II. Additionally, we show LocusZoom plots for the two loci comparing between our ECG-AI GWAS and the reference AF GWAS in Supplemental Figure I. Finally, we present the results of an exploratory expression association analysis in which we tested associations between predicted expression of EXT1 and VGLL2 with AF, separately (see Supplementary Methods). We observed a nominal association between the expression levels of EXT1 and AF (P=0.04) and a nonsignificant association between VGLL2 expression and AF (P=0.17; Supplemental Table III).
Figure 2.
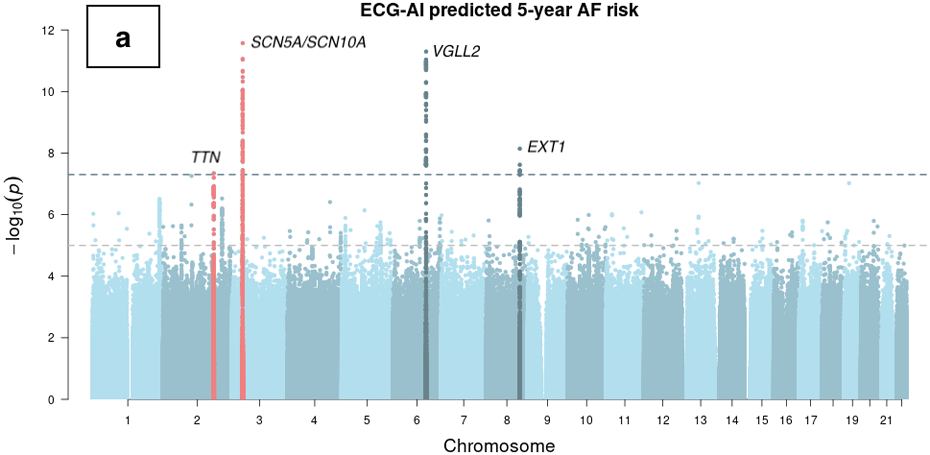
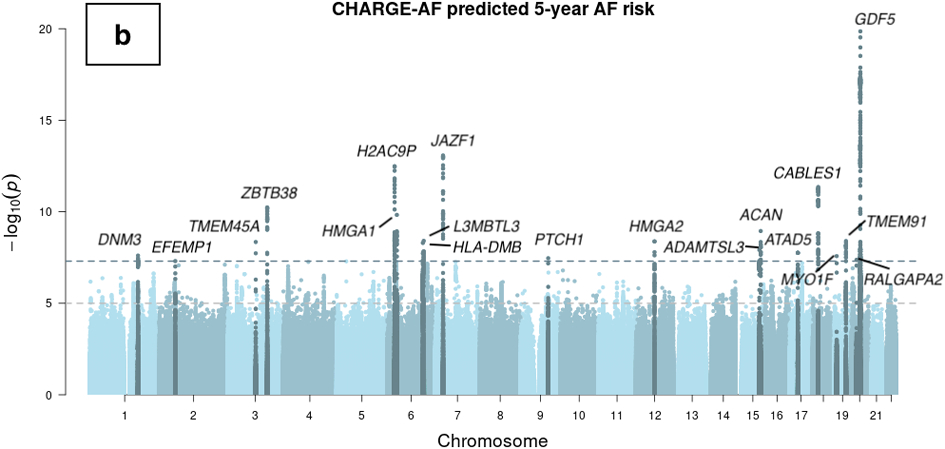
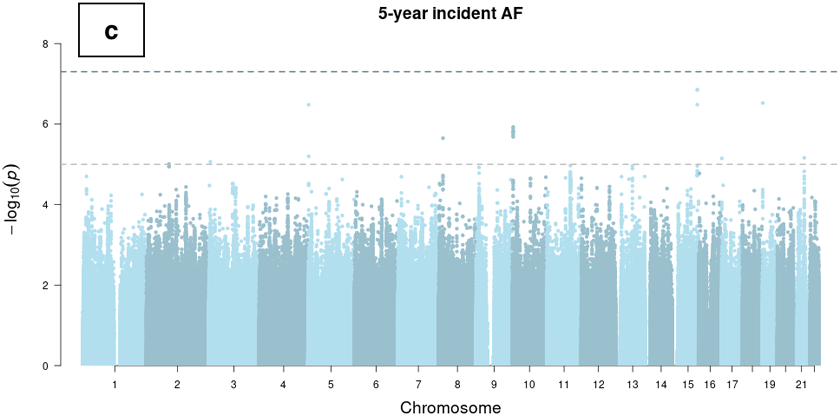
Manhattan plots of genome-wide association studies of ECG-AI and CHARGE-AF predicted risk of AF, and observed 5-year incident AF in the UK Biobank. Chromosomal variant positions are plotted on the x-axis. The −log10(P values) are plotted on the y-axis. The genome-wide significance threshold (5×10⁻⁸) is indicated by the horizontal dotted line. Variants are colored red near loci that have been reported in a prior atrial fibrillation (AF) GWAS,21 and are colored dark blue near loci that have not been reported previously in association with AF. Panels display associations with (a) ECG-AI predicted 5-year risk of AF, (b) CHARGE-AF predicted 5-year risk of AF, and (c) observed incident AF at 5-years in the UK Biobank. 5-year AF risk estimates were rank-based inverse normal transformed prior to analysis (see text).
In the GWAS of CHARGE-AF predicted risk, minimal genomic inflation was observed (λgc=1.10) which was likely due to polygenicity rather than population stratification, as implicated by the LD score regression intercept (1.0107). Nineteen loci were identified in the GWAS of CHARGE-AF predicted risk (Figure 2 and Supplemental Table IV), none of which have previously been reported in association with AF. Traits associated with lead SNVs at these loci mainly consist of body size measurements and phenotypes related to the clinical factors included in the CHARGE-AF score calculation (Supplemental Table IV and Supplemental Table V). No secondary association signals were detected in a conditional analysis.
The LocusZoom plots for risk loci identified in the two GWAS are presented in Supplemental Figure II and Supplemental Figure III, respectively. We also compared the summary statistics of the independent significant lead SNVs in the ECG-AI risk GWAS to that in the CHARGE-AF risk GWAS, and vice versa (Supplemental Table VI). No variants exceed the genome-wide significance threshold in the GWAS of 5-year incident AF with the same covariates (Figure 2).
Heritabilities and genetic correlations
Using individual level genomic and phenotypic data, the estimated heritability (h2) was 13.0% (s.e. 1.4%) for ECG-AI risk and 36.5% (s.e. 1.4%) for CHARGE-AF risk. Genetic correlations with AF were estimated to be 35.3% (s.e. 13.7%) for ECG-AI risk and 18.9% (s.e. 8.6%) for CHARGE-AF risk. We further estimated the genetic correlation between the predicted AF risks from ECG-AI and CHARGE-AF, and found a significant correlation of 39.3% (s.e. 4.5%). As a comparator, we also calculated the heritabilities and genetic correlations using GWAS summary statistics with LD score regression,14 and the estimates were similar in magnitude to those calculated from individual-level data. Detailed results are provided in Figure 3 and Supplemental Table VII.
Figure 3.
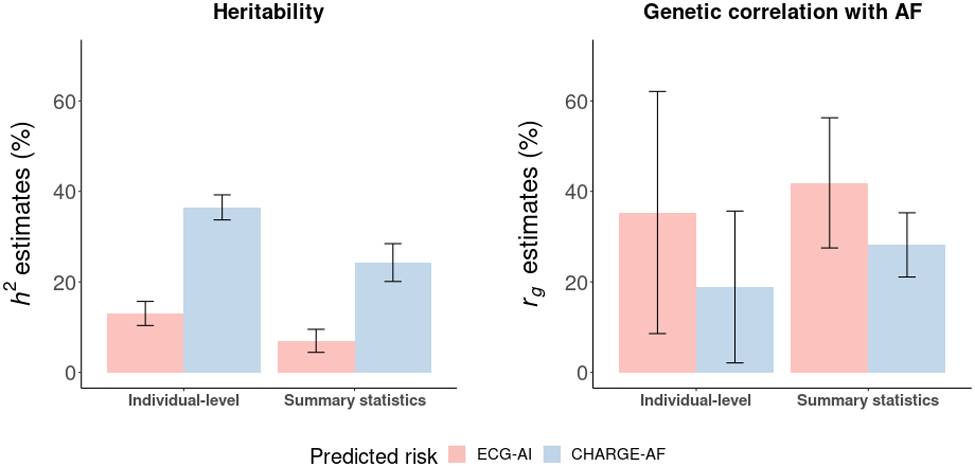
Heritability and genetic correlation estimates for model predicted 5-year atrial fibrillation (AF) risk. Heritability (h2) derived from the ECG-AI and CHARGE-AF GWAS are displayed on the left panel. Genetic correlation (rg) comparing both the ECG-AI and CHARGE-AF GWAS with a prior independent large-scale GWAS of AF,21 is displayed on the right panel. ‘Individual-level’ refers to estimates generated from individual-level genetic and phenotypic data. ‘Summary statistics’ refers to estimates generated from GWAS results. Summary statistics for ECG-AI risk and CHARGE-AF risk were extracted from the GWAS in the present study.
Polygenic risk scores and incident AF
We calculated two polygenic risk scores (PRS) for the 424,411 eligible participants using predicted AF risk GWAS results. Each one standard deviation (SD) increase in the PRS of rank-based inverse normal transformed (R-INT) ECG-AI risk (PRSECG-AI) and the PRS of R-INT CHARGE-AF risk (PRSCHARGE-AF) were significantly associated with 5-year incident AF (PRSECG-AI hazard ratio [HR] 1.07, 95% CI 1.04 - 1.09, P = 3.0×10⁻⁸; and PRSCHARGE-AF HR 1.12, 95% CI 1.09 - 1.14, P = 3.4×10⁻¹⁹). When included in the same model, both remained significantly associated with 5-year incident AF (PRSECG-AI HR 1.06, 95% CI 1.04 - 1.09, P = 1.1×10⁻⁶; and PRSCHARGE-AF HR 1.11, 95% CI 1.08 - 1.14, P = 1.1×10⁻¹⁷). The C-index of models testing the performance of PRSECG-AI, PRSCHARGE-AF, and the two scores together are presented in Supplemental Table VIII. We observed that the C-index was comparable using PRSECG-AI and PRSCHARGE-AF and was highest when including the two scores; the pattern of discrimination is similar to that reported in the original report of the derivation of the ECG-AI score.7
We did not observe a significant interaction between the two PRSs (P = 0.97). We also plotted the cumulative risk of AF stratified by high (10%), middle (80%), and low (10%) groupings of the PRS distributions and observed separation between groups (Supplemental Figure IV). Due to a difference in the ancestral composition of the GWAS discovery set (White British: 96.6%) and PRS testing set (White British: 87.2%), we repeated the above analysis in the subset of the PRS testing set comprising White British participants only. We observed similar results (Supplemental Table IX and Supplemental Figure V).
Contributing components of ECG-AI predicted AF risk
Informed by the genetic signals from our common variant analysis, we tested the causal effects of P wave duration and body height on ECG-AI predicted risk using a two sample Mendelian Randomization (MR) approach. We extracted GWAS summary statistics from studies that did not include UK Biobank samples for P wave duration and body height (see Supplemental Methods). The P wave was selected because (1) it had the greatest impact on ECG-AI predicted risk indicated by saliency maps and a median waveform analysis in our previous study,7 (2) previous literature suggests an association between ECG P-wave duration and AF risk,15 and (3) it has been linked to SCN5A/SCN10A in previous genetic studies16 and an overlap between genetic variants associated with the P-wave and AF has been reported.17 Body height was selected because (1) it has been linked to VGLL2 and EXT1 loci,18,19 (2) is an established risk factor for AF,20,21 and (3) there is published evidence showing that neural networks applied to 12-lead ECGs can predict body size measurements.22
A significant and plausible causal effect of P wave duration on ECG-AI risk was supported by four out of the five methods we used, with MR effect sizes ranging from 0.017 to 0.023. The causal effect of height on ECG-AI risk was supported by all five methods, with MR effect sizes ranging from 0.085 to 0.123. Results are presented in Figure 4.
Figure 4.
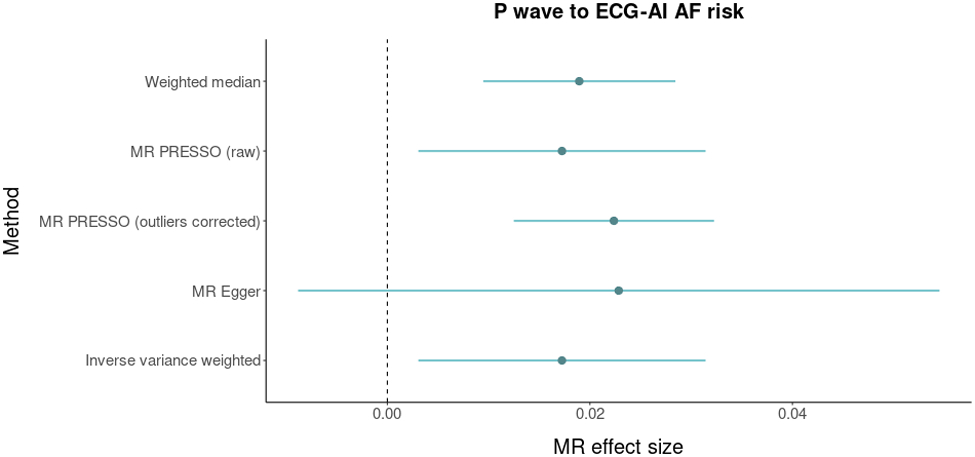
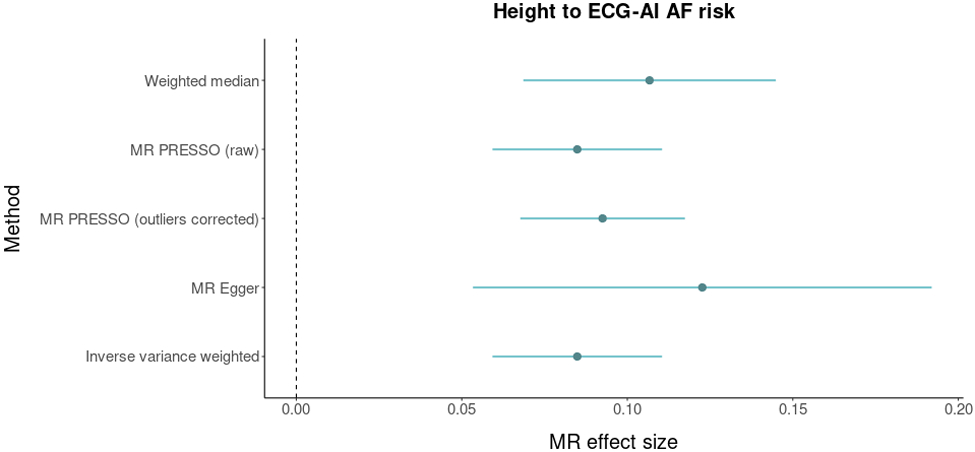
Mendelian Randomization analysis between P wave duration, body height, and atrial fibrillation (AF). The figure displays Mendelian randomization results assessing ECG P wave duration (top panel) and body heigh (bottom panel) for relations with genetically predicted ECG-AI risk. Mendelian randomization effect sizes are graphed on the x-axis. Dots represent point estimates and bars represent 95% confidence intervals. Dashed gray lines represent zero effect sizes. The five Mendelian randomization methods used in this analysis are shown in the y-axis.
Additionally, to discern what ECG features were responsible for associations with observed genes, in exploratory analyses we plotted the median ECG waveforms for individuals in the highest and lowest 1% of the regional PRS for top loci (Supplemental Figure VI). We note that differences are observable but are subtle between risk groups. Given that ECGs were only available for a subset of the UK Biobank participants (N=39,986 in the current study), we anticipate this approach will be more informative as the ECG sample size increases.
Discussion
To facilitate the interpretability of a validated deep-learning model that predicts AF risk from 12-lead ECGs, we assessed the genetic basis of risk predictions generated from the ECG-AI model. Despite the fact that individuals did not have AF at the time of ECG acquisition, we identified variants at three established AF susceptibility loci – TTN, SCN5A, and SCN10A – and at two novel loci that implicate body size measurements – VGLL2 and EXT1. In contrast, our GWAS of CHARGE-AF derived AF risk did not identify any signals previously reported in a GWAS for AF, but identified loci linked to component clinical risk factors for AF that are included in the risk model. Our MR analyses provide supporting evidence that P wave duration and body height are predictive factors for AF that were captured by the ECG-AI model. Broadly, our findings imply that estimates of disease risk from deep learning models that use raw physiologic data, and risk scores more generally, are influenced by genetic susceptibility. In turn, such deep learning models may have the potential to identify individuals at risk for disease via specific genetic pathways.
Deep learning models of 12-lead ECGs for the identification of individuals with a high likelihood of AF have been reported5-7 but the interpretability and representations that underlie the risk estimates generated by the models have not been explained. We previously observed that ECG-AI estimates for AF risk are largely influenced by the P wave, a period corresponding to atrial depolarization and repolarization.7 Moreover, we have previously reported that both ECG-AI and clinical risk for AF are complementary.7 Here, we extend these observations by identifying genetic signals that have been associated with P wave duration,17 and documenting the distinct genetic profiles underlying risk estimates generated by ECG-AI and a clinical risk factor model. Our finding are consistent with the previous observation that ECG-AI and CHARGE-AF models are complementary in terms of predictive utility,7 which may be attributed to the different biological pathways captured by different risk prediction models.
Our findings have two major implications. First, risk estimates from the ECG-AI model are influenced by genetic mechanisms that are more specific to AF than are those from a clinical risk factor model. Specifically, loss-of-function variants in TTN have been associated with a substantially increased risk for AF23,24 and common variants at this locus have been associated with AF.11 TTN encodes titin, an integral protein involved in sarcomere development, structural integrity, and contractility.25 The ECG-AI GWAS also identified variation at the SCN5A and SCN10A loci. Both SCN5A and SCN10A encode the alpha subunits of voltage gated sodium channels and SCN5A is essential for myocyte depolarization. Genetic variants at these loci have been described in association with AF and ECG traits in prior GWAS11,16,26,27 and in rare familial forms of AF.13,28-30 VGLL2 encodes for the vestigial like family member 2a protein, is critical for skeletal muscle development and contains a interacting domain for TEAD1, a member of the Hippo signaling pathway.31 EXT1 encodes a protein involved in the production of heparan sulfate32, and has been implicated in the development of the outflow tract.33 We note that the EXT1 and VGLL2 loci are relative gene-dense loci, and we have focused here on the nearest genes as a means of prioritization.
In contrast, the genetic signals for CHARGE-AF risk were not specific to AF but reflected the diverse genetic mechanisms underlying the component risk factors in the model, including body height, body weight, blood pressure, and smoking status. Notably, the ECG-AI model loci linked to body size – VGLL2 and EXT1 – differ from the CHARGE-AF model loci linked to body size, implying that the manifestation of body size on the ECG may reflect different dimensions of body size from those measured conventionally using height and weight. The relative specificity of the ECG-AI model for genetic mechanisms underlying AF is further supported by our observation that the genetic correlation with AF from a prior GWAS was greater with ECG-AI predicted risk than with CHARGE-AF predicted risk.
Overall, our finding that predicted risk of AF from an ECG-based deep learning model is influenced by inherited susceptibility raises the possibility that an individual’s genetic predisposition to AF is inferable using their raw ECG data alone, even prior to disease onset. Indeed, the GWAS of incident AF did not identify any significant genetic susceptibility loci, underscoring the power of performing a GWAS of models trained to predict risk of a disease, rather than of the disease itself. Future analysis is warranted to assess whether ECG-AI, and other risk models more broadly, can be used to specifically predict which individuals are predisposed to diseases via particular biological mechanisms. Such insights could theoretically have important implications for the personalization of prevention and therapeutics, identification of individuals with genetic disorders, and the use of deep learning or other risk models as digital biomarkers in addition to general risk prediction models.
Second, the genetic analysis of risk estimates generated by AI models may facilitate the interpretation of output, and underlying representations, of the models which may otherwise be difficult to interpret. Our GWAS, and MR analyses, highlight the fact that our ECG-AI model is influenced by heritable factors related to the P-wave and body size. The fact that ECG-AI can infer anthropometric traits22 suggests that deep learning model estimates from raw physiologic data can be influenced by numerous variables which manifest on the data modality under study. Height has been causally linked to AF risk previously.20,21 Future work is warranted to understand which specific ECG features reflect risk factors for AF and how artificial intelligence models learn and predict risk factors for AF. We propose the transfer of clinically-derived models to datasets with genomic information and subsequent genetic association testing, as a means to explore the factors which influence risk estimates from deep learning models. We submit that this approach could serve as a tool for improving model interpretability when the prediction models are otherwise difficult to understand.
We further note that whereas our approach focused on a single model task – the predicted risk of AF – examining the genetic architecture of the model latent space itself may reveal the genetic basis for the ECG representations learned by the model. As the number of samples with both ECG and genomic data increase, we anticipate greater statistical power to identify genetic signals underlying predicted disease risk, including rare large-effect variants. Given the fact that the ECG-AI GWAS implicated known AF risk loci in individuals without AF, the approach we employed may have the potential to identify novel disease-related pathways as sample sizes grow. Moreover, we submit that the increasing availability of large-scale biobank data with raw data acquisition amenable to deep learning will enable examination of the genetic basis of other disease predictions. We anticipate that improved understanding of the relations between biological pathways and deep learning models may facilitate model application in clinical practice by enhancing clinician confidence in model outputs, and facilitating the inference of biological pathways that lead to disease risk in specific individuals.
Our study should be interpreted in the context of the design. First, our phenotyping algorithm used hospitalization and death records to ascertain disease status, which may lead to disease misclassification. However, before applying the ECG-AI model in UKBB, we omitted individuals that were not identified as prevalent AF by the phenotyping algorithm but were indicated as AF by their diagnostic statement accompanying ECG data, to reduce the impact of misclassification. Second, the MGH dataset we used to train the ECG-AI model and the UKBB dataset we used to perform genetic analyses consist predominantly of White British participants, which may limit the generalizability of our findings to populations of other ancestries. It is unclear if the results of the GWAS of ECG-AI reflect the underlying composition of the sample in which it was trained – future analysis of other ECG-AI models for AF prediction are warranted. Third, as additional and larger biorepository datasets emerge, replication of the ECG-AI GWAS will be necessary to support the utility of our approach for understanding disease prediction models. Functional validation will be required to support the mechanisms by which genetic loci predispose to disease risk. Fourth, risk discrimination of the ECG-AI model in UKBB is moderate. A model with greater discrimination in the discovery sample may increase yield of genetic associations. Fifth, given roughly three years of follow-up after ECG in the UK Biobank, the power of our incident AF analysis may be limited. Sixth, we note that neither the GWAS of the ECG-AI model nor the CHARGE-AF model identified some established AF susceptibility loci, including that upstream of PITX2, the predominant AF common variant susceptibility locus. We note that PITX2 is not identified in any ECG trait GWAS, which implies that the mechanism underlying association with AF for this risk locus does not prominently involve factors that impact the ECG. Our findings highlight the fact that specific genetic susceptibility loci identified when performing association testing using a particular modality will reflect the risk pathways which manifest on that modality. Seventh, when interpreting the genome-wide associations with disease risk estimates generated from prediction models, the signals may reflect confounders rather than causal risk factors for the disease. However, instead of discovering novel causal genes for AF, the current study aims to understand the factors forming the basis of predictions generated from the ECG-AI model. Our analysis identified factors that manifest on the ECG and are interpreted by the neural network to contribute to disease risk. Lastly, 2,000 individuals among the 39,986 participants in the discovery set were related (3rd degree or closer), which may impact the GWAS results generated by the REGENIE software. While REGENIE includes a genetic relatedness matrix in its analysis, which may address this issue to some extent, it is important to note that other factors, such as the degree of relatedness, the size of the dataset, and the underlying genetic architecture of the trait of interest, may still affect the results.
In conclusion, we have shown that ECG-AI predicted AF risk reflects inherited predisposition to AF with a genetic background that is more specific for AF risk loci when compared to that for a clinical model. A polygenic risk score constructed using common variants associated with ECG-AI risk was significantly associated with incident AF in a prospective cohort. The interpretability of the ECG-AI model was improved by genetic analyses indicating that P wave duration and body height are likely to be two contributing factors forming the basis of AF risk predictions.
Supplementary Material
Sources of Funding:
Dr. Lubitz was supported by NIH grants R01HL139731, R01HL157635 and American Heart Association 18SFRN34250007. Dr. Anderson is supported by NIH grants R01NS103924 and U01NS069763 and American Heart Association grants 18SFRN34250007 and 21SFRN812095. Dr. Weng is supported by National Institutes of Health (NIH) grant 1R01HL139731. Dr. Choi is supported by the NHLBI BioData Catalyst Fellows program. Dr. Ho is supported by the NIH (R01HL134893, R01HL140224, K24HL153669). Dr. Ellinor is supported by the NIH (1R01HL092577, K24HL105780), AHA (18SFRN34110082) and by MAESTRIA (965286). Dr. Lau is supported by the American Heart Association (853922).
Nonstandard Abbreviations and Acronyms
- CHARGE-AF:
Cohorts for Aging and Research in Genomic Epidemiology–Atrial Fibrillation.
- CNN:
convolutional neural network.
- ECG-AI:
an artificial intelligence algorithm for predicting the 5-year risk of new-onset atrial fibrillation using 12-lead ECGs.
- LD:
linkage disequilibrium
- R-INT:
Rank-based inverse normal transformation.
- SNPs:
single nucleotide polymorphisms
- SNVs:
single nucleotide variants
Footnotes
Disclosures: Dr. Lubitz is a full-time employee of Novartis as of July 18, 2022. Dr. Lubitz has received sponsored research support from Bristol Myers Squibb, Pfizer, Boehringer Ingelheim, Fitbit, Medtronic, Premier, and IBM, and has consulted for Bristol Myers Squibb, Pfizer, Blackstone Life Sciences, and Invitae. Dr. Anderson receives sponsored research support from Bayer AG and Massachusetts General Hospital and has consulted for ApoPharma. Dr. Weng receives sponsored research support from IBM to the Broad Institute. Dr. Ho has received sponsored research support from Bayer AG and research supplies from EcoNugenics, Inc. Dr. Ellinor has received sponsored research support from Bayer AG and IBM Health, and he has consulted for Bayer AG, Novartis and MyoKardia. Dr. Batra, Dr. Reeder and Dr. Friedman have received sponsored research support from Bayer AG and IBM Health, and Dr. Batra has consulted for Novartis and Prometheus Biosciences.
References:
- 1.Weng LC, Choi SH, Klarin D, Smith JG, Loh PR, Chaffin M, Roselli C, Hulme OL, Lunetta KL, Dupuis J, et al. Heritability of Atrial Fibrillation. Circ Cardiovasc Genet. 2017. Dec;10(6):e001838. [DOI] [PMC free article] [PubMed] [Google Scholar]
- 2.Chugh SS, Havmoeller R, Narayanan K, Singh D, Rienstra M, Benjamin EJ, Gillum RF, Kim YH, McAnulty JH Jr, Zheng ZJ, et al. Worldwide epidemiology of atrial fibrillation: a Global Burden of Disease 2010 Study. Circulation. 2014. Feb 25;129(8):837–47. [DOI] [PMC free article] [PubMed] [Google Scholar]
- 3.Virani SS, Alonso A, Aparicio HJ, Benjamin EJ, Bittencourt MS, Callaway CW, Carson AP, Chamberlain AM, Cheng S, Delling FN, et al. Heart Disease and Stroke Statistics-2021 Update: A Report From the American Heart Association. Circulation. 2021. Feb 23;143(8):e254–e743. [DOI] [PubMed] [Google Scholar]
- 4.Attia ZI, Noseworthy PA, Lopez-Jimenez F, Asirvatham SJ, Deshmukh AJ, Gersh BJ, Carter RE, Yao X, Rabinstein AA, Erickson BJ, et al. An artificial intelligence-enabled ECG algorithm for the identification of patients with atrial fibrillation during sinus rhythm: a retrospective analysis of outcome prediction. Lancet. 2019. Sep 7;394(10201):861–867. [DOI] [PubMed] [Google Scholar]
- 5.Christopoulos G, Graff-Radford J, Lopez CL, Yao X, Attia ZI, Rabinstein AA, Petersen RC, Knopman DS, Mielke MM, Kremers W, et al. Artificial Intelligence-Electrocardiography to Predict Incident Atrial Fibrillation: A Population-Based Study. Circ Arrhythm Electrophysiol. 2020. Dec;13(12):e009355. [DOI] [PMC free article] [PubMed] [Google Scholar]
- 6.Raghunath S, Pfeifer JM, Ulloa-Cerna AE, Nemani A, Carbonati T, Jing L, vanMaanen DP, Hartzel DN, Ruhl JA, Lagerman BF, et al. Deep Neural Networks Can Predict New-Onset Atrial Fibrillation From the 12-Lead ECG and Help Identify Those at Risk of Atrial Fibrillation-Related Stroke. Circulation. 2021. Mar 30;143(13):1287–1298. [DOI] [PMC free article] [PubMed] [Google Scholar]
- 7.Khurshid S, Friedman S, Reeder C, Di Achille P, Diamant N, Singh P, Harrington LX, Wang X, Al-Alusi MA, Sarma G, et al. ECG-Based Deep Learning and Clinical Risk Factors to Predict Atrial Fibrillation. Circulation. 2022. Jan 11;145(2):122–133. [DOI] [PMC free article] [PubMed] [Google Scholar]
- 8.Alonso A, Krijthe BP, Aspelund T, Stepas KA, Pencina MJ, Moser CB, Sinner MF, Sotoodehnia N, Fontes JD, Janssens AC, et al. Simple risk model predicts incidence of atrial fibrillation in a racially and geographically diverse population: the CHARGE-AF consortium. J Am Heart Assoc. 2013. Mar 18;2(2):e000102. [DOI] [PMC free article] [PubMed] [Google Scholar]
- 9.Sudlow C, Gallacher J, Allen N, Beral V, Burton P, Danesh J, Downey P, Elliott P, Green J, Landray M, et al. UK biobank: an open access resource for identifying the causes of a wide range of complex diseases of middle and old age. PloS Med. 2015. Mar 31;12(3):e1001779. [DOI] [PMC free article] [PubMed] [Google Scholar]
- 10.Bycroft C, Freeman C, Petkova D, Band G, Elliott LT, Sharp K, Motyer A, Vukcevic D, Delaneau O, O'Connell J, Cortes A, et al. The UK Biobank resource with deep phenotyping and genomic data. Nature. 2018. Oct;562(7726):203–209. [DOI] [PMC free article] [PubMed] [Google Scholar]
- 11.Roselli C, Chaffin MD, Weng LC, Aeschbacher S, Ahlberg G, Albert CM, Almgren P, Alonso A, Anderson CD, Aragam KG, et al. Multi-ethnic genome-wide association study for atrial fibrillation. Nat Genet. 2018. Jun 11;50(9):1225–1233. [DOI] [PMC free article] [PubMed] [Google Scholar]
- 12.Christophersen IE, Rienstra M, Roselli C, Yin X, Geelhoed B, Barnard J, Lin H, Arking DE, Smith AV, Albert CM, et al. Large-scale analyses of common and rare variants identify 12 new loci associated with atrial fibrillation. Nat Genet. 2017. Jun;49(6):946–952. [DOI] [PMC free article] [PubMed] [Google Scholar]
- 13.Darbar D, Kannankeril PJ, Donahue BS, Kucera G, Stubblefield T, Haines JL, George AL Jr, Roden DM. Cardiac sodium channel (SCN5A) variants associated with atrial fibrillation. Circulation. 2008. Apr 15;117(15):1927–35. [DOI] [PMC free article] [PubMed] [Google Scholar]
- 14.Bulik-Sullivan BK, Loh PR, Finucane HK, Ripke S, Yang J; Schizophrenia Working Group of the Psychiatric Genomics Consortium; Patterson N, Daly MJ, Price AL, Neale BM. LD Score regression distinguishes confounding from polygenicity in genome-wide association studies. Nat Genet. 2015. Mar;47(3):291–5. [DOI] [PMC free article] [PubMed] [Google Scholar]
- 15.Hari KJ, Nguyen TP, Soliman EZ. Relationship between P-wave duration and the risk of atrial fibrillation. Expert Rev Cardiovasc Ther. 2018. Nov;16(11):837–843. [DOI] [PubMed] [Google Scholar]
- 16.Christophersen IE, Magnani JW, Yin X, Barnard J, Weng LC, Arking DE, Niemeijer MN, Lubitz SA, Avery CL, Duan Q, et al. Fifteen Genetic Loci Associated With the Electrocardiographic P Wave. Circ Cardiovasc Genet. 2017. Aug;10(4):e001667. [DOI] [PMC free article] [PubMed] [Google Scholar]
- 17.Weng LC, Hall AW, Choi SH, Jurgens SJ, Haessler J, Bihlmeyer NA, Grarup N, Lin H, Teumer A, Li-Gao R, et al. Genetic Determinants of Electrocardiographic P-Wave Duration and Relation to Atrial Fibrillation. Circ Genom Precis Med. 2020. Oct;13(5):387–395. [DOI] [PMC free article] [PubMed] [Google Scholar]
- 18.Lango Allen H, Estrada K, Lettre G, Berndt SI, Weedon MN, Rivadeneira F, Willer CJ, Jackson AU, Vedantam S, Raychaudhuri S, et al. Hundreds of variants clustered in genomic loci and biological pathways affect human height. Nature. 2010. Oct 14;467(7317):832–8. [DOI] [PMC free article] [PubMed] [Google Scholar]
- 19.Kichaev G, Bhatia G, Loh PR, Gazal S, Burch K, Freund MK, Schoech A, Pasaniuc B, Price AL. Leveraging Polygenic Functional Enrichment to Improve GWAS Power. Am J Hum Genet. 2019. Jan 3;104(1):65–75. [DOI] [PMC free article] [PubMed] [Google Scholar]
- 20.Rosenberg MA, Patton KK, Sotoodehnia N, Karas MG, Kizer JR, Zimetbaum PJ, Chang JD, Siscovick D, Gottdiener JS, Kronmal RA, et al. The impact of height on the risk of atrial fibrillation: the Cardiovascular Health Study. Eur Heart J. 2012. Nov;33(21):2709–17. [DOI] [PMC free article] [PubMed] [Google Scholar]
- 21.Levin MG, Judy R, Gill D, Vujkovic M, Verma SS, Bradford Y; Regeneron Genetics Center; Ritchie MD, Hyman MC, Nazarian S, et al. Genetics of height and risk of atrial fibrillation: A Mendelian randomization study. PloS Med. 2020. Oct 8;17(10):e1003288. [DOI] [PMC free article] [PubMed] [Google Scholar]
- 22.Li X, Patel KHK, Sun L, Peters NS, Ng FS. Neural networks applied to 12-lead electrocardiograms predict body mass index, visceral adiposity and concurrent cardiometabolic ill-health. Cardiovasc Digit Health J. 2021. Dec;2(6 Suppl):S1–S10. [DOI] [PMC free article] [PubMed] [Google Scholar]
- 23.Choi SH, Weng LC, Roselli C, Lin H, Haggerty CM, Shoemaker MB, Barnard J, Arking DE, Chasman DI, Albert CM, et al. DiscovEHR study and the NHLBI Trans-Omics for Precision Medicine (TOPMed) Consortium. Association Between Titin Loss-of-Function Variants and Early-Onset Atrial Fibrillation. JAMA. 2018. Dec 11;320(22):2354–2364. [DOI] [PMC free article] [PubMed] [Google Scholar]
- 24.Choi SH, Jurgens SJ, Weng LC, Pirruccello JP, Roselli C, Chaffin M, Lee CJ, Hall AW, Khera AV, Lunetta KL, et al. Monogenic and Polygenic Contributions to Atrial Fibrillation Risk: Results From a National Biobank. Circ Res. 2020. Jan 17;126(2):200–209. [DOI] [PMC free article] [PubMed] [Google Scholar]
- 25.Hinson JT, Chopra A, Nafissi N, Polacheck WJ, Benson CC, Swist S, Gorham J, Yang L, Schafer S, Sheng CC, et al. HEART DISEASE. Titin mutations in iPS cells define sarcomere insufficiency as a cause of dilated cardiomyopathy. Science. 2015. Aug 28;349(6251):982–6. [DOI] [PMC free article] [PubMed] [Google Scholar]
- 26.Nielsen JB, Thorolfsdottir RB, Fritsche LG, Zhou W, Skov MW, Graham SE, Herron TJ, McCarthy S, Schmidt EM, Sveinbjornsson G, et al. Biobank-driven genomic discovery yields new insight into atrial fibrillation biology. Nat Genet. 2018. Sep;50(9):1234–1239. [DOI] [PMC free article] [PubMed] [Google Scholar]
- 27.Tereshchenko LG, Sotoodehnia N, Sitlani CM, Ashar FN, Kabir M, Biggs ML, Morley MP, Waks JW, Soliman EZ, Buxton AE, et al. Genome-Wide Associations of Global Electrical Heterogeneity ECG Phenotype: The ARIC (Atherosclerosis Risk in Communities) Study and CHS (Cardiovascular Health Study). J Am Heart Assoc. 2018. Apr 5;7(8):e008160. [DOI] [PMC free article] [PubMed] [Google Scholar]
- 28.Olson TM, Michels VV, Ballew JD, Reyna SP, Karst ML, Herron KJ, Horton SC, Rodeheffer RJ, Anderson JL. Sodium channel mutations and susceptibility to heart failure and atrial fibrillation. JAMA. 2005. Jan 26;293(4):447–54. [DOI] [PMC free article] [PubMed] [Google Scholar]
- 29.Ellinor PT, Nam EG, Shea MA, Milan DJ, Ruskin JN, MacRae CA. Cardiac sodium channel mutation in atrial fibrillation. Heart Rhythm. 2008. Jan;5(1):99–105. [DOI] [PubMed] [Google Scholar]
- 30.Makiyama T, Akao M, Shizuta S, Doi T, Nishiyama K, Oka Y, Ohno S, Nishio Y, Tsuji K, Itoh H, et al. A novel SCN5A gain-of-function mutation M1875T associated with familial atrial fibrillation. J Am Coll Cardiol. 2008. Oct 14;52(16):1326–34. [DOI] [PubMed] [Google Scholar]
- 31.Maeda T, Chapman DL, Stewart AF. Mammalian vestigial-like 2, a cofactor of TEF-1 and MEF2 transcription factors that promotes skeletal muscle differentiation. J Biol Chem. 2002. Dec 13;277(50):48889–98. [DOI] [PubMed] [Google Scholar]
- 32.Lin X, Wei G, Shi Z, Dryer L, Esko JD, Wells DE, Matzuk MM. Disruption of gastrulation and heparan sulfate biosynthesis in EXT1-deficient mice. Dev Biol. 2000. Aug 15;224(2):299–311. [DOI] [PubMed] [Google Scholar]
- 33.Zhang R, Cao P, Yang Z, Wang Z, Wu JL, Chen Y, Pan Y. Heparan Sulfate Biosynthesis Enzyme, Ext1, Contributes to Outflow Tract Development of Mouse Heart via Modulation of FGF Signaling. PLoS One. 2015. Aug 21;10(8):e0136518. [DOI] [PMC free article] [PubMed] [Google Scholar]
- 34.Khurshid S, Reeder C, Harrington LX, Singh P, Sarma G, Friedman SF, Di Achille P, Diamant N, Cunningham JW, Turner AC, et al. Cohort design and natural language processing to reduce bias in electronic health records research. NPJ Digit Med. 2022. Apr 8;5(1):47. [DOI] [PMC free article] [PubMed] [Google Scholar]
- 35.Harrell FE Jr, Lee KL, Mark DB. Multivariable prognostic models: issues in developing models, evaluating assumptions and adequacy, and measuring and reducing errors. Stat Med. 1996. Feb 28;15(4):361–87. [DOI] [PubMed] [Google Scholar]
- 36.Alonso A, Roetker NS, Soliman EZ, Chen LY, Greenland P, Heckbert SR. Prediction of Atrial Fibrillation in a Racially Diverse Cohort: The Multi-Ethnic Study of Atherosclerosis (MESA). J Am Heart Assoc. 2016. Feb 23;5(2):e003077. [DOI] [PMC free article] [PubMed] [Google Scholar]
- 37.Pfister R, Brägelmann J, Michels G, Wareham NJ, Luben R, Khaw KT. Performance of the CHARGE-AF risk model for incident atrial fibrillation in the EPIC Norfolk cohort. Eur J Prev Cardiol. 2015. Jul;22(7):932–9. [DOI] [PubMed] [Google Scholar]
- 38.Khurshid S, Choi SH, Weng LC, Wang EY, Trinquart L, Benjamin EJ, Ellinor PT, Lubitz SA. Frequency of Cardiac Rhythm Abnormalities in a Half Million Adults. Circ Arrhythm Electrophysiol. 2018. Jul;11(7):e006273. [DOI] [PMC free article] [PubMed] [Google Scholar]
- 39.Galinsky KJ, Bhatia G, Loh PR, Georgiev S, Mukherjee S, Patterson NJ, Price AL. Fast Principal-Component Analysis Reveals Convergent Evolution of ADH1B in Europe and East Asia. Am J Hum Genet. 2016. Mar 3;98(3):456–472. [DOI] [PMC free article] [PubMed] [Google Scholar]
- 40.Mbatchou J, Barnard L, Backman J, Marcketta A, Kosmicki JA, Ziyatdinov A, Benner C, O'Dushlaine C, Barber M, Boutkov B, et al. Computationally efficient whole-genome regression for quantitative and binary traits. Nat Genet. 2021. Jul;53(7):1097–1103. [DOI] [PubMed] [Google Scholar]
- 41.Yang J, Ferreira T, Morris AP, Medland SE; Genetic Investigation of ANthropometric Traits (GIANT) Consortium; DIAbetes Genetics Replication And Meta-analysis (DIAGRAM) Consortium; Madden PA, Heath AC, Martin NG, Montgomery GW, et al. Conditional and joint multiple-SNP analysis of GWAS summary statistics identifies additional variants influencing complex traits. Nat Genet. 2012. Mar 18;44(4):369–75, S1–3. [DOI] [PMC free article] [PubMed] [Google Scholar]
- 42.He L, Kulminski AM. Fast Algorithms for Conducting Large-Scale GWAS of Age-at-Onset Traits Using Cox Mixed-Effects Models. Genetics. 2020. May;215(1):41–58. [DOI] [PMC free article] [PubMed] [Google Scholar]
- 43.Loh PR, Bhatia G, Gusev A, Finucane HK, Bulik-Sullivan BK, Pollack SJ; Schizophrenia Working Group of Psychiatric Genomics Consortium; de Candia TR, Lee SH, Wray NR, et al. Contrasting genetic architectures of schizophrenia and other complex diseases using fast variance-components analysis. Nat Genet. 2015. Dec;47(12):1385–92. [DOI] [PMC free article] [PubMed] [Google Scholar]
- 44.Lee SH, Yang J, Goddard ME, Visscher PM, Wray NR. Estimation of pleiotropy between complex diseases using single-nucleotide polymorphism-derived genomic relationships and restricted maximum likelihood. Bioinformatics. 2012. Oct 1;28(19):2540–2. [DOI] [PMC free article] [PubMed] [Google Scholar]
- 45.Ge T, Chen CY, Ni Y, Feng YA, Smoller JW. Polygenic prediction via Bayesian regression and continuous shrinkage priors. Nat Commun. 2019. Apr 16;10(1):1776. [DOI] [PMC free article] [PubMed] [Google Scholar]
- 46.Davey Smith G, Hemani G. Mendelian randomization: genetic anchors for causal inference in epidemiological studies. Hum Mol Genet. 2014. Sep 15;23(R1):R89–98. [DOI] [PMC free article] [PubMed] [Google Scholar]
- 47.Hemani G, Zheng J, Elsworth B, Wade KH, Haberland V, Baird D, Laurin C, Burgess S, Bowden J, Langdon R, et al. The MR-Base platform supports systematic causal inference across the human phenome. Elife. 2018. May 30;7:e34408. [DOI] [PMC free article] [PubMed] [Google Scholar]
- 48.Wood AR, Esko T, Yang J, Vedantam S, Pers TH, Gustafsson S, Chu AY, Estrada K, Luan J, Kutalik Z, et al. Defining the role of common variation in the genomic and biological architecture of adult human height. Nat Genet. 2014. Nov;46(11):1173–86. [DOI] [PMC free article] [PubMed] [Google Scholar]
- 49.Bowden J, Davey Smith G, Burgess S. Mendelian randomization with invalid instruments: effect estimation and bias detection through Egger regression. Int J Epidemiol. 2015. Apr;44(2):512–25. [DOI] [PMC free article] [PubMed] [Google Scholar]
- 50.Verbanck M, Chen CY, Neale B, Do R. Detection of widespread horizontal pleiotropy in causal relationships inferred from Mendelian randomization between complex traits and diseases. Nat Genet. 2018. May;50(5):693–698. [DOI] [PMC free article] [PubMed] [Google Scholar]
- 51.Barbeira AN, Pividori M, Zheng J, Wheeler HE, Nicolae DL, Im HK. Integrating predicted transcriptome from multiple tissues improves association detection. PLoS Genet. 2019. Jan 22;15(1):e1007889. [DOI] [PMC free article] [PubMed] [Google Scholar]
- 52.GTEx Consortium. The GTEx Consortium atlas of genetic regulatory effects across human tissues. Science. 2020. Sep 11;369(6509):1318–1330. [DOI] [PMC free article] [PubMed] [Google Scholar]
Associated Data
This section collects any data citations, data availability statements, or supplementary materials included in this article.


