

SUMMARY
The circadian clock protein BMAL1 modulates glial activation and amyloid-beta deposition in mice. However, the effects of BMAL1 on other aspects of neurodegenerative pathology are unknown. Here, we show that global post-natal deletion of Bmal1 in mouse tauopathy or alpha-synucleinopathy models unexpectedly suppresses both tau and alpha-synuclein aggregation and related pathology. Astrocyte-specific Bmal1 deletion is sufficient to prevent both alpha-synuclein and tau pathology in vivo, and induces astrocyte activation and expression of Bag3, a chaperone critical for macroautophagy. Astrocyte Bmal1 deletion enhances phagocytosis of alpha-synuclein and tau in a Bag3-dependent manner, and astrocyte Bag3 overexpression is sufficient to mitigate alpha-synuclein spreading in vivo. In humans, BAG3 is increased in patients with AD, and is highly expressed in disease-associated astrocytes. Our results suggest that early activation of astrocytes via Bmal1 deletion induces Bag3 to protect against tau and alpha-synuclein pathologies, providing new insights into astrocyte-specific therapies for neurodegeneration.
Keywords: BMAL1, astrocytes, circadian, Alzheimer Disease, tau, Parkinson Disease, alpha-synuclein, neuroinflammation, BAG3
eTOC Blurb
Sheehan, Nadarajah, et al. show that deletion of the circadian clock gene Bmal1 in astrocytes protects against tau and alpha-synuclein pathology by triggering a unique astrocyte activation profile marked by increased BAG3 expression. Astrocyte BAG3 expression was itself protective and upregulated in disease-associated astrocytes in human Alzheimer’s Disease.
INTRODUCTION
Astrocytes, the most abundant glial cells in the brain, have long been implicated in the pathogenesis of age-related neurodegenerative conditions such as Alzheimer’s Disease (AD)1,2. Reactive astrocytes are ubiquitous hallmarks of neurodegenerative diseases, though the exact roles of reactive astrocytes in regulating toxic protein aggregation, neuroinflammation, and neurodegeneration are highly complex2. Previous work from our group has identified the core circadian transcription factor BMAL1 (aka ARNTL) as a potent regulator of astrocyte activation3,4. Global deletion of Bmal1 renders mice behaviorally and transcriptionally arrhythmic5 and also alters the expression of many non-rhythmic genes, driving distinct transcriptional changes in different brain cell types6. Among the most striking phenotypes observed following Bmal1 deletion in mice is astrocyte activation, which is characterized by increased expression of glial fibrillary acidic protein (GFAP), is cell-autonomous, and is associated with a unique transcriptional profile3,4,7. Functionally, global post-natal deletion of Bmal1 in the APP/PS1–21 mouse model of AD exacerbates extracellular β-amyloid plaque formation8, while astrocyte-specific Bmal1 deletion had no impact on plaque accumulation in this model7. However, the cell type-specific effects of Bmal1 disruption on other aspects of neurodegenerative neuropathology remain unexplored.
Although β-amyloid accumulates in plaques in the extracellular space9, other neurodegenerative disease-associated proteins, including tau and alpha-synuclein (αSyn), aggregate within neurons and exhibit spreading to neighboring cells, including trans-synaptic propagation to other neurons10. Previous studies have suggested that glia can interact with protein aggregates in the extracellular space11. Tau aggregation is a hallmark of AD and several other neurodegenerative diseases termed “tauopathies”. αSyn pathology defines Parkinson Disease (PD) and related “synucleinopathies” including Dementia with Lewy Bodies and Multiple Systems Atrophy, and is also present in nearly half of AD cases12. Notably, a recent study identified BMAL1 as one of the top upstream transcription factors driving astrocyte responses to tauopathy and amyloid plaques in mice, suggesting that, in addition to its role in the circadian clock, BMAL1 could modulate astrocyte responses to neurodegenerative pathology13. However, it is unknown if manipulation of BMAL1 can influence tau or αSyn pathology.
Here, we explored the effects of Bmal1 deletion on pathology caused by tau and αSyn, both of which exhibit intracellular aggregation. Unexpectedly, we discovered that global Bmal1 deletion was protective against both tau and α-synuclein aggregation and consequent microglial activation. We find that this protective effect is driven by BMAL1-mediated astrocyte activation and expression of BAG3, a macroautophagy chaperone. Astrocyte BAG3 overexpression was itself protective against pathology, and BAG3 was highly expressed specifically in a subset of disease-associated activated astrocytes from human AD brain samples. Our findings demonstrate that early astrocyte activation can mitigate tau and αSyn pathology in vivo and show that loss of BMAL1 induces a protective astrocyte activation state.
RESULTS
Global Bmal1 deletion prevents tau aggregation in P301S mice.
We employed a tamoxifen-inducible global Bmal1 KO mouse which exhibits circadian arrhythmicity but avoids developmental confounds related to germline Bmal1 deletion8,14. We crossed this mouse to the widely used P301S PS19 model of tauopathy15 to generate four mouse genotypes: CAG-CreERT2 -; Bmal1f/f; P301S- (termed CTRL), CAG-CreERT2 +;Bmal1f/f;P301S- (termed gKO for global Bmal1 KO), CAG-CreERT2 -; Bmal1f/f;P301S+ (termed P301S), and CAG-CreERT2 +; Bmal1f/f;P301S+ (termed gKO;P301S). We administered tamoxifen to delete Bmal1 at two months of age (3–5 months before the onset of tau pathology), then harvested mice for pathology at eight months of age, when P301S+ mice typically exhibit moderate tau pathology (Fig. 1a). We used only male P301S mice because they develop pathology earlier and more consistently than females. As we have demonstrated previously4,14, post-natal deletion of Bmal1 triggered significant astrogliosis, assessed using GFAP immunohistochemistry (IHC) (Fig. 1b). We also confirmed suppression of several known Bmal1 transcriptional targets in cortex from gKO and gKO;P301S mice (Supplemental Fig. 1a). Phosphorylated tau (p-ser202, p-thr205) pathology assessed by AT8 immunohistochemistry showed a large increase in P301S mice compared to CTRL (Supplemental Figure 1b), but no significant difference between P301S and gKO;P301S mice in either the hippocampus (Supplemental Figure 1b) or piriform cortex (Fig. 1c), two regions that readily accumulate tau pathology in this model15. We next examined levels of soluble and insoluble tau by ELISA in cortical tissue subjected to sequential detergent extraction. Similar to the AT8 immunostaining, tau levels were not significantly different between P301S and gKO;P301S mice in the more soluble RAB and RIPA fractions. However, there was significantly less insoluble tau (70% formic acid fraction) in gKO;P301S mice compared to P301S, suggesting that highly insoluble tau species were decreased by deletion of Bmal1 (Fig. 1d). Accordingly, misfolded, paired helical filament tau was quantified by IHC using the antibody MC116 and was also markedly reduced in gKO;P301S mice (Fig. 1e). We also observed a decrease in Thioflavin S+ tau aggregates in the gKO;P301S brain compared to P301S mice, suggesting a reduction in insoluble β-pleated sheet-containing aggregates (Fig. 1f). We further classified AT8 immunohistochemistry as fitting into one of four patterns of increasing severity in the hippocampus17. Again, gKO;P301S mice had substantially less of the severe “type 4” staining than P301S mice (Supplemental Figure 1c). These data demonstrate that global deletion of Bmal1 reduced aggregated, insoluble tau pathology without altering total tau or soluble tau levels.
Figure 1: Global Bmal1 deletion mitigates tau pathology.
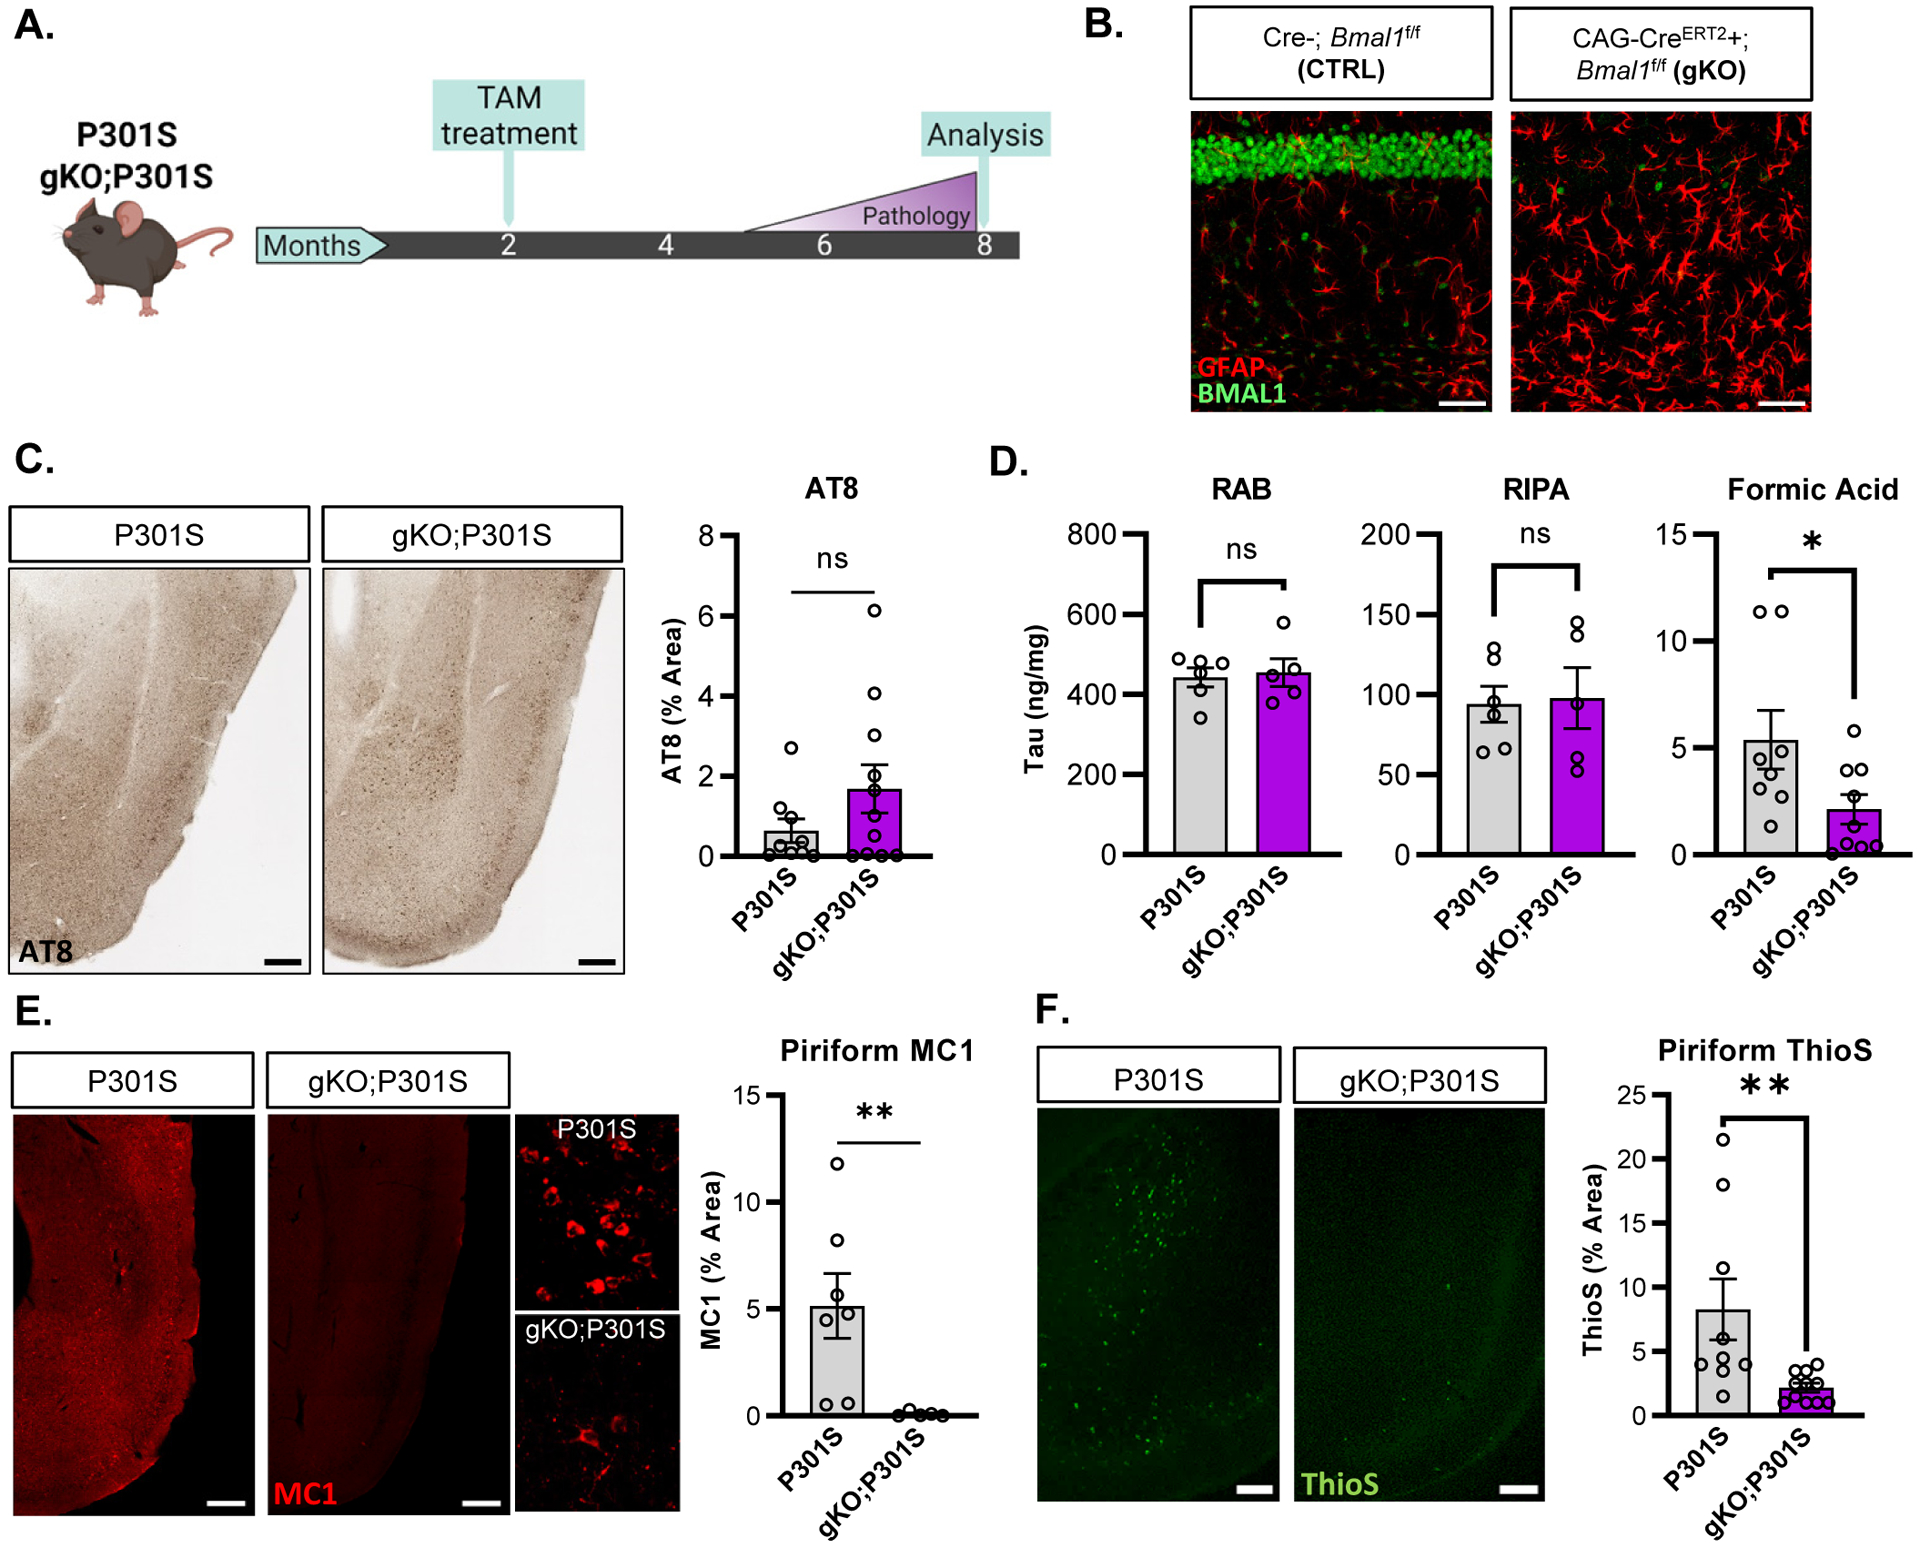
(A) Representative images of hippocampal CA1 from CTRL (Cre-) and gKO (CAG-CreERT2+) mice stained for GFAP (red) and BMAL1 (green). (B) Schematic of the experimental paradigm used for global Bmal1 deletion in P301S mice. (C) Representative images and quantification of AT8 staining in piriform cortex region of P301S and gKO;P301S mice. N = 8–11 mice per group. (D) Quantification of fractionated tau between RAB (soluble tau), RIPA (slightly insoluble tau) and 70% formic acid (insoluble/aggregated tau) cortical fractions. N = 6–9 mice per group. (E) Representative images of MC1 immunoreactivity with quantification in the piriform cortex of P301S (left) and gKO;P301S mice (right). N = 6–7 mice per group. Inset shows higher magnification view. (E) Thioflavin-S staining/quantification of piriform cortex in P301S and gKO;P301S mice. All graphs in all Figures show mean±SEM unless otherwise noted. N = 9–11 mice per group. *p<0.05 or **p<0.01 by unpaired 2-tailed T-test (C,D) or Mann-Whitney test (E, F). Scale bars= 50μm (A), 200μm (C,E,F) or 20μm (E-inset).
Global Bmal1 deletion mitigates microglial activation in P301S mice
Aggregated tau pathology is associated with pronounced microglia and astrocyte activation in P301S mice17. Thus, we examined a panel of transcripts associated with neuroinflammation and microglial activation in cortex tissue from CTRL, gKO, P301S, and gKO;P301S mice. P301S mice exhibited marked upregulation of all neuroinflammatory markers tested, including disease-associated microglia (DAM) markers Spp1, Trem2, Tyrobp, Clec7a, and Apoe18. Expression of all neuroinflammatory markers was attenuated in gKO;P301S compared to P301S mice (Fig. 2a). PCA plots of inflammatory gene expression showed minimal overlap between P301S mice and each of the other genotypes (Supplemental Fig. 2a), further indicating decreased inflammation in gKO;P301S mice. We quantified microglial branching morphology in the hippocampus and found that microglia in P301S mice had fewer branches per cell than gKO;P301S mice, indicating an activated microglia phenotype (Fig. 2b). CD68, a marker of microglial phagocytic activation19, was increased in Iba1+ microglia in hippocampus of P301S mice but was largely absent in gKO;P301S mice, further demonstrating that Bmal1 deletion attenuated or prevented microglial activation (Fig. 2c, Supplemental Fig. 2b).
Figure 2: Global Bmal1 deletion in P301S mice induces chronic astrogliosis and prevents microglial activation.
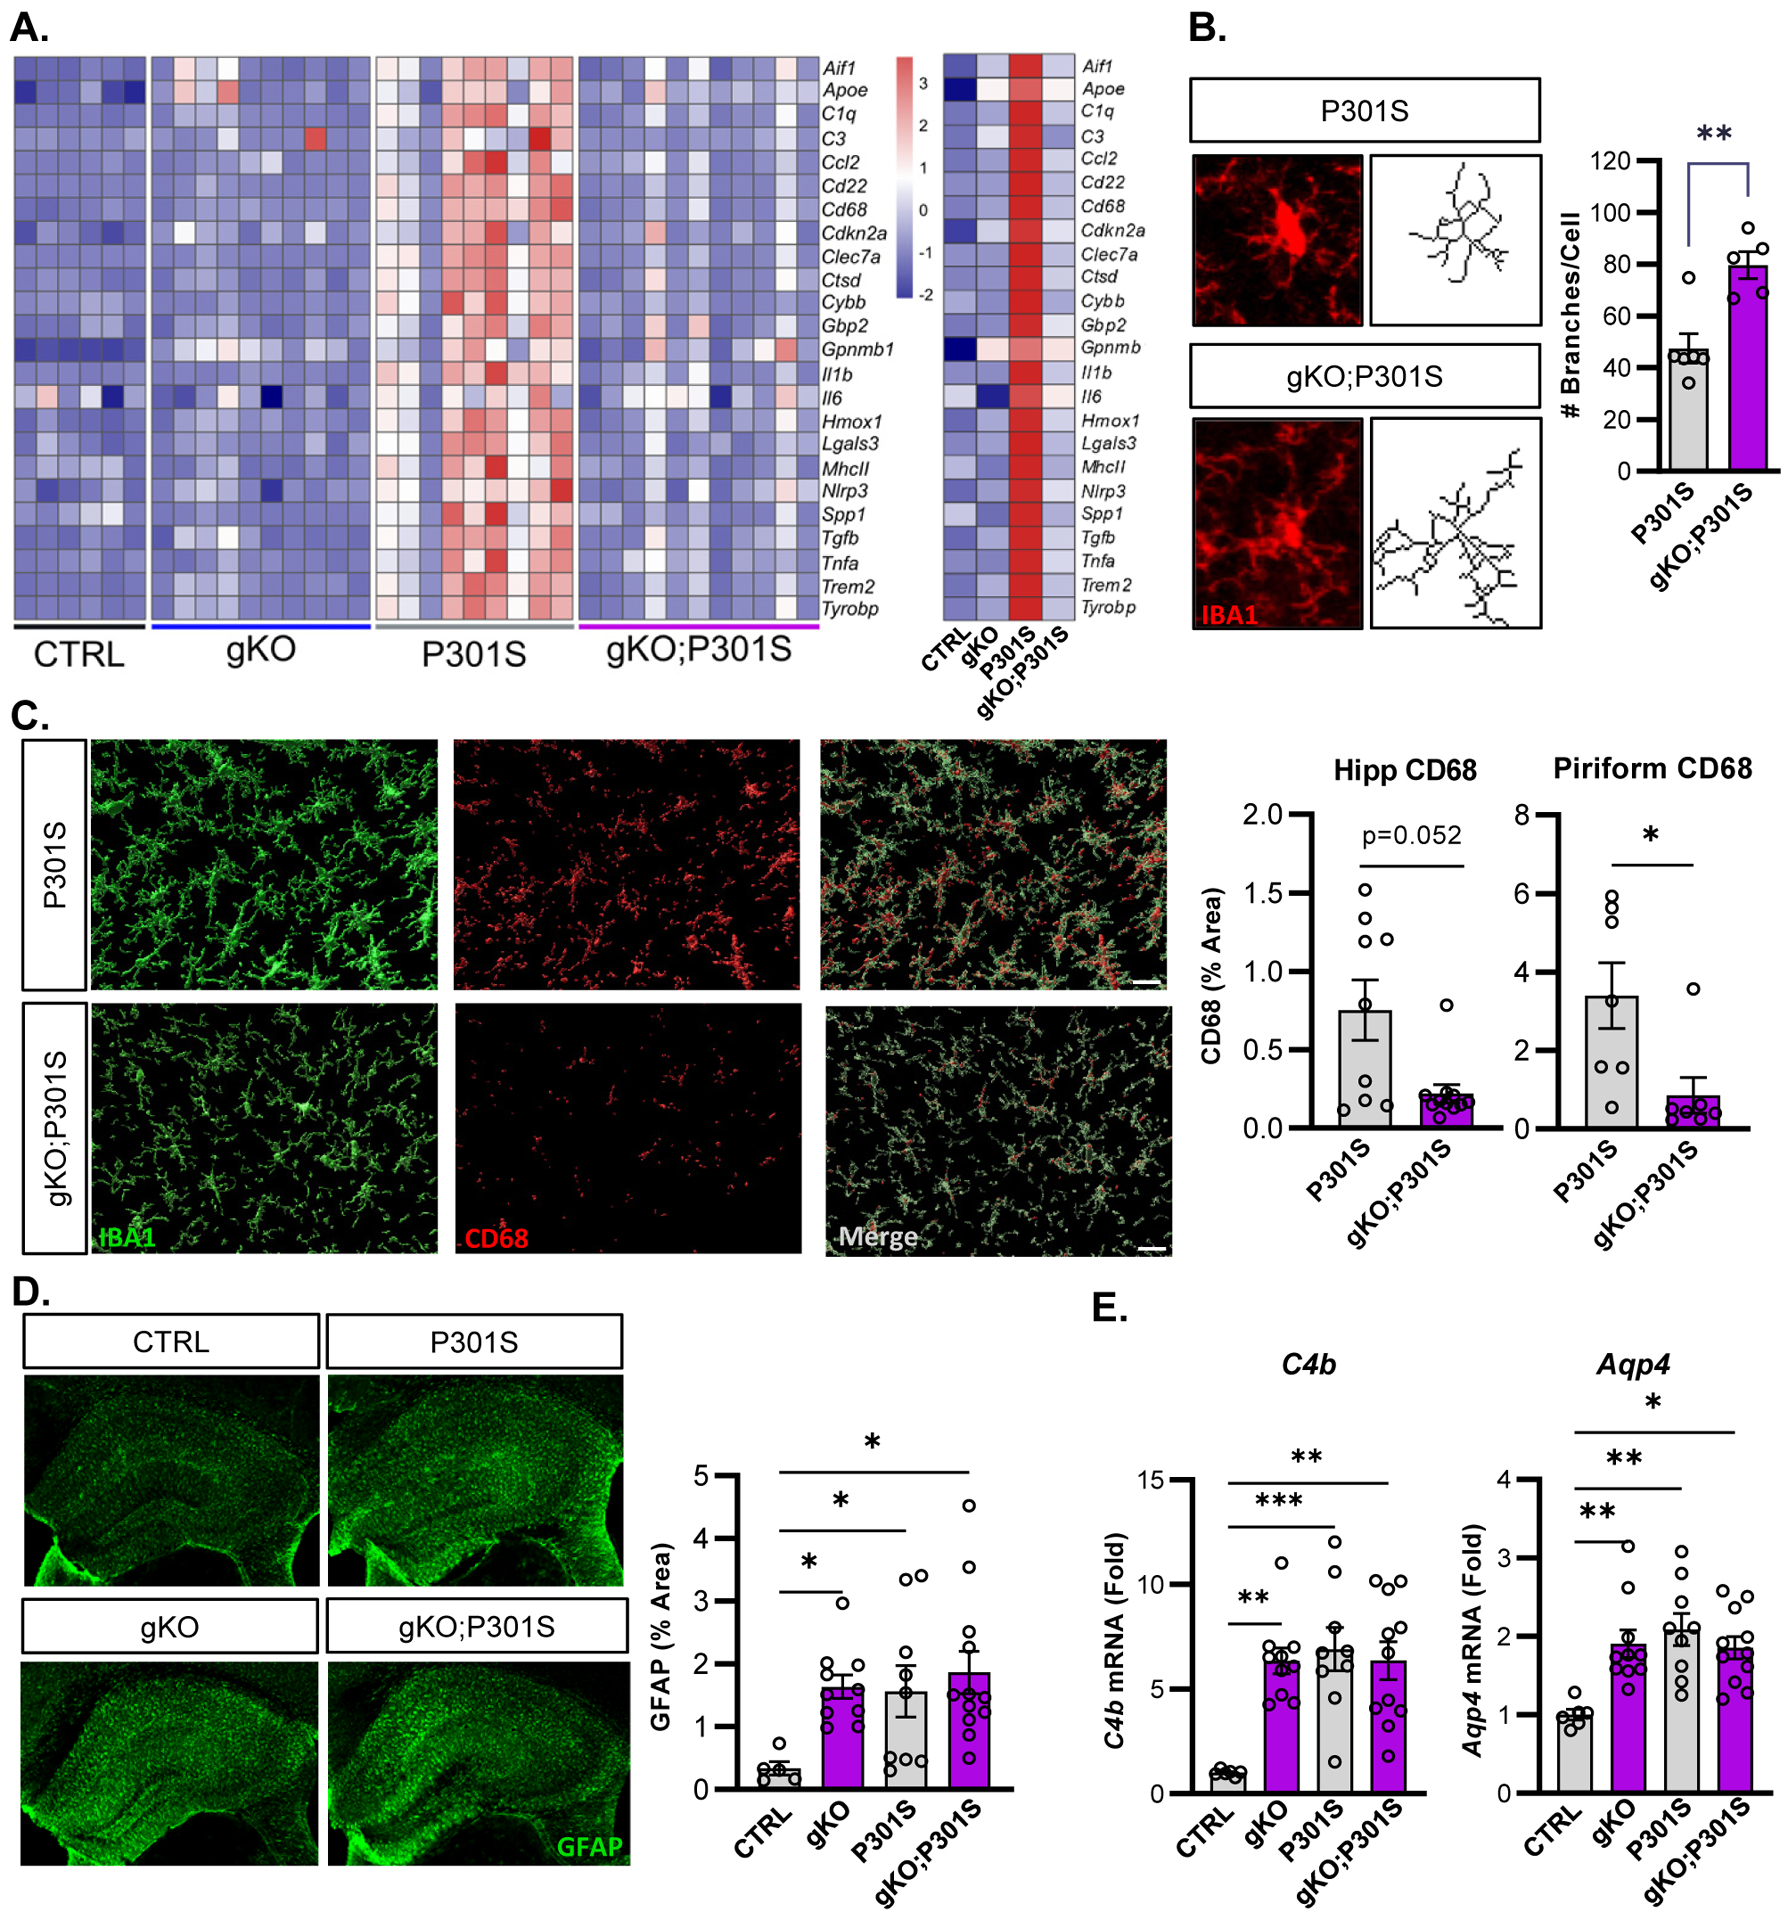
(A) Transcriptional analysis of inflammatory transcripts related to microglial activation in bulk cortex tissue from all four mouse genotypes. N = 6–11 mice per genotype. Averages for each genotype shown on right. (B) Representative Iba1 images and skeletonized microglia from hippocampus and quantification of branching. N = 5–6 mice per genotype with 6–9 microglia quantified per mouse. (C) Representative confocal images and quantification of CD68 immunoreactivity in the hippocampus and piriform cortex of P301S (top) and gKO;P301S mice (bottom). N = 9–11 mice per group. (D) Representative images of hippocampal GFAP immunoreactivity and quantification. (E) qPCR analysis of astrogliosis-related transcripts C4b and Aqp4 across genotypes. N=5–12 mice per group. *p<0.05, **p<0.01, ***p<0.005 by 2-tailed T-test (B), Mann-Whitney U test (C) or one-way ANOVA (D,E). Scale bars = 10μm (B), 20μm (C), or 500μm (D).
Male P301S mice develop brain atrophy in parallel with tau pathology17. We observed no difference between P301S and gKO;P301S mice in thickness of the hippocampal CA1 and hippocampal granule layers, despite clear differences in aggregated tau and microgliosis (Supplemental Fig. 2c). This may suggest that the detrimental effects of neuronal Bmal1 deletion on neuronal health3 may offset the potential protective effects of mitigating tau pathology.
Finally, we assessed astrocyte activation by immunostaining for GFAP and found that unlike microgliosis, GFAP expression was increased in gKO mice to a similar high degree as in P301S or gKO;P301S mice, as astrogliosis induced by Bmal1 deletion alone reaches a ceiling effect and is not further exacerbated by tau pathology (Fig. 2D). Other astrocyte activation transcripts, Aqp4 and C4b, also showed this pattern (Fig. 2E). These data show that Bmal1 deletion drives astrogliosis early in the disease course in this model, and suggest that astrocyte activation may play a role in mitigating tau aggregation and subsequent microglial activation in gKO;P301S mice.
Global deletion of Bmal1 suppresses α-synuclein spreading pathology and microgliosis
We next decided to test the effect of Bmal1 deletion in an alpha-synuclein preformed fibril (αSyn PFF) model, in which αSyn PFFs are injected into the striatum, causing seeding and spreading of endogenous mouse α-synuclein pathology20,21. As before, we used the same CTRL and gKO mice as before, and tamoxifen was administered at two months of age, followed by a unilateral intrastriatal injection of αSyn PFFs one month later (Fig. 3a). As expect, gKO mice develop substantial astrogliosis one month post-tamoxifen, prior to PFF injection (Fig. 3b). We examined the burden of aggregated, phosphorylated (Ser129) α-synuclein (pSyn) in these mice three months after PFF injection and observed a reduction in pSyn pathology in the striatum and somatosensory cortex in gKO compared to control animals, similar to the reduction seen in the tau model (Fig. 3c). Astrogliosis was minimal in the ipsilateral cortex and striatum of CTRL mice injected with PFFs but was significantly increased as expected in gKO mice as a direct effect of Bmal1 deletion (Fig. 3d). Microglial activation, as assessed by Iba1/CD68 co-staining in cortex (Fig. 3e) and by microglial branching analysis in striatum (Fig. 3f) was significantly decreased in the cortex of PFF-injected gKO mice as compared to PFF-injected CTRL mice.
Figure 3: Global Bmal1 deletion suppresses α-synuclein pathology and prevents microglia activation.
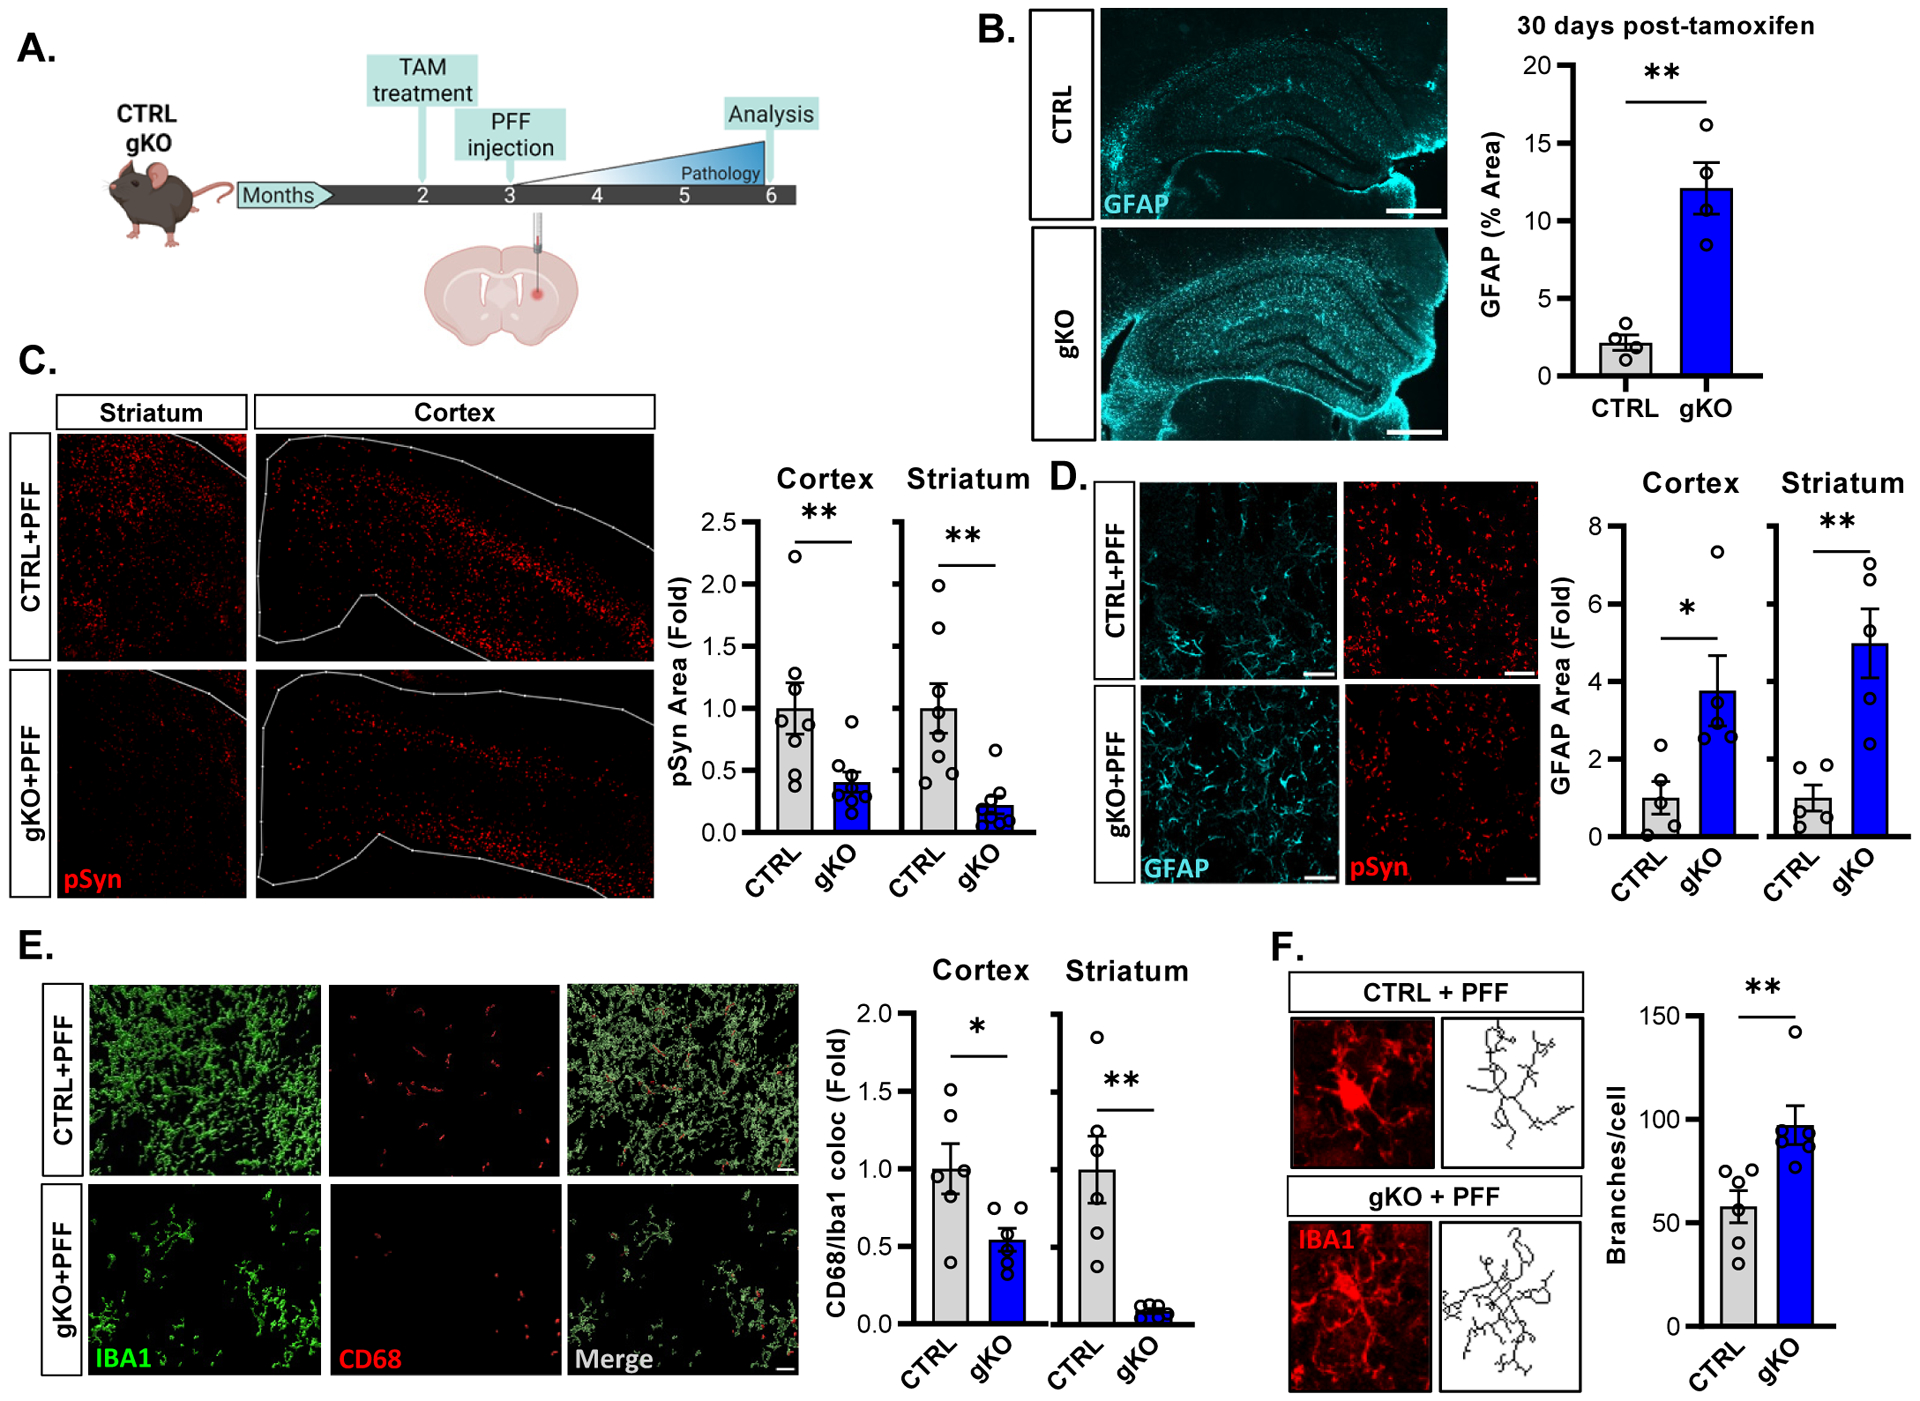
(A) Schematic of the experimental paradigm showing intra-striatal injection of α-Syn PFFs one month post-tamoxifen administration. (B) Representative images and quantification of astrogliosis one month after tamoxifen administration in CTRL (top) and gKO (bottom) mice. N=4 mice per group. (C) Representative images and quantification of phosphorylated αSyn (pSyn) pathology in CTRL and gKO mice at 6mo., N = 8 mice per group. (D) Representative images and quantification of pSyn (red) and GFAP (cyan) immunoreactivity in mice from C. N = 5 mice per group. (E) 3D reconstruction of confocal images of IBA1 (green) and CD68 (red) staining, with quantification of Iba1/CD68 colocalization, in mice from C. N = 6 mice per group. (F) Representative microglial Iba1 images and branching analysis with quantification in cortex from mice from C. N = 6 mice per group, n = 4–7 microglia per mouse. *p<0.05, **p<0.01 by 2-tailed T-test (B,D,E-ctx,F) or Mann-Whitney U test (C,E-str). Scale bars = 500μm (B), 200μm (C-str) or 500μm (C-ctx), 50μm (D), 20μm (E), or 10μm (F).
Behavioral deficits in this model are minimal at the three-month time point but are generally related to pathology in the substantia nigra pars compacta (SNpc) (Luk et al., 2012). We performed a pole descending test in PBS- or αSyn PFF-injected CRTL and gKO mice 80 days post-PFF injection, and observed no effect of either PFF injection or genotype on this test (Supplemental Fig. 2d). Notably, we observed no difference in pSyn pathology in the SNpc between CTRL and gKO mice after PFF injection at this time point (Supplemental Fig. 2e), which is congruent with the lack of behavioral phenotype. Despite the lack of changes in SNpc pathology or motor behavior, our pathology data show that global Bmal1 deletion mitigated αSyn pathology and attenuated microglial activation, similar to P301S mice.
Astrocyte-specific deletion of Bmal1 prevents both α-synuclein and tau pathologies
We previousy showed that Bmal1 deletion drives cell-autonomous astrocyte activation4, suggesting that astrocyte activation might underlie the protective effects of global Bmal1 deletion in tau and αSyn models. To test this, we used an inducible, astrocyte-specific Aldh1l1-CreERT2 mouse line22 to generate astrocyte-specific Bmal1 KO mice (Aldh1l1-CreERT2 +; Bmalf/f; termed aKO), which we have previously characterized4,7. Bmal1 aKO mice showed striking astrocyte activation after tamoxifen treatment with sparing of neuronal BMAL1 expression (Fig. 4a). We crossed aKO mice to the P301S PS19 line, generating P301S (Cre-;Bmal1f/f;P301S+) and aKO;P301S (Aldh1l1-CreERT2+;Bmal1f/f;P301S+) mice. Cre-;Bmalf/f littermate control mice were again termed CTRL. We treated mice with tamoxifen at two months of age and harvested this time at 9mo to analyze pathology (Fig. 4b). Similar to gKO mice, there was no difference between P301S and aKO;P301S mice in total phosphorylated tau as assessed with AT8 (Fig. 4c). However, MC1 immunostaining for aggregated tau demonstrated a significant decrease in tau pathology in the hippocampus and piriform cortex of aKO;P301S mice, suggesting that astrocytic Bmal1 deletion is sufficient to reduce tau pathology (Fig. 4c). While AT8 and MC1 staining was detectable, it is notable that this cohort of mice developed substantially less aggregated tau pathology and neuroinflammation than the cohort in Fig. 1, perhaps due to genetic drift in the colony. To this point, we observed no significant differences in microglial activation/DAM transcripts in aKO mice at baseline, as well as no significant increase in P301S or aKO;P301S as compared to CTRL in this cohort, (Supplemental Fig. 3a,b) . We observed no difference in total hippocampal NeuN area, consistent with a lack of gross neurodegeneration in this cohort. However, the thickness of the neuronal (NeuN+) layer of either the dentate gyrus granule cells or CA1 was significantly increased in aKO;P301S mice as compared to P301S, suggesting a neuroprotective effect (Fig. 4d). Together, these results show that astrocyte-specific Bmal1 deletion can reduce aggregated tau pathology in P301S, and can also prevent downstream neurodegeneration.
Figure 4: Astrocyte-specific Bmal1 deletion is sufficient to induce astrogliosis and prevent tau pathology in P301S mice.
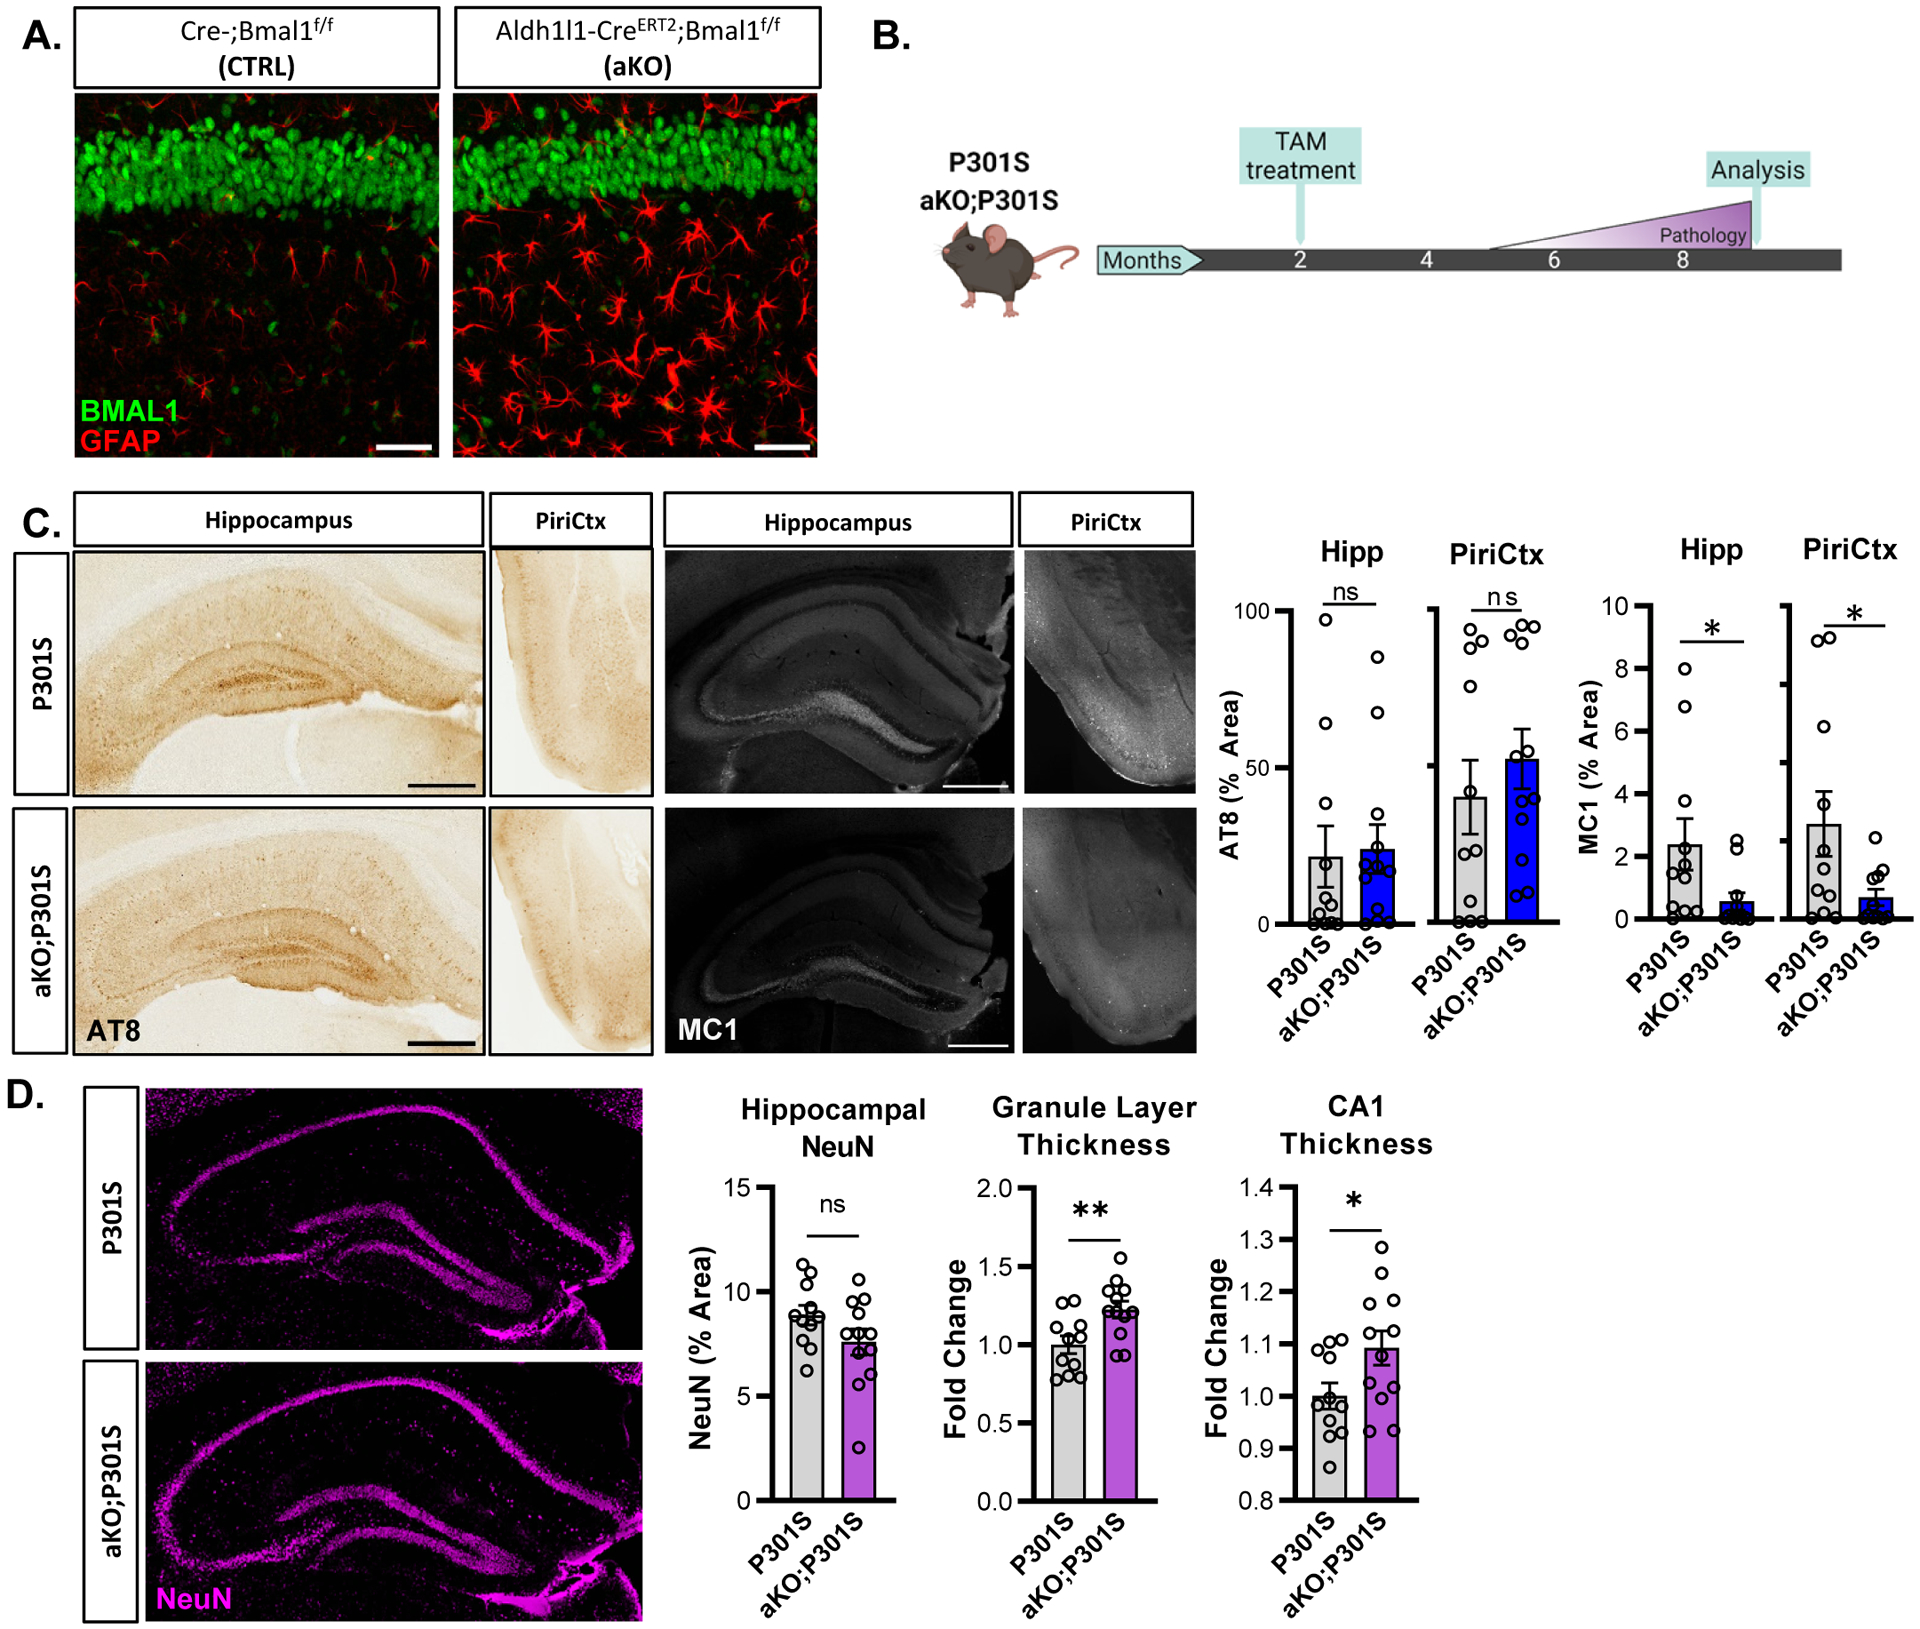
(A) Representative images of GFAP (red) and BMAL1 (green) from WT and aKO mice, CA1 region, 4 months after tamoxifen. (B) Experimental paradigm used in the tauopathy model with P301S and aKO;P301S mice. (C) Representative images and quantification of AT8 and MC1 in P301S and aKO;P301S mouse hippocampus and piriform cortex. N = 11–12 mice per group, 9 months old. (D) Hippocampal NeuN staining in P301S and aKO;P301S mice from C. with quantification of total % area and thickness of dentate gyrus granule and CA1 neuronal cell layers. *p<0.05, **p<0.01, by 2-tailed T-test (C-AT8, D) or Mann-Whitney U test (C-MC1). Scale bars = 500μm.
To determine whether astrocytic Bmal1 deletion was also sufficient to mitigate αSyn pathology, we injected α-syn PFFs in CTRL and aKO mice using the same methods and timing as previously described (Fig. 5a). We focused on cortical regions (somatosensory and piriform) in these and subsequent experiments cortex as pathology in these areas requires spreading from the striatal injection region. Astrocytic Bmal1 deletion recapitulated the phenotype observed in the global BMAL1 gKO mice, with aKO mice showing increased astrogliosis but reduced phospho-synuclein pathology across multiple brain regions, as compared to PFF-injected CRTL mice (Fig. 5a,b). As in the gKO cohort, no effect on pole descending behavior was noted (Supplemental Fig. 3c).
Figure 5: Astrocyte-specific Bmal1 deletion prior to, but not after, α-synuclein PFF injection is sufficient to prevent spreading.
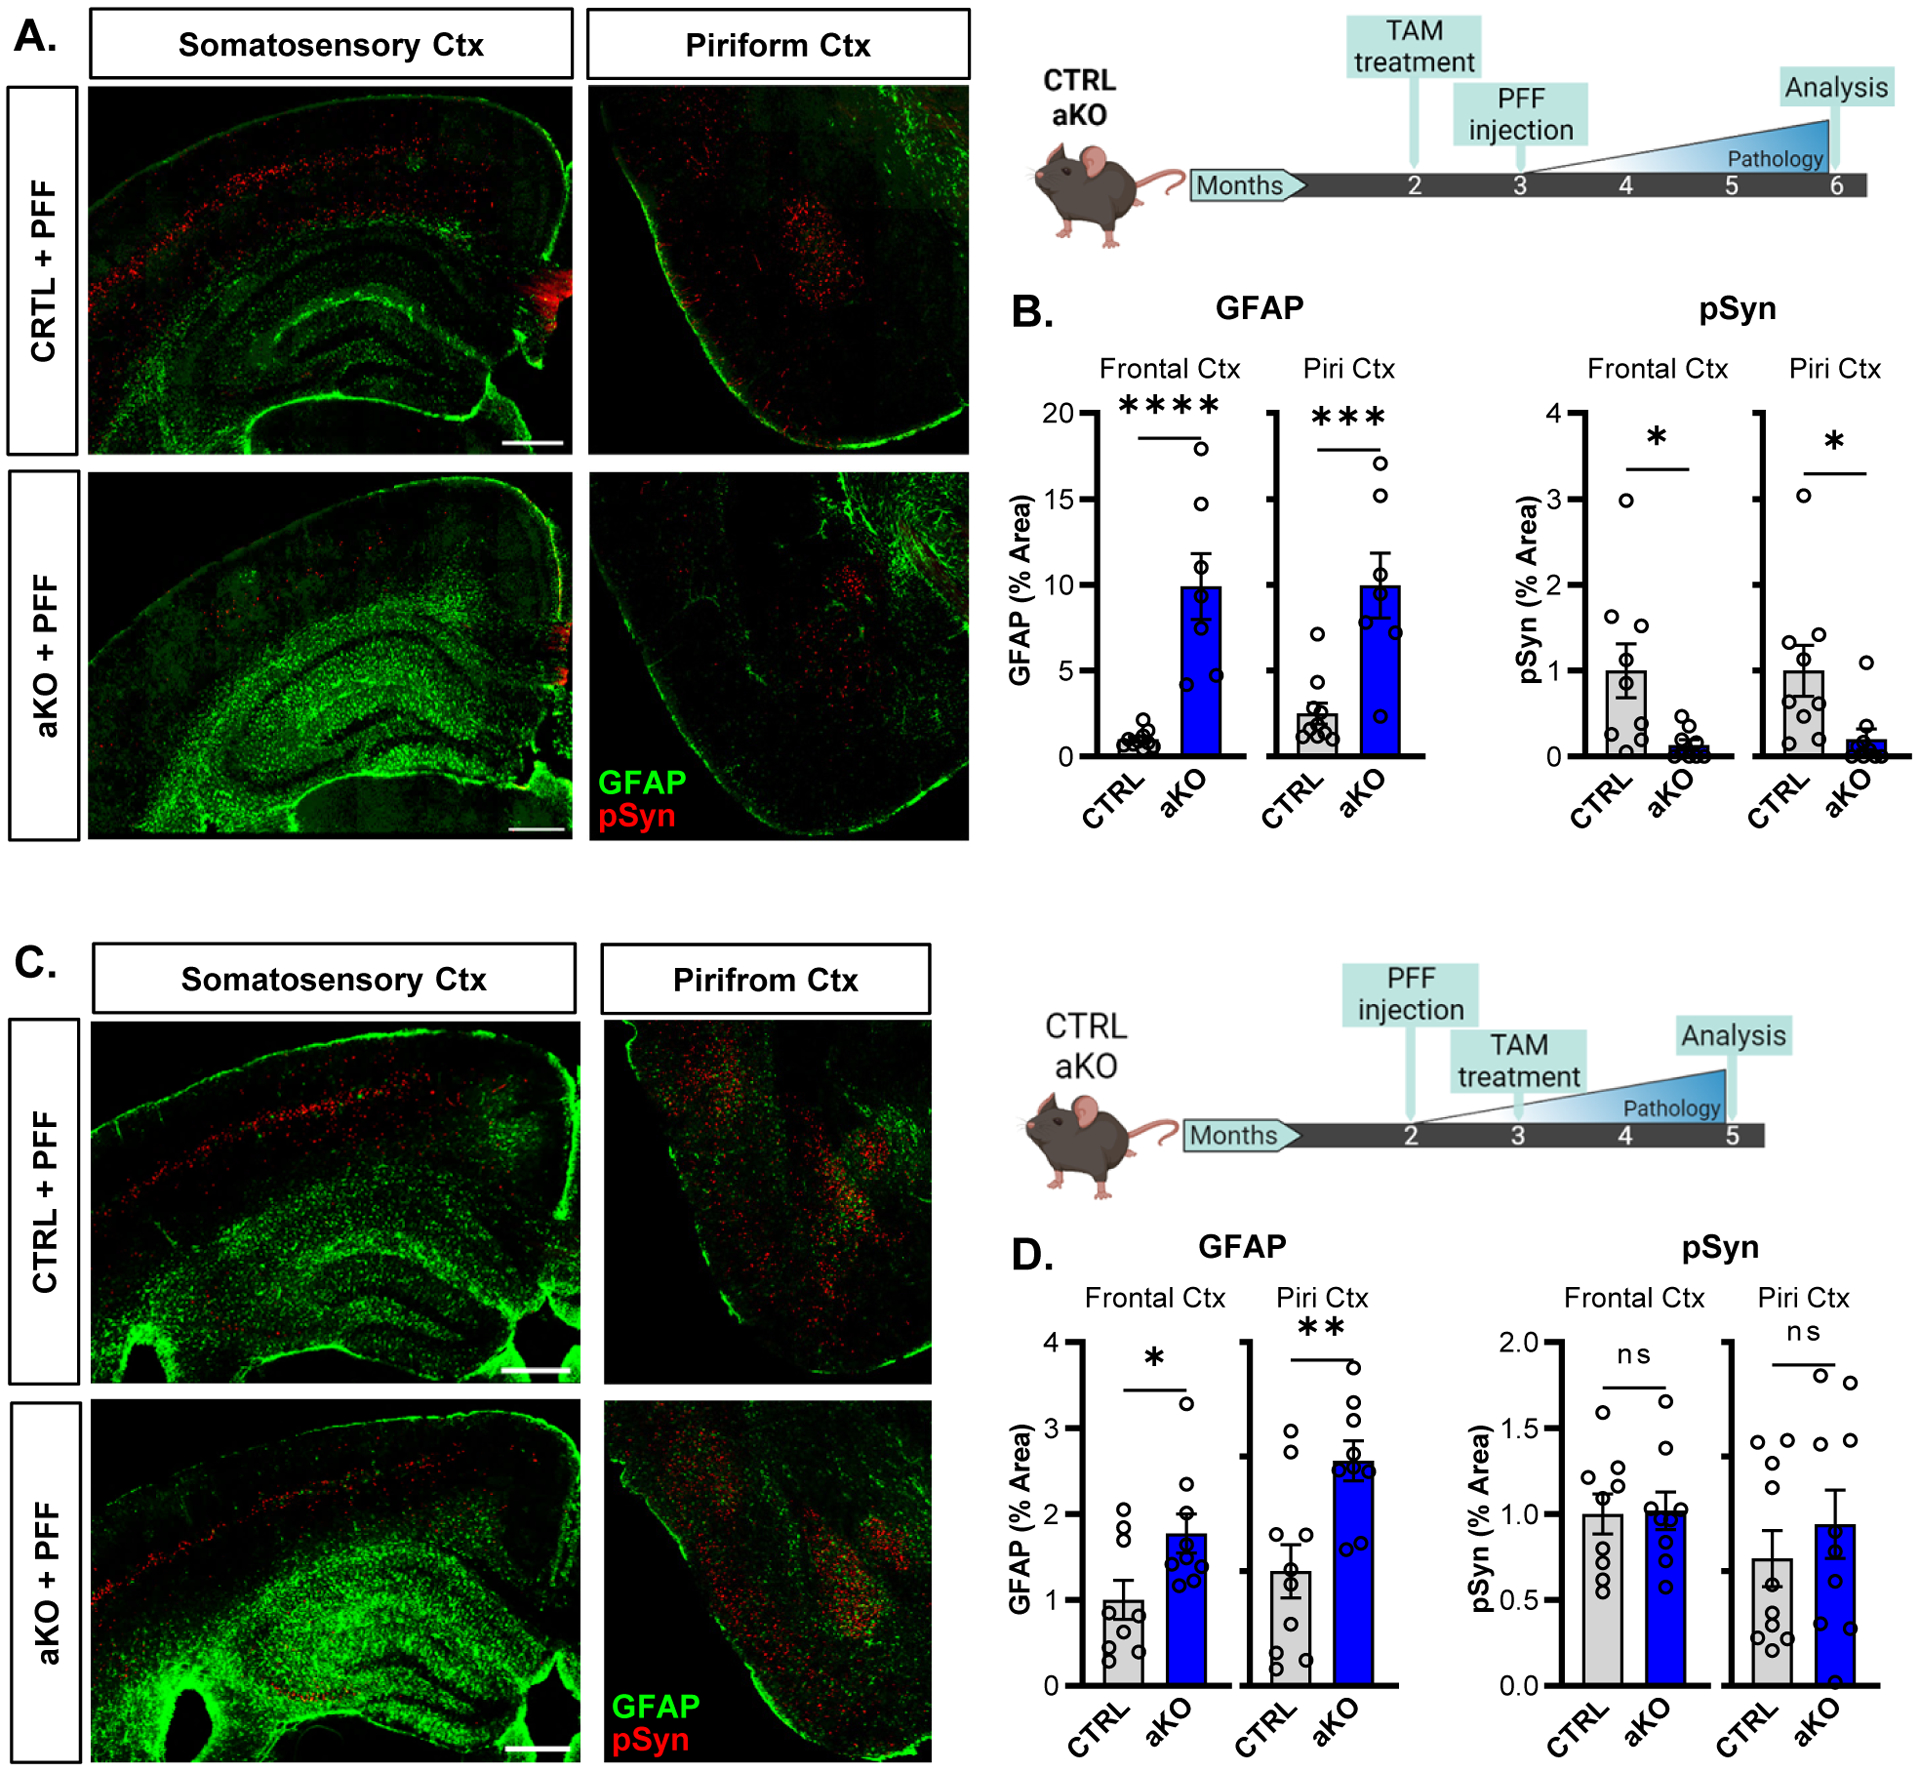
(A,B) Representative images (A) and quantification (B) of pSyn pathology (red) and astrogliosis (GFAP, green) in WT and aKO mice in the frontal cortex and piriform cortex at 6mo. Mice were treated with tamoxifen 1 month prior to PFF injection, as shown in experimental diagram to the right. (C,D) Representative images (A) and quantification (B) of pSyn pathology (red) and astrogliosis (GFAP, green) in WT and aKO mice in the frontal cortex and piriform cortex at 6mo. Mice were treated with tamoxifen 1 month after PFF injection, as shown in experimental diagram to the right. N= 7–9 mice per group for all experiments. *p<0.05, **p<0.01, ***p<0.001, ****p<0.0005 by Mann-Whitney U test (B) or 2-tailed T-test (D). Scale bars = 500μm.
We next investigated whether the timing of astrocyte activation is critical for Bmal1 deletion to mitigate protein aggregation. To do this, we switched the order of tamoxifen treatment and PFF injection, injecting αSyn PFFs one month before tamoxifen administration, such that astrogliosis occurred after initiation of αSyn seeding in CTRL or aKO mice (Fig. 5c). When the order of tamoxifen and PFF injection was reversed, astrogliosis still occurred in aKO mice, but there was no statistically significant reduction in pSyn pathology (Fig. 5c,d). These results show that deletion of Bmal1 specifically in astrocytes is sufficient to reduce both tau and αSyn pathologies, and that astrocyte activation before pathology initiation is critical.
To evaluate a possible microglia-specific effect of Bmal1 deletion on αSyn spreading, we generated inducible, microglia-specific, Bmal1 knockout mice (Cx3cr1-CreERT2+;Bmal1f/f). We confirmed that Bmal1 expression was suppressed in microglia isolated from the brain of these mice after tamoxifen treatment, and observed no obvious spontaneous microglial activation in vivo in bulk cortex tissue (Supplemental Fig. 4a,b). We treated a cohort of microglial Bmal1 KO mice (and Cre- littermate controls) with tamoxifen and injected α-syn PFFs as in Fig. 3. We observed no effect of microglial Bmal1 deletion on aggregated αSyn pathology in this model, suggesting that reduction in αSyn pathology is not dependent on microglial Bmal1 (Supplemental Fig. 4c).
Bmal1-dependent astrocytic Bag3 expression modulates α-synuclein uptake
To identify possible molecular mechanisms mediating the phenotypes described above, we next analyzed an existing RNAseq dataset derived from bulk cerebral cortex from aKO and Cre-controls7. We performed GO analysis of significant DEGs (using a permissive uncorrected p < 0.05 cutoff for exploratory analysis) to better understand pathways dysregulated in aKO mice. Regulation of Protein Catabolic Process (GO:0042176) emerged as one of the most upregulated pathways (Supplemental Fig. 5a), containing 71 genes which were differentially expressed in aKO cortex (Supplemental Fig. 5b). Among these, only 4 genes changed less than 1.5 fold and had an adjusted p-value of less than 0.1, two of which were upregulated in aKO mice, and two were downregulated (Supplemental Fig. 5c). Of these, we focused on Bag3, as it is a known driver of macroautophagy23–26 and was recently identified as a PD-associated gene by a genome-wide association study27. We confirmed that Bag3 mRNA was also upregulated in cortex from brain-specific Nestin-Bmal1 KO mice but was not increased in neuron-specific Bmal1 KO mice (Supplemental Fig. 6a)4. We examined Bag3 expression in samples from Fig. 1, and observed that Bag3 was strongly upregulated in gKO mice and in P301S mice with no further increase in gKO;P301S mice (Fig. 6a), similar to other astrocyte activation transcripts (see Fig. 2e). Immunofluorescence for BAG3 and GFAP revealed that BAG3 protein was highly expressed in activated astrocytes in aKO mice (Fig. 6b), and that most of the BAG3 volume co-localized strongly with GFAP (Fig. 6c). We also observed markedly increased astrocytic BAG3 immunoreactivity in global Bmal1 knockout (gKO) mice (Supplemental Fig. 6b,c).
Figure 6: Astrocytic BAG3 modulates α-synuclein uptake downstream of Bmal1.
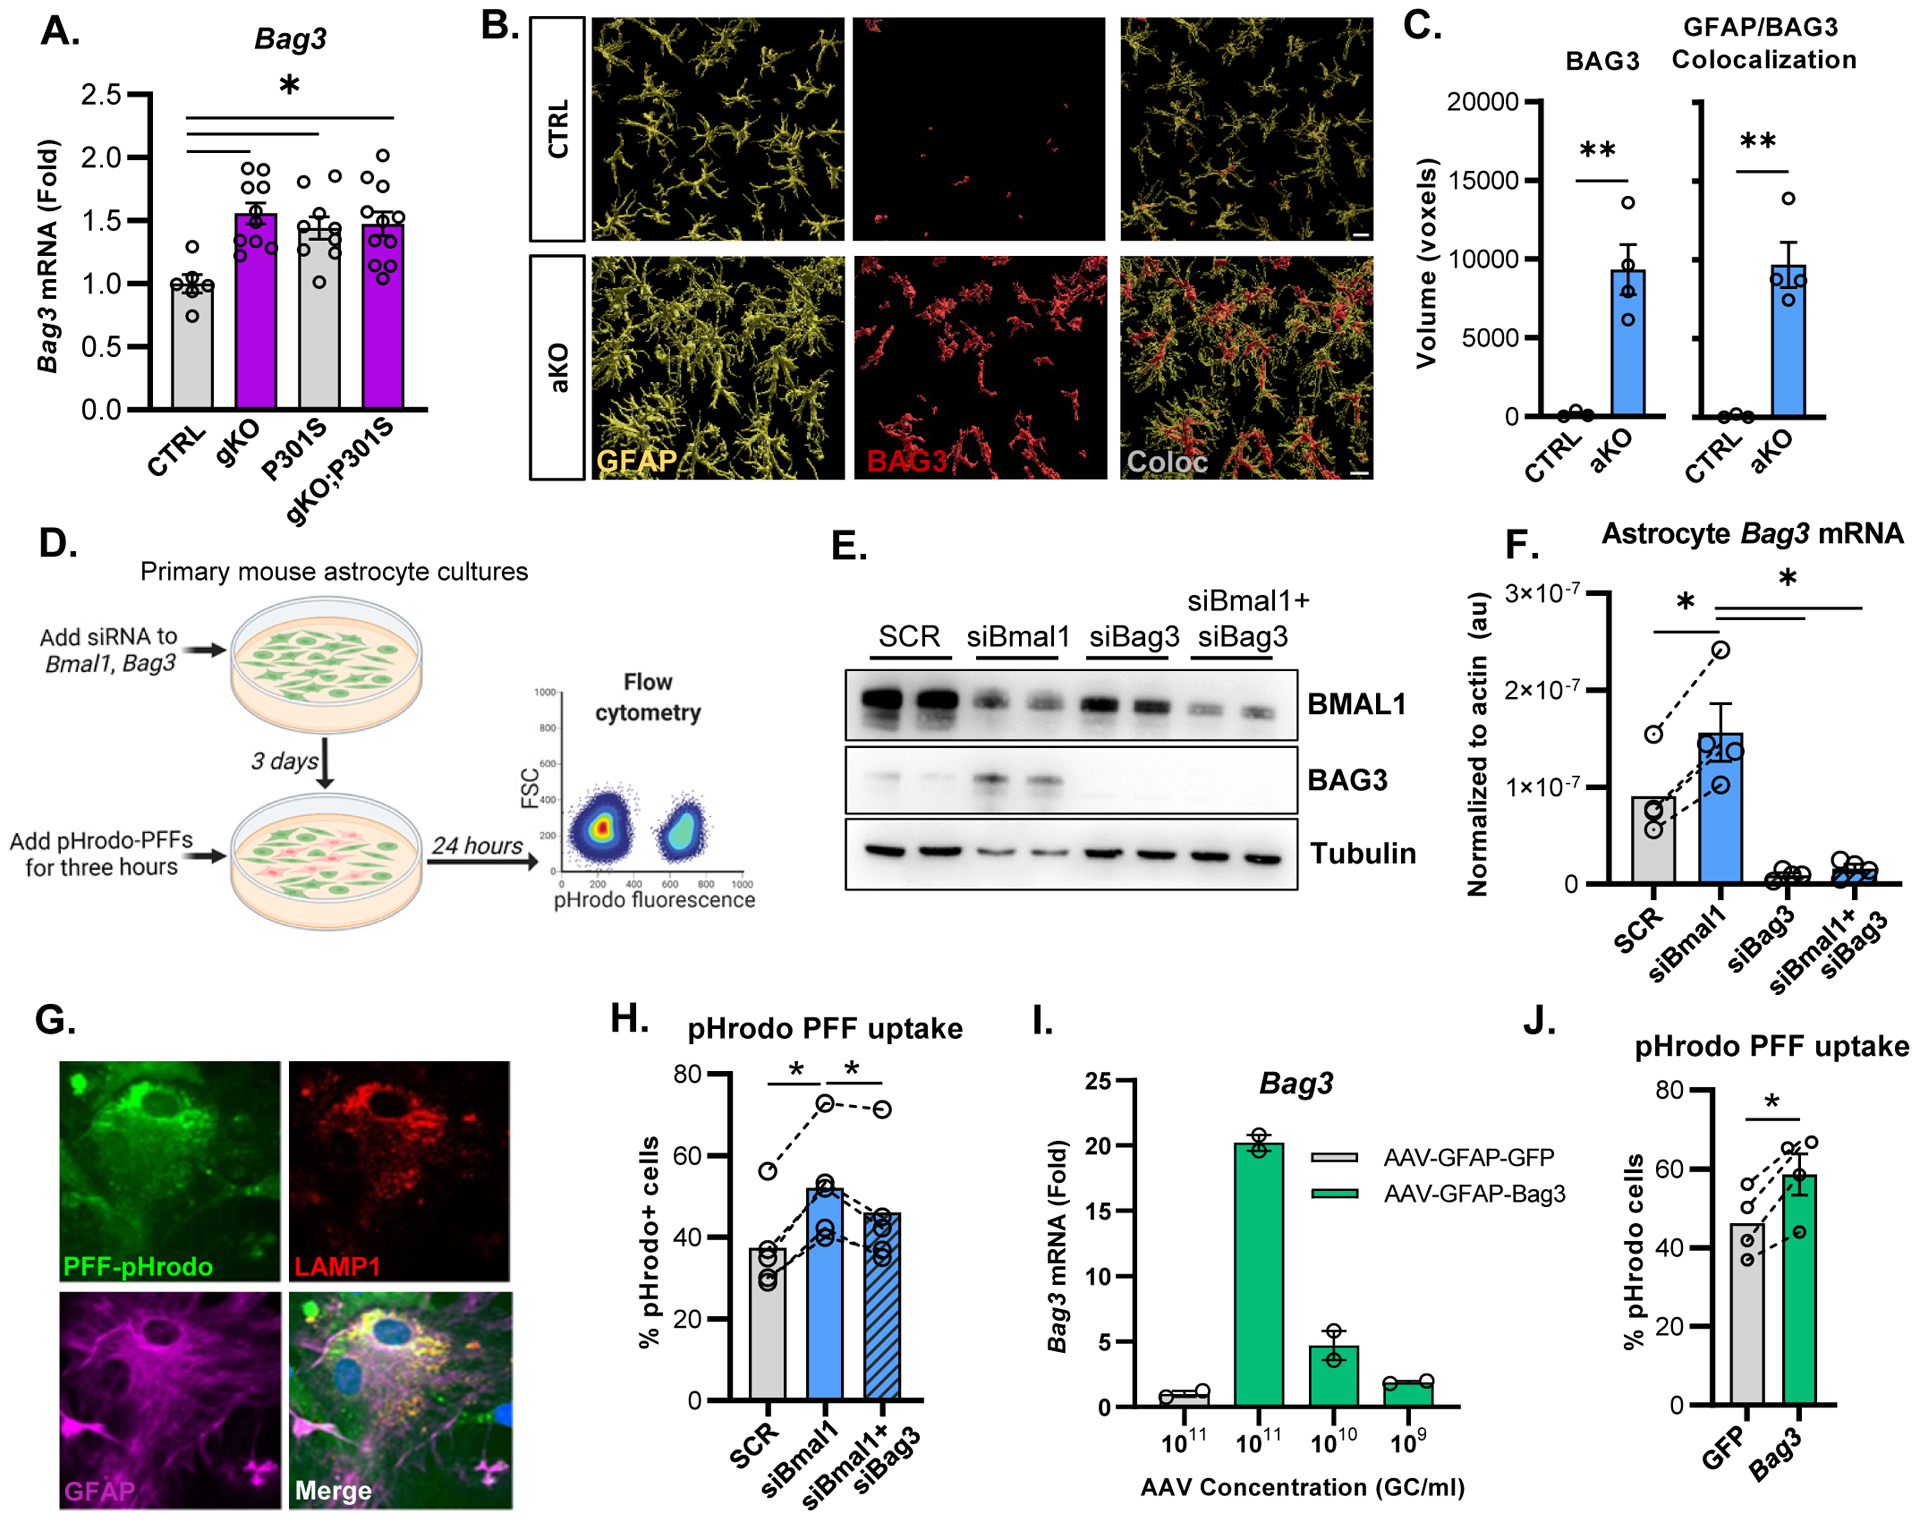
(A) qPCR analysis of Bag3 in cortex of mice from Figure 2. (B) Representative confocal images of GFAP and BAG3 immunofluorescence in aKO mice. Scale bar = 10μm (C) Quantification of BAG3 immunofluorescence and co-localization of GFAP with BAG3 in aKO mice, using Imaris reconstruction. N = 3–4 mice per group. (D) Schematic representation of the experimental paradigm used for analyzing uptake of pHrodo-labeled αSyn PFFs. (E) Representative Western blot showing BMAL1 and BAG3 protein after siRNA treatment in astrocyte cultures. (F) qPCR analysis of Bmal1 and Bag3 mRNA after siRNA knockdown in primary astrocytes. (G) Representative images of primary astrocytes with phrodo-labeled PFFs and co-stained with LAMP1 and GFAP. Scale bar = 10μm (H) Flow cytometry analysis of the percent of phrodo-labeled PFF+ astrocytes after a 24 hour incubation. N = 5 independent experiments (I) qPCR analysis of AAV-mediated Bag3 overexpression in primary astrocytes using a serial dilution of virus concentrations. N = 2 independent experiments. (J) pHrodo-PFF uptake in primary astrocyte culture after AAV-mediated Bag3 overexpression. N=4 independent experiments. For F, H, and J, each circle represents the average from one independent experiment, with dotted lines connecting datapoints from that experiment. *p<0.05, **p<0.01, ***p<0.005 by 2-tailed T-test (C,J), one-way ANOVA (A,H), or repeated measures one-way ANOVA (F, H, J).
To investigate mechanisms by which Bmal1 deletion in astrocytes might mitigate tau and/or αSyn pathology, we examined astrocyte phagocytosis of α-Syn aggregates in vitro. We conjugated α-Syn PFFs to the pH-sensitive dye pHrodo Red, the fluorescence of which is indicative of uptake into phagosomes or lysosomes28. We then treated primary murine astrocyte-enriched cultures with siRNAs targeting Bmal1 and/ Bag3, added pHrodo-PFFs to the culture medium, then quantified fluorescence via flow cytometry (Fig. 6d). SiRNA targeting Bmal1 (siBmal1) reduced BMAL1 protein expression and resulted in increased BAG3 protein and Bag3 mRNA expression compared to the scrambled siRNA (siSCR, Fig. 6e,f). Bag3 siRNA strongly suppressed Bag3 protein levels in primary astrocyte cultures, while treatment with both Bmal1 and Bag3 siRNA together resulted in a strong knockdown of both proteins and suppressed Bag3 mRNA (Fig. 6e,f). Three days after siRNA knockdown, we added pHrodo-PFFs to the astrocytes for three hours to allow uptake, then washed the cells and incubated them for an additional 24 hours. Fluorescent signal from pHrodo-PFFs was visualized inside GFAP+ astrocytes in culture and co-localized with the lysosomal marker LAMP1 (Fig. 6g). Knockdown of Bmal1 significantly increased astrocyte pHrodo-PFF signal, indicating increased phagocytosis and lysosomal uptake, while knockdown of Bmal1 and Bag3 together significantly attenuated the Bmal1-dependent increase in α-Syn PFF lysosomal uptake (Fig. 6h). Similar results were obtained when cells were harvested 8 hours after pHrodo washout (Supplemental Fig. 6d). Bag3 knockdown alone did not affect α-Syn uptake (Supplemental Fig. 6e). These finding suggests that loss of Bmal1 increases astrocytic α-Syn PFF uptake and degradation in a manner that is at least partially dependent on Bag3. To understand if Bag3 upregulation alone is sufficient to increase pHrodo-PFF uptake, we created an AAV8 vector that drives Bag3 expression under the Gfap promoter. This vector increased Bag3 expression in a dose-dependent manner in primary astrocyte cultures, as compared to an AAV8-Gfap-eGFP control vector (Fig. 6i). Using the same pHrodo-PFF uptake system, we found that astrocytes overexpressing Bag3 display increased uptake of pHrodo-PFFs (Fig. 6j). Our data suggest that Bmal1 knockdown enhances astrocyte α-Syn PFF lysosomal uptake at least in part via a Bag3-dependent mechanism, and that astrocytic Bag3 overexpression is sufficient to drive increased α-Syn lysosomal uptake in vitro.
Astrocyte BAG3 mediates α-Syn and tau clearance in vivo.
We next examined the role of BAG3 in mediating the effects of Bmal1 deletion on the reduction of tau pathology in vivo. We utilized three AAV-PhP.eB viral vectors, which we injected into the striatum of Bmal1f/f mice. These included 1. a control vector (AAV-GFAP-GFP), which expressed GFP under the compact GfaABC1D GFAP promoter, 2. a Cre-shSCR vector which expressed Cre under the same GFAP promoter and also expressed a scrambled shRNA under a separate U6 promoter (AAV-GFAP-Cre-shSCR), and 3. a Cre-shBag3 vector that expressed GFAP-Cre as well as a Bag3 shRNA (AAV-GFAP-Cre-shBag3). One month after viral vector injection into the striatum, we injected FITC-labeled tau fibrils into the exact same location, then waited 12 days to assess clearance of this fluorescent tau (Fig. 7a). When comparing the contralateral (uninjected) striatum to the ipsilateral side, some increases in GFAP and BAG3 were seen with the control virus (AAV-GFAP-GFP), suggesting that astrocyte activation caused by injection itself can induce some BAG3 expression (Supplemental Fig. 7a). When examining the ipsilateral striatum, both Cre-expressing viral vectors caused widespread loss of BMAL1 immunoreactivity, though this did not appear to be restricted to astrocytes as was originally intended (Supplemental Fig. 7b). Both Cre-expressing vectors (shSCR and shBag3) caused marked increases in local expression of GFAP as compared to the GFP control vector (Fig. 7b). The AAV-Cre-shSCR vector caused significant increases in BAG3 expression as compared to AAV-GFAP-GFP control, while BAG3 expression was not significantly increased in the AAV-GFAP-Cre-shBag3 group (Fig. 7b). The AAV-GFAP-Cre-shSCR group did not significantly decrease in FITC-tau signal as compared to the control AAV-GFAP-GFAP group, most likely due to this induction of GFAP and BAG3 in the AAV-GFAP-GFP group by the injection itself. However, the AAV-Cre-shBag3-injected mice had significantly more tau remaining than the AAV-GFAP-Cre-shSCR group (Fig. 7b), suggesting that inhibition of BAG3 expression abrogates the clearance of tau in the setting of Bmal1 deletion.
Figure 7: Astrocytic BAG3 reduces tau and αSyn pathology in vivo.
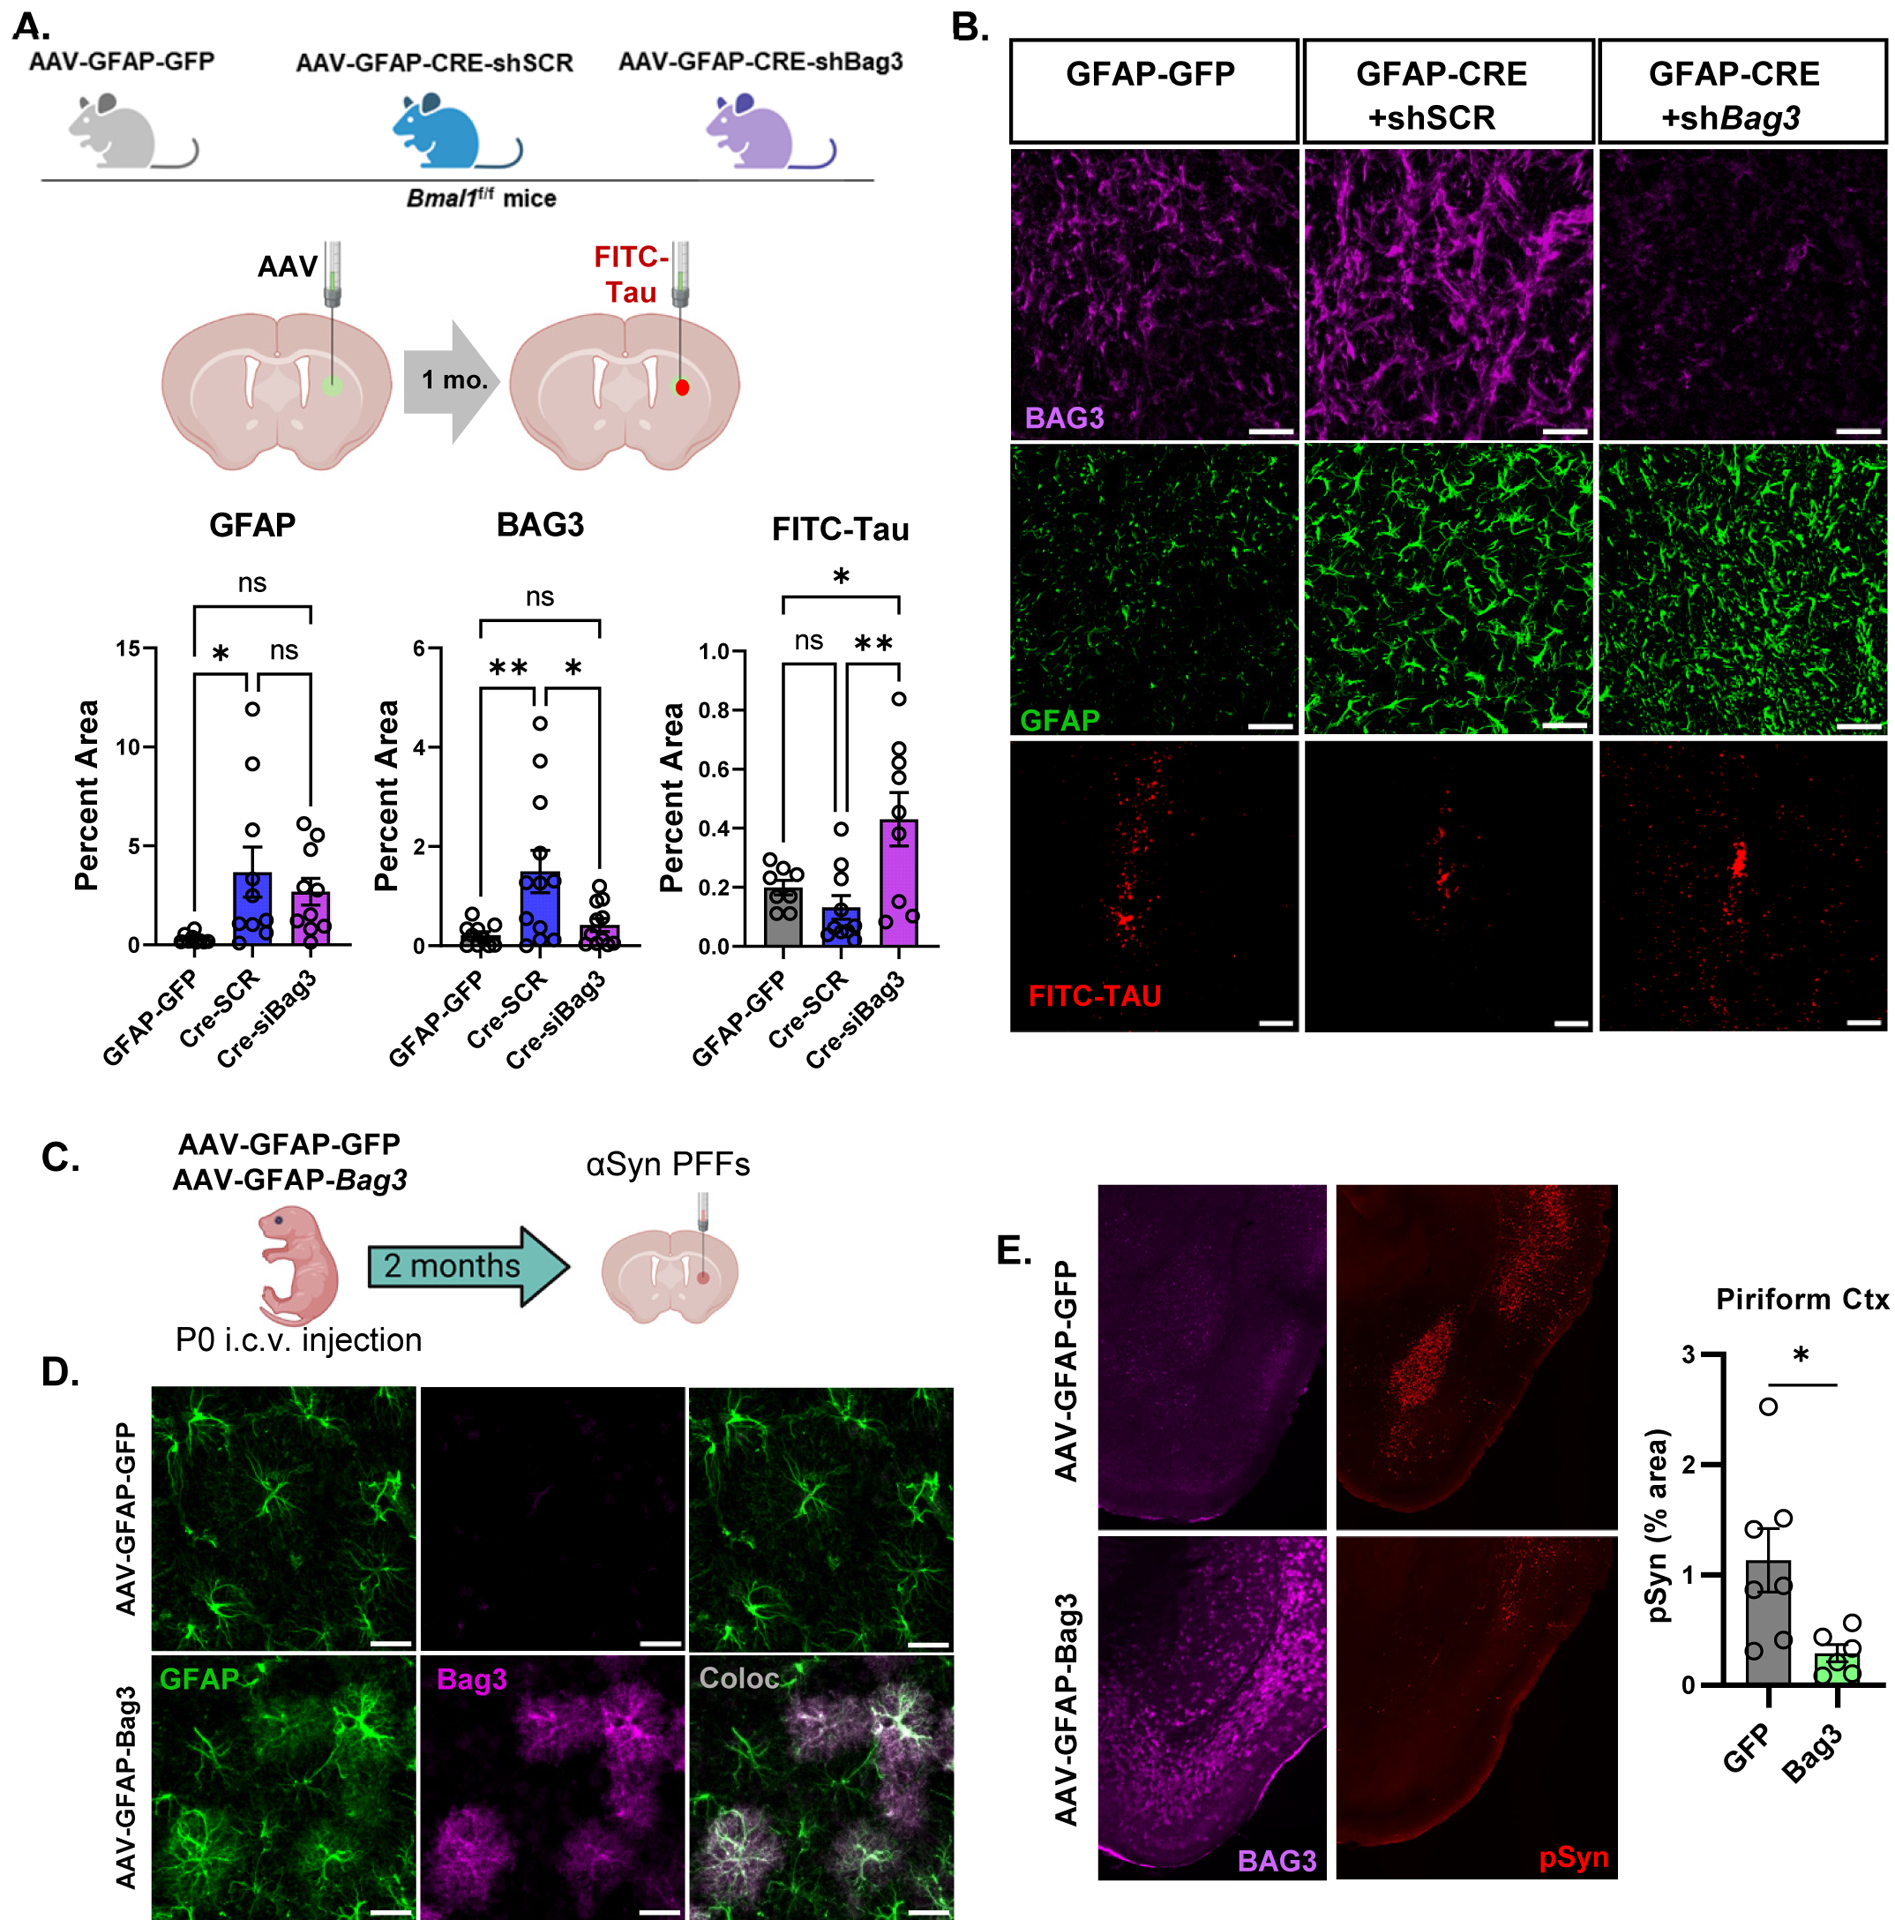
(A) Diagram depicting sequential striatal injection of viral vectors into 2 month old mice, followed by FITC-tau fibril injection 1 month later. (B) Representative images and quantification of BAG3, GFAP, and FITC-tau immunofluorescence in ipsilateral striatum 6 days after FITC-tau injection. P values in B are from one-way ANOVA with Tukey’s multiple comparisons test, and are listed if <0.1. Main effect was significant with p=0.014 (BAG3) and p=0.006 (Tau). Scale bar = 100μm (C) Diagram depicting P0 i.c.v. injection of control (AAV-GFAP-GFP) or astrocyte Bag3 overexpression vectors, followed by striatal αSyn PFF injection at 2mo, and harvest at 5 mo. (D) Images and quantification of BAG3 expression in astrocytes from (C). Scale bar = 50μm. (E) Images and quantification of BAG3 and pSyn immunofluorescence in piriform cortex of mice from (C). Scale bar = 500μm. In (C) and (D), 8p<0.05 by 2-tailed t-test.
To determine if astrocyte-restricted Bag3 overexpression alone could promote protein aggregate clearance in vivo, we injected the AAV-GFAP-Bag3 vector or AAV-GFAP-GFP control vector from Fig. 6j into the ventricles of day P0 mice to induce widespread astrocyte BAG3 overexpression throughout the brain. At 2 month old, we performed the same αSyn PFF injections as in previous experiments, and examined pSyn pathology at 5 months old (Fig. 7c). BAG3 protein was significantly induced throughout the brain, including the cerebral cortex, and co-localized with GFAP staining (Fig. 7d). Astrocyte BAG3 overexpression significantly reduced pSyn pathology in certain brain regions, particularly in the piriform cortex, suggesting an effect on αSyn spreading (Fig. 7e). Levels of pSyn pathology were unchanged in somatosensory cortex and were trending downward in amygdala in mice with Bag3 overexpression, perhaps due to anatomical variability in viral expression (Supplemental Fig. 7c). Taken together with the in vitro experiments in Fig. 6, our data strongly support BAG3 as a mediator of tau and αSyn clearance in Bmal1-deficient astrocytes and implicate astrocyte BAG3 expression as a more general mechanism for glial clearance of protein aggregates.
BAG3 is expressed in disease-associated astrocytes in human Alzheimer’s Disease.
We next sought to characterize BAG3 gene expression in astrocytes in human AD, as only a single paper describes astrocyte BAG3 staining in post-mortem human AD and PD brain29. We first examined the expression of BAG3 transcript in post-mortem bulk brain tissue from participants across multiple large AD brain banks. We used a random effects model to compare BAG3 mRNA levels in pathologically-confirmed AD vs. control samples from Mayo Clinic, Rush ROSMAP, Washington University Knight ADRC, and Mount Sinai Brain Bank, encompassing more than 600 total participants. Demographic information for these cohorts is summarized in Supplemental Fig. 8a. BAG3 expression was higher in AD in all cohorts and was significantly increased by nearly 50% in aggregate (Fig. 8a). When examining BAG3 expression data more closely in data form the Mount Sinai brain bank30, we observed that BAG3 was only upregulated in people with symptomatic dementia but not preclinical AD, suggesting that BAG3 expression occurs later in the disease course (Fig. 8b). To determine the cellular expression of BAG3 in the human brain, we examined single nucleus RNAseq (snRNAseq) data from the Seattle AD Brain Cell Atlas. We confirmed that the defined astrocyte cluster expressed high levels of GFAP and AQP4, two astrocyte-enriched genes. BAG3 expression closely resembled that of GFAP and was enriched in the astrocyte cluster, with some additional expression in microglial and endothelial cell clusters (Fig. 8c). To examine the effect of disease on astrocytic BAG3 expression in humans, we analyzed data from a snRNAseq dataset that includes autosomal dominant AD (ADAD), sporadic AD, and neuropathology-free controls31 (Fig. 8d). First, we identified the astrocyte cluster in this dataset and were able to divide this group into five distinct subclusters (Fig. 8d). We identified a homeostatic GFAP-low (Astro.0) subcluster which expressed homeostatic transcripts (ALDH1L1, SLC7A10, MFGE8); a reactive subcluster with high expression GFAP and AQP4 (Astro.1); a subcluster expressing genes related to myelin sheath injury (Astro.2), a subcluster defined by genes related to long term potentiation (Astro.3), and finally a subcluster which resembles the Disease-Associated Astrocytes (DAA) previously described in 5xFAD mice (Astro.4)32 (Fig. 8F). Astro.4 had prominent expression of DAA genes VIM, CTSB, OSMR, and also BAG3 (Fig. 8d and Supplemental Fig. 8b). When compared directly to homeostatic astrocytes (Astro.0), BAG3 had the largest fold increase in the DAA-like cluster (Astro.4), followed by Astro.2 (Fig. 8e), suggesting that BAG3 is expressed in human DAA-like astrocytes in response to disease. A volcano plot of differentially-expressed genes between Astro.0 and Astro.4 is shown in Supplemental Fig. 8c, highlighting several genes upregulated in Astro.4. To understand the timing of astrocyte BAG3 expression over the course of disease in ADAD patients, we analyzed BAG3 expression across all Braak stages including all five astrocyte clusters. Here, we found that most astrocyte BAG3 expression only occurs in the late stages of ADAD (Braak stage 6, Fig 8g). Finally, to extend the relevance of BAG3 to human PD, we analyzed an existing PD GWAS dataset27,33 which describes a SNP in BAG3 (rs72840788) associated with risk of developing PD (p-value = 2 × 10–11, Beta; 0.0763-CI=0.054–0.098) (Supplemental Fig 9a). Further analysis using a single nucleus ATAC-seq dataset from the SEA-AD cohort revealed a significant overlap in open chromatin of astrocytes around the rs72840788 SNP (Supplemental Fig. 9b). This suggests that astrocytes could specifically be accessing this region of BAG3 where a SNP is associated with risk of developing PD. Our analysis of human data suggests that BAG3 is expressed in reactive, DAA-like astrocytes in the human AD brain, and that SNPs in astrocyte BAG3 may impart risk for developing PD.
Figure 8: BAG3 is expressed in disease-associated astrocytes in human AD.
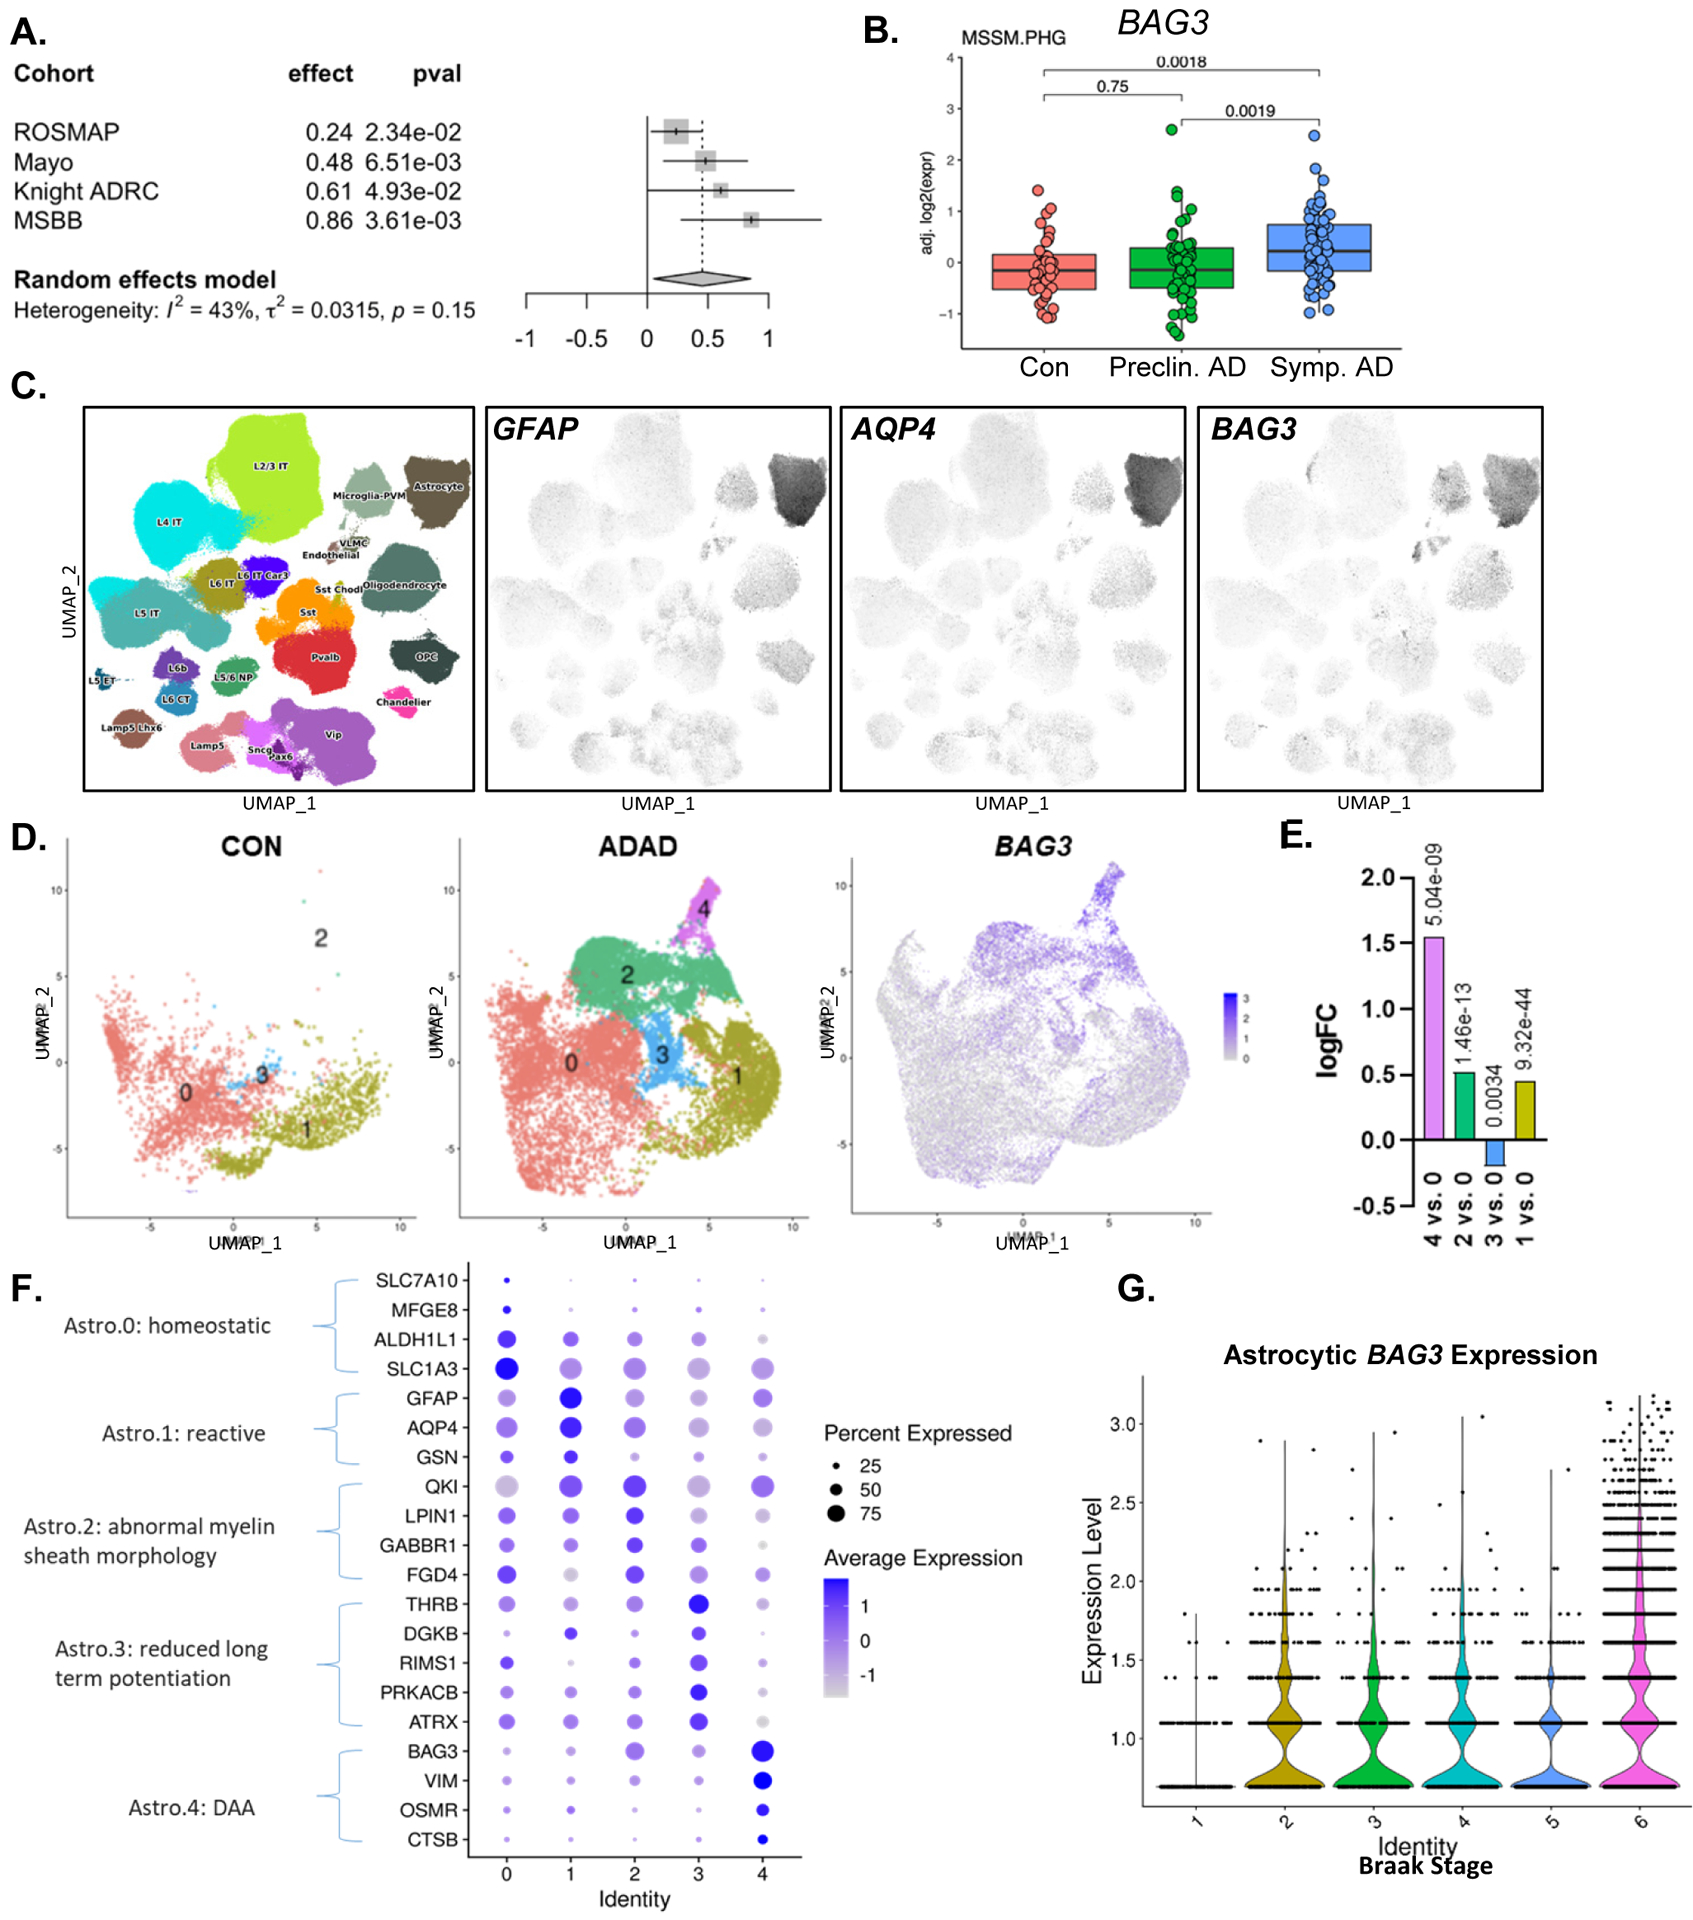
(A) BAG3 mRNA expression in post-mortem brain tissue from human AD patients from multiple longitudinal studies of AD. (B) BAG3 mRNA is increase in post-mortem parahippocampal gyrus samples from patients with symptomatic AD vs. healthy controls, but not in preclinical AD. Data from Mt. Sinai Brain Bank. (C) BAG3 is expressed primarily in human astrocytes in snRNAseq control and AD patients in the Seattle AD Brain Cell Atlas. GFAP and AQP4 are shown to define the astrocyte cluster. (D) UMAP plots showing the astrocyte subclusters from control and autosomal dominant AD (ADAD) patients from the Knight ADRC. BAG3 expression is shown on the right. (E) Dot plot showing expression levels of transcripts which define each astrocyte subcluster from (D). The subcluster number (Identity) is on the x-axis. (F) Differential expression of BAG3 between astrocyte subclusters from (D). The log fold change is shown on the y-axis, with each subcluster compared to Astro.0 (homeostatic) cluster. Benjamani-Hochberg-corrected p values are shown above each bar. G. Violin plot showing BAG3 expression in astrocytes based on Braak stage (1= no pathology, 6= severe tau pathology).
DISCUSSION
A persisting question in the field of neurodegeneration is whether astrocyte activation, which is observed almost ubiquitously, is protective or deleterious. Astrocytes are not homogenous, and diverse subpopulations of astrocytes have been described across different neuroanatomical regions34–36, circuits37,38, and disease settings34,39–42. While GFAP has been classically used as a marker of astrocyte reactivity, the transcriptional states and functions of GFAP+ astrocytes can vary immensely depending on context2,40. Transcriptomic profiling studies of astrocytes in neurodegenerative conditions suggest that multiple modes of astrocyte activation exist depending on disease state, some with varying expression of GFAP2,13,32,43,44. Thus, astrocyte reactivity is much more complex than any binary classification2,41. However, the functional consequences of these different activation states in models of AD and PD are not as well understood. Only a few studies have demonstrated that astrocyte-specific manipulations can affect intracellular protein aggregation (such as that seen with tau and αSyn). Constitutive JAK2 activation in astrocytes leads to STAT3 phosphorylation and astrogliosis and was found to reduce intraneuronal huntingtin aggregation by inducing proteasomal activity and expression of the chaperone DNAJB1, though BAG3 was not increased in this model44. Conversely, deletion of the astrocytic α2 Na+/K+-ATPase suppressed astrogliosis and prevented tauopathy in P301S mice45. Tauopathy induced NRF2-mediated responses in astrocytes, and Nrf2 overexpression in astrocytes mitigated tau pathology13. Notably, upstream transcription factor analysis of the reactive astrocytes in this study identified BMAL1 (Arntl) as a likely regulator of astrocyte transcriptional responses to Aβ and tau, though the study focused on NRF2. Several studies show that BMAL1 can modulate NRF2 activity and downstream gene expression3,46,47, suggesting that these two transcription factors may interact to mediate protective astrocyte responses to protein aggregation. Our current and previous findings4,7,48 suggest that Bmal1 deletion induces a distinct form of astrocyte reactivity which encompasses robust GFAP expression and classic morphological changes, but with induction of a unique transcriptional signature. This form of astrocyte activation has minimal impact on amyloid plaque formation in APP/PS1 mice7, but is protective against tau and αSyn pathology, suggesting that astrocyte activation due to Bmal1 deletion induces specific cellular adaptations that suppress intraneuronal tau and αSyn aggregation, but not extracellular amyloid-beta deposition. While we have identified BAG3 as a downstream mediator of this phenotype, Bmal1 deletion alters the expression of many other genes in astrocytes which may contribute to this neuroprotective phenotype7, and the function of these genes in the context of disease is an area for future study.
Although tau and αSyn form intra-neuronal aggregates, proteopathic seeding occurs via transmission from cell to cell10,21. Astrocytes can readily take up and degrade αSyn released from neurons in vitro49. In Drosophila, glia are intermediaries in the neuron-to-neuron transfer of huntingtin species11. Tau aggregates also spread from neurons to astrocytes in vivo in mice50, allowing astrocytes to degrade proteopathic species and suppress pathological spreading. We hypothesize that Bmal1-deficient astrocytes directly phagocytose proteopathic species released from neurons and degrade them in a BAG3-dependent manner. Our finding that Bmal1 gKO mice are not protected from direct seeding of the SNpc (Supplemental Fig. 2e) but do show mitigation of spreading to regions such as cortex (Fig. 3c) suggests that Bmal1-deficient astrocytes may interrupt spreading at certain synapses. Alternatively, it remains possible that Bmal1 KO astrocytes indirectly promote the degradation of protein aggregates by neurons, perhaps by providing chaperone proteins to neurons via exosomes44. Further investigation of the specific mechanisms by which astrocytes influence intraneuronal protein aggregation, seeding, and spreading is needed.
Another question stemming from our findings is whether the observed effects of astrocytic Bmal1 deletion are related to the disruption of circadian rhythms. Astrocyte BMAL1 can regulate the expression of non-rhythmic transcripts48, and BMAL1 exerts some cellular functions that are not related to circadian rhythmicity51. In this case, the effect of Bmal1 deletion on astrocyte activation is unlikely to be tied to rhythms, as our aKO mice have preserved circadian rhythms of behavior. However, it remains possible that loss of the cell-intrinsic transcriptional rhythms within astrocytes causes chronic cellular adaptations that lead to astrocyte activation and Bag3 expression. Future studies will be needed to determine how other clock gene mutations or non-genetic circadian disruptions impact tauopathy and αSyn pathology. Regardless of the role of circadian rhythms, our work identifies BMAL1 as a key regulator of neuroprotective astrocyte activation, and reveals BMAL1 and its downstream pathways in astrocytes, including BAG3, as novel neuroprotective therapeutic targets.
Our study has some limitations that merit future consideration. Due to concerns that Bmal1 deletion might accelerate the pathology (and death) of P301S mice, the experiments with this model were not designed to examine behavior. It is notable that the α-Syn PFF model exhibits very modest behavioral deficits, even at six months post-injection52, so a different model or longer timeline might be needed to address behavior. Moreover, Bmal1 deletion does not prevent direct seeding of the SNpc after striatal PFF injection, and this pathology drives motor behavioral changes in the model. Finally, Bmal1 KO mice have behavioral abnormalities at baseline, complicating the interpretation of behavioral data in the disease setting3. Another issue was that in Fig. 7, both viral Cre and shRNA expression was not astrocyte-specific. However, since we have shown that global Bmal1 deletion induces BAG3 specifically in astrocytes, the effects of the Bag3 shRNA were likely due to the suppression of astrocyte BAG3. Despite these shortcomings, it is well established that tau and αSyn aggregation are critical pathogenic steps in multiple neurodegenerative diseases. Thus, mechanisms by which astrocytes might reduce these pathologies, such as the BMAL1-BAG3 axis described here, have clear translational relevance.
While it may seem surprising that global Bmal1 deletion, which disrupts circadian rhythms, can exert protective effects in our tau and αSyn mouse models, other studies show protective effects of Bmal1 deletion in neurological disease53–55}. In Drosophila, circadian clock disruption (not though Bmal1 deletion specifically) mitigates neuronal huntingtin aggregation via heat shock protein induction56. Conversely, we have previously shown that global or brain-specific Bmal1 deletion causes spontaneous synaptic loss and oxidative stress in mouse brain3, and can accelerate amyloid plaque deposition in APP/PS1 transgenic mice8. In general, it appears that loss of Bmal1 in neurons is detrimental, leading not only to circadian arrhythmicity but also direct neurotoxic effects. However, Bmal1 deletion in astrocytes exerts protective effects in our tau and αSyn models by promoting misfolded protein degradation. Thus, we may be observing opposing effects of global Bmal1 deletion on protein aggregation and neuronal health, which may be why gKO;P301S mice had similar levels of neuronal loss as P301S mice, despite decreased tau aggregation and inflammation (Fig. 1, 2). Thus, global BMAL1 inhibition in general may not be a viable therapeutic target. However, we hypothesize that downstream pathways activated in Bmal1-deficient astrocytes may offer novel targets, such as BAG3. Neuronal BAG3 can facilitate degradation of αSyn and tau aggregates23–26. The effect of astrocyte BAG3 on protein aggregation has not been previously studied, though astrocytic expression of BAG3 and its partner protein HSPB8 has been described by immunohistochemistry in post-mortem AD and PD brain29. Our finding that Bag3 overexpression in astrocytes can mitigate tau and αSyn pathology, coupled with the clear increases in BAG3 expression in subclusters of activated astrocytes in humans with AD, suggests that BAG3+ disease-associated astrocytes may be attempting to clear protein aggregates. This attempt is insufficient to prevent disease, perhaps because it occurs too late in the disease course, as we showed that BAG3 is only increased in symptomatic AD, and that astrocyte activation via Bmal1 deletion is most protective before protein aggregation (Fig. 5c) Thus, therapies designed to induce protective astrocyte activation early in disease pathogenesis via manipulation of BMAL1 or its downstream target BAG3 may be advantageous for preventing AD and other neurodegenerative diseases.
STAR METHODS
RESOURCE AVAILABILITY
Lead contact:
Further information and requests for resources and reagents should be directed to and will be fulfilled by the lead contact, Erik Musiek (musieke@wustl.edu).
Materials availability:
Mouse lines used in this study are all publicly available from Jackson Labs. Specific mouse catalog numbers are listed in the Key Resources Table. Specific mouse crosses will also be shared directly by the Musiek Lab.
KEY RESOURCES TABLE
| REAGENT or RESOURCE | SOURCE | IDENTIFIER |
|---|---|---|
| Antibodies | ||
| Phospho-α-synuclein (serine 129)- biotinylated (mouse) | Biolegend | Cat # 825704; RRID:AB_2650683 |
| Iba1 (goat) | Abcam | Cat # Ab5076; RRID:AB_2224402 |
| Bmal1 (rabbit) | Novus | Cat # NB100–2288; RRID:AB_10000794 |
| MC1 (aggregated tau) (mouse) | Dr. Peter Davies Jicha et al, 199716 | RRID:AB_2314773; RRID:AB_2314773 |
| AT8 (phospho-tau)- biotinylated (mouse) | ThermoFisher | Cat # MN1020; RRID:AB_223647 |
| CD68 (rat) | BioRad | Cat # MCA1957; RRID:AB_322219 |
| GFAP (rabbit) | Dako/Agilent | Cat # Z0334; RRID:AB_10013382 |
| BAG3 (rabbit) | Proteintech | Cat # 10599-1-AP; RRID:AB_2062602 |
| HT7 (total tau)- biotinylated (mouse) | ThermoFisher | Cat # MN1000B; RRID:AB_223453 |
| Tau5 (total tau) (mouse) | ThermoFisher | Cat # AHB0042; RRID:AB_1087687 |
| GFAP-AlexaFluor-647 conjugate (mouse) | Cell Signaling Tech. | Cat # 3657S; RRID:AB_10693037 |
| Tubulin (mouse) | Abcam | Cat # ab7291; RRID:AB_2241126 |
| Bacterial and virus strains | ||
| AAV8-GFAP-GFP | This paper | N/A |
| AAV8-GFAP-Bag3 | This paper | N/A |
| Php.eb-AAV-GFAP-Cre-shSCR | This paper | N/A |
| Php.eb-AAV-GFAP-Cre-shBag3 | This paper | N/A |
| Biological samples | ||
| Chemicals, peptides, and recombinant proteins | ||
| pHrodo Red succinimdyl ester | ThermoFisher | Cat # P36600 |
| Human FITC-tau-441 | rPeptide | Cat # T-1113-1 |
| Thioflavine S | Sigma-Aldrich | Cat # T1892 |
| Human recombinant alpha-synuclein | In house | N/A |
| 3,3 diaminobenzidine tablets | Sigma | Cat # D4293 |
| Lipofectamine RNAiMax | ThermoFisher | Cat # 13778075 |
| Critical commercial assays | ||
| Deposited data | ||
| Bulk RNAseq, cortex, Aldh1l1-Cre+;Bmal1(f/f) vs. Cre-;Bmal1(f/f) controls | McKee et al.7 | GSE227063 |
| Wang et al AD microarray data | Wang et al.30 | GSE84422 |
| Seattle Alzheimer Disease Brain Cell Atlas | Allen Brain Map | https://portal.brain-map.org/explore/seattle-alzheimers-disease |
| ADAD snRNAseq (Fig. 8) | Brase et al.31 | http://ngi.pub/SNARE/ |
| Knight-ADRC snRNAseq (Fig. 8) | Brase et al.31 | http://ngi.pub/SNARE/ |
| Knight-ADRC (Fig. 8) | Knight-ADRC – bulk RNA-seq Data | https://www.niagads.org/datasets/ng00083 |
| Mayo (Fig. 8) | The Mayo RNAseq Study (MayoRNAseq) | https://doi.org/10.7303/syn5550404 |
| ROSMAP (Fig. 8) | The Religious Orders Study and Memory and Aging Project (ROSMAP) Study | https://doi.org/10.7303/syn3219045 |
| MSBB (Fig. 8) | The Mount Sinai Brain Bank (MSBB) study | https://doi.org/10.7303/syn3159438 |
| Sn-ATAC-Seq (Supplemental Fig 8) | Single nucleus ATAC-seq data from the SEA-AD cohort in the UCSC Genome Browser for the SNP | shorturl.at/csxE2 |
| PD GWAS data (Supp Fig. 9) | Grenn et al.33 | https://pdgenetics.shinyapps.io/GWASBrowser/ |
| Experimental models: Cell lines | ||
| Primary mouse astrocytes | In house | N/A |
| Experimental models: Organisms/strains | ||
| CAG-CreERT2 mice, B6.Cg-Tg(CAG-cre/Esr1*)5Amc/J | Jackson Labs | Cat # 004682; RRID: IMSR_JAX:004682 |
| Aldh1l1-CreERT2 mice; B6N.FVB-Tg(Aldh1l1-cre/ERT2)1Khakh/J | Jackson Labs | Cat # 031008; RRID: IMSR_JAX:031008 |
| CX3CR1ERT2 mice; B6.129P2(Cg)-Cx3cr1tm1Litt/J | Jackson Labs | Cat # 005582; RRID: IMSR_JAX:005582 |
| Bmal1flox/flox mice; B6.129S4(Cg)-Bmal1tm1Weit/J | Jackson Labs | Cat # 007668; RRID: IMSR_JAX:007668 |
| hMAPT P301S PS19; B6;C3-Tg(Prnp-MAPT*P301S)PS19Vle/J | Jackson Labs | Cat # 008169; RRID: IMSR_JAX:008169 |
| Timed-pregnant CD1 mice | Charles River Labs | Cat # 022 |
| Oligonucleotides | ||
| Mouse Bmal1 siRNA, Dharmacon ONTARGET+ SMARTpool | Horizon Discovery | Cat # L-040483-01-0005 |
| Mouse non-targeting siRNA, Control 1, Dharmacon ONTARGET+ SMARTpool | Horizon Discovery | Cat # D-001810-01-05 |
| Mouse Bag3 siRNA, Dharmacon ONTARGET+ SMARTpool | Horizon Discovery | Cat # L-064450-00-0005 |
| C4b Taqman primer | ThermoFisher | Mm00437893_g1 |
| Gfap Taqman | ThermoFisher | Mm01253033_m1 |
| Aqp4 Taqman | ThermoFisher | Mm00802131_m1 |
| Nr1d1 Taqman primer | ThermoFisher | Mm00520708_m1 |
| Bag3 Taqman primer | ThermoFisher | Mm00443474_m1 |
| Bmal1/Arntl Taqman primer | ThermoFisher | Mm00500223_m1 |
| Additional primers listed in Table S2 | ||
| Recombinant DNA | ||
| Bag3 cDNA | Mammalian Gene Collection | Enztrez ID 29810 |
| Software and algorithms | ||
| GraphPad Prizm v.9.3.1 | GraphPad Software | RRID:SCR_002798 |
| ImageJ | NIH | RRID:SCR_003070 |
| Imaris | Oxford Instruments | RRID:SCR_007370 |
| pheatmap | R package | RRID:SCR_016418 |
| DEseq2 | Love et al.61 | RRID:SCR_015687 |
| ggplot2 | Wickham, H.62 | RRID:SCR_014601 |
| Picard | Broad Institute | RRID:SCR_006525 |
| TOPMed RNAseq pipeline | NIH | RRID:SCR_015677 |
| Other | ||
Viral vectors generated for this study are available from the Musiek Lab, or can be purchased from VectorBuilder (all Php.eb vectors), or the Hope Center Viral Vector Core at Washington University (Bag3 overexpression vector).
Data and code availability:
This paper analyzes existing, publicly available data. These accession numbers for the datasets are listed in the key resources table
This paper does not report original code.
Any additional information required to reanalyze the data reported in this paper is available from the lead contact upon request
EXPERIMENTAL MODEL AND STUDY PARTICIPANT DETAILS
All animal experiments were approved by the Washington University IACUC and were conducted in accordance with AALAC guidelines and under the supervision of the Washington University Department of Comparative Medicine. For P301S experiments, only male mice were used. For other experiments, including PFF injections, mixed-sex cohorts were used as no sex differences have been observed in this model. Mice were group housed in all experiments. CAG-CreERT2, Aldh1l1-CreERT2, CX3CR1ERT2, Bmal1flox/flox, C57/B6J and hMAPT P301S PS19 Tg mice were all obtained from Jackson Labs (Bar Harbor, ME) and crossed in our facility at Washington University in St. Louis. In general, crosses were designed such that Cre+/−;Bmal1f/f males were bred with Bmal1f/f or Bmal1f/f;P301S+/− females, such that a mix of Cre+ and – littermates were produced for comparison with each other. Litters from several similar breeding cages were combined in each analysis. For experiments with CAG-CreERT2, Aldh1l1-CreERT2 lines, all mice (Cre+ and Cre− littermates) were treated with tamoxifen (3mg/day x 5 days via oral gavage) at 2 months of age. All mice were maintained on a pure C57B6 background except P301S PS19 mice, which are on a mixed C57B6/C3 background. PS19 mice were bred at least 3 generations with C57B6 mice (in order to generate PS19 mice with appropriate Cre and floxed alleles), and Cre+ and – littermates were compared in order to account for any remaining background heterogeneity.
METHOD DETAIL
Antibodies:
Immunohistochemical antibodies used in this study include: GFAP (rabbit, Dako/Agilent Z0334, 1:5000), IBA1 (goat, Abcam ab5076, 1:500), CD68 (rat, BioRad MCA1957, 1:500), AT8b (mouse, ThermoFisher MN1020, 1:500), GFAP conjugated to Alexafluor-647 (mouse, Cell Signalling Technologies, 3657S, 1:1000), Bmal1 (rabbit, Novus NB100-2288, 1:2000), MC1 (gift of Dr. Peter Davies, 1:500), BAG3 (rabbit, proteintech 10599-1-AP, 1:500), biotinylated phospho-alpha-synuclein (mouse, Biolegend 825704, 1:1000).
Immunohistochemistry and imaging:
Mice were deeply anesthetized with i.p. pentobarbital (150mg/kg), then perfused with ice-cold Dulbecco’s modified PBS (DPBS) containing 3 g/l heparin. For all analyses in the P301S mice; one hemisphere was dissected into regions, flash frozen, and stored at −80o C for RNA analysis as described below. The other hemisphere was post-fixed in 4% paraformaldehyde for 24 hours (4°C), then cryoprotected with 30% sucrose in PBS (4°C) for 24 hours. For all analyses with PFF-injected mice, the whole brain was collected, and fixed in 4% paraformaldehyde for 48 hours (4°C), then cryoprotected with 30% sucrose for 48 hours (4°C). Brains were then sectioned on a freezing sliding microtome in 40-micron serial coronal sections and stored in cryoprotectant solution (30% ethylene glycol, 15% sucrose, 15% phosphate buffer in ddH20). Sections were washed in TBS x 3, blocked for 60 minutes in TBSX (TBS+ 0.4% Triton X-100) containing 3% donkey serum, and incubated overnight at 4°C in primary antibodies diluted in TBSX containing 1% donkey serum. Sections were then incubated for 1 hour at room temperature in PBSX (or TBSX with 1:1000 donkey fluorescent secondary antibody and mounted on slides using Prolong Gold (Invitrogen P36930). For AT8b staining, sections were washed in TBS x 3, then incubated in 0.3% hydrogen peroxide for 10 minutes. Sections were washed again in TBS x 3, then blocked in 3% milk diluted in TBS+0.25% Triton X-100 for 30 minutes. Sections were incubated overnight in biotinylated AT8 in TBS + 0.25% Triton X-100 + 1% milk at 4°C. The next day, sections were washed and then developed using ABC Elite (Vector PK-6100) for 60 minutes. Sections were then incubated in 3,3-diaminobenzidine (DAB, Sigma-Aldrich) and dried before coverslipping. ThioS staining: Free-floating sections were washed in TBS x 3, then incubated in 1% Thioflavin-S dissolved in 80% ethanol for 8 minutes. Sections were then rinsed with 80% ethanol for 1 minute x 2, and rinsed with TBS x 3. Sections were then mounted on slides before coverslipping. All fluorescent imaging was done on a Zeiss Axioimager Z2 or a Keyence BZ-X810 microscope. In general, laser intensity and exposure times were selected for each cohort of samples after a survey of the tissue, in order to select appropriate parameters that could then be held constant for all slides in that imaging session. These values varied by antibody, but all sections in a given cohort were imaged under identical conditions at the same magnification.
For standard image analysis of epifluorescent images (such as determination of % area for antibodies such as MC1 or anti-GFAP), TIFF image files were opened using ImageJ and converted to 8-bit greyscale files. Images with the dimmest and brightest intensity of staining, as well as some mid-range examples, were used to determine an appropriate threshold value that could optimally capture the intended staining across all conditions in that cohort, based on the judgment of the investigator. That threshold was then held constant across all images in the cohort, and black and white images of selected regions of interest were generated and quantified as % area stained using the Analyze Particles function. At least 2 adjacent sections per mouse per region were analyzed and averaged.
Microglia branching analysis was done by taking 20x confocal images of microglia, isolating individual microglia in each image, then the images were binarized and skeletonized using the ImageJ skeletonize plugin. The particle analysis function was then used to remove background before using the Analyze Skeleton function in ImageJ to analyze the number of branches per cell57. All branching analysis were done blinded to genotype. All confocal microscopy was performed on a Zeiss LSM700 at 20x magnification. Sections stained with DAB were imaged on the NanoZoomer digital pathology system. Confocal images were analyzed in Imaris where 3D reconstructions were made and volume measurements were calculated.
Tau ELISA:
Human tau ELISAs were performed by first fractionating tissue samples. Cortical brain tissue was weighed and RAB buffer (0.1M MES, 0.5mM MgSO4, 1mM EGTA, 2mM DTT, 0,75M NaCl, protease/phosphatase inhibitors), pH 6.8 was added at 15ul per mg of tissue. Tissue was sonicated at 30% amplitude in pulses for 1 minute. Volumes in each tube were standardized and spun in an ultracentrifuge for 20 min at 50,000xg at 4°C. We then removed the supernatant and stored as RAB fraction. The same volume of RIPA buffer (150mM NaCl, 50mM Tris, 0.5% C24H39O4Na, 1% Triton-100, 0.5% SDS, 25mM EDTA, protease/phosphatase inhibitors), pH 8.0, was added to the pellet. Samples were then sonicated and run in the ultracentrifuge as before. Supernatant was saved as the RIPA fraction. Formic acid was added at 1/3 of the volume used for RAB and RIPA before being triturated thoroughly and then run once again in the ultracentrifuge before taking the supernatant as the formic acid fraction. To run the human tau ELISA, plates were coated with 20ug/mL of Tau5 (gift from the Holtzman lab) overnight at 4°C. Plates were washed 5x with PBS then blocked with 4% BSA (Fisher BP9700100) in PBS for an hour at 37°C. Plates were washed 5x before adding diluted sample and tau standard (a gift from the Holtzman lab) in sample buffer (0.25% BSA in PBS, 300mM Tris pH 7.4, phosphatase inhibitor), then incubating overnight at 4°C. Formic acid samples were neutralized by diluting 1:20 in 1M Tris, pH 11.0. Plates were washed 8x with PBS before adding biotinylated HT7 at 0.2ug.mL diluted in 1% BSA+PBS and incubated for 1.5 hours at 37°C. Plates were washed 8x with PBS, then streptavidin poly-HRP40 (Fitzgerald 65R-S104PHRP) diluted 1:4000 in 1% BSA in PBS was added for 1.5 hours. Plates were washed once more before adding super slow TMB substrate (Fisher T5569) and reading absorbance 15 minutes later.
RNA quantification:
Brain tissue was homogenized in 500ul of Trizol with beads added before running in a bullet blender for 3 minutes. Cultured cells were collected and homogenized by adding 500ul TRIzol/well of a 12-well plate directly to plated cells. TRIzol samples were then subjected to chloroform extraction (1:6 chloroform:TRIzol, followed by thorough mixing, and centrifugation at 12500 x g for 15 minutes). RNA was then extracted from the aqueous layer using the PureLink RNA Mini Kit according to manufacturer’s instructions. RNA concentration was measured on a Nanodrop spectrophotometer, then cDNA was made using a high-capacity RNA-cDNA reverse transcription kit (Applied Biosystems/Life Technologies) with 250ng-1 μg RNA per 20μL reaction. Real-time quantitative PCR was performed with ABI TaqMan primers and ABI PCR Master Mix buffer on ABI StepOnePLus or QuantStudio 12k thermocyclers. Taqman primers (Life Technologies) were used, and mRNA measurements were normalized to β-actin (Actb) mRNA for analysis. For larger experiments, microfluidic qPCR array measurements were performed by the Washington University Genome Technology Access Center using a Fluidigm Biomark HD system, again using Taqman primers. RNA sequencing was performed and values normalized as previously described7; GEO accession number isGSE227063. Volcano plot was made using Enhanced Volcano R packaged and heatmap was made using the Pretty Heatmap package. GO pathways were generated using Metascape.org.
Primary mouse astrocyte culture:
Primary mouse astrocyte cultures were prepared as previously described4. Briefly, P2 mouse pups brains were isolated in cold DMEM, the meninges removed, and the cortices dissected. Cortices were then incubated in 0.025% trypsin solution (Gibco) at 37°C for 15 minutes, then triturated using a glass pipet before adding to a T75 flask. Once cells reached confluency, cells were plated in 24 well plates coated with poly-d-lysine at 70,000 cells per well.
Stereotactic injections:
Mice were anesthetized with isoflurane and stereotactically injected with 2ul (approximately 4ug of PFFs) into the left dorsal striatum using a Hamilton microsyringe attached to a motorized injector (Stoelting). The coordinates used were: 0.2mm anterior, 2.0mm lateral to bregma, and 3.2mm ventral to the surface of the skull. The injection was carried out over a 5 minute period, and the needle was left in place for 5 minutes after the injection before it was carefully withdrawn. The skull burr hole was filled with bone wax and the skin sutured.
siRNA transfections:
Primary mouse astrocyte-enriched cultures were transfected with siRNA using lipofectamine RNAiMAX (Life Technologies) in Optimem (Life Technologies) per manufacturer’s instructions 24–48 hours after replating. 48 hours after transfection, media was changed to DMEM plus 10% FBS and 1% penicillin/streptomycin. SiRNAs targeting mouse Bmal1, Bag3 and Scr (non-targeting, targeting no known mouse gene) were obtained from Horizon Discovery/Dharmacon (Lafayette, CO). ON-TARGETplus SmartPool siRNA was used, which contains 5 separate siRNAs targeting the gene of interest which are pooled together, Bmal1 (product L040483-01-005), non-targeting (control or “scrambled”) )D-001210-01-05), and Bag3 (product L-064450-00-0005). An siRNA:RNAiMAX ratio of 1:1.25) was used, and 40 pmol of siRNA (2uL of 20uM stock) was added to each well in a 24-well plate for 24 hours before replacing with astrocyte media.
Viral vectors:
Bag3 overexpression viral vector was made at the Hope Center Viral Vector core using Mammalian Gene Collection cDNA for mouse BAG3 (Enztrez ID 29810) purchased from Horizon Discovery (Lafayette, CO; Cat #: MMM1013-211692359). Bag3 cDNA was then packaged into an AAV8 envelope under expression of a full-length Gfap promoter. An HA tag was also included as a marker of Bag3 expression. These viruses were administered via bilateral intracerebroventricular injection in newborn P0 pups as described previously58. Two microliters of virus were injected at a concentration of 8.5×10^12 gc/mL.
AAV-GFAP-GFP, AAV-GFAP-Cre-shScr, and AAV-GFAP-Cre-shBag3 viral vectors were made by VectorBuilder Inc (Chicago, IL). These employed a Php.eb capsid (but were injected intracranially, as intravenous injection provided poor density of infection) and used the truncated gfaABC1D promoter to drive either eGFP or Cre recombinase expression primarily in astrocytes. The AAV-GFAP-Cre-shScr, and AAV-GFAP-Cre-shBag3 vectors also contained a separate U6 promoter driving a scrambled, non-targeted shRNA (shSCR), or a shRNA targeting Bag3 (shBag3). The U6 promoter is not cell type-specific, so shRNA expression occurred in all infected cells. Viruses were administered via stereotactic injection, with 2 microliters per injection containing 5×10^12 gc/mL.
Phagocytosis Assay:
Confluent astrocytes were plated at 70,000 cells per well in a 24 well plate. The next day, siRNA was added and then removed the following day. For viral expression, virus was added at 1×10¹¹ GC/mL. Three days after addition of virus or siRNA, phrodo-PFFs were added at 2.5ug/mL in astrocyte media for three hours. Cells were then washed once with 1x PBS, and astrocyte media was added back to the cells. 24 hours after phrodo-PFFs were removed, cells were trypsinized, washed twice with flow buffer, then resuspended and analyzed on a MACSQuant VYB flow cytometer. Data was then analyzed in FlowJo software (BD Biosciences).
αSyn PFF preparation and injection:
Purification of recombinant mouse sequence αSyn monomer and in vitro fibril assembly were performed as described59with minor modifications. Fibril assembly reactions were carried out in an Eppendorf ThermoMixer at 1000 rpm for 7 days. An aliquot of the resulting suspension was centrifuged at 15,000g for 20 min, and the PFF concentration was estimated by subtracting the concentration of αSyn monomer in the resulting supernatant from the starting monomer concentration. PFFs were aliquoted and stored at −80°C until use. Before use, aliquots were thawed and sonicated briefly in a water bath sonicator (Qsonica). To generate αSyn PFFs conjugated to pHrodo Red, αSyn monomer was labeled with pHrodo Red (ThermoFisher) using a succinimidyl ester reagent (ThermoFisher P36600) according to the manufacturer’s instructions, and αSyn PFFs were prepared as above using an excess of unlabeled monomer at a molar ratio of 1:20.
FITC-tau injection study:
Fluorescein (FITC)-labeled Tau 441 peptide (rPeptide) was diluted with 10mM 1,4-Dithiothreitol (DTT), 100mM NaCl, and 10mM HEPES and incubated for 1hr at room temperature. Heparin was added at a final concentration of 8μM, and the solution was incubated with shaking at 37°C for 7 days. Tau solution was then centrifugation at 100,000g for 1 hr at 4°C, and the pellet (containing aggregated tau) was sonicated with 65% power/amplitude for 30 sec in a water bath sonicator, then diluted for use. FITC-tau fibrils (500ng in 1.5uL volume) were injected into the striatum of Bmal1f/f one month after viral vector injection at the same coordinates (see above). 12 days after tau injection, mice were perfused and remaining FITC-tau signal was quantified. Serial striatal sections 40 μm apart were imaged, and the section at the epicenter of injection was identified for each mouse by visualization of the needle tract. 3 sections centered on the injection site were then analyzed for FITC signal, for a total area spanning 40 μm on either side (rostral and caudal) of the injection. The harmonic mean of the FITC-Tau percent area in the 3 sections was obtained to mitigate the potential outlier effect of the section closest to the injection site.
Human RNAseq analysis:
This manuscript used existing, publicly available and GEO numbers are listed in the Key Resources Table. Bulk RNAseq data from Aldh1l1-CreERT2;Bmal1f/f mice and Cre- controls has been deposited at GEO and is publicly available. The GEO accession number is listed in the Key Resources Table. Human brain microarray data was previously published and is publicly available in GEO, and was analyzed using the online GEO2r tool. Human single nucleus RNAseq data is also publicly available from the Seattle Alzheimer’s Disease Brain Cell Atlas (https://portal.brain-map.org/explore/seattle-alzheimers-disease) and was analyzed using the online Transcriptomics Comparative Viewer tool. Single nucleus RNAseq data from autosomal-dominant AD patients was from a previously-published manuscript31 and is publicly available online (http://ngi.pub/SNARE/browse/) and through the NIAGADS website (https://dss.niagads.org/datasets/ng00108/).
All RNA-seq datasets were processed and aligned using our in-house RNA-seq pipeline (https://github.com/HarariLab/RNA-seq-Pipeline). Genome reference and gene models were selected similarly to the TOPmed pipeline (https://github.com/broadinstitute/gtex-pipeline/blob/master/TOPMed_RNAseq_pipeline.md ). Reference genome GRCh38 and GENCODE 33 annotation, including the addition of ERCC spike-in annotations, were used. Before alignment, the quality of raw read sequences for all libraries was assessed using FastQC (v0.11.9)150. All raw read sequences were aligned to the human reference genome (GRCh38) using STAR (v.2.7.1a)151. The alignment quality was evaluated using sequencing metrics such as reads distribution, ribosomal content, or alignment quality provided by STAR using tools (v.2.8.2)152. All samples that failed to pass the QC or were outliers were removed from the downstream analyses. Raw read counts for transcripts and genes were generated using STAR and computed transcript/gene expression levels as normalized in FPKM (Fragments Per Kilobase of transcript per Million mapped reads) format.
Single-nucleus gene expression and ATAC-seq data from aged controls and sporadic AD patients (Fig. 8c) were obtained from the Seattle AD Brain Cell atlas (https://portal.brain-map.org/explore/seattle-alzheimers-disease), which is part of the Allen Brain Map. Genes of interest were queried directly in their web-based Transcriptomic Comparative viewer. Images were taken directly from this viewer, using the SEA-AD cohort, which includes log-normalized expression of each transcript of interest across all nucleus clusters from 84 aged individuals (42 cognitively-normal and 42 with dementia).
Single-nucleus RNAseq data from autosomal dominant AD patients and healthy controls were obtained from frozen parietal cortex of postmortem brains from the Neuropathology Cores of the Charles F. and Joanne Knight Alzheimer’s Disease Research Center (Knight-ADRC) and the Dominantly Inherited Alzheimer Network (DIAN). These samples were obtained with informed consent for research use and were approved by the review board of Washington University in St. Louis. AD neuropathological changes were assessed according to the criteria of the National Institute on Aging-Alzheimer’s Association (NIA-AA). Their demographic, clinical severity and neuropathological information are presented in Brase L et al.31 Nuclei were extracted from fresh frozen brain regions (~200–400mg of tissue) following the same protocol, as reported in Del Aguila et al60 and Benitez BA (dx.doi.org/10.17504/protocols.io.2a5gag6). 10X genomic library preparation: Nuclei were processed using the 10x Genomics Chromium Controller and the Chromium Next Gem Single Cell 10× 3’ Library & Gel Bead Kit v3.1 (PN 1000121) following the standard manufacturer’s protocols (10X Genomics). Samples were sequenced on the Illumina NovaSeq S4 (200 cycles), targeting 50,000 reads/cell (2 × 150 paired-end reads). Sequencing alignment: We employed the 10X CellRanger 6.0 pipeline to perform transcript alignment (human genome build GRCh38), counting, and inter-library normalization. Quality control for nucleus inclusion: We followed the Seurat v4 protocol to clean the snRNA-seq data. Each raw gene expression matrix for each sample was plotted using BarcodeInflectionsPlot to calculate the inflection points derived from the barcode-rank distribution. Once the thresholds were determined, a subset of the data was isolated. We removed nuclei with high mitochondria gene expression following a previously proposed dynamic model. Briefly, the nuclei were grouped by their percentage of mitochondria values using k = 2 clusterings, and the group with the higher percentage values was removed. Genes that were not expressed in at least ten nuclei were removed from the final matrix. To detect and discard doublets, we used Doublet Finder, which removes nuclei with expression profiles that resemble synthetically mixed nuclei from the dataset. The gene expression matrices from all samples were combined in R for further processing using the Seurat protocol. The expression matrix was normalized using the SCtransform protocol by Seurat. We regressed, during the normalization, against the number of Genes, number of UMI, and the percentage of mitochondria. The principal components (PC) were calculated using the first 3,000 variable genes and the Uniform Manifold Approximation and Projection (UMAP) analysis was performed with the top 14 PCs. Clustering and visualization: We clustered nuclei using a graph-based clustering approach implemented in the Seurat package (v4). Cell-type annotation and sub-clustering: For each pre-cluster, we will assign a major brain cell-type label evaluating the enrichment for sets of marker genes for neurons, astrocytes, oligodendrocytes, microglia, oligodendrocyte precursor cells, and endothelial cells, as we previously published (Brase et al). We employed the following markers RYR3, LRRC16A, F3, ETNPPL, CLU, SLC1A2, GJA1, DIO2, SLC4A4, EDNRB, AQP4, GPR37L1, CPE, ATP1B2 and SLCO1C1 for astrocytes. Cell-type/-subtype differentially expressed genes (DEG): We identified sub-cluster up/down expressed genes for each cell type to characterize the genes, pathways, and biological processes. We used traditional regression methods (Monocle3 package). We then employed Seurat’s FindNeighbors and FindClusters functions to identify unique cell states or subclusters (resolution=0.1, 0.2, 0.2, 0.05, 0.15). Additionally, we used the Garnett protocol to examine nuclei in each expression state within each cell type to detect and remove those nuclei that did not resemble a trustworthy expression profile from downstream analyses.
For RNA-seq harmonization and BAG3 expression quantification in AD brain cohorts, frozen postmortem parietal lobe tissue samples from Knight Alzheimer Disease Research Center (Knight ADRC) participants, collected with informed consent for research use, were provided by the Knight ADRC Neuropathology Core. The data generation for the RNA-seq dataset has been previously described31. The data is found at the National Institute on Aging Genetics of Alzheimer’s Disease Data Storage Site: NG00083. The RNA-seq raw data from The Mount Sinai Brain Bank (MSBB: syn3157743), the Religious Orders Study and Memory and Aging Project (ROSMAP; syn3219045), and the Mayo Clinic Brain Bank RNA-seq (Mayo; syn5550404) studies were downloaded from the Synapse portal as part of the Accelerating Medicines Partnership for Alzheimer’s Disease (AMP-AD).
Data from gene expression from control, presymptomatic (preclinical) and symptomatic AD was from a previously-published study30 and accessed via the GEO database accession number GSE84422. Data from parahippocampal gyrus (PHG) was analyzed. We performed the comparisons using the GEO2R web tool from NCBI (https://www.ncbi.nlm.nih.gov/geo/geo2r/).
QUANTIFICATION AND STATISTICAL ANALYSIS
Statistics:
In all figures, graphs depict the mean ± SEM, and N generally indicates the number of animals, unless otherwise noted in the figure legend. For cell culture experiment, each datpoint depicts the mean for several technical replicates from one independent independent experiment, and each of these mean values is considered an N or 1. An F test was first performed for datasets with a single dependent variable and 2 groups, to determine if variances were significantly different. If not, 2-tailed unpaired T-test was performed. If variances were different, non-parametric Mann-Whitney U test was performed. For datasets with one dependent variable and more than 2 groups, one-way ANOVA was performed. If the main effect was significant, then Tukey (for equal group sizes) or Tukey-Kramer (for unequal group sizes) multiple comparisons test were subsequently performed. When data was not normally distributed, Kruskal-Wallis test was performed with Dunn’s Multiple Comparison test to follow (if main effect was significant). For datasets with 2 dependent variables, 2-way ANOVA was performed, and if main effect was significant, Sidak multiple comparisons test was then added for appropriate sets of variables. Outliers were identified using Grubbs test and were excluded. Statistical tests were performed with GraphPad Prizm software, version 9.0.1. P values greater than 0.1 were noted as not significant (NS), while P values from 0.1–0.05 were specifically listed in the figure. P<0.05 was considered significant and was noted with asterisks indicated the p-value: *P<0.05, **<0.01, ***<0.005, ****<0.00
Supplementary Material
HIGHLIGHTS.
Global or astrocytic deletion clock gene Bmal1 reduces tau and α-synuclein pathology.
Astrocyte Bmal1 regulates autophagy chaperone Bag3 to prevent protein aggregation.
Astrocytic Bag3 overexpression reduces alpha-synuclein spreading in mice.
BAG3 is expressed in disease-associated astrocytes in human Alzheimer Disease.
Acknowledgements
This work was supported by NIH grants R01AG054517 and RF1AG061776 (ESM); K08NS101118 (AAD), the Mary E. Groff Charitable Trust, and the Dobbins Family Fund (AAD); R01NS118146, R21NS127211, and RF1AG071706 (BAB); R01AG057777, R56AG067764 and U01 AG072464 (OH) and support from Knight ADRC (P30AG066444; P01AGO26276), and the Dominantly inherited Alzheimer Network (U19AG032438). OH is an Archer Foundation Research Scientist. PWS and LB were supported by NIA grant T32AG058518 through the Knight ADRC. The Genome Technology Access Center (GTAC) is partially supported by NCI grant P30 CA91842, ICTS/CTSA grant# UL1TR002345, and NIH Roadmap for Medical Research. Human data was obtained from AD Knowledge Portal (https://adknowledgeportal.org), which is fully acknowledged in Table S1, and the Seattle AD Brain Cell Atlas, which is funded by NIA grant U19AG060909.
Footnotes
Declarations of Interest
The authors report no relevant conflicts of interest.
Publisher's Disclaimer: This is a PDF file of an unedited manuscript that has been accepted for publication. As a service to our customers we are providing this early version of the manuscript. The manuscript will undergo copyediting, typesetting, and review of the resulting proof before it is published in its final form. Please note that during the production process errors may be discovered which could affect the content, and all legal disclaimers that apply to the journal pertain.
References
- 1.Arranz AM, and De Strooper B (2019). The role of astroglia in Alzheimer’s disease: pathophysiology and clinical implications. Lancet Neurol 18, 406–414. 10.1016/s1474-4422(18)30490-3. [DOI] [PubMed] [Google Scholar]
- 2.Escartin C, Galea E, Lakatos A, O’Callaghan JP, Petzold GC, Serrano-Pozo A, Steinhauser C, Volterra A, Carmignoto G, Agarwal A, et al. (2021). Reactive astrocyte nomenclature, definitions, and future directions. Nat Neurosci 24, 312–325. 10.1038/s41593-020-00783-4. [DOI] [PMC free article] [PubMed] [Google Scholar]
- 3.Musiek ES, Lim MM, Yang G, Bauer AQ, Qi L, Lee Y, Roh JH, Ortiz-Gonzalez X, Dearborn JT, Culver JP, et al. (2013). Circadian clock proteins regulate neuronal redox homeostasis and neurodegeneration. J Clin Invest 123, 5389–5400. 10.1172/JCI70317 [DOI] [PMC free article] [PubMed] [Google Scholar]
- 4.Lananna BV, Nadarajah CJ, Izumo M, Cedeno MR, Xiong DD, Dimitry J, Tso CF, McKee CA, Griffin P, Sheehan PW, et al. (2018). Cell-Autonomous Regulation of Astrocyte Activation by the Circadian Clock Protein BMAL1. Cell Rep 25, 1–9 e5. 10.1016/j.celrep.2018.09.015. [DOI] [PMC free article] [PubMed] [Google Scholar]
- 5.Bunger MK, Wilsbacher LD, Moran SM, Clendenin C, Radcliffe LA, Hogenesch JB, Simon MC, Takahashi JS, and Bradfield CA (2000). Mop3 is an essential component of the master circadian pacemaker in mammals. Cell 103, 1009–1017. [DOI] [PMC free article] [PubMed] [Google Scholar]
- 6.McKee CA, Lananna BV, and Musiek ES (2020). Circadian regulation of astrocyte function: implications for Alzheimer’s disease. Cell Mol Life Sci 77, 1049–1058. 10.1007/s00018-019-03314-y. [DOI] [PMC free article] [PubMed] [Google Scholar]
- 7.McKee CA, Lee J, Cai Y, Saito T, Saido T, and Musiek ES (2022). Astrocytes deficient in circadian clock gene Bmal1 show enhanced activation responses to amyloid-beta pathology without changing plaque burden. Sci Rep 12, 1796. 10.1038/s41598-022-05862-z. [DOI] [PMC free article] [PubMed] [Google Scholar]
- 8.Kress GJ, Liao F, Dimitry J, Cedeno MR, FitzGerald GA, Holtzman DM, and Musiek ES (2018). Regulation of amyloid-beta dynamics and pathology by the circadian clock. J Exp Med 215, 1059–1068. 10.1084/jem.20172347 [DOI] [PMC free article] [PubMed] [Google Scholar]
- 9.Cirrito JR, Yamada KA, Finn MB, Sloviter RS, Bales KR, May PC, Schoepp DD, Paul SM, Mennerick S, and Holtzman DM (2005). Synaptic activity regulates interstitial fluid amyloid-beta levels in vivo. Neuron 48, 913–922. 10.1016/j.neuron.2005.10.028. [DOI] [PubMed] [Google Scholar]
- 10.Frost B, Jacks RL, and Diamond MI (2009). Propagation of tau misfolding from the outside to the inside of a cell. J Biol Chem 284, 12845–12852. 10.1074/jbc.M808759200 [DOI] [PMC free article] [PubMed] [Google Scholar]
- 11.Donnelly KM, DeLorenzo OR, Zaya AD, Pisano GE, Thu WM, Luo L, Kopito RR, and Panning Pearce MM (2020). Phagocytic glia are obligatory intermediates in transmission of mutant huntingtin aggregates across neuronal synapses. Elife 9. 10.7554/eLife.58499. [DOI] [PMC free article] [PubMed] [Google Scholar]
- 12.Toledo JB, Cairns NJ, Da X, Chen K, Carter D, Fleisher A, Householder E, Ayutyanont N, Roontiva A, Bauer RJ, et al. (2013). Clinical and multimodal biomarker correlates of ADNI neuropathological findings. Acta Neuropathol Commun 1, 65. 10.1186/2051-5960-1-65. [DOI] [PMC free article] [PubMed] [Google Scholar]
- 13.Jiwaji Z, Tiwari SS, Avilés-Reyes RX, Hooley M, Hampton D, Torvell M, Johnson DA, McQueen J, Baxter P, Sabari-Sankar K, et al. (2022). Reactive astrocytes acquire neuroprotective as well as deleterious signatures in response to Tau and Aß pathology. Nat Commun 13, 135. 10.1038/s41467-021-27702-w. [DOI] [PMC free article] [PubMed] [Google Scholar]
- 14.Yang G, Chen L, Grant GR, Paschos G, Song WL, Musiek ES, Lee V, McLoughlin SC, Grosser T, Cotsarelis G, and FitzGerald GA (2016). Timing of expression of the core clock gene Bmal1 influences its effects on aging and survival. Sci Transl Med 8, 324ra316. 10.1126/scitranslmed.aad3305 [DOI] [PMC free article] [PubMed] [Google Scholar]
- 15.Yoshiyama Y, Higuchi M, Zhang B, Huang SM, Iwata N, Saido TC, Maeda J, Suhara T, Trojanowski JQ, and Lee VM (2007). Synapse loss and microglial activation precede tangles in a P301S tauopathy mouse model. Neuron 53, 337–351. 10.1016/j.neuron.2007.01.010. [DOI] [PubMed] [Google Scholar]
- 16.Jicha GA, Bowser R, Kazam IG, and Davies P (1997). Alz-50 and MC-1, a new monoclonal antibody raised to paired helical filaments, recognize conformational epitopes on recombinant tau. J Neurosci Res 48, 128–132. . [DOI] [PubMed] [Google Scholar]
- 17.Shi Y, Yamada K, Liddelow SA, Smith ST, Zhao L, Luo W, Tsai RM, Spina S, Grinberg LT, Rojas JC, et al. (2017). ApoE4 markedly exacerbates tau-mediated neurodegeneration in a mouse model of tauopathy. Nature 549, 523–527. 10.1038/nature24016 [DOI] [PMC free article] [PubMed] [Google Scholar]
- 18.Keren-Shaul H, Spinrad A, Weiner A, Matcovitch-Natan O, Dvir-Szternfeld R, Ulland TK, David E, Baruch K, Lara-Astaiso D, Toth B, et al. (2017). A Unique Microglia Type Associated with Restricting Development of Alzheimer’s Disease. Cell 169, 1276–1290 e1217. 10.1016/j.cell.2017.05.018. [DOI] [PubMed] [Google Scholar]
- 19.Schafer DP, Lehrman EK, Kautzman AG, Koyama R, Mardinly AR, Yamasaki R, Ransohoff RM, Greenberg ME, Barres BA, and Stevens B (2012). Microglia sculpt postnatal neural circuits in an activity and complement-dependent manner. Neuron 74, 691–705. 10.1016/j.neuron.2012.03.026 [DOI] [PMC free article] [PubMed] [Google Scholar]
- 20.Luk KC, Kehm V, Carroll J, Zhang B, O’Brien P, Trojanowski JQ, and Lee VM (2012). Pathological alpha-synuclein transmission initiates Parkinson-like neurodegeneration in nontransgenic mice. Science 338, 949–953. 10.1126/science.1227157. [DOI] [PMC free article] [PubMed] [Google Scholar]
- 21.Volpicelli-Daley LA, Luk KC, Patel TP, Tanik SA, Riddle DM, Stieber A, Meaney DF, Trojanowski JQ, and Lee VM (2011). Exogenous alpha-synuclein fibrils induce Lewy body pathology leading to synaptic dysfunction and neuron death. Neuron 72, 57–71. 10.1016/j.neuron.2011.08.033. [DOI] [PMC free article] [PubMed] [Google Scholar]
- 22.Srinivasan R, Lu TY, Chai H, Xu J, Huang BS, Golshani P, Coppola G, and Khakh BS (2016). New Transgenic Mouse Lines for Selectively Targeting Astrocytes and Studying Calcium Signals in Astrocyte Processes In Situ and In Vivo. Neuron 92, 1181–1195. 10.1016/j.neuron.2016.11.030. [DOI] [PMC free article] [PubMed] [Google Scholar]
- 23.Lin H, Tang M, Ji C, Girardi P, Cvetojevic G, Chen D, Koren SA, and Johnson GVW (2022). BAG3 Regulation of RAB35 Mediates the Endosomal Sorting Complexes Required for Transport/Endolysosome Pathway and Tau Clearance. Biol Psychiat 92, 10–24. 10.1016/j.biopsych.2021.10.024. [DOI] [PMC free article] [PubMed] [Google Scholar]
- 24.Cao YL, Yang YP, Mao CJ, Zhang XQ, Wang CT, Yang J, Lv DJ, Wang F, Hu LF, and Liu CF (2017). A role of BAG3 in regulating SNCA/α-synuclein clearance via selective macroautophagy. Neurobiol Aging 60, 104–115. 10.1016/j.neurobiolaging.2017.08.023. [DOI] [PubMed] [Google Scholar]
- 25.Fu H, Possenti A, Freer R, Nakano Y, Hernandez Villegas NC, Tang M, Cauhy PVM, Lassus BA, Chen S, Fowler SL, et al. (2019). A tau homeostasis signature is linked with the cellular and regional vulnerability of excitatory neurons to tau pathology. Nat Neurosci 22, 47–56. 10.1038/s41593-018-0298-7. [DOI] [PMC free article] [PubMed] [Google Scholar]
- 26.Ji C, Tang M, Zeidler C, Hohfeld J, and Johnson GV (2019). BAG3 and SYNPO (synaptopodin) facilitate phospho-MAPT/Tau degradation via autophagy in neuronal processes. Autophagy 15, 1199–1213. 10.1080/15548627.2019.1580096. [DOI] [PMC free article] [PubMed] [Google Scholar]
- 27.Nalls MA, Blauwendraat C, Vallerga CL, Heilbron K, Bandres-Ciga S, Chang D, Tan M, Kia DA, Noyce AJ, Xue A, et al. (2019). Identification of novel risk loci, causal insights, and heritable risk for Parkinson’s disease: a meta-analysis of genome-wide association studies. Lancet Neurol 18, 1091–1102. 10.1016/s1474-4422(19)30320-5. [DOI] [PMC free article] [PubMed] [Google Scholar]
- 28.Colas C, Menezes S, Gutiérrez-Martínez E, Péan CB, Dionne MS, and Guermonprez P (2014). An improved flow cytometry assay to monitor phagosome acidification. J Immunol Methods 412, 1–13. 10.1016/j.jim.2014.06.008. [DOI] [PubMed] [Google Scholar]
- 29.Seidel K, Vinet J, Dunnen WF, Brunt ER, Meister M, Boncoraglio A, Zijlstra MP, Boddeke HW, Rüb U, Kampinga HH, and Carra S (2012). The HSPB8-BAG3 chaperone complex is upregulated in astrocytes in the human brain affected by protein aggregation diseases. Neuropathol Appl Neurobiol 38, 39–53. 10.1111/j.1365-2990.2011.01198.x. [DOI] [PubMed] [Google Scholar]
- 30.Wang M, Roussos P, McKenzie A, Zhou X, Kajiwara Y, Brennand KJ, De Luca GC, Crary JF, Casaccia P, Buxbaum JD, et al. (2016). Integrative network analysis of nineteen brain regions identifies molecular signatures and networks underlying selective regional vulnerability to Alzheimer’s disease. Genome Med 8, 104. 10.1186/s13073-016-0355-3. [DOI] [PMC free article] [PubMed] [Google Scholar]
- 31.Brase L, You SF, D’Oliveira Albanus R, Del-Aguila JL, Dai Y, Novotny BC, Soriano-Tarraga C, Dykstra T, Fernandez MV, Budde JP, et al. (2023). Single-nucleus RNA-sequencing of autosomal dominant Alzheimer disease and risk variant carriers. Nat Commun 14, 2314. 10.1038/s41467-023-37437-5. [DOI] [PMC free article] [PubMed] [Google Scholar]
- 32.Habib N, McCabe C, Medina S, Varshavsky M, Kitsberg D, Dvir-Szternfeld R, Green G, Dionne D, Nguyen L, Marshall JL, et al. (2020). Disease-associated astrocytes in Alzheimer’s disease and aging. Nat Neurosci 23, 701–706. 10.1038/s41593-020-0624-8. [DOI] [PMC free article] [PubMed] [Google Scholar]
- 33.Grenn FP, Kim JJ, Makarious MB, Iwaki H, Illarionova A, Brolin K, Kluss JH, Schumacher-Schuh AF, Leonard H, Faghri F, et al. (2020). The Parkinson’s Disease Genome-Wide Association Study Locus Browser. Mov Disord 35, 2056–2067. 10.1002/mds.28197. [DOI] [PMC free article] [PubMed] [Google Scholar]
- 34.John Lin CC, Yu K, Hatcher A, Huang TW, Lee HK, Carlson J, Weston MC, Chen F, Zhang Y, Zhu W, et al. (2017). Identification of diverse astrocyte populations and their malignant analogs. Nat Neurosci 20, 396–405. 10.1038/nn.4493. [DOI] [PMC free article] [PubMed] [Google Scholar]
- 35.Bayraktar OA, Bartels T, Holmqvist S, Kleshchevnikov V, Martirosyan A, Polioudakis D, Ben Haim L, Young AMH, Batiuk MY, Prakash K, et al. (2020). Astrocyte layers in the mammalian cerebral cortex revealed by a single-cell in situ transcriptomic map. Nat Neurosci 23, 500–509. 10.1038/s41593-020-0602-1. [DOI] [PMC free article] [PubMed] [Google Scholar]
- 36.Molofsky AV, Kelley KW, Tsai HH, Redmond SA, Chang SM, Madireddy L, Chan JR, Baranzini SE, Ullian EM, and Rowitch DH (2014). Astrocyte-encoded positional cues maintain sensorimotor circuit integrity. Nature 509, 189–194. 10.1038/nature13161. [DOI] [PMC free article] [PubMed] [Google Scholar]
- 37.Chai H, Diaz-Castro B, Shigetomi E, Monte E, Octeau JC, Yu X, Cohn W, Rajendran PS, Vondriska TM, Whitelegge JP, et al. (2017). Neural Circuit-Specialized Astrocytes: Transcriptomic, Proteomic, Morphological, and Functional Evidence. Neuron 95, 531–549.e539. 10.1016/j.neuron.2017.06.029. [DOI] [PMC free article] [PubMed] [Google Scholar]
- 38.Huang AY, Woo J, Sardar D, Lozzi B, Bosquez Huerta NA, Lin CJ, Felice D, Jain A, Paulucci-Holthauzen A, and Deneen B (2020). Region-Specific Transcriptional Control of Astrocyte Function Oversees Local Circuit Activities. Neuron 106, 992–1008.e1009. 10.1016/j.neuron.2020.03.025. [DOI] [PMC free article] [PubMed] [Google Scholar]
- 39.Molofsky AV, Krencik R, Ullian EM, Tsai HH, Deneen B, Richardson WD, Barres BA, and Rowitch DH (2012). Astrocytes and disease: a neurodevelopmental perspective. Genes Dev 26, 891–907. 10.1101/gad.188326.112. [DOI] [PMC free article] [PubMed] [Google Scholar]
- 40.Sadick JS, O’Dea MR, Hasel P, Dykstra T, Faustin A, and Liddelow SA (2022). Astrocytes and oligodendrocytes undergo subtype-specific transcriptional changes in Alzheimer’s disease. Neuron 110, 1788–1805.e1710. 10.1016/j.neuron.2022.03.008. [DOI] [PMC free article] [PubMed] [Google Scholar]
- 41.Khakh BS, and Deneen B (2019). The Emerging Nature of Astrocyte Diversity. Annu Rev Neurosci 42, 187–207. 10.1146/annurev-neuro-070918-050443. [DOI] [PubMed] [Google Scholar]
- 42.Laug D, Huang TW, Huerta NAB, Huang AY, Sardar D, Ortiz-Guzman J, Carlson JC, Arenkiel BR, Kuo CT, Mohila CA, et al. (2019). Nuclear factor I-A regulates diverse reactive astrocyte responses after CNS injury. J Clin Invest 129, 4408–4418. 10.1172/jci127492. [DOI] [PMC free article] [PubMed] [Google Scholar]
- 43.Diaz-Castro B, Gangwani MR, Yu X, Coppola G, and Khakh BS (2019). Astrocyte molecular signatures in Huntington’s disease. Sci Transl Med 11, eaaw8546. 10.1126/scitranslmed.aaw8546. [DOI] [PubMed] [Google Scholar]
- 44.Abjean L, Ben Haim L, Riquelme-Perez M, Gipchtein P, Derbois C, Palomares MA, Petit F, Hérard AS, Gaillard MC, Guillermier M, et al. (2022). Reactive astrocytes promote proteostasis in Huntington’s disease through the JAK2-STAT3 pathway. Brain 146, 149–166. 10.1093/brain/awac068. [DOI] [PubMed] [Google Scholar]
- 45.Mann CN, Devi SS, Kersting CT, Bleem AV, Karch CM, Holtzman DM, and Gallardo G (2022). Astrocytic α2-Na(+)/K(+) ATPase inhibition suppresses astrocyte reactivity and reduces neurodegeneration in a tauopathy mouse model. Sci Transl Med 14, eabm4107. 10.1126/scitranslmed.abm4107. [DOI] [PMC free article] [PubMed] [Google Scholar]
- 46.Early JO, Menon D, Wyse CA, Cervantes-Silva MP, Zaslona Z, Carroll RG, Palsson-McDermott EM, Angiari S, Ryan DG, Corcoran SE, et al. (2018). Circadian clock protein BMAL1 regulates IL-1β in macrophages via NRF2. Proc Natl Acad Sci USA 115, E8460–e8468. 10.1073/pnas.1800431115. [DOI] [PMC free article] [PubMed] [Google Scholar]
- 47.Lee J, Moulik M, Fang Z, Saha P, Zou F, Xu Y, Nelson DL, Ma K, Moore DD, and Yechoor VK (2013). Bmal1 and beta-cell clock are required for adaptation to circadian disruption, and their loss of function leads to oxidative stress-induced beta-cell failure in mice. Mol Cell Biol 33, 2327–2338. 10.1128/MCB.01421-12. [DOI] [PMC free article] [PubMed] [Google Scholar]
- 48.Lananna BV, McKee CA, King MW, Del-Aguila JL, Dimitry JM, Farias FHG, Nadarajah CJ, Xiong DD, Guo C, Cammack AJ, et al. (2020). Chi3l1/YKL-40 is controlled by the astrocyte circadian clock and regulates neuroinflammation and Alzheimer’s disease pathogenesis. Sci Transl Med 12, eaax3519. 10.1126/scitranslmed.aax3519. [DOI] [PMC free article] [PubMed] [Google Scholar]
- 49.Loria F, Vargas JY, Bousset L, Syan S, Salles A, Melki R, and Zurzolo C (2017). alpha-Synuclein transfer between neurons and astrocytes indicates that astrocytes play a role in degradation rather than in spreading. Acta Neuropathol 134, 789–808. 10.1007/s00401-017-1746-2. [DOI] [PubMed] [Google Scholar]
- 50.Maté de Gérando A, d’Orange M, Augustin E, Joséphine C, Aurégan G, Gaudin-Guérif M, Guillermier M, Hérard AS, Stimmer L, Petit F, et al. (2021). Neuronal tau species transfer to astrocytes and induce their loss according to tau aggregation state. Brain 144, 1167–1182. 10.1093/brain/awab011. [DOI] [PubMed] [Google Scholar]
- 51.Yu EA, and Weaver DR (2011). Disrupting the circadian clock: gene-specific effects on aging, cancer, and other phenotypes. Aging 3, 479–493. [DOI] [PMC free article] [PubMed] [Google Scholar]
- 52.Stoyka LE, Arrant AE, Thrasher DR, Russell DL, Freire J, Mahoney CL, Narayanan A, Dib AG, Standaert DG, and Volpicelli-Daley LA (2020). Behavioral defects associated with amygdala and cortical dysfunction in mice with seeded α-synuclein inclusions. Neurobiol Dis 134, 104708. 10.1016/j.nbd.2019.104708. [DOI] [PMC free article] [PubMed] [Google Scholar]
- 53.Druzd D, Matveeva O, Ince L, Harrison U, He W, Schmal C, Herzel H, Tsang AH, Kawakami N, Leliavski A, et al. (2017). Lymphocyte Circadian Clocks Control Lymph Node Trafficking and Adaptive Immune Responses. Immunity 46, 120–132. 10.1016/j.immuni.2016.12.011. [DOI] [PMC free article] [PubMed] [Google Scholar]
- 54.Sutton CE, Finlay CM, Raverdeau M, Early JO, DeCourcey J, Zaslona Z, O’Neill LAJ, Mills KHG, and Curtis AM (2017). Loss of the molecular clock in myeloid cells exacerbates T cell-mediated CNS autoimmune disease. Nat Commun 8, 1923. 10.1038/s41467-017-02111-0. [DOI] [PMC free article] [PubMed] [Google Scholar]
- 55.Slomnicki LP, Myers SA, Saraswat Ohri S, Parsh MV, Andres KR, Chariker JH, Rouchka EC, Whittemore SR, and Hetman M (2020). Improved locomotor recovery after contusive spinal cord injury in Bmal1(−/−) mice is associated with protection of the blood spinal cord barrier. Sci Rep 10, 14212. 10.1038/s41598-020-71131-6. [DOI] [PMC free article] [PubMed] [Google Scholar]
- 56.Xu F, Kula-Eversole E, Iwanaszko M, Hutchison AL, Dinner A, and Allada R (2019). Circadian Clocks Function in Concert with Heat Shock Organizing Protein to Modulate Mutant Huntingtin Aggregation and Toxicity. Cell Rep 27, 59–70.e54. 10.1016/j.celrep.2019.03.015. [DOI] [PMC free article] [PubMed] [Google Scholar]
- 57.Filipello F, Morini R, Corradini I, Zerbi V, Canzi A, Michalski B, Erreni M, Markicevic M, Starvaggi-Cucuzza C, Otero K, et al. (2018). The Microglial Innate Immune Receptor TREM2 Is Required for Synapse Elimination and Normal Brain Connectivity. Immunity 48, 979–991.e978. 10.1016/j.immuni.2018.04.016. [DOI] [PubMed] [Google Scholar]
- 58.Kim JY, Grunke SD, Levites Y, Golde TE, and Jankowsky JL (2014). Intracerebroventricular viral injection of the neonatal mouse brain for persistent and widespread neuronal transduction. J Vis Exp, 51863. 10.3791/51863. [DOI] [PMC free article] [PubMed] [Google Scholar]
- 59.Volpicelli-Daley LA, Luk KC, and Lee VM (2014). Addition of exogenous alpha-synuclein preformed fibrils to primary neuronal cultures to seed recruitment of endogenous alpha-synuclein to Lewy body and Lewy neurite-like aggregates. Nature protocols 9, 2135–2146. 10.1038/nprot.2014.143. [DOI] [PMC free article] [PubMed] [Google Scholar]
- 60.Del-Aguila JL, Li Z, Dube U, Mihindukulasuriya KA, Budde JP, Fernandez MV, Ibanez L, Bradley J, Wang F, Bergmann K, et al. (2019). A single-nuclei RNA sequencing study of Mendelian and sporadic AD in the human brain. Alzheimers Res Ther 11, 71. 10.1186/s13195-019-0524-x. [DOI] [PMC free article] [PubMed] [Google Scholar]
- 61.Love MI, Huber W, Anders S (2014). Moderated estimation of fold change and dispersion for RNA-seq data with DESeq2. Genome Biology, 15, 550. 10.1186/s13059-014-0550-8 [DOI] [PMC free article] [PubMed] [Google Scholar]
- 62.Wickham H (2009) ggplot2: Elegant Graphics for Data Analysis (Springer; New York, NY: ) [Google Scholar]
Associated Data
This section collects any data citations, data availability statements, or supplementary materials included in this article.
Supplementary Materials
Data Availability Statement
This paper analyzes existing, publicly available data. These accession numbers for the datasets are listed in the key resources table
This paper does not report original code.
Any additional information required to reanalyze the data reported in this paper is available from the lead contact upon request