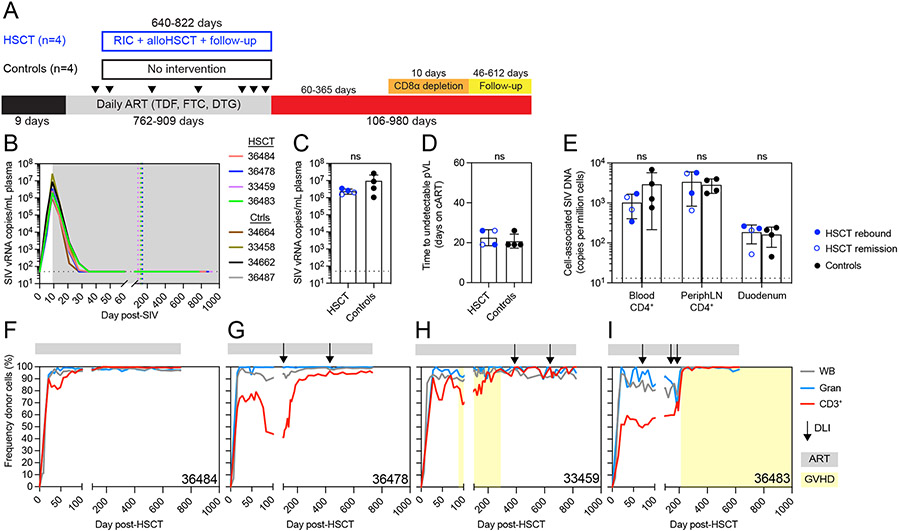
Figure 1. Reduced intensity alloHSCT in ART-suppressed SIVmac239-infected MCMs.
(A) Study outline for a cohort of alloHSCT (n=4) and time-matched no-transplant control (n=4) MCM. RIC = reduced intensity conditioning, ATI = analytic treatment interruption. Black arrows indicate biopsy timepoints. (B) Longitudinal SIVmac239 plasma viral loads from infection until ATI. Gray box denotes ART treatment. Colored dotted vertical lines indicate the day of HSCT for each recipient. Black dotted horizontal lines in B-D indicate the limit of quantification (LOQ = 50 copies/mL). Undetectable values are graphed at the LOQ. (C) Peak SIVmac239 plasma viral loads (day 9 post-infection, day of ART initiation). ns = not significantly different by Mann-Whitney test (C and D). Bars show mean ±SD (C-E). (D) Time to suppression of plasma viremia (days on ART). (E) Cell-associated SIV DNA copies in blood and tissues from HSCT recipients (blue, n=4) prior to alloHSCT and controls (black, n=4). HSCT recipients in SIV remission post-ATI are shown in open symbols. Black dotted horizontal lines indicate the LOQ for SIV DNA (13 copies/million cells). Undetectable values are graphed at 1. ns = not significantly different by repeated measures ANOVA. (F-I) Longitudinal donor chimerism in whole blood, blood granulocytes (Gran), and blood T cells (CD3+) in the alloHSCT recipients, from HSCT until ATI. Donor lymphocyte infusions (DLIs) are shown in the black arrows (see Figure S1C for doses). Gray bars above each graph denote ART treatment. Yellow boxes denote clinical GVHD. See also figures S1, S2, S3, S4.

