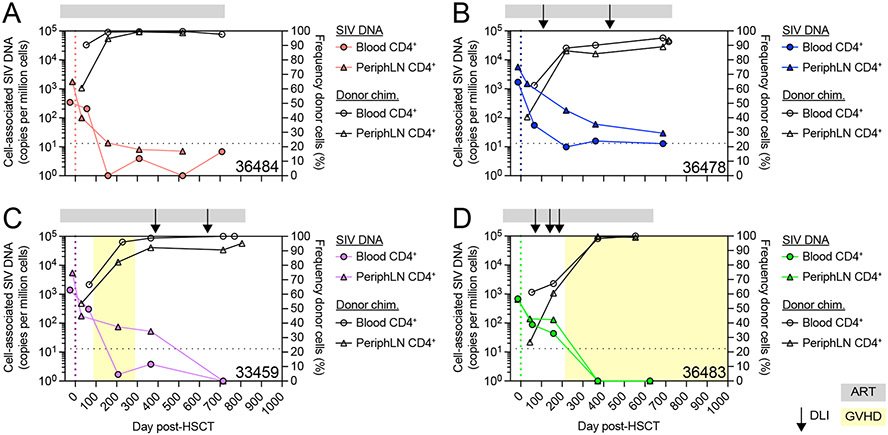
Figure 3. SIV DNA persists early post-HSCT but decreases as CD4+ T cell donor chimerism increases.
(A-D) Longitudinal CD4+ T cell-associated SIV DNA copy number (colored symbols, left axis) and CD4+ T cell donor chimerism (open black symbols, right axis) in the alloHSCT recipients from Figure 1. DLIs are shown as black arrows. Colored dotted vertical lines indicate the day of HSCT. Gray bars above each graph denote ART treatment. Yellow boxes denote clinical GVHD. Black dotted horizontal lines indicate the LOQ for SIV DNA (13 copies/million cells). Undetectable SIV DNA values are graphed at 1.

