Abstract
Background and Purpose:
Volumetric and densitometric biomarkers have been proposed to better quantify cerebral edema after stroke, but their relative performance has not been rigorously evaluated.
Methods:
Patients with large vessel occlusion stroke from three institutions were analyzed. An automated pipeline extracted brain, CSF and infarct volumes from serial CTs. Several biomarkers were measured: change in global CSF volume from baseline (ΔCSF); ratio of CSF volumes between hemispheres (CSF ratio); and relative density of infarct region compared with mirrored contralateral region (net water uptake, NWU). These were compared to radiographic standards, midline shift and relative hemispheric volume (RHV) and malignant edema, defined as deterioration resulting in need for osmotic therapy, decompressive surgery, or death.
Results:
We analyzed 255 patients with 210 baseline CTs, 255 24-hour CTs, and 81 72-hour CTs. Of these, 35(14%) developed malignant edema and 63(27%) midline shift. CSF metrics could be calculated for 310(92%) while NWU could only be obtained from 193(57%). Peak midline shift was correlated with baseline CSF ratio (ρ=−0.22) and with CSF ratio and ΔCSF at 24 hours (ρ=−0.55/0.63) and 72 hours (ρ=−0.66/0.69), but not with NWU (ρ=0.15/0.25). Similarly, CSF ratio was correlated with RHV (ρ=−0.69/−0.78), NWU was not. Adjusting for age, National Institutes of Health Stroke Scale, tissue plasminogen activator treatment, and Alberta Stroke Program Early CT Score, CSF ratio [Odds Ratio (OR) 1.95 per 0.1, 95% Confidence Interval (CI) 1.52–2.59] and ΔCSF at 24 hours (OR 1.87 per 10%, CI 1.47–2.49) were associated with malignant edema.
Conclusion:
CSF volumetric biomarkers can be automatically measured from almost all routine CTs and correlate better with standard edema endpoints than net water uptake.
Keywords: Stroke, Cerebral Edema, Computed Tomography, Biomarkers, Cerebrospinal Fluid, Brain Water, Midline Shift
Introduction:
Most patients with hemispheric strokes develop cerebral edema over the first few days after the ischemic insult. Cerebral edema is not only a major source of death and deterioration in the acute setting, but increased severity of edema has been independently related to worse long-term outcomes.1,2 Midline shift of variable degrees develops in almost half of all large vessel occlusion (LVO) strokes in the anterior circulation.3 While this may begin to be visible by 24 hours, it is primarily a manifestation of decompensated late-stage edema, peaking two to four days post-stroke. Detection of edema before midline shift and clinical deterioration occurs has been the subject of increasing interest.4 This would allow selection of patients for targeted interventions to reduce the impact of edema after stroke.5 Furthermore, quantification of edema across its full spectrum would facilitate a broader understanding of its biologic basis and contribution to stroke outcomes.6
Prior approaches proposed to quantify edema have required advanced imaging, either comparison of diffusion-weighted imaging and fluid-attenuated inversion recovery volumes on serial MRI examinations, or by measuring the relative hemispheric volume (RHV) on MRI, using the increase in size of the ipsilateral hemisphere as a surrogate of stroke-related swelling.7,8 Accurate automated CT-based measures would facilitate more widespread applications, as CT is the primary imaging modality after stroke. Infarct volume alone cannot be used to measure edema, as the infarct-related hypodensity comprises a variable combination of infarcted tissue and resulting edema. It is the excess water that contributes to hemispheric swelling and eventually results in midline shift. Several biomarkers that quantify water accumulation or hemispheric or global brain swelling have been developed over the past five years including net water uptake and those based on changes in CSF volume.9–13 Net water uptake (NWU) measures the relative density of the stroke lesion compared with a matching contralateral region as a surrogate for water accumulation.13. It has been applied primarily in the acute setting, where early edema formation on baseline CT has been related to worse collaterals, hyperglycemia, and to risk of malignant edema.9,14–16 Fewer studies have evaluated NWU as a marker of evolving edema on follow-up CTs; in fact, a recent evaluation of NWU challenged its validity in relation to reference standards of midline shift and RHV in the LVO population undergoing thrombectomy.17 Furthermore, measurement of NWU typically requires manual delineation of the infarct lesion, limiting ease of measurement.18 A second approach focuses on the volumetric assessment of swelling using the surrogate of global or hemispheric reductions in CSF volumes.10–12
Both these densitometric and volumetric CT-based approaches have been proposed as means of better quantifying edema in order to predict midline shift and subsequent clinical deterioration (including the need for decompressive surgery) and as a therapeutic biomarker to assess response to emerging anti-edema interventions.4,9,19 Such tools could facilitate both clinical and research endeavors to mitigate the consequences of cerebral edema after stroke. However, it remains unclear how these two classes of biomarkers are related and whether one or the other better capture brain swelling and risk of deterioration, as no side-by-side studies have been performed. In this study, we used an automated image analysis pipeline recently developed to measure both NWU and CSF volumes on serial CTs, the primary imaging modality used at most centers,20 to extract these biomarkers from a large multi-institutional cohort of anterior circulation LVO patients. We hypothesized that volumetric biomarkers such as global displacement of CSF (change in global CSF volume from baseline, ΔCSF) and hemispheric CSF ratio would relate to established radiographic and clinical edema outcomes better than densitometric markers of edema like NWU.
Methods
Cohort and Subject Selection
We retrospectively collected clinical and imaging data from three institutional stroke cohorts encompassing consecutive patients presenting between June 2016 to November 2019. The collection of data for each cohort was approved by the respective institution’s human studies review board with a waiver of consent. Imaging data were collected in a central stroke repository.21 They were analyzed using an image analysis pipeline, described below. Subjects were included in this analysis if they were diagnosed with stroke due to an acute occlusion of the internal carotid or middle cerebral artery and had follow-up imaging performed in the first week after stroke. Time of last seen normal was used when exact stroke onset time was unknown. We selected follow-up CTs performed at least 12 hours after stroke onset and within one week. The majority of patients had routine follow-up imaging performed at 24 hours after thrombolysis and/or thrombectomy per site protocol. A baseline CT was also available for most patients, allowing calculation of ΔCSF. Clinical variables were abstracted from medical records (including structured stroke team notes) at each site by trained study investigators. These included demographics, last seen normal time, admission National Institutes of Health Stroke Scale (NIHSS), treatment with tissue plasminogen activator (tPA) and/or endovascular thrombectomy, reperfusion (using modified thrombolysis in cerebral infarction scale grading, reported at the time of thrombectomy), and development of malignant cerebral edema, defined as radiographic evidence of brain swelling (i.e. midline shift) in association with both clinical deterioration and resulting in either death, surgical intervention, or treatment with osmotic drugs.
Imaging Analysis
We refined a stroke edema pipeline to extract multiple edema biomarkers. This included segmentation of CSF using a machine learning approach,22 followed by extraction of the brain using BET (from the FSL package),23 and delineation of the two cerebral hemispheres by registering the brain midline to a standard CT atlas and then translating the midline on the atlas back to the patient’s image.24 This allowed the separation of CSF and brain regions into hemispheres and the calculation of brain and CSF hemispheric ratios.10 The RHV was the ratio of the volume of the brain in the stroke-affected hemisphere versus the contralateral hemisphere and the CSF ratio was the ratio of the volume of CSF in the stroke-affected hemisphere versus the contralateral hemisphere.7 We recently expanded the pipeline to automatically extract NWU from routine follow-up CTs by: 1) segmenting the hypodense region of acute cerebral infarction using a deep learning algorithm trained on 335 manually labeled examples20; and 2) measuring the density of the infarct region and a mirrored region placed in the contralateral hemisphere, using the brain midline for reflection. Measurement of NWU was further refined by removing voxels of CSF from the infarct and mirror regions to avoid contamination, as well as thresholding the infarct region at 40 Hounsfield Units to remove high-density regions that could represent hemorrhagic transformation or contrast staining and would otherwise contaminate measurement (as recently demonstrated).17 This pipeline was validated against manual measurement of NWU (both full-infarct and sampling-based methods) in a recent publication.20 The final imaging results for an example patient are shown in Figure 1.
Figure 1:
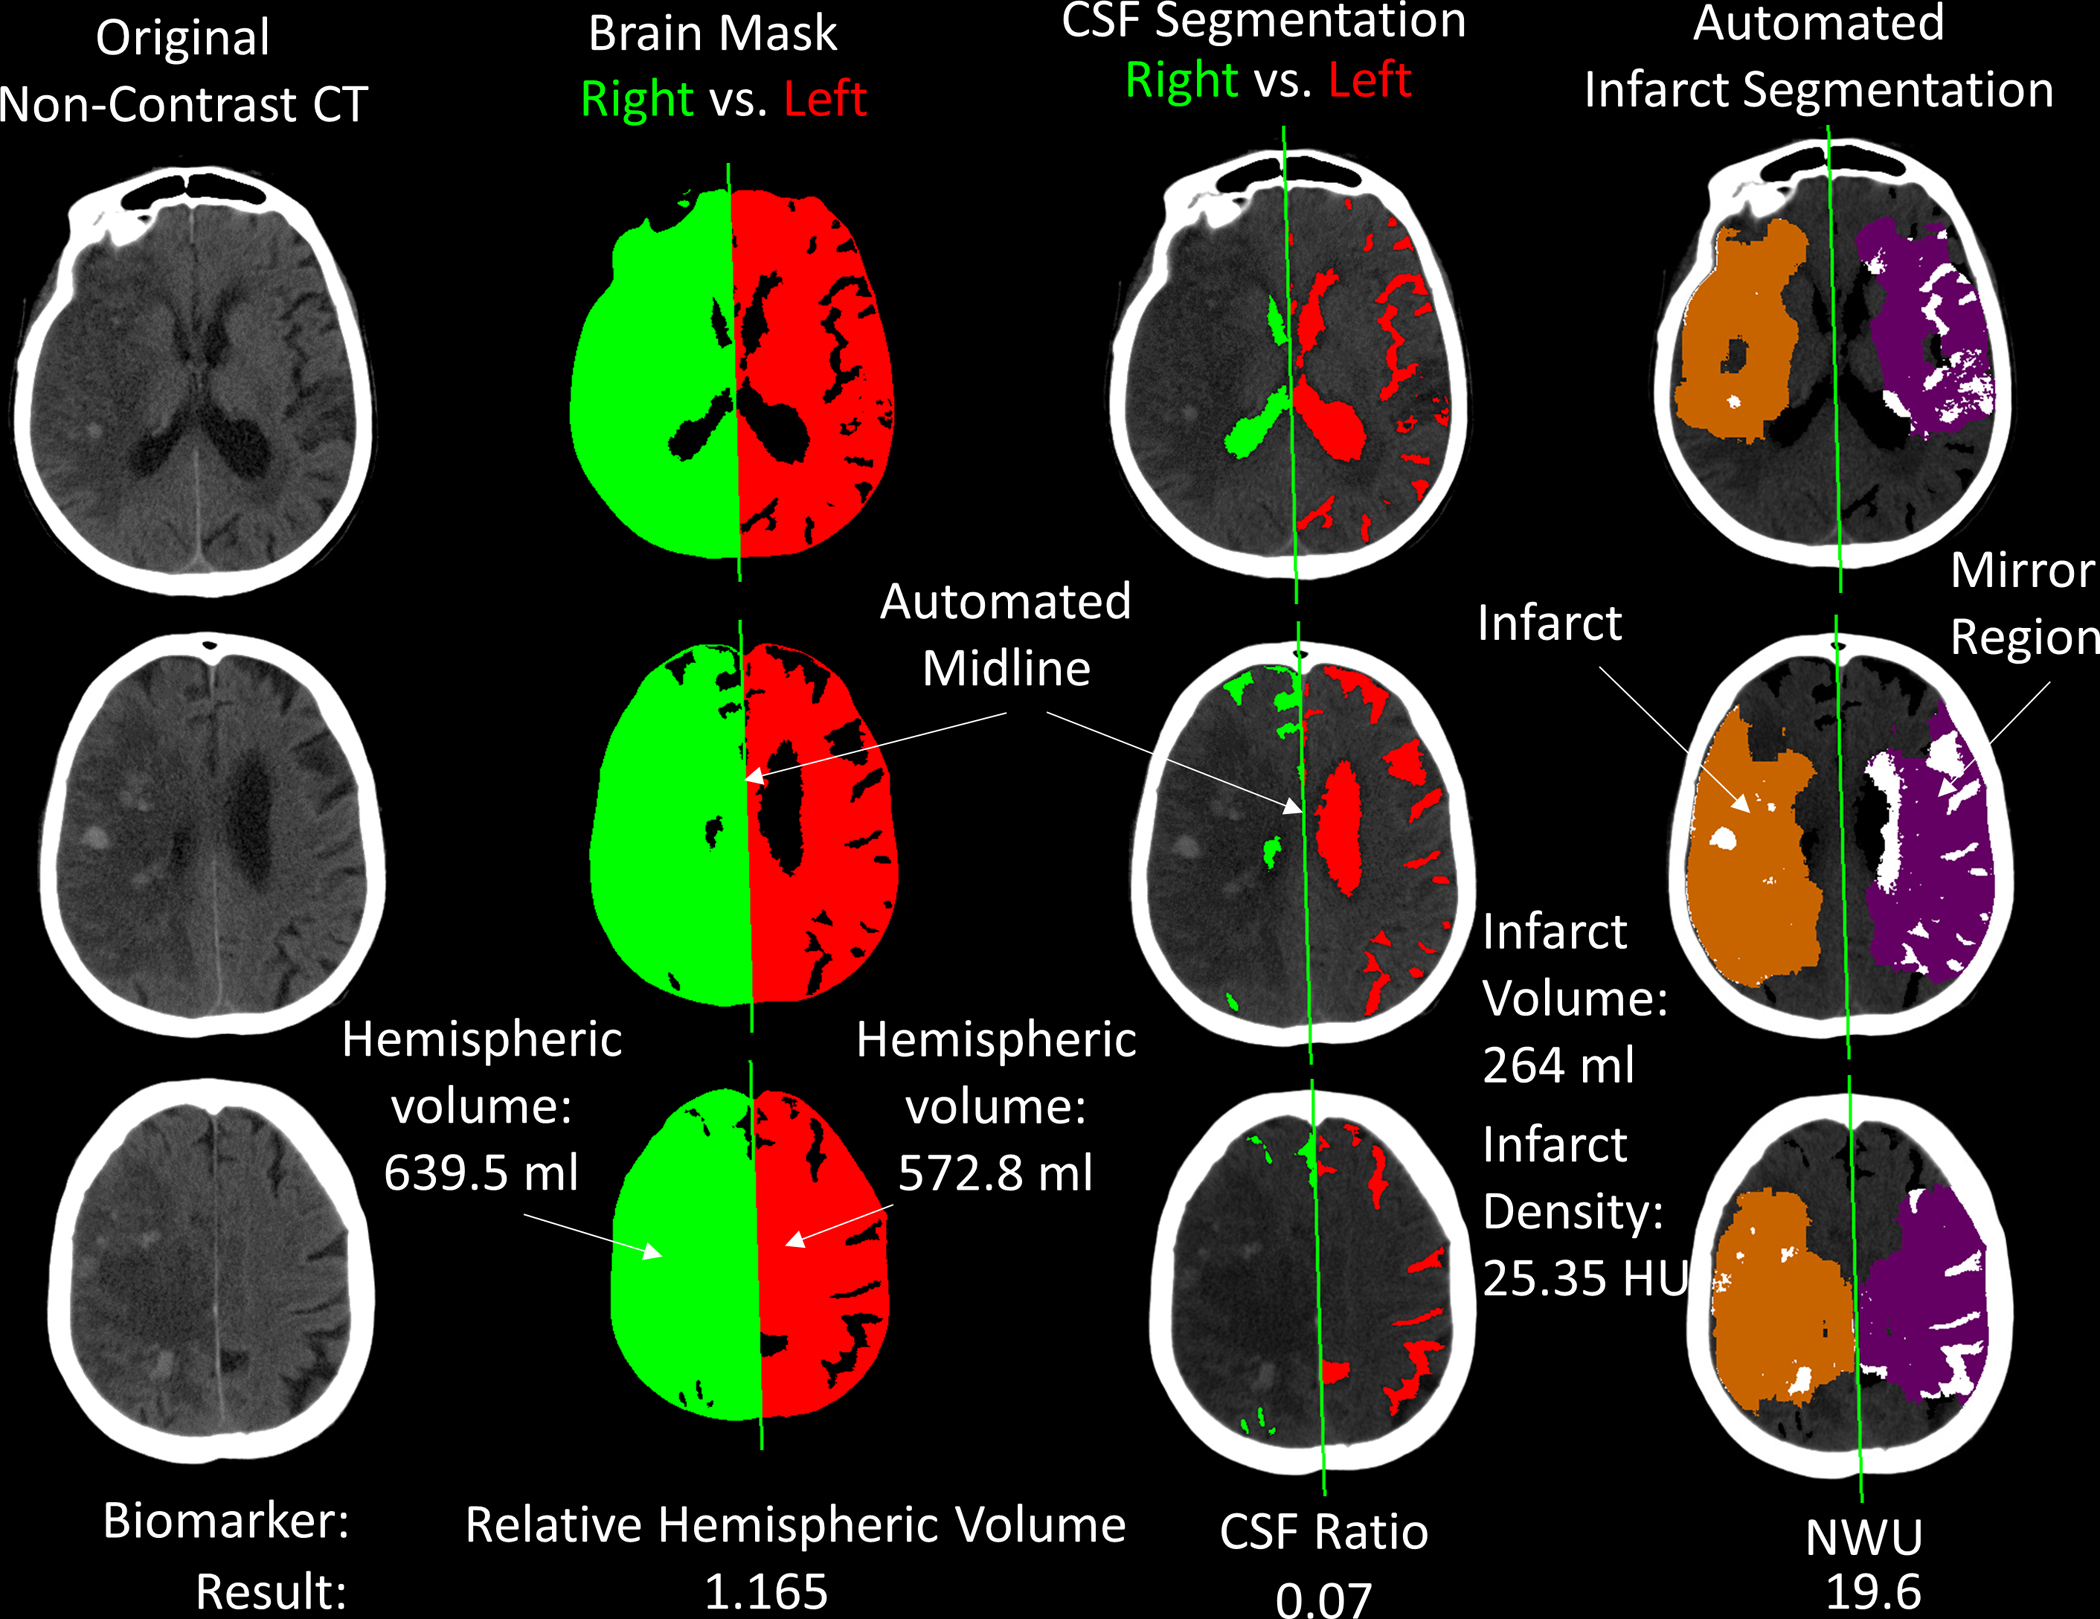
Output of image analysis for a follow-up CT at 72 hours after stroke for a patient with large right hemispheric infarction. The first column shows three axial slices from the non-contrast head CT (note: there are several regions of petechial hemorrhagic transformation and there was 3-mm of midline shift measured). The second column shows the extracted brain mask with automated delineation of the midline, separating the brain into right (ipsilateral) and left (contralateral) hemispheres. This allows calculation of the relative hemispheric volume (1.165). The third column shows the automated cerebrospinal fluid (CSF) segmentation, with hemispheric CSF separated using the same midline. The ratio of hemispheric CSF volumes is 0.07. In the final column, the orange region highlights the automated infarct segmentation. White regions within this represent areas thresholded out (i.e. Hounsfield units above 40). The purple region is the mirror of the infarct region within the contralateral hemisphere. The white regions within this represent areas of CSF not included in the mean density calculation. The ratio of infarct to mirror region densities is the net water uptake. Abbreviations: CSF = cerebrospinal fluid, ml = milliliters, HU = Hounsfield units, NWU = Net Water Uptake
We applied this pipeline to calculate ΔCSF, the hemispheric CSF ratio, RHV, and NWU from this multi-institutional cohort of anterior circulation LVO patients. We applied it to both baseline and follow-up CTs, though we excluded those without visible infarction from NWU but not CSF calculation, as NWU cannot be calculated in the absence of a visible lesion (no infarct was present in 45% of scans at 24 hours and 21% at 72 hours; NWU could be measured from all but eleven of those with infarcts, representing a total of only 193 follow-up CTs or 57%). We performed manual review of the automated imaging results for quality control and exclusion of: 1) cases where CSF segmentation or midline delineation failed (5 baseline, 15 24-hour CTs, and 9 72-hour CTs failed segmentation, ratio could not be obtained from one additional baseline and two scans at 24 hours – failed in 6% of 546 CTs ); 2) cases without visible infarct or where automated infarct segmentation failed to capture the majority of the lesion. Midline shift was measured manually as the displacement of the midpoint of the septum pellucidum at the level of its maximal displacement (evaluating over several slices around the level of the frontal horns) and presence/severity of hemorrhagic transformation was ascertained.25
Statistical Analysis
The first CT performed within 12 hours of stroke onset was considered the baseline. Follow-up CTs were categorized into those closest to 24-hours (12–36 hours) and those closest to 72 hours (36–168 hours). The change in CSF volume between the baseline and each follow-up time point was calculated (ΔCSF). The peak midline shift was the maximal measured shift on all follow-up CTs. Correlations of biomarkers were performed using Spearman rho (ρ) given their non-parametric distribution. Partial correlations, adjusting for infarct volume, were also performed. Logistic regression was used to evaluate the independent association of each biomarker with malignant edema, adjusting for baseline variables, as well as tPA treatment and reperfusion status (in those undergoing thrombectomy). We compared the performance of midline shift and other biomarkers by: i) comparing the Aikake Information Criterion (AIC) performance of each model to one using midline shift to predict malignant edema; ii) adjusting the biomarker-based model for midline shift to determine if the association persisted. Given the a priori concern that the performance of NWU may differ in those undergoing thrombectomy and in those with hemorrhagic transformation, we performed sensitivity analyses stratified by thrombectomy and hemorrhagic transformation status. To evaluate the temporal evolution of each biomarker across the three time points, we constructed linear mixed models to analyze the repeated measurements, stratified by malignant edema groups. We used the actual time (not time bins) to each scan as the time variable and the measurement of each biomarker at each time point as the dependent variable. We evaluate the interaction of time and grouping, adjusting for the intra-subject correlations as random effects. All analyses were performed in R (version 4.0.3, R Foundation for Statistical Computing, Vienna, Austria) using packages corrplot, ppcor, and lmerTest.
Results
Subjects, Scans, and Clinical Characteristics:
Of 392 stroke patients evaluated, forty-seven were excluded for unknown stroke onset time, no LVO present on review of CT angiography, or occlusion not in the internal carotid artery (ICA) or middle cerebral artery (MCA) vessels (Figure 2). No imaging was available for seven of the remaining 352 anterior circulation LVO subjects, and an additional eleven had no usable images after excluding poor quality or technically unusable scans. Among the remaining 334, 79 had only baseline CTs or no follow-up CTs beyond 12 hours, leaving 255 subjects with required follow-up imaging available. All had scans around 24 hours after stroke onset [median 25.8 hours, Interquartile Range (IQR) 21–30] and 81 had additional follow-up scans around 72 hours (median 70 hours, IQR 55–87). No baseline CT was available in 45 cases, primarily because it had been performed at another outside facility or in cases of delayed presentation (i.e. when first CT was beyond 12 hours). The median time to baseline CT from stroke onset was 2.2 hours (IQR 0.9–4.3).
Figure 2:
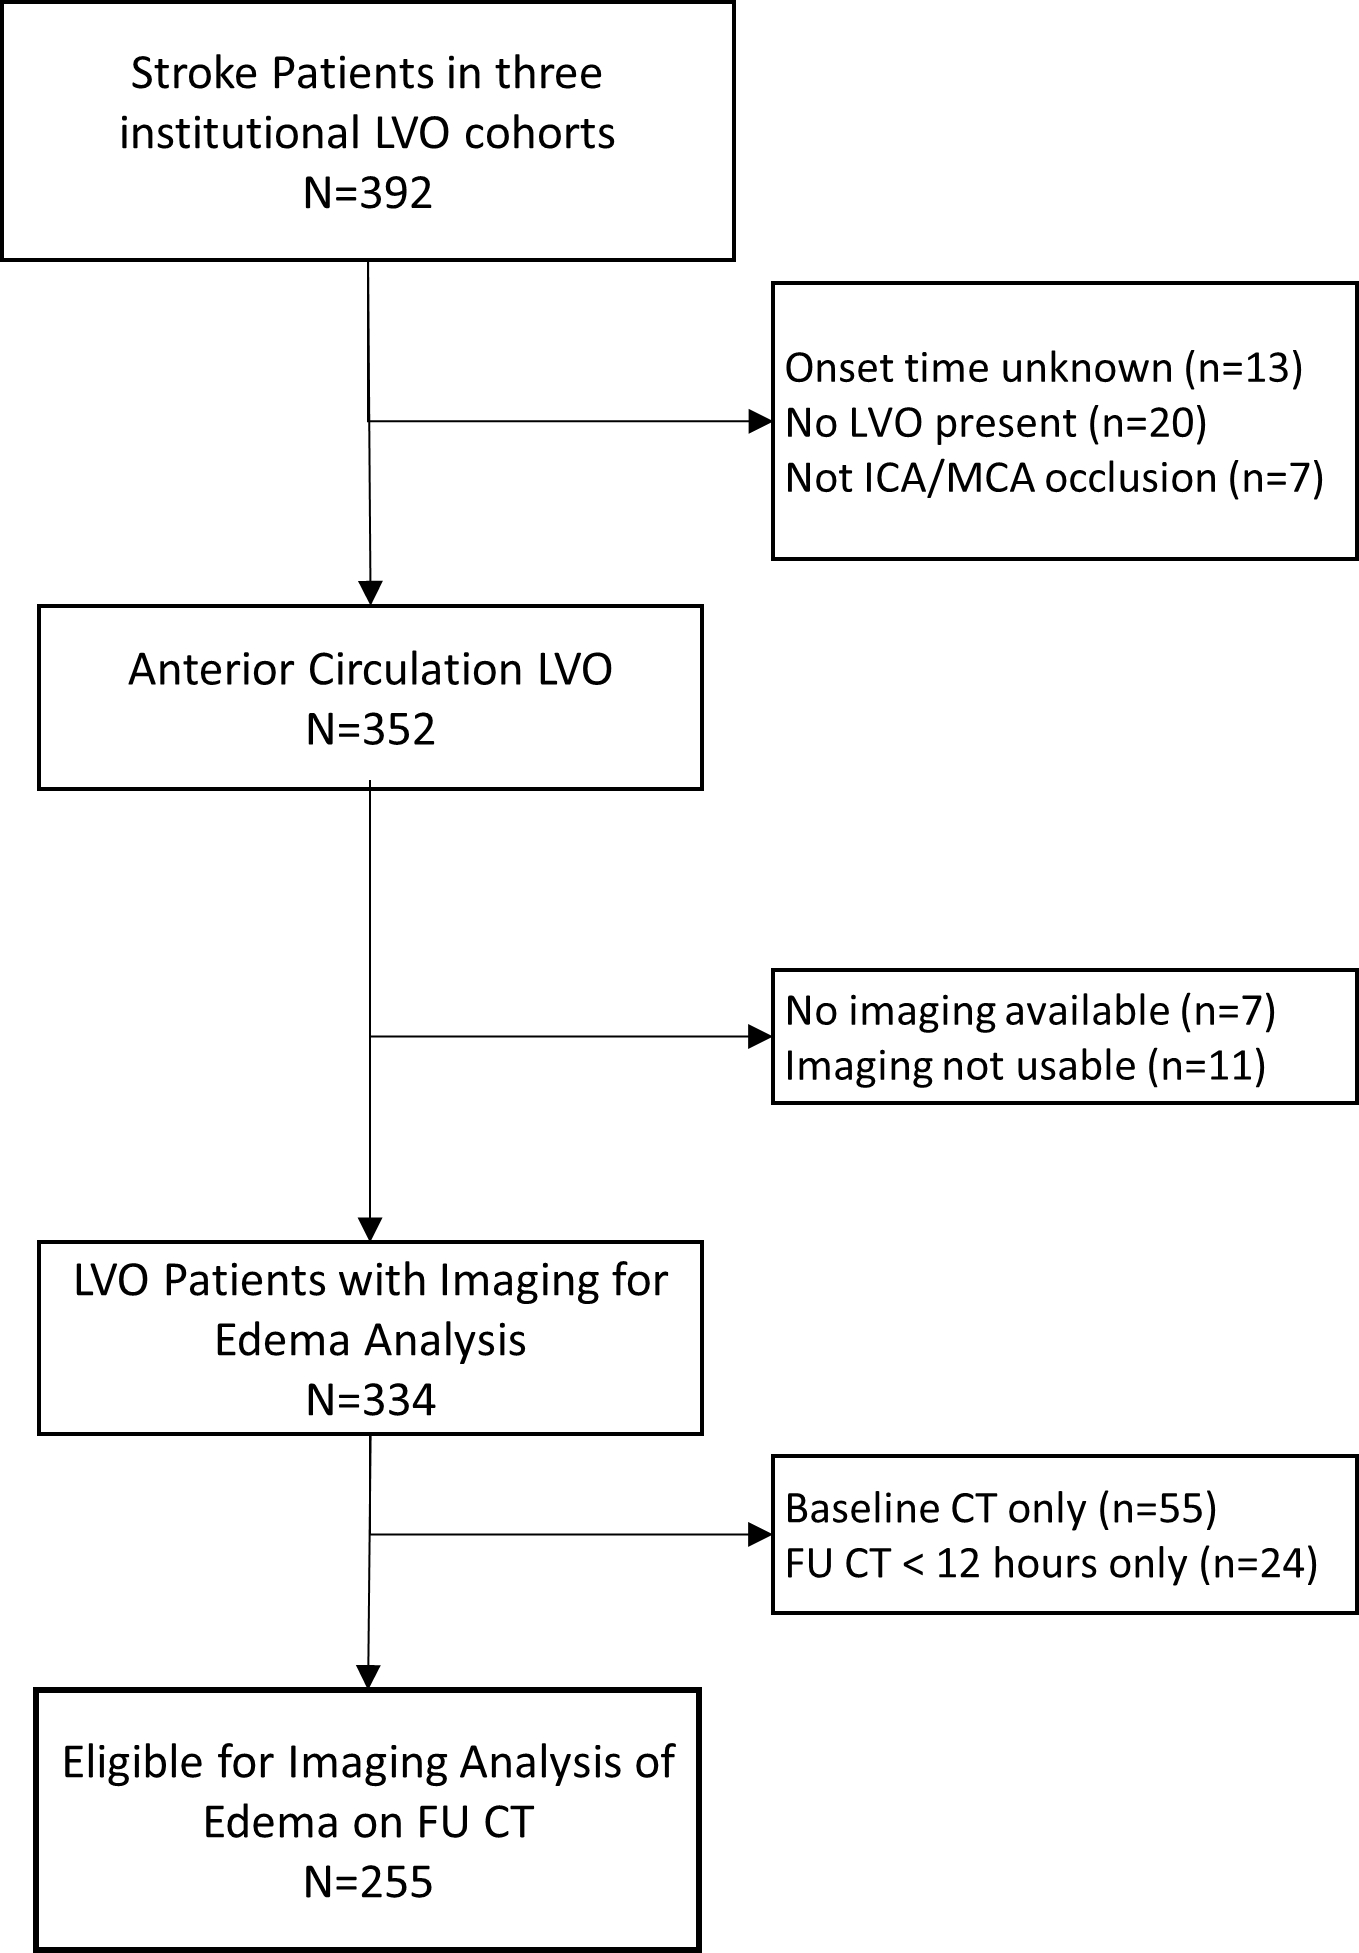
Flow of Subjects within this Study. FU, follow-up; ICA, internal carotid artery; LVO, large vessel occlusion; MCA, middle cerebral artery; N, number
The mean age in this cohort was 69 (standard deviation ± 15) years, 118 (46%) were female, and 59 (23%) were non-white or Hispanic, by self-report. Baseline NIHSS was 15 (IQR 10–21) and glucose on presentation was 121 mg/dl (IQR 109–144). Forty patients had an occlusion of the internal carotid artery, in 129 it involved the proximal MCA, and in 84 the M2 or M3. Thrombolytic therapy was given in 110 (43%) and endovascular thrombectomy was attempted in 159 patients (62%). Successful reperfusion was recorded in 128 (80%). Malignant edema developed in 35 patients (12%) and parenchymal hematoma (PH)-1 or PH-2 hemorrhagic transformation in 35 (14%). A comparison of the cohort demographics and clinical features divided by malignant edema status is shown in Table 1. There were no differences in age, sex, racial identification, admission glucose or blood pressure between the groups. NIHSS was higher and Alberta Stroke Program Early CT Score (ASPECTS) was lower in those developing malignant edema. Baseline CTs were available in 25 of 35 of the malignant edema group compared with 175 of 210 in the non-edema group. There was no difference in the rate of thrombolytic or endovascular treatment between the groups but successful reperfusion was significantly less likely in the malignant edema group. These patients were also more likely to have ICA or first segment of the middle cerebral artery segment occlusions. Few (4 of 45) of those with malignant edema had experienced clinical deterioration at 24 hours, and all 24-hour follow-up imaging was performed at or prior to the time of deterioration.
Table 1:
Comparison of demographic, clinical, and imaging features in those with versus without malignant edema in this study cohort
| Feature | No Malignant Edema (n=220) | Malignant Edema (n=35) |
|---|---|---|
| Age, years (SD) | 69 (14) | 67 (15) |
| Sex, female | 105 (48%) | 13 (37%) |
| Race, white non-Hispanic | 154 (70%) | 24 (69%) |
| NIHSS, baseline (IQR) | 14 (9–19) | 19 (15–23) |
| Glucose, mg/dl (IQR) | 120 (109–141) | 129 (109–160) |
| Systolic blood pressure, mm Hg (SD) | 150 (24) | 156 (18) |
| ASPECTS (IQR) | 9 (8–10) | 7 (6–9) |
| LVO location, ICA or M1 | 140 (64%) | 29 (83%) |
| tPA given | 95 (43%) | 15 (43%) |
| Thrombectomy | 136 (62%) | 23 (66%) |
| Reperfusion 2b-3 | 115 (85%) | 13 (57%) |
| Hemorrhagic transformation (PH1 or PH2) | 26 (12%) | 9 (26%) |
| Baseline relative hemispheric volume (SD) | 1.007(0.02) | 1.014 (0.02) |
| Baseline hemispheric CSF ratio (SD) | 0.95 (0.13) | 0.88 (0.13) |
| Midline shift at 24-hours (IQR) | 0 (0–0) | 2.9 (0–6) |
| ΔCSF at 24-hours (%) (IQR) | 12% (5–27) | 49% (30–71) |
| Hemispheric CSF ratio at 24-hours (IQR) | 0.82 (0.68–0.91) | 0.37 (0.30–0.60) |
| Net water uptake at 24-hours (%) (IQR) | 21 (17–25) | 21 (19–25) |
Values in parenthesis represent percentages of each group (%),standard deviation (SD), or interquartile range (IQR), as indicated.
ASPECTS, Alberta Stroke Program Early CT Score; ICA, internal carotid artery; LVO, large vessel occlusion; M1, first segment of the middle cerebral artery; n, number; NIHSS, National Institutes of Health Stroke Scale, PH, parenchymal hematoma; tPA, tissue plasminogen activator; ΔCSF, change in CSF volume from baseline.
Measurement of Biomarkers
The values for each biomarker measured at each of the three time points are shown in Table 2. Midline shift was present in 55 patients (22%) at 24 hours and in 63 patients (27%) overall, although the median midline shift was still zero at both time points. RHV was significantly different from one on the baseline scan (i.e. two hemispheres were not equal in volume, p<0.001) but asymmetry increased further at follow-up. The median reduction in CSF volume at 24 hours was 24 ml (IQR 8–49), representing a 14% change from baseline (IQR 6–30). In those with 72-hour scans, the total ΔCSF was 34 ml (13–74) or 22% (9–41%). The CSF ratio was significantly below 1.0 at baseline (p<0.001) and was correlated with RHV at all three time points (Figure 3A for 24-hour time point, ρ=0.74).
Table 2:
Descriptive summary of edema biomarkers measured at baseline and on follow-up CTs at 24- and 72-hours
| Baseline | 24-hours | 72-hours | |
|---|---|---|---|
| Number of scans analyzed | 210 | 255 | 81 |
| Time to scan (hours) | 2.2 (0.9–4.3) | 24.8 (19–29) | 70 (55–87) |
| CSF volume (ml) | 159 (122–202) (n=205) | 127 (89–171) (n=240) | 119 (86–159) (n=72) |
| Midline shift (mm) Number with midline shift | 0 (0–0) 0 (0%) | 0 (0–0) 55 (22%) | 0 (0–3.9) 35 (43%) |
| Hemispheric CSF ratio | 0.95 (0.88–1.00) (n=204) | 0.79 (0.59–0.92) (n=238) | 0.65 (0.45–0.81) (n=72) |
| Relative hemispheric volume | 1.008 (0.997–1.018) | 1.025 (1.01–1.05) | 1.04 (1.01–1.06) |
| Infarct hypodensity volume (ml) | N/A | 56 (22–145) (n=140) | 103 (45–201) (n=64) |
| Net Water Uptake (%) | 14.0 (8.0–19.3) (n=9) | 21.2 (17.7–25.4) (n=134) | 27.3 (23.2–32.3) (n=59) |
Values in parentheses represent the interquartile range for each measurement.
n, number; N/A, not applicable.
Figure 3:
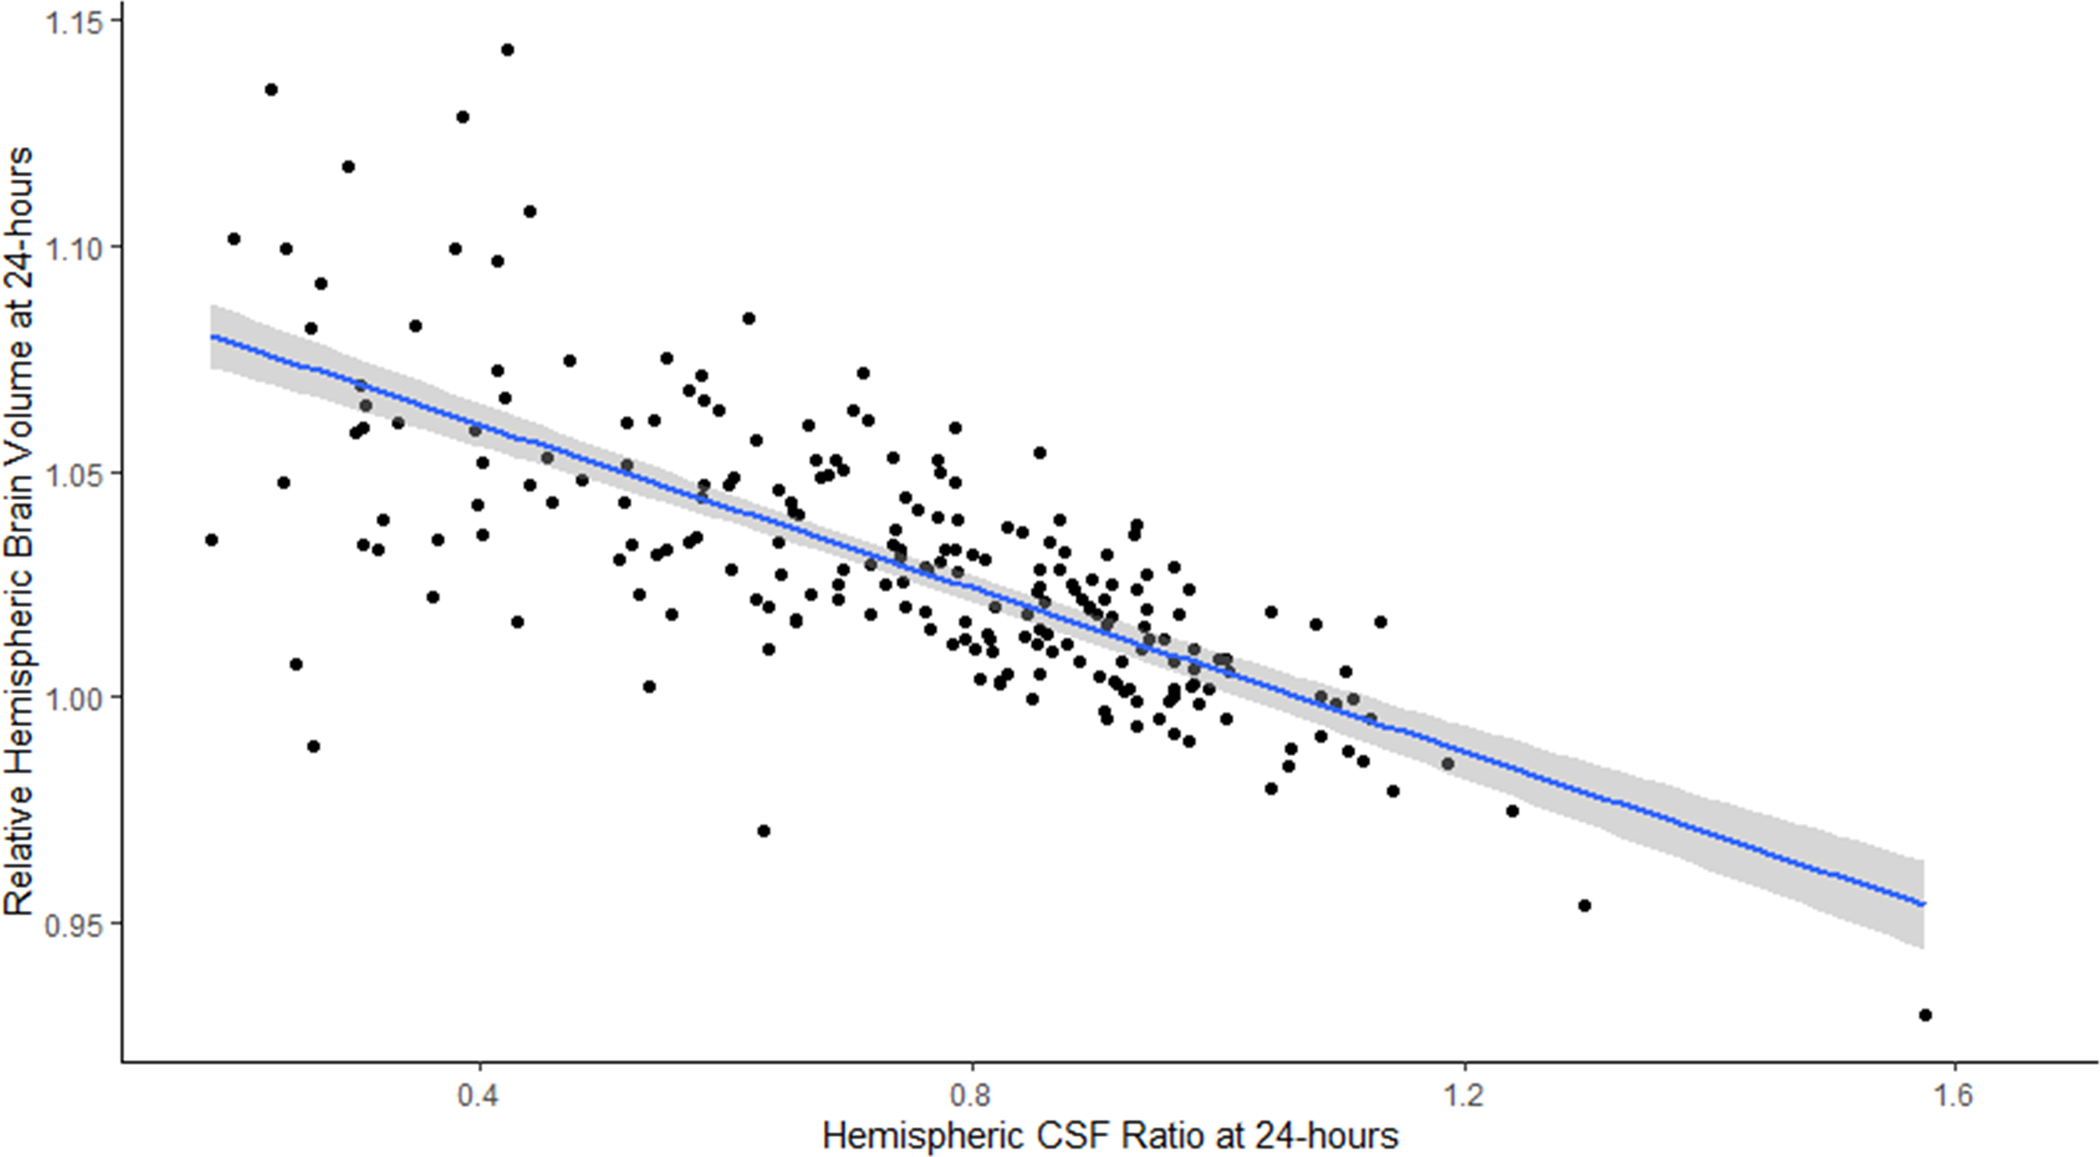
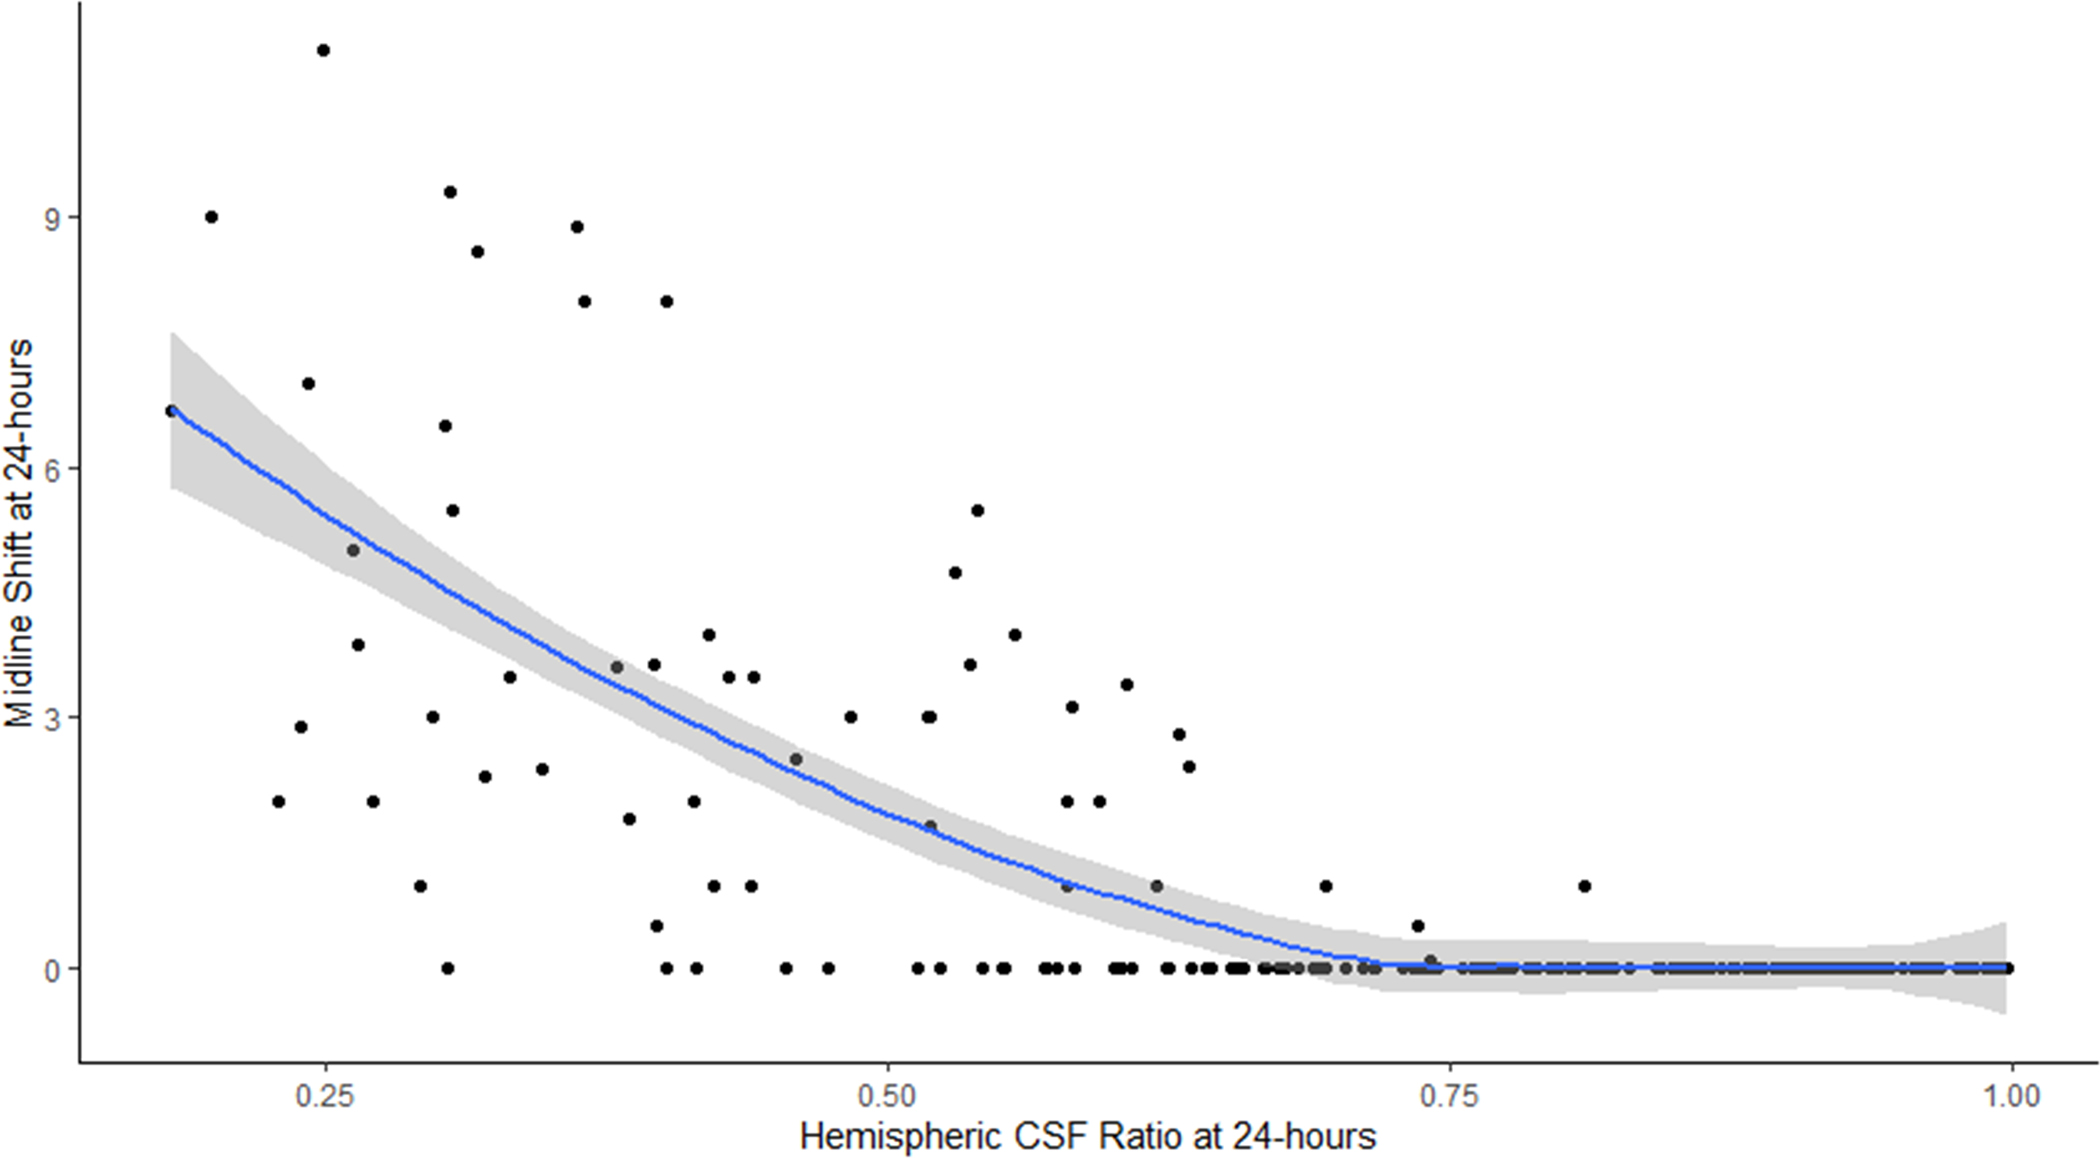
A) Correlation of hemispheric CSF ratio and relative hemispheric brain volume on 24-hour CT scans (line represents linear regression with 95% confidence interval); B) Plot of hemispheric CSF ratio and midline shift on 24-hour CT (line represents quadratic regression with 95% confidence interval)
Correlations between Biomarkers
Figure 4 shows the correlation matrix between the various biomarkers of edema. Peak midline shift was correlated most strongly with the CSF ratio at both 24- and 72 hours (rho=0.65 and 0.69) but also with ΔCSF. In contrast, there was only weak correlation between peak MLS and NWU at 24 hours (ρ=0.14, p=0.1) and at 72 hours (ρ=0.27, p=0.042). Evaluating the relationship of decreasing CSF ratio with midline shift suggested that when the ratio fell below 0.50 there was a sharp rise in midline shift (Figure 3B). Even the CSF ratio on baseline CT was weakly correlated with peak midline shift (ρ=0.23, p=0.001) while baseline RHV was not. The association of CSF ratio at 24 hours with midline shift remained significant even after adjusting for infarct volume (partial correlation 0.48, p<0.0001) as it did for ΔCSF (−0.35, =0.0001).
Figure 4:
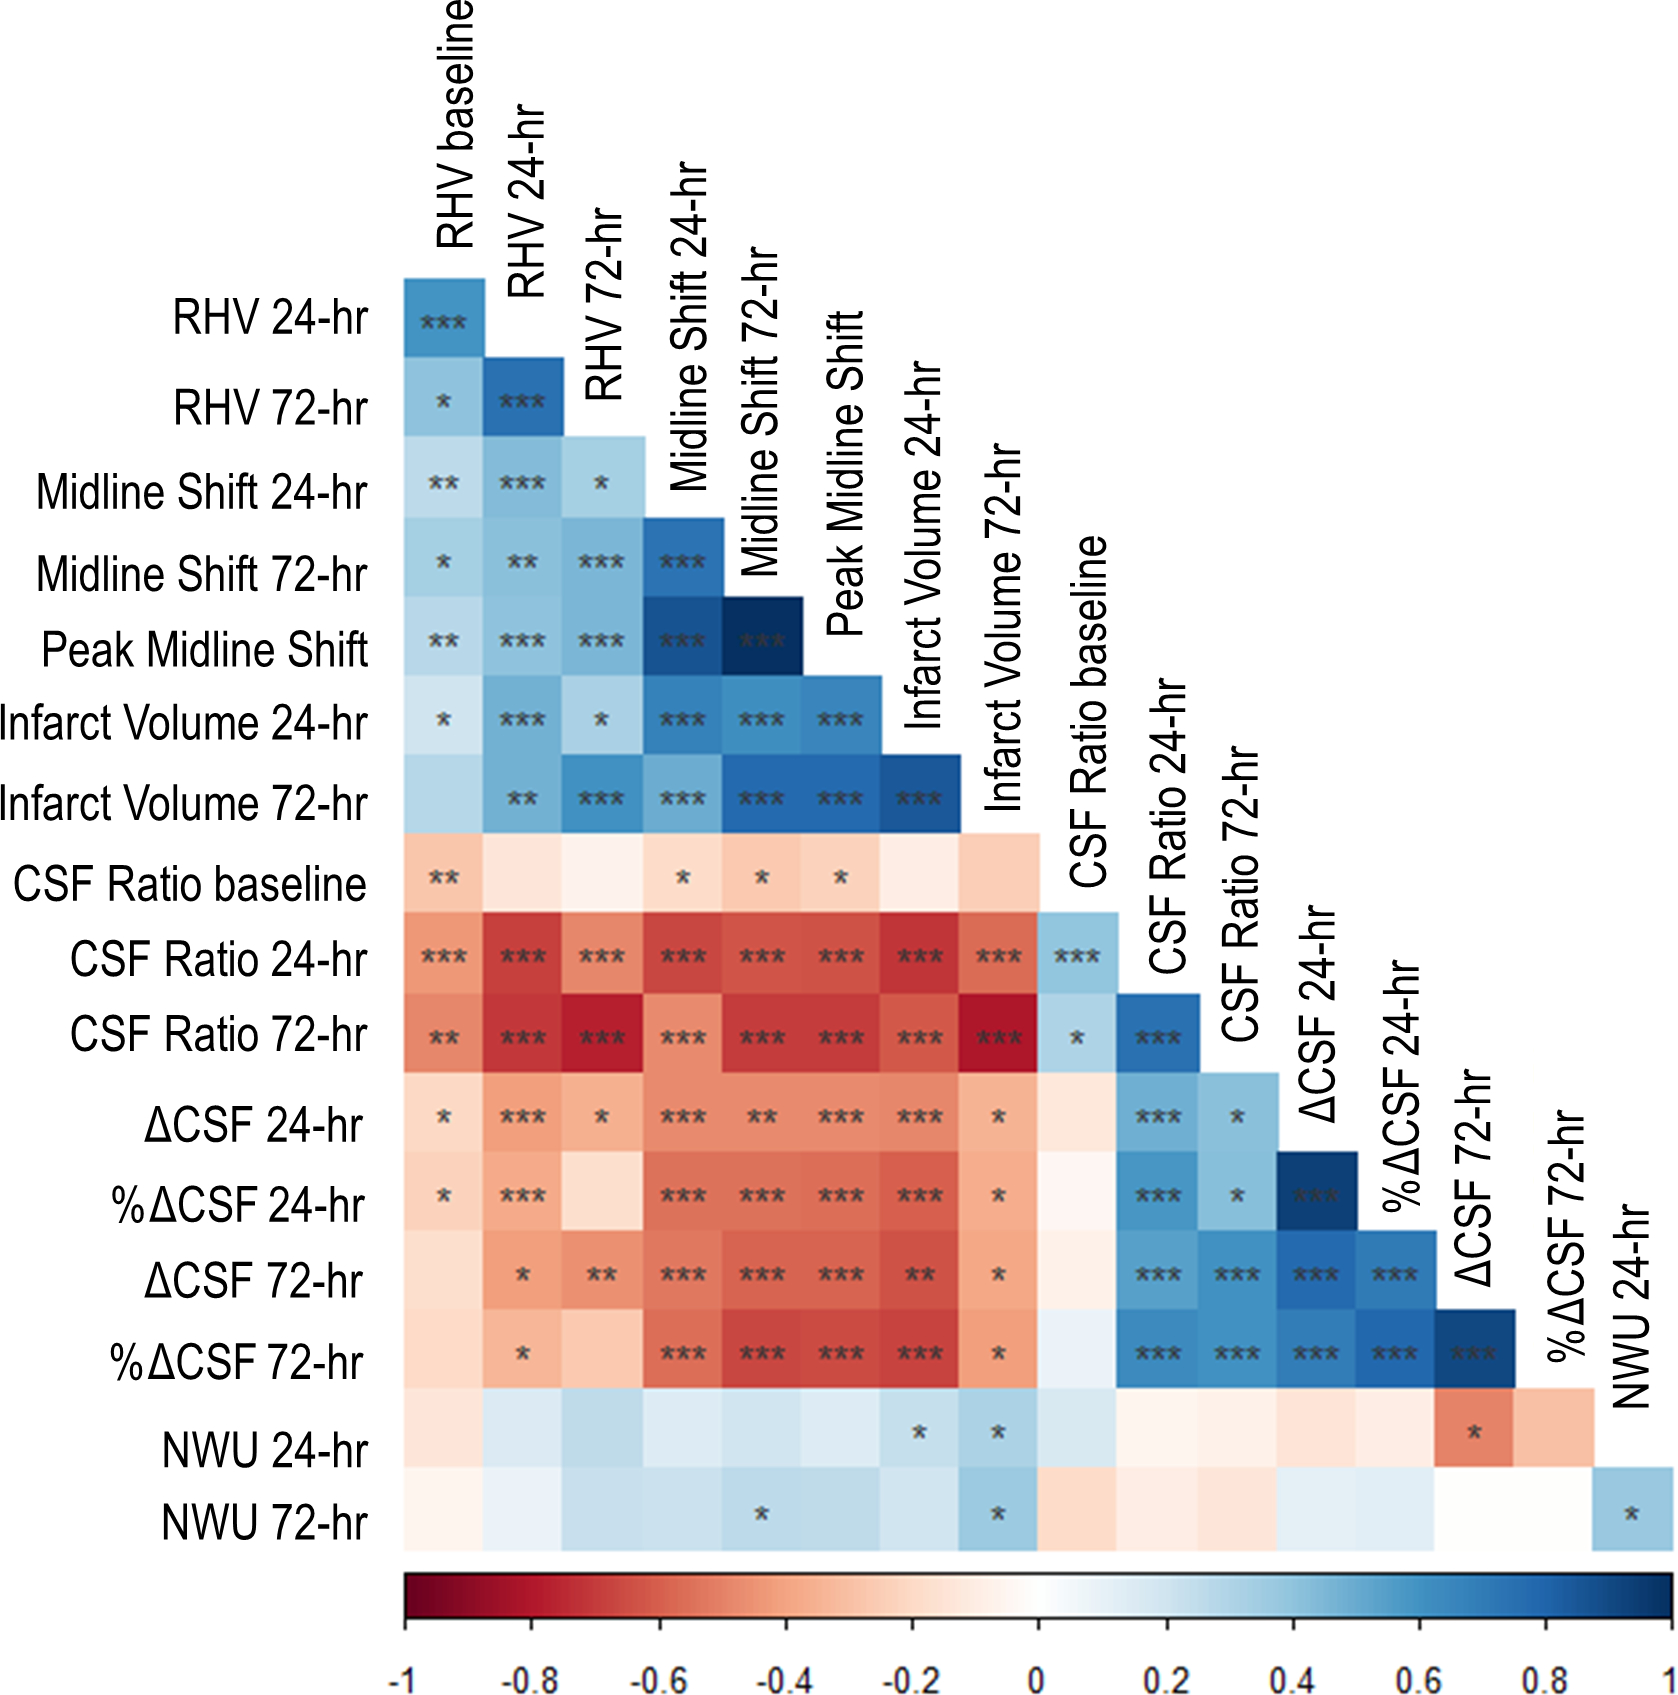
Correlation matrix showing relationships between all edema biomarkers. Blue indicates positive correlations and red negative correlations. Darker colors indicate stronger correlations. Significance of correlations represented by stars: one star indicates p<0.05, two stars p<0.001, and three stars p<0.0001. CSF, cerebrospinal fluid; hr = hour; NWU, net water uptake; RHV, relative hemispheric volume; ΔCSF, change in CSF volume (from baseline).
Association of Biomarkers with Malignant Edema
The hemispheric CSF ratio was lower in those destined to develop malignant edema even on baseline CT (0.88 vs. 0.95, p=0.02) while RHV was not (1.014 vs. 1.007, p=0.09). We did not have enough baseline NWU (nine cases, of which two had edema) measurements to compare it between edema groups. The total displacement of CSF (ΔCSF) was significantly greater (49% vs. 12%) and the CSF ratio significantly lower (0.37 vs. 0.83, both p<0.0001) at 24 hours, while NWU was similar (Table 1). Adjusting for age, NIHSS, tPA treatment, and ASPECTS, 24-hour CSF ratio was strongly associated with malignant edema [Odds Ratio (OR) 1.95 per 0.1 decrease, 95% Confidence Interval (CI) 1.52–2.59] while baseline CSF ratio was not (OR 1.23 per 0.1 decrease, 95% CI 0.87–1.87). Notably, neither NIHSS nor ASPECTS were independently predictive of malignant edema after incorporating CSF ratio. The association of 24-hour hemispheric CSF ratio and malignant edema persisted after adjusting for actual degree of midline shift at 24 hours (OR 1.48, 95% CI 1.08–2.08) and the model with CSF ratio (without midline shift) had a lower AIC to predict malignant edema than the model incorporating midline shift with the same clinical variables (127.0 vs. 131.8).
Similarly, ΔCSF was independently associated with malignant edema (OR 1.87 per 10% decrease, 95% CI 1.47–2.49), while NWU was not (p=0.49). In fact, both CSF-based biomarkers had stronger associations than the reference standard, RHV. In those undergoing thrombectomy, successful reperfusion was associated with a lower risk of malignant edema (OR 0.21, 95% CI 0.07–0.60), adjusting for age, NIHSS, tPA, and ASPECTS. However, the CSF ratio at 24 hours remained significantly associated, even adjusting for reperfusion status (OR 1.89 per 0.1 decrease, 95% CI 1.41–2.67). Similarly, ΔCSF was associated with progression to malignant edema (OR 2.21 per 10%, 95% CI 1.53–3.65), while NWU was not. Finally, even excluding those who underwent thrombectomy, NWU was still not associated with edema, while CSF parameters were. Similarly, excluding the 38 patients with PH type of HT, there was still no correlation of NWU with midline shift or association with malignant edema.
We then constructed linear mixed models of each biomarker over time, separated by malignant edema groups. The CSF ratio was 0.92 at time 0 and went down linearly over time (0.003/hour across all subjects), but those with malignant edema had lower CSF ratio (by 0.07) and a steeper slope of change in CSF ratio over time (0.01 per hour, p<0.0001; Figure 5A). Similarly, the total CSF started from baseline volume of 161 ml, went down over time, but with a steeper slope of ΔCSF in those with malignant edema (1.6 ml/hour vs. 0.4 ml/hour, p<0.0001; Figure 5B). These effects were similar to that seen for midline shift (baseline 0, slope 0.01/hour versus 0.15/hour in those with edema, p<0.0001; Figure 5C). However, there was no association of malignant edema with slope of NWU over time, with both groups exhibiting a similar increase in NWU over time (Figure 5D).
Figure 5:
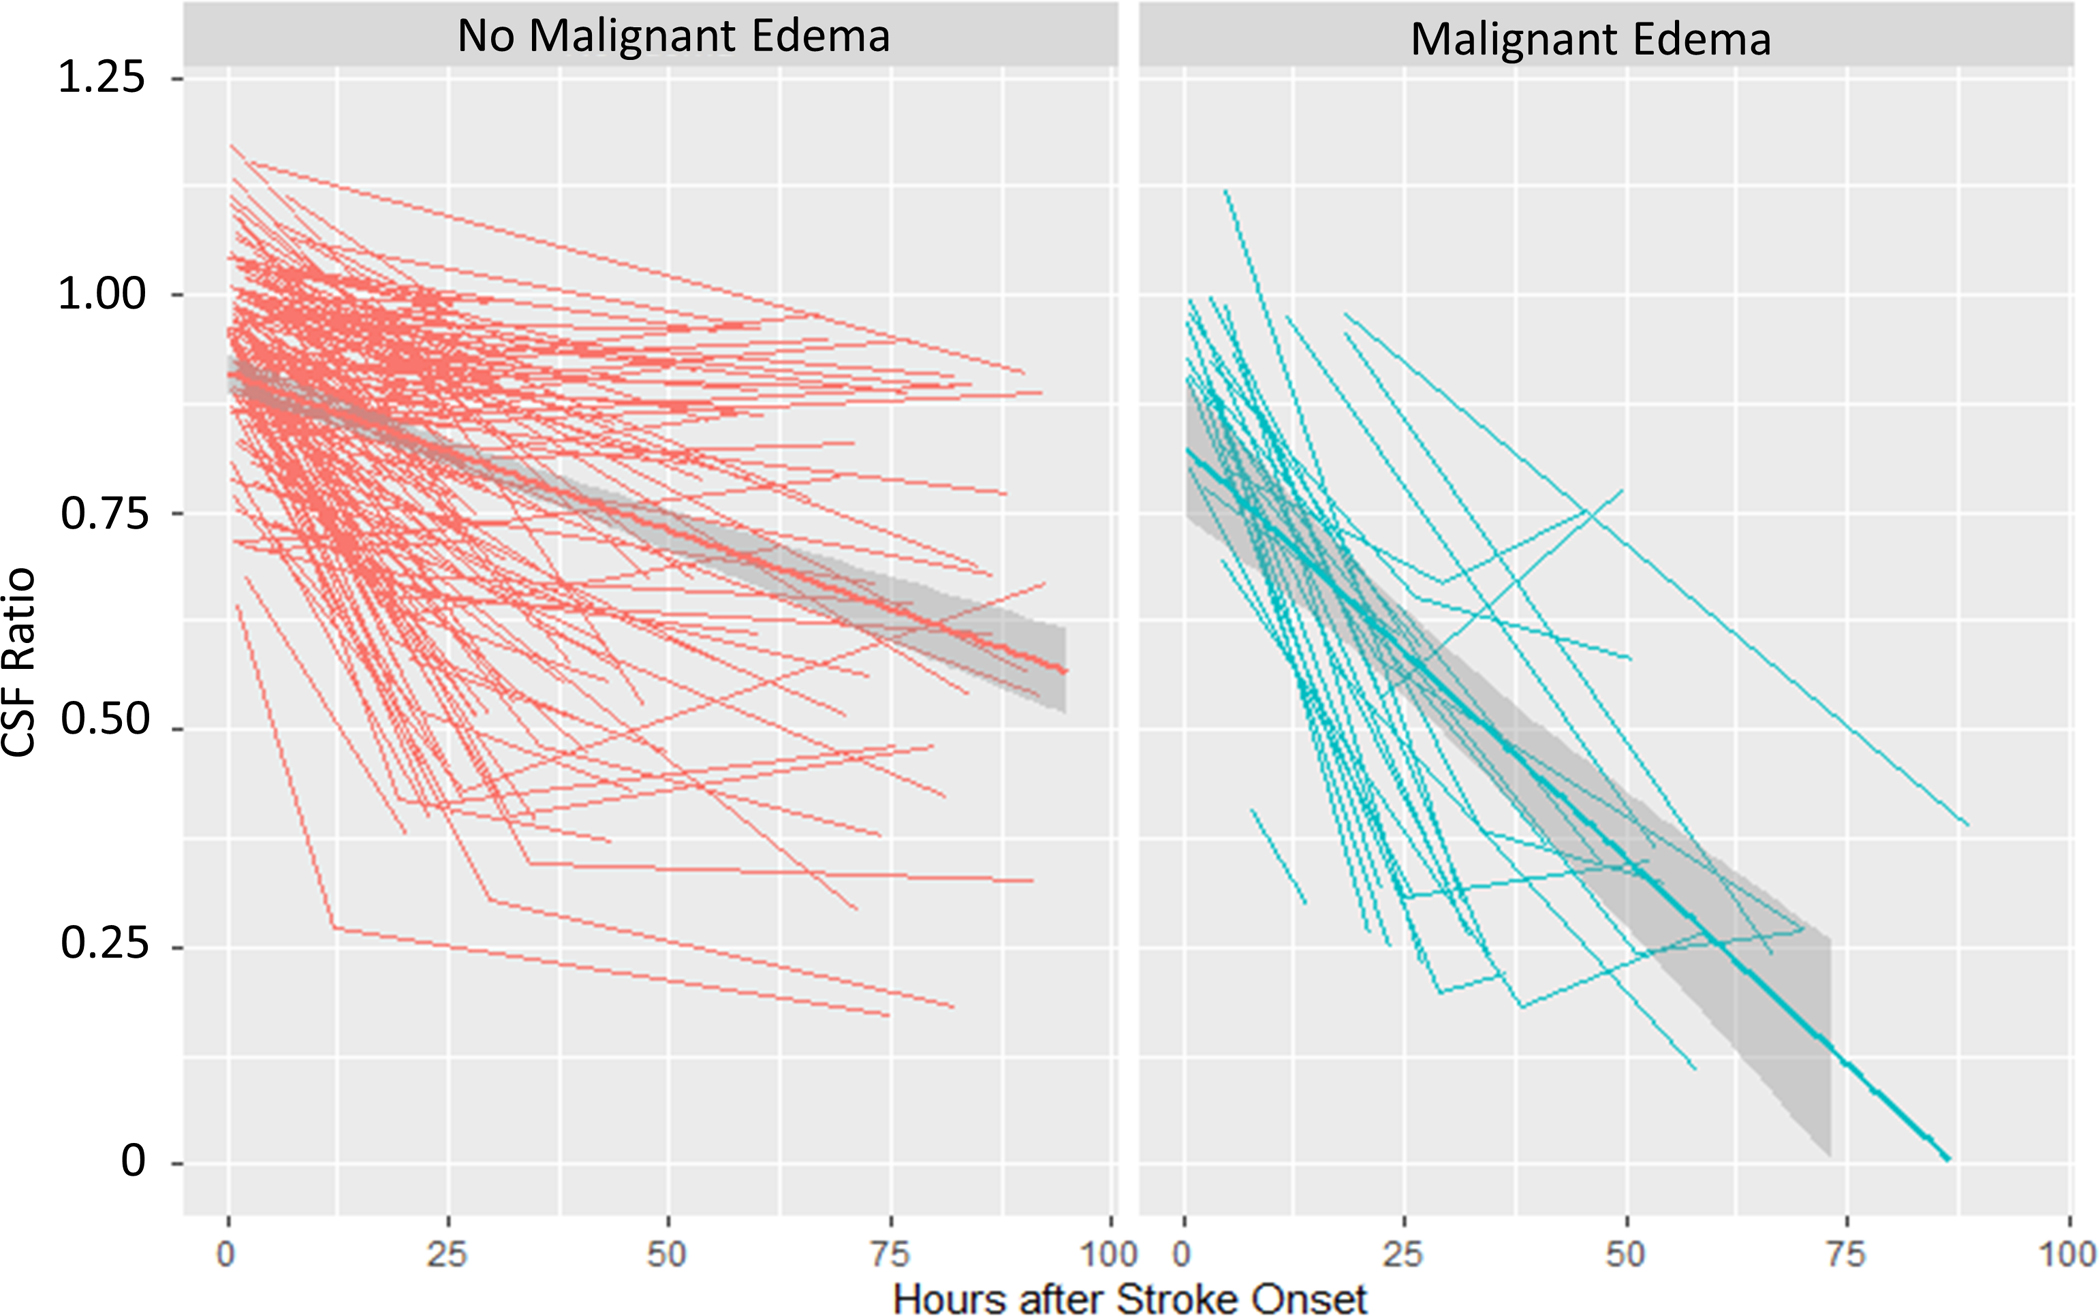
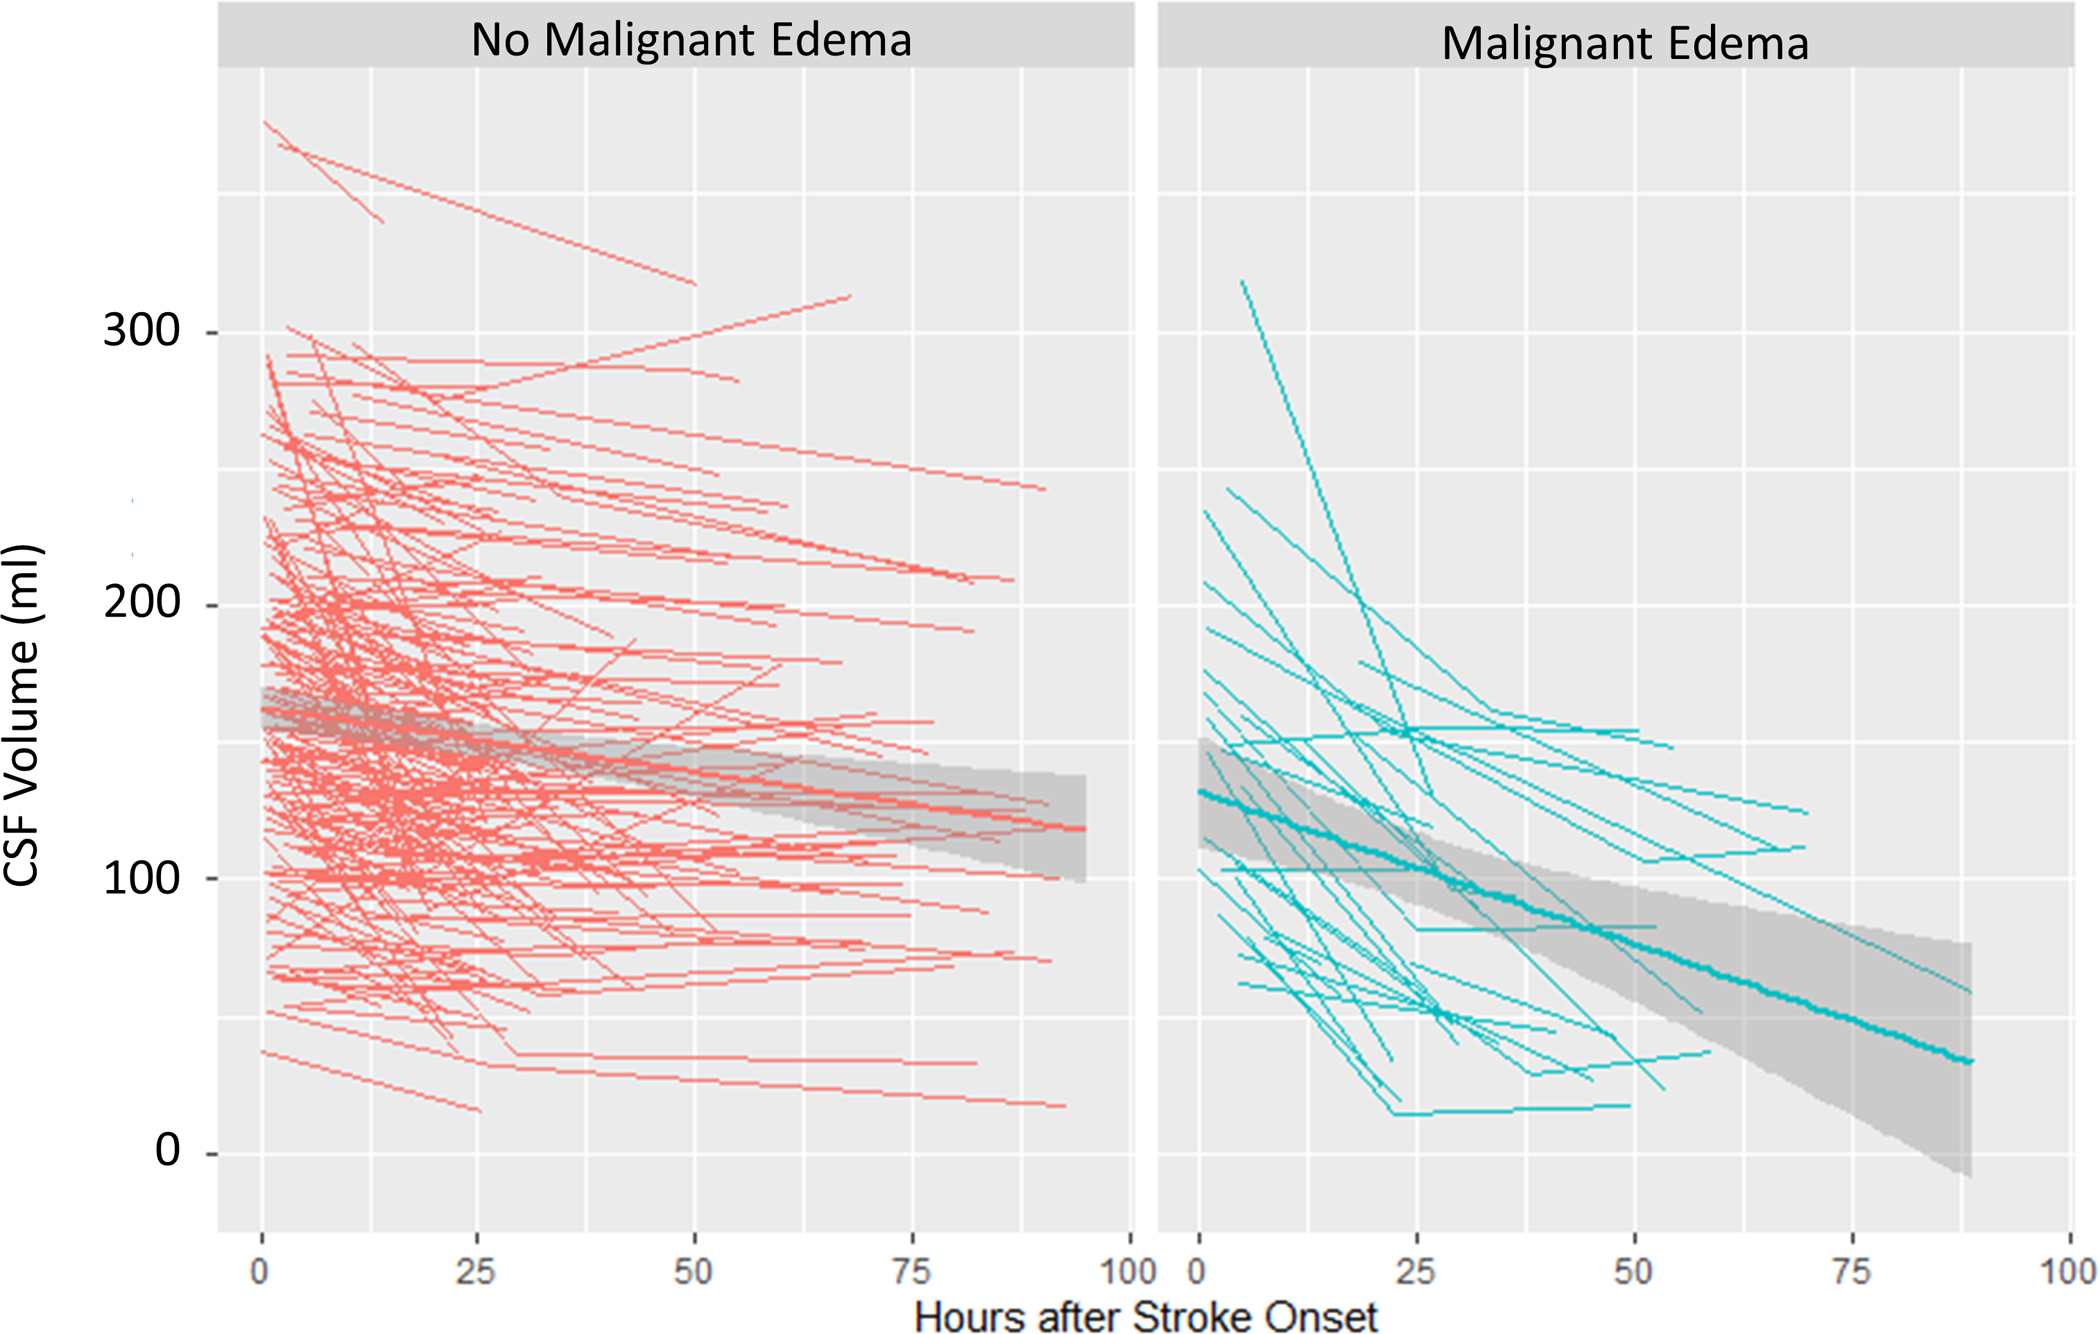
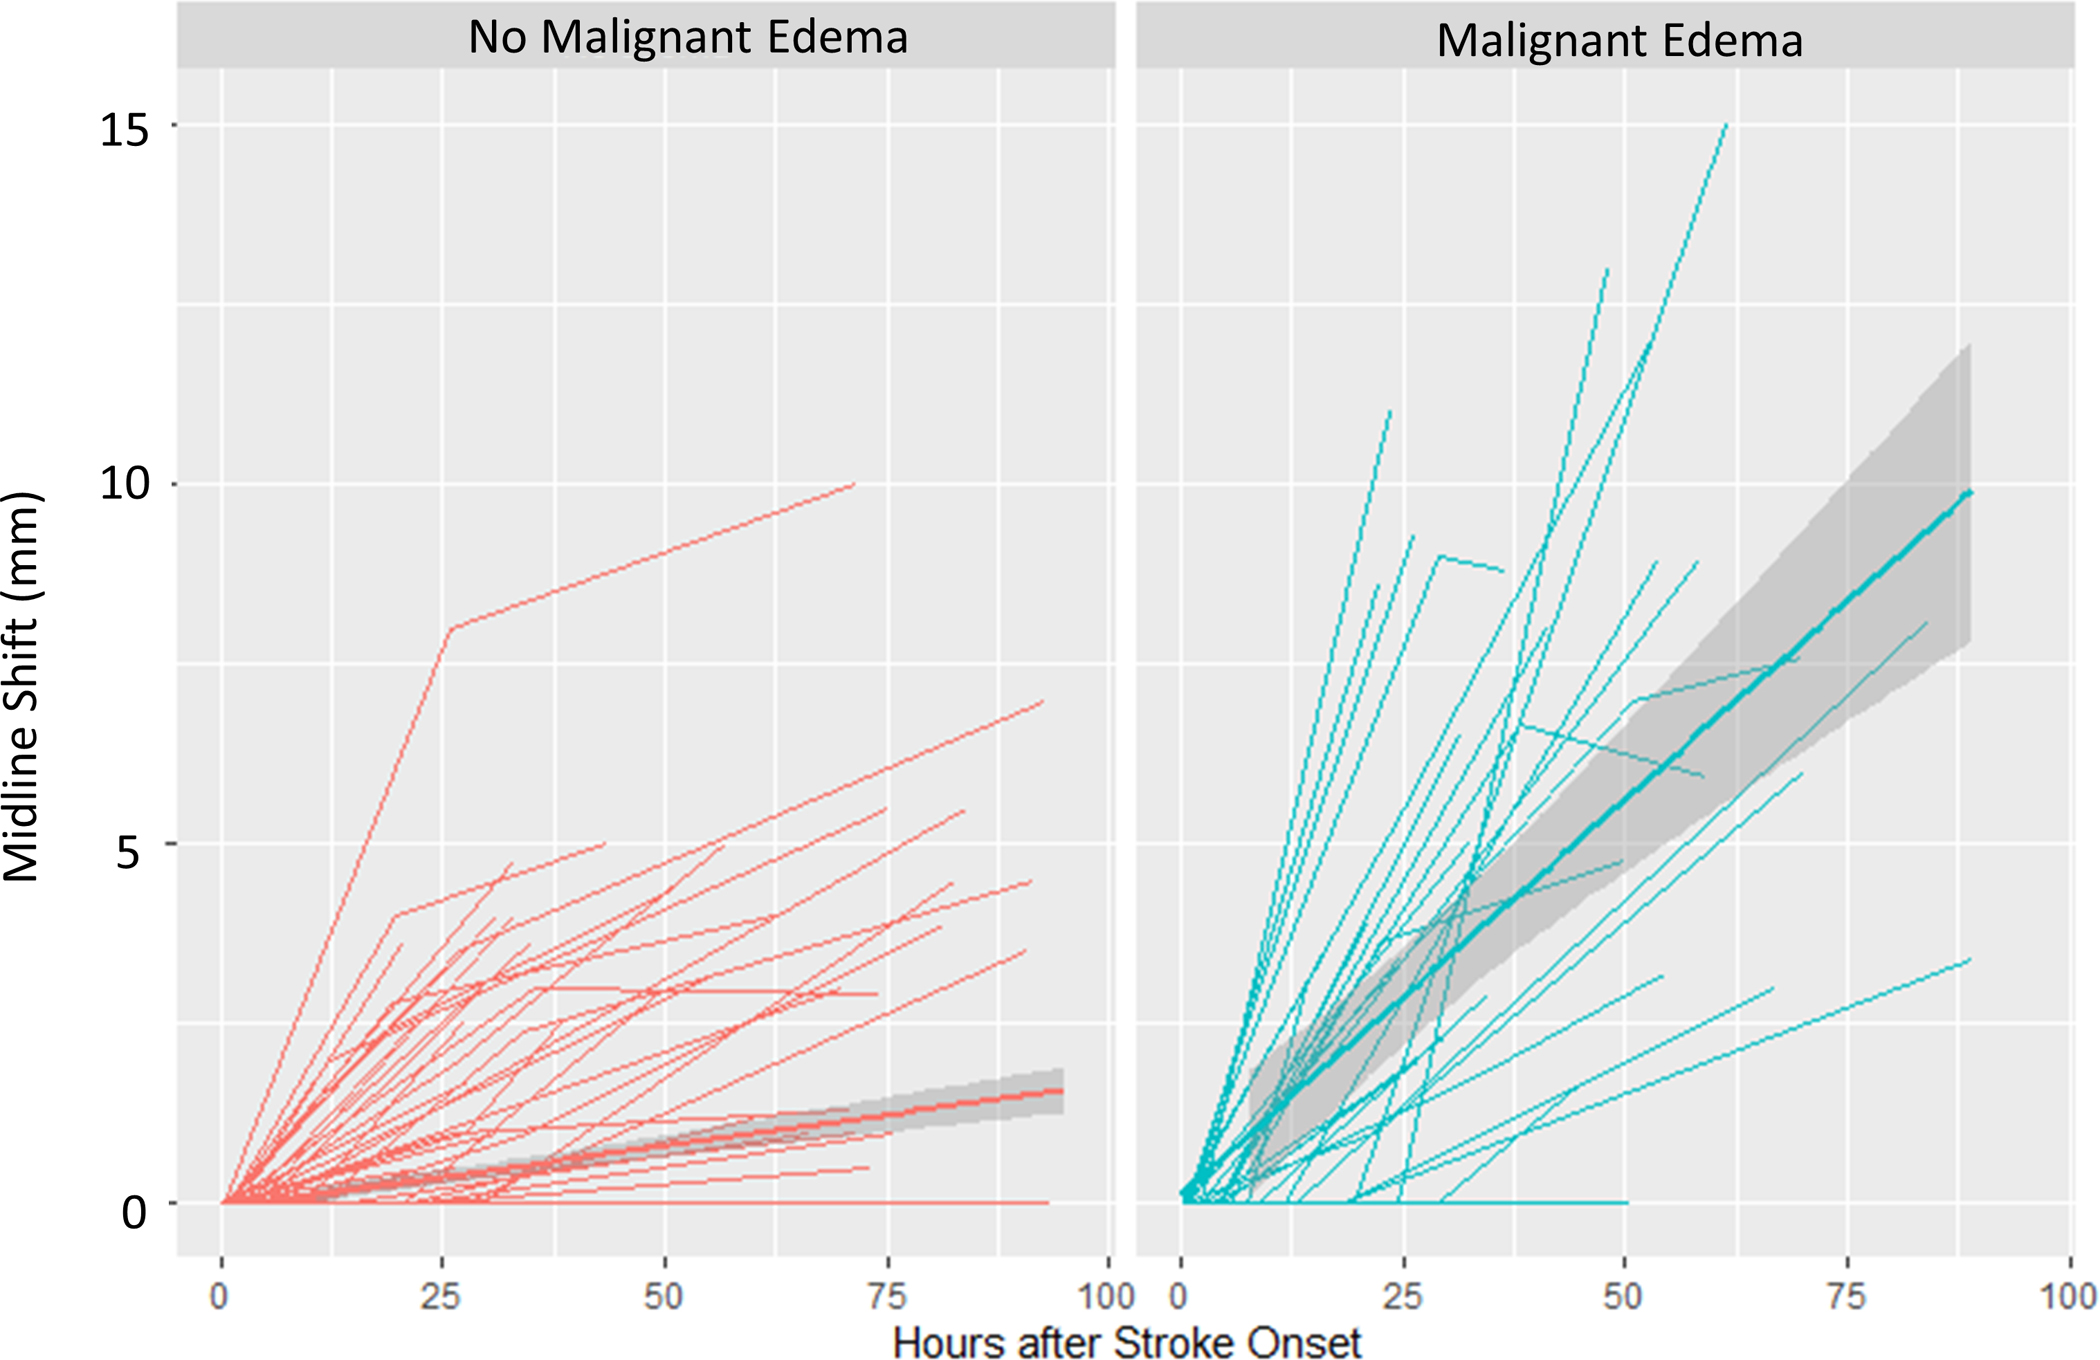
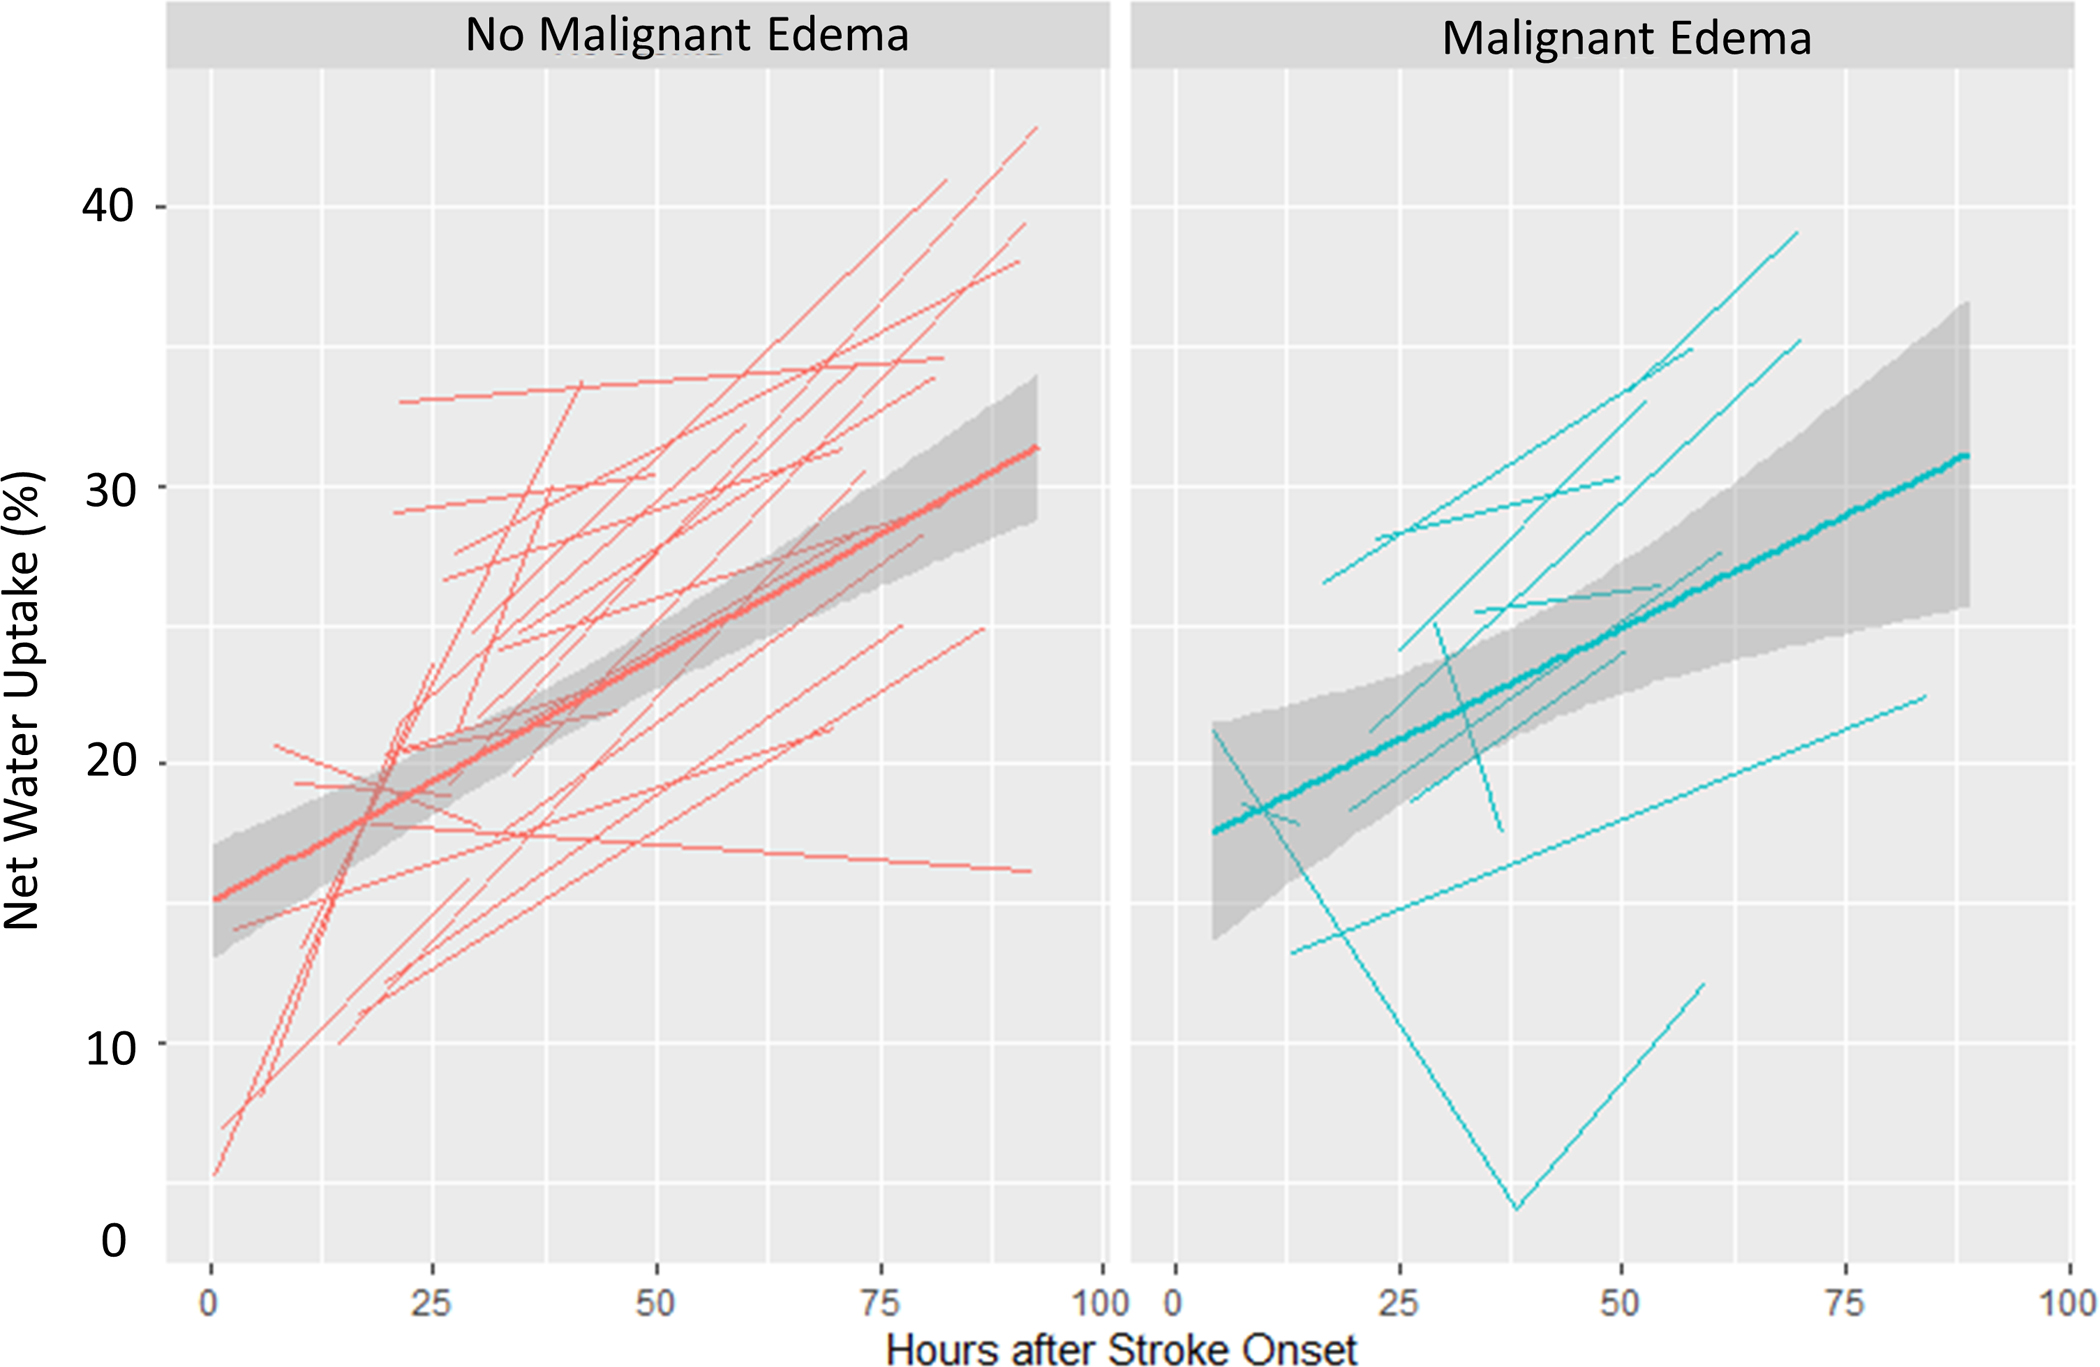
Spaghetti plots showing the trajectories of each edema biomarker (A, CSF Ratio; B, Total CSF Volume; C, Midline Shift; D, Net Water Uptake, NWU) over time, plotted for each subject at each available time point, with linear group averages plotted with 95% confidence intervals (grey regions), separated between those without malignant edema (left panel, red) and in those with malignant edema (right panel, blue).
Discussion
In this analysis of 255 patients with stroke due to anterior circulation LVO, we demonstrated that CSF-based volumetric biomarkers on serial head CTs correlate strongly with established imaging measures of edema and with the clinical outcome of malignant cerebral edema. A lower hemispheric CSF ratio at baseline and 24-hours was associated with greater midline shift and higher risk for malignant edema, as was a greater displacement of CSF (ΔCSF). Moreover, asymmetry of CSF between the two hemispheres (i.e. low CSF ratio) could be evaluated in all those with edema, even on admission, while midline shift was visualized in less than one quarter of patients at 24 hours. Evaluating CSF displacement offers an earlier imaging window into the evolution of edema than possible using midline shift or waiting till clinical deterioration occurs. In contrast, the densitometric biomarker, net water uptake, did not exhibit a relationship to any of these established measures. Furthermore, we demonstrated that the volumetric biomarkers could be obtained from almost all CT scans while NWU could be measured in just over half, restricted to cases when a clear infarct was visible.
We employed a comprehensive pipeline to automatically extract both classes of biomarkers from serial routine head CTs obtained at three different institutions. Both classes of biomarkers have gained traction in the evaluation of post-stroke edema. However, there have not been prior studies comparing CSF-based volumetric to density-based biomarkers. NWU has demonstrated promise in evaluating early edema progression, measured on baseline CT, including as an early marker of malignant edema.9 Fewer studies have studied NWU on follow-up CT to evaluate whether greater water accumulation (measured per unit volume infarction) relates meaningfully to the development of clinically significant brain swelling.26
Further, several limitations of NWU have been raised. Measurement of NWU requires manually outlining the region of infarction, slice-by-slice, and then mirroring this region to the contralateral hemisphere; an approach impractical for bedside assessment or for use in large cohort studies. We surmounted this obstacle by developing a NWU algorithm that automatically segments the hypodense infarct region and creates the mirror region.20 The second is that NWU assessment at follow-up is particularly susceptible to contamination from regions of hemorrhagic transformation or contrast within the infarct (for example, in those undergoing thrombectomy). In fact, a recent study of 144 large hemispheric strokes demonstrated that NWU did not correlate with RHV (both manually measured), but did so weakly after excluding those with hemorrhage (ρ=0.21) or all those undergoing thrombectomy (ρ=0.45). The exclusion of such patients limits its broad applicability to study edema after a severe stroke. Our NWU method attempts to mitigate this by thresholding the region of infarction at an upper limit of 40 Hounsfield Units; while we observed a slightly stronger correlation to midline shift and RHV when excluding patients with hemorrhage or thrombectomy, it was still not significantly correlated with reference standards of edema. This suggests that NWU on follow-up CT does not capture the key aspects of brain swelling that are associated with deterioration. Instead, it may reflect different aspects of edema, perhaps the early ionic shifts that cause progressive tissue hypodensity but may not lead to as much brain swelling as the cytotoxic and vasogenic edema pathways that precipitate volumetric increases in the ipsilateral hemisphere and can lead to herniation. These are more strongly captured by measuring the displacement of hemispheric and global CSF. Both global and the ratio of hemispheric CSF volumes were reduced linearly over the first 96 hours after stroke onset, but much more rapidly in those who later would develop malignant edema. These volumetric biomarkers are more widely measurable at early time points (i.e. do not require a visible infarct or concurrent estimation of infarct from CT perfusion) and are strongly linked to clinically significant outcomes. Further studies should assess how incorporating these biomarkers, measured at 24 hours or even earlier after stroke, can enable more accurate and earlier prediction of those who may require surgery for malignant edema than conventional measures such as NIHSS and midline shift.4
Our study has limitations, including some bias in which patients underwent CTs at each time point. All institutions performed CTs around 24 hours after stroke in those undergoing thrombectomy, mitigating selection bias in this subgroup. However, it is likely that the non-thrombectomy patients who underwent repeat CT represent a more severe subset than those who did not. Similarly, the smaller cohort of 72-hour scans represents clinical selection based on patient status and likely selects those with more edema. Nonetheless, our side-by-side imaging comparison of several biomarkers in parallel is unlikely to be substantially skewed by this bias. Our clinical outcome measure of malignant edema is also prone to variability based on physician/institutional practices in when and in whom to initiate therapies or perform surgery. To mitigate against such biases, we included patients from three diverse centers with varying practices and so our findings are likely more generalizable. Nevertheless, given our automated multi-phenotype pipeline, our findings can be easily further tested in even larger and diverse cohorts. The current work is applicable only to anterior circulation LVOs affecting the ICA and MCA and cannot be generalized to occlusions and strokes in other locations. Accurate quantitative biomarkers will enable a deeper understanding of how biologic factors and interventions, including reperfusion, blood pressure, and hyperglycemia, mitigate or worsen cerebral edema across the spectrum of severities. This work suggests that the choice of biomarkers may depend on what aspect of edema or outcome is being interrogated.
Acknowledgements
Funding:
This study was supported by grants from the NIH (K23NS099440 and R01NS121218)
Footnotes
Disclosure:
The authors have no relevant conflicts of interest to disclose.
REFERENCES
- 1.Battey TW, Karki M, Singhal AB, et al. Brain edema predicts outcome after nonlacunar ischemic stroke. Stroke 2014;45:3643–8. [DOI] [PMC free article] [PubMed] [Google Scholar]
- 2.McKeown ME, Prasad A, Kobsa J, et al. Midline shift greater than 3mm independently predicts outcome after ischemic stroke. Neurocrit Care 2021;36:46–51. [DOI] [PMC free article] [PubMed] [Google Scholar]
- 3.Kimberly WT, Dutra BG, Boers AMM, et al. Association of reperfusion with brain edema in patients with acute ischemic stroke: A secondary analysis of the mr clean trial. JAMA Neurol 2018;75:453–61. [DOI] [PMC free article] [PubMed] [Google Scholar]
- 4.Foroushani HM, Hamzehloo A, Kumar A, et al. Accelerating prediction of malignant cerebral edema after ischemic stroke with automated image analysis and explainable neural networks. Neurocrit Care 2021;36:471–82. [DOI] [PMC free article] [PubMed] [Google Scholar]
- 5.Kimberly WT, Bevers MB, von Kummer R, et al. Effect of iv glyburide on adjudicated edema endpoints in the games-rp trial. Neurology 2018;91:e2163–e9. [DOI] [PMC free article] [PubMed] [Google Scholar]
- 6.Kirsch E, Szejko N, Falcone GJ. Genetic underpinnings of cerebral edema in acute brain injury: An opportunity for pathway discovery. Neurosci Lett 2020;730:135046. [DOI] [PMC free article] [PubMed] [Google Scholar]
- 7.Yoo AJ, Sheth KN, Kimberly WT, et al. Validating imaging biomarkers of cerebral edema in patients with severe ischemic stroke. J Stroke Cerebrovasc Dis 2013;22:742–9. [DOI] [PMC free article] [PubMed] [Google Scholar]
- 8.Ostwaldt AC, Battey TWK, Irvine HJ, et al. Comparative analysis of markers of mass effect after ischemic stroke. J Neuroimaging 2018;28:530–4. [DOI] [PMC free article] [PubMed] [Google Scholar]
- 9.Broocks G, Flottmann F, Scheibel A, et al. Quantitative lesion water uptake in acute stroke computed tomography is a predictor of malignant infarction. Stroke 2018;49:1906–12. [DOI] [PubMed] [Google Scholar]
- 10.Dhar R, Hamzehloo A, Kumar A, et al. Hemispheric csf volume ratio quantifies progression and severity of cerebral edema after acute hemispheric stroke. J Cereb Blood Flow Metab 2021;41:2907–15. [DOI] [PMC free article] [PubMed] [Google Scholar]
- 11.Dhar R, Chen Y, Hamzehloo A, et al. Reduction in cerebrospinal fluid volume as an early quantitative biomarker of cerebral edema after ischemic stroke. Stroke 2020;51:462–7. [DOI] [PMC free article] [PubMed] [Google Scholar]
- 12.Dhar R, Yuan K, Kulik T, et al. Csf volumetric analysis for quantification of cerebral edema after hemispheric infarction. Neurocrit Care 2016;24:420–7. [DOI] [PMC free article] [PubMed] [Google Scholar]
- 13.Broocks G, Flottmann F, Ernst M, et al. Computed tomography-based imaging of voxel-wise lesion water uptake in ischemic brain: Relationship between density and direct volumetry. Invest Radiol 2018;53:207–13. [DOI] [PubMed] [Google Scholar]
- 14.Broocks G, Flottmann F, Hanning U, et al. Impact of endovascular recanalization on quantitative lesion water uptake in ischemic anterior circulation strokes. J Cereb Blood Flow Metab 2019;40:437–45. [DOI] [PMC free article] [PubMed] [Google Scholar]
- 15.Broocks G, Kemmling A, Aberle J, et al. Ischemic lesion water uptake in acute stroke: Is blood glucose related to cause and effect? J Stroke 2019;21:347–9. [DOI] [PMC free article] [PubMed] [Google Scholar]
- 16.Broocks G, Kemmling A, Meyer L, et al. Computed tomography angiography collateral profile is directly linked to early edema progression rate in acute ischemic stroke. Stroke 2019;50:3424–30. [DOI] [PubMed] [Google Scholar]
- 17.Ng FC, Yassi N, Sharma G, et al. Correlation between computed tomography-based tissue net water uptake and volumetric measures of cerebral edema after reperfusion therapy. Stroke 2022;53:2628–36. [DOI] [PubMed] [Google Scholar]
- 18.Cheng X, Shi J, Wu H, Zhu W, Lu G. Review of net water uptake in the management of acute ischemic stroke. Eur Radiol 2022;32:5517–24. [DOI] [PubMed] [Google Scholar]
- 19.Vorasayan P, Bevers MB, Beslow LA, et al. Intravenous glibenclamide reduces lesional water uptake in large hemispheric infarction. Stroke 2019;50:3021–7. [DOI] [PMC free article] [PubMed] [Google Scholar]
- 20.Kumar A, Chen Y, Corbin A, et al. Automated measurement of net water uptake from baseline and follow-up cts in patients with large vessel occlusion stroke. Front Neurol 2022;13:898728. [DOI] [PMC free article] [PubMed] [Google Scholar]
- 21.Foroushani HM, Dhar R, Chen Y, et al. The stroke neuro-imaging phenotype repository (snipr): An open data science platform for stroke research. Front Neuroinform 2021;15:597708. [DOI] [PMC free article] [PubMed] [Google Scholar]
- 22.Dhar R, Chen Y, An H, Lee JM. Application of machine learning to automated analysis of cerebral edema in large cohorts of ischemic stroke patients. Front Neurol 2018;9:687. [DOI] [PMC free article] [PubMed] [Google Scholar]
- 23.Muschelli J, Ullman NL, Mould WA, Vespa P, Hanley DF, Crainiceanu CM. Validated automatic brain extraction of head ct images. Neuroimage 2015;114:379–85. [DOI] [PMC free article] [PubMed] [Google Scholar]
- 24.Rorden C, Bonilha L, Fridriksson J, Bender B, Karnath HO. Age-specific ct and mri templates for spatial normalization. Neuroimage 2012;61:957–65. [DOI] [PMC free article] [PubMed] [Google Scholar]
- 25.Fiorelli M, Bastianello S, von Kummer R, et al. Hemorrhagic transformation within 36 hours of a cerebral infarct: Relationships with early clinical deterioration and 3-month outcome in the european cooperative acute stroke study i (ecass i) cohort. Stroke 1999;30:2280–4. [DOI] [PubMed] [Google Scholar]
- 26.Nawabi J, Flottmann F, Hanning U, et al. Futile recanalization with poor clinical outcome is associated with increased edema volume after ischemic stroke. Invest Radiol 2019;54:282–7. [DOI] [PubMed] [Google Scholar]


