Abstract
We report a novel method for synthesizing red and deep red cyanine dyes with large Stokes shifts, probes A and B, for live cell NAD(P)H detection. The probes were prepared using thiophene-based organic dyes featuring a π-conjugated bridge of thiophene and 3,4-ethylenedioxythiophene units linking the 1-methylquinolinium acceptor and formyl acceptor, respectively. These probes display weak absorption peaks at 315 nm (A) and 334 nm (B) and negligible fluorescence in the absence of NADH. However, upon the presence of NADH, new absorption and fluorescence peaks appear at 477 nm and 619 nm for probe A and at 486 nm and 576 nm for probe B, respectively. This is due to the NADH-facilitated reduction of the 1-methylquinolinium unit into 1-methyl-1,4-dihydroquinoline, which then acts as the electron donor for the probes, leading to the formation of well-defined electron donor–acceptor dye systems. Probe A has a large Stokes shift of 144 nm, which allows for better separation between the excitation and emission spectra, reducing spectral overlap and improving the accuracy of fluorescence measurements. The probes are highly selective for NAD(P)H, water-soluble, biocompatible, and easily permeable to cells. They are also photostable and were successfully used to monitor changes in NADH concentration in live cells during glycolysis in the presence of glucose, lactate, and pyruvate, treatment of FCCP and cancer drug cisplatin, and under hypoxia triggered by CoCl2. Furthermore, the probes were able to image NAD(P)H in Drosophila melanogaster larvae. Notably, cisplatin treatment increased the NAD(P)H concentration in A459 cells over time. Overall, this work presents a significant advancement in the field of live cell imaging by providing a simple and cost-effective method for detecting changes in NAD(P)H concentration under varying chemical stimuli.
1. Introduction
NADH and NAD+ are indispensable coenzymes involved in a myriad of essential redox reactions and processes, ranging from energy metabolism and calcium homeostasis to DNA repair, gene expression, embryonic development, cellular aging, and ATP synthesis across both prokaryotic and eukaryotic organisms. In eukaryotes, NADH is present in both the cytosol and mitochondria, whereas prokaryotes, lacking mitochondria, predominantly contain NADH in the cytosol or inner layers of the cell membrane.1 Of particular significance, NADH plays a critical role in donating electrons to the electron transport chain in mitochondria, facilitating the efficient production of ATP molecules. However, the imbalance between NADH and NAD+ can lead to the production of reactive oxygen species, which can damage cells and result in aging, diabetes, cell death, epilepsy, and cancer. It is crucial for cellular health and function to maintain a healthy NADH/NAD+ balance.2 As a result, designing and developing simple and cost-effective approaches to real-time monitor NADH in live cells is crucial for gaining insight into the physiological and pathological mechanisms of diseases. The costly enzymatic cycling assay, an electrochemical method,3 capillary electrophoreses, and high-performance liquid chromatography4 have been reported for the in vitro detection of NADH. Recently, fluorescent probes combined with fluorescence microscopy have been reported to allow monitoring of NADH levels in live cells because of their specificity, sensitivity, operation simplicity, superior biocompatibility, and available imaging reagents with fluorescence ranging from visible to near-infrared regions.5–18 Since NADH is a fluorophore with an absorption peak at 350 nm and a fluorescence peak at 460 nm,19,20 it is very crucial to develop fluorescent probes with deep red and near-infrared fluorescence to void fluorescence interference from the NADH fluorophore, as these probes can emit light at longer wavelengths that are less likely to overlap with NADH’s fluorescence. Connecting a 1-methylquinolinium acceptor to different electron-withdrawing acceptors is a reported strategy to develop deep red and near-infrared fluorescent probes for NADH detection. Several probes using this strategy have been reported in the literature.5–18 The present paper describes a low-cost method to create two deep red-emitting cyanine dyes (probes A and B) for detecting NADH. Thiophene and 3,4-ethylenedioxythiophene were used as connection bridges between 1-methyl-1,4-dihydroquinoline and formyl electron-withdrawing acceptors, resulting in large Stokes shifts (Scheme 1). Probes A and B showed absorption peaks at 313 nm and 334 nm with negligibly weak fluorescence in the absence of NADH because the probes consist of two electron acceptors without any electron donor (Scheme 1). The gradual addition of NADH to solutions of probes A and B leads to gradual increases of the new absorption peaks at 475 and 486 nm, and new fluorescence peaks at 619 and 576 nm with up to 90-fold and 71-fold enhancement of fluorescence intensities, respectively because NADH reduces the probe 1-methylquinolinium unit as an electron acceptor to the 1-methyl-1,4-dihydroquinoline unit as an electron donor, forming well-defined electron donor and acceptor organic dye systems (Scheme 1). Probe A shows a large Stokes shift of 144 nm as a primarily critical advantageous feature for the practical use of fluorescence, which enables the separation of excitation light from fluorescence to effectively prevent interference from the excitation wavelength. Both probes bear hydrophilic positively charged quaternary amine and formyl residues, which can facilitate probe solubility in an aqueous solution. Both probes possess many advantages, including good photostability, excellent cell permeability, mitochondrial specificity, and low cytotoxicity. The probes have been utilized to determine live cell NAD(P)H levels in the presence of glucose, lactate, pyruvate, trifluoromethoxy carbonylcyanide phenylhydrazone (FCCP), and cisplatin. They monitor NAD(P)H level increases under hypoxic conditions and can visualize NAD(P)H inside fruit fly larvae of D. melanogaster.
Scheme 1.

Probe reactions with NADH.
2. Experimental section
2.1. Experimental methods
Detailed experimental methods and materials can be found in the ESI.†
2.2. Fluorescence microscopy cellular imaging
A549 lung cancer cells were obtained from ATCC and imaged using fluorescence microscopy after being cultured overnight and transferred to confocal dishes. Probes A and B were diluted in DMEM medium without fetal bovine serum to a final concentration of 5 μM and then incubated with the A549 cells for 1 hour at 37 °C. Further information can be found in the ESI.†
3. Results and discussion
3.1. Probe design and synthesis
A cyanine dye with a quinoline moiety and a small Stokes shift of 30 nm has been used for NADH detection in live cells with an emission at 550 nm.18 In order to shift the fluorescence of the cyanine dyes into the deep red region and to enlarge the Stokes shifts to prevent optical interference from fluorescence of NAD(P)H, we employed a cost-effective tactic to prepare two fluorescent probes (A and B) with thiophene and 3,4-ethylenedioxythiophene connection bridges between 1-methylquinolinium and formyl electron-withdrawing acceptors, respectively (Scheme 2). Initially, we conducted a Suzuki palladium-catalyzed coupling reaction of quinolin-3-ylboronic acid (1) with 5-bromothiophene-2-carbaldehyde (2) to afford 5-(quinolin-3-yl) thiophene-2-carbaldehyde (3). Probe A was prepared by methylation of compound 3 with methyl trifluoromethanesulfonate in methylene chloride solution at room temperature. Probe B with an electron-rich 3,4-ethylenedioxythiophene connection bridge was prepared in the same way as probe A as outlined in Scheme 2, but using 7-bromo-2,3-dihydrothieno[3,4-b][1,4]dioxine-5-carbaldehyde (5). These probes are hydrophilic and possess positive charge quaternary amine and formyl residues, increasing their solubility in aqueous solutions. The chemical structures of the probes were confirmed by 1H, 13C NMR, and mass spectrometers (Fig. S1–S10, ESI†).
Scheme 2.
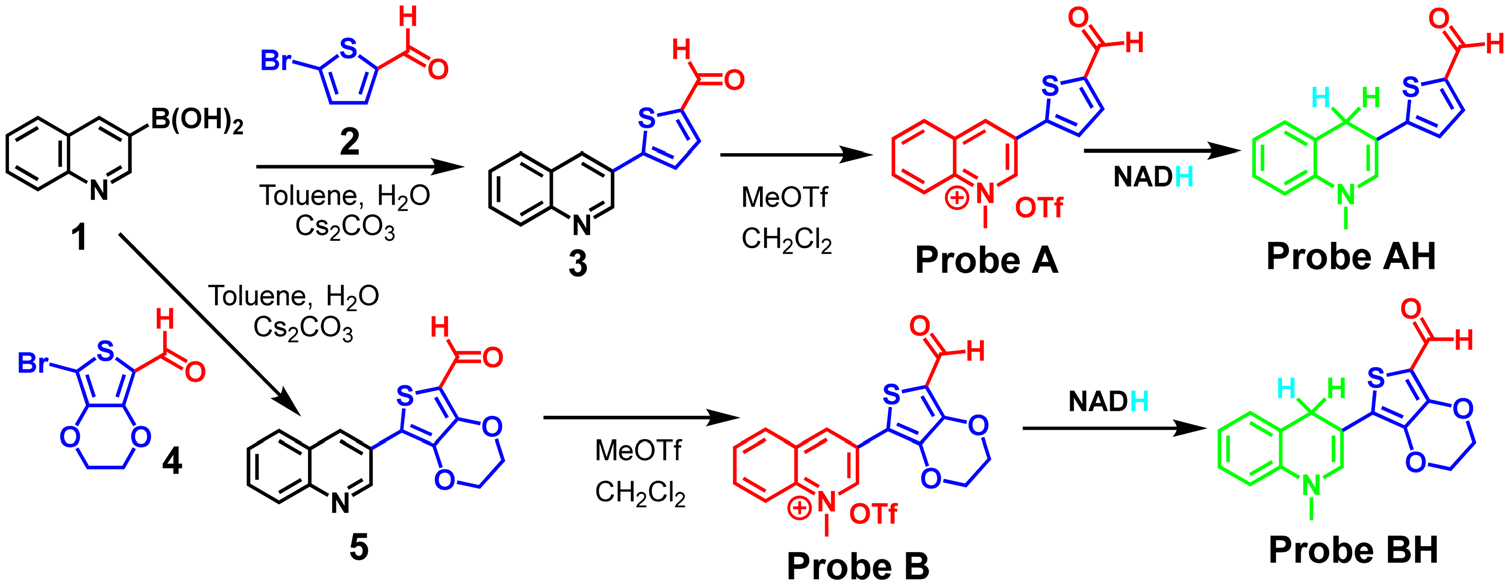
Detailed approaches for the syntheses of the probes.
3.2. Optical study of the probes to NADH responses
In a pH 7.4 PBS buffer, optical measurements were taken with varying NADH concentrations in the presence and absence of the probes. Probe A shows a major absorption peak at 315 nm, whereas probe B, with its more electron-rich 3,4-ethylenedioxy-thiophene connection bridge, exhibits a slightly elongated peak at 334 nm (Fig. 1). The gradual addition of NADH to the buffer, which contains 5 μM of probes A and B, results in the formation of new absorption peaks at 477 nm and 486 nm, respectively, and a noticeable color change from colorless to yellow (Fig. 1 and 2). As outlined in Scheme 1, the appearance of the additional absorption peaks is attributed to the reduction of both probes by NADH, which generates well-defined fluorescent dyes exhibiting intramolecular charge transfer from an electron donor to an acceptor (Fig. S5 and S10, ESI†). The longer absorption peak of probe B is due to the more electron-rich 3,4-ethylenedioxythiophene connection bridge in the presence of NADH.
Fig. 1.
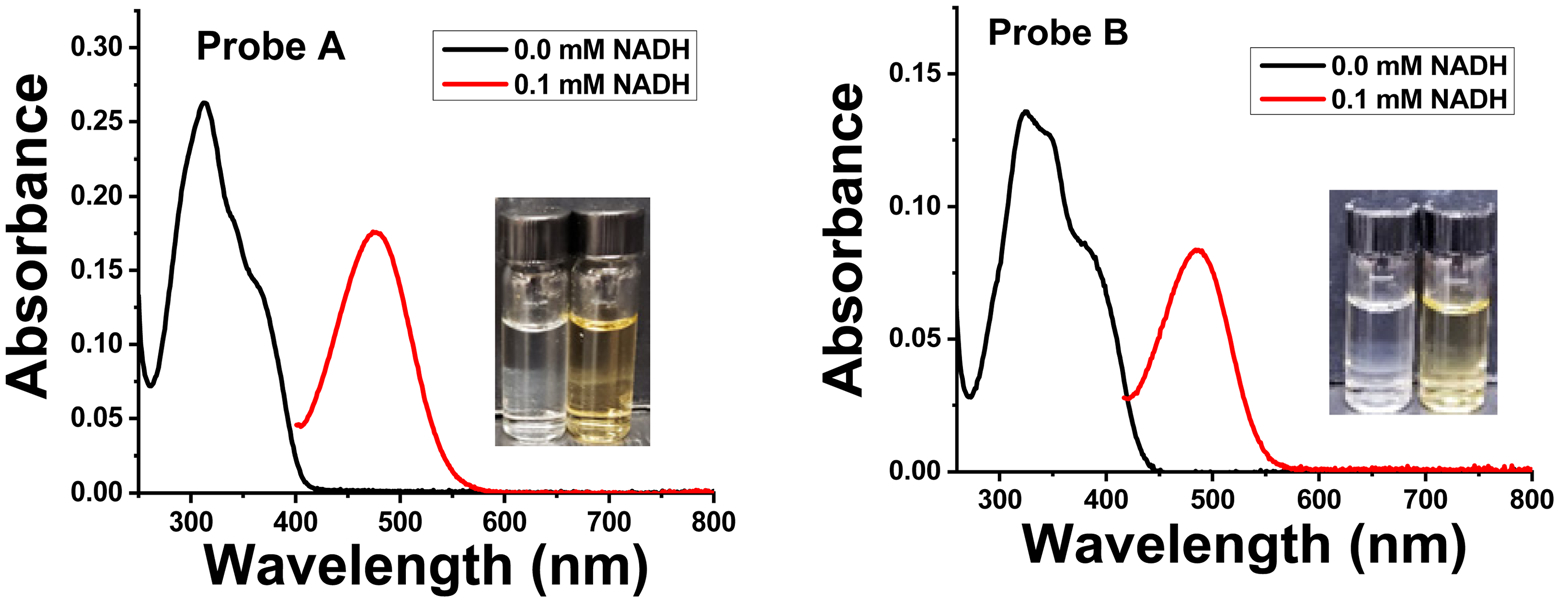
The absorption spectra of probes A (left) and B (right) at a concentration of 5 μM in pH 7.4 phosphate buffer were measured both with and without the addition of 0.1 mM NADH following a 150 minute incubation period of the probes with NADH.
Fig. 2.
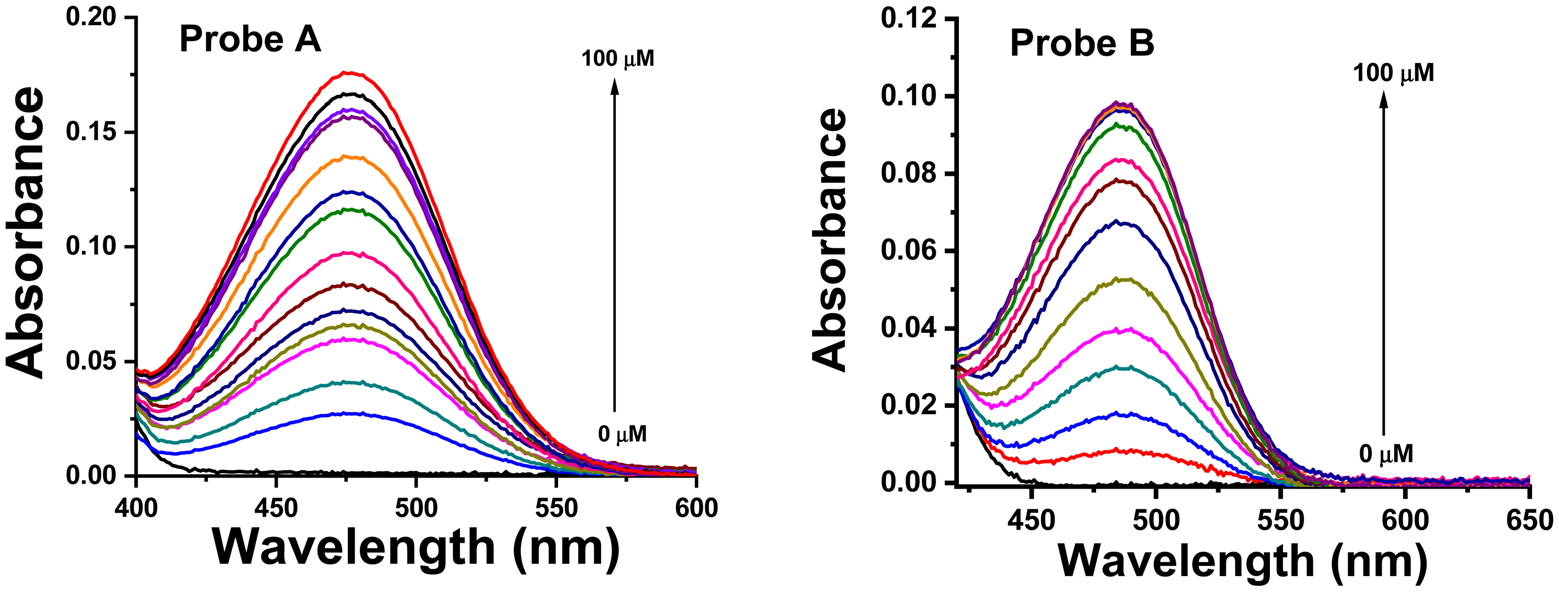
The absorption spectra of probes A (left) and B (right), at a concentration of 5 μM in pH 7.4 phosphate buffer, were measured both with and without the addition of various concentrations of NADH following a 150 minute incubation period.
Both probes A and B exhibit weak fluorescence due to the presence of two electron-withdrawing acceptors, 1-methylquinolinium and formyl, without any electron donors when NADH is not present (Fig. 3). However, with the increase of NADH concentrations, new fluorescence peaks appear at 619 nm for probe A and 576 nm for probe B due to NADH reduction of the electron-withdrawing acceptor 1-methylquinolinium into the electron-donating 1-methyl-1,4-dihydroquinoline (Fig. 3), creating well-defined fluorophores with the electron donor–acceptor systems and enhancing probe fluorescence (as shown in Schemes 1 and 2). Fig. S11 (ESI†) demonstrates that both probes exhibit linear fluorescence responses to NADH up to 50 μM. The reaction products (probes AH and BH) of probes A and B with NADH were further confirmed by mass spectrometry (Fig. S5 and S10, ESI†). The incorporation of thiophene and 3,4-ethylenedioxythiophene bridges between the electron donor and acceptor units in the fluorophores allows for the tuning of the probe fluorescence to the deep red and red regions. The more electron-rich 3,4-ethylenedioxythiophene connection bridge in probe B results in a shorter emission peak at 576 nm as compared to probe A’s emission peak at 619 nm, due to the reduced charge density of the fluorophore (Schemes 1 and 2). The probe’s fluorescence response time to NADH was determined to be 150 minutes, with steady responses achieved after 150 minutes of reaction time (Fig. 4).
Fig. 3.
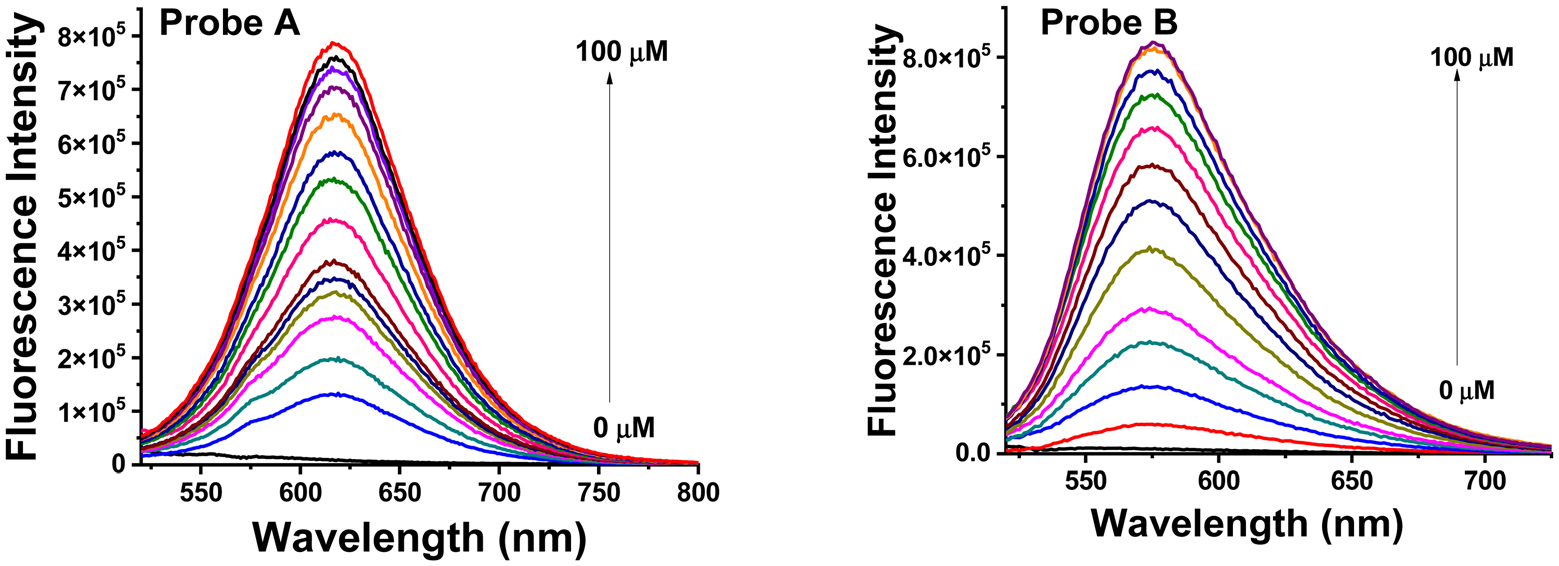
Luminescence spectra of probes A (left) and B (right) at a concentration of 5 μM in pH 7.4 phosphate buffer without and with varying concentrations of NADH after a 150 minute incubation period.
Fig. 4.
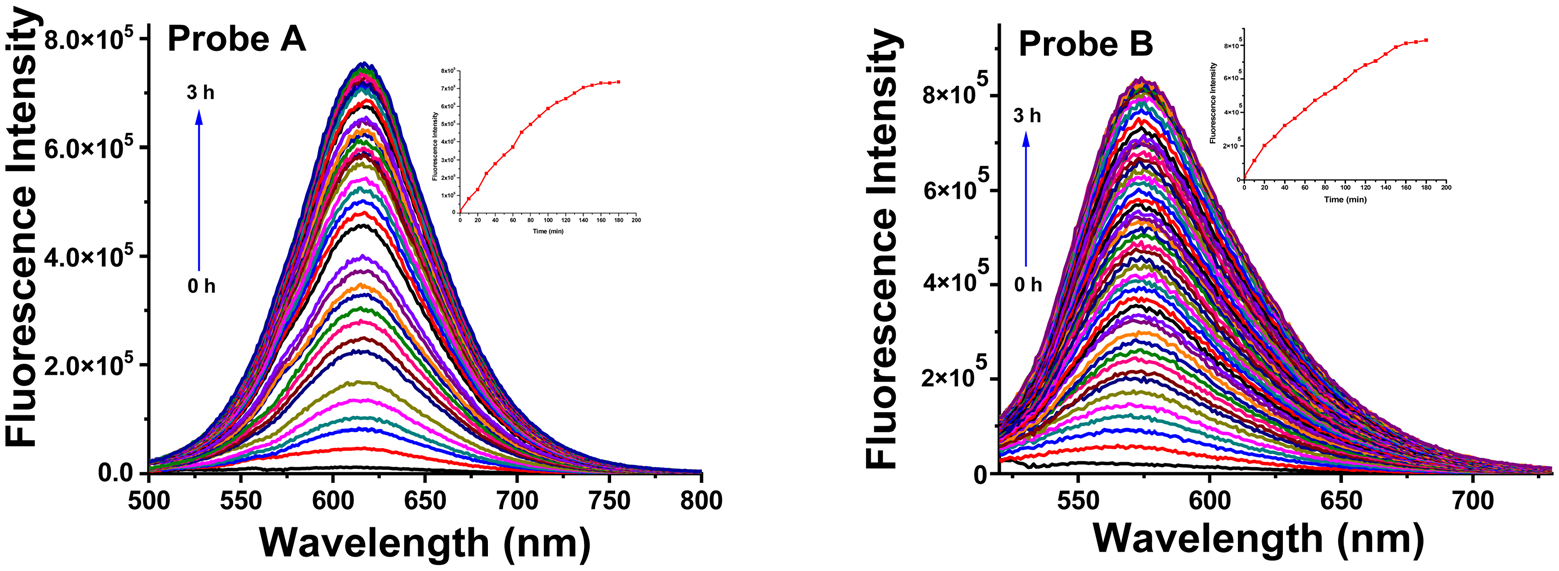
Time-dependent fluorescence enhancement of probes A (left) and B (right) with 100 μM NADH with an excitation at 480 nm.
3.3. Theoretical calculations of the probes
Theoretical calculations were conducted to optimize the geometries of each of the probes and to determine their primary electronic transitions. Each probe contained differences in the mean square plane angles between the N-methyl quinoline and the attached group (i.e., 2,3-thieno 2-carboxyaldehyde or 2,3-thieno-(3,4b)(1,4)-dioxine-2-carbaldehyde). These angles are 30.3°, A; 3.8°, AH; 19.8°, B; and 36.4°, BH. For probes A and AH, a low energy conformation consisted of the N and S atoms on the different moieties being opposite to one another and, in the case of AH, a more co-planar arrangement is observed presumably by situating the lone pair on the S atom between the two H atoms bonded on the adjacent N-methyl quinoline group. For probes B and BH, the dioxine O atoms shift from a proximal (prox) geometry in B to a distal (dis) geometry for the N atom in the N-methyl quinoline group in BH (Fig. 5). It is of some interest to see what difference these conformations would have on the calculated absorptive properties of probe BH. Interestingly, the distal geometry has a corresponding interplanar angle (as defined above) of 3.6° compared to 36.4° for the proximal conformation.
Fig. 5.

Mercury21 illustrations for the proximal (left) and distal (right) conformations in probe BH.
The data for the experimental and calculated absorptions are listed in Table 1. We decided to compare the APFD,22 CAM-B3LYP,23 and PBE1PBE24 functionals based on a TD-DFT calculation for absorption (using the optimized geometry from an APFD/6-311+G(d,p) functional and basis set) as it was reported that the last two of these provide estimates closest to the experimental values and that CAM-B3LYP was especially useful for delocalized excited states.25
Table 1.
Calculated absorption (TD-DFT) values in nm with oscillation strengths in parentheses using the APFD, CAM-B3LYP, and PBE1PBE functionals together with 6-311+G(d,p) basis sets
| Probe | Experimental values | APFD | CAM-B3LYP | PBE1PBE |
|---|---|---|---|---|
| A | 313 | 381 (0.2092) | 336 (0.3662) | 376 (0.2216) |
| 308 (0.6472) | 287 (0.4548) | 307 (0.5806) | ||
| AH | 475 | 445 (0.8396) | 414 (0.8941) | 441 (0.8482) |
| B | 350 | 420 (0.1358) | 359 (0.4319) | 412 (0.1856) |
| 337 (0.4178) | 307 (0.411) | 333 (0.4446) | ||
| BH (prox) | 485 | 456 (0.6205) | 410 (0.7114) | 451 (0.6294) |
| BH (dis) | 485 | 439 (0.8626 | 408 (0.9265) | 436 (0.872) |
Comparing the experimental values for probes A and B, the CAM-B3LYP produced the closest agreement (Δ, 23 and 9 nm) compared to APFD (Δ, 68 and 70 nm) and PBE1PBE (Δ, 63 and 72 nm) for A and B, respectively. It is interesting that for all probes, the APFD and PBE1PBE functionals resulted in values that differed only by 4–8 nm, meaning these functionals produced similar values with the TD-DFT calculation. There were closer agreements with the transition (i.e., the second one listed) in the UV range for probes A and B. The APFD and PBE1PBE functionals also produced values closer to those obtained experimentally for probes AH and BH compared to CAM-B3LYP, see Table 1.
It was of interest to explore if the differences in calculated values would be reflected in the current difference density diagrams (essentially the LUMO–HOMO) and also how BH (prox) would compare to BH (dis) (Fig. 6). This is important because it forms one basis for interpreting the nature of the absorptions. The drawings for each probe in Fig. 5 were not completed in identical orientations, which may result in slight changes in the intensity of the color. In these drawings, the electron density shifts from red to blue, and if there was a complete delocalization, not much color difference would be observed. The drawings for each probe do not show significant color differences, suggesting that while there may be differences in reproducing the experimental results, the meanings ascribed to the transition would be similar, making this an important result. Additionally, a comparison of the drawings for BH (prox) to BH (dis) shows that there is simply a rotation of the moieties and colors with matching intensities. This may be why there were no large differences in the calculated values (Table 1). The current density diagrams show a curious trend in the shifting electron densities between probes A and B, and their hydrogenated counterparts AH and BH. For the former probes, the electron density appears to shift from the thiophene group to the quinoline group, whereas for the hydrogenated probes, the electron density shifts from the quinoline groups to the thiophene groups (Fig. 6). This is perhaps due to the reduction of the quinoline groups in AH and BH, which made them more electron-rich than those in probes A and B, which had a positive charge.
Fig. 6.
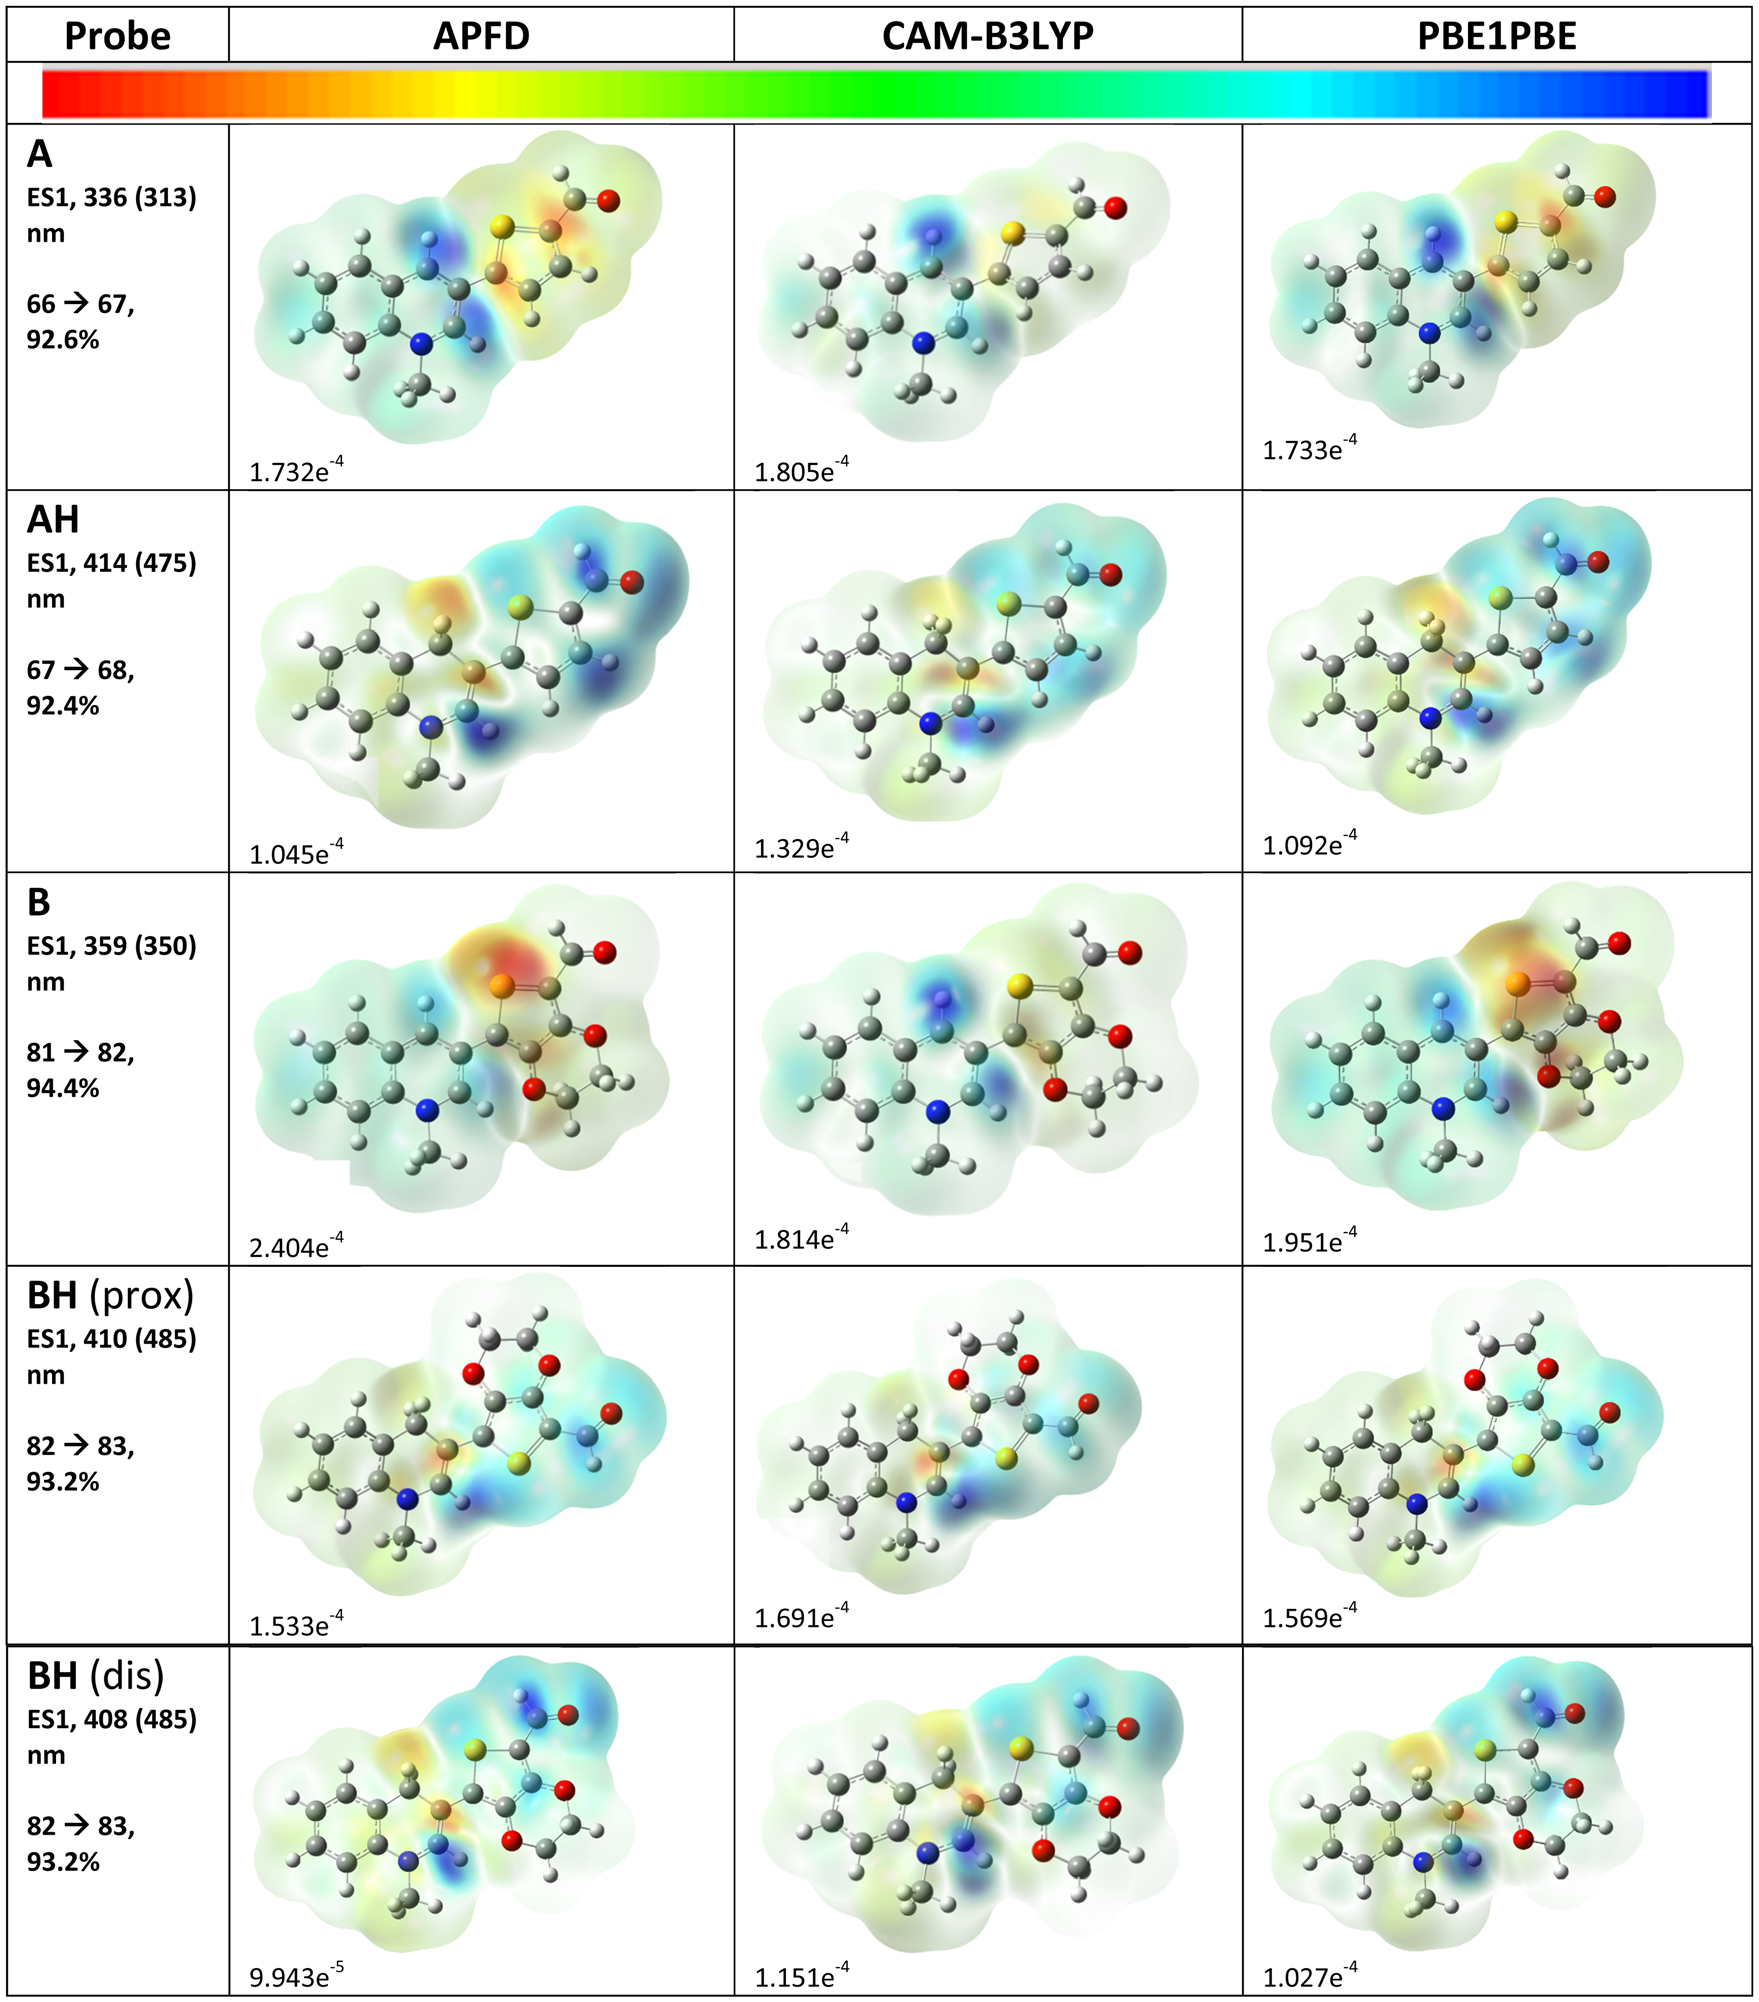
Current density drawings of the HOMO–LUMO transitions with the probes defined with 6-311+G(d,p) basis sets with functionals APFD, CAM-B3LYP, and PBE1PBE. Values for the color scale on the top of the figure are also listed. The ESI† contains diagrams of the numbered molecular orbitals.
3.4. NADH probe selectivity and pH effect
The selectivity of fluorescent probes is important because it ensures that the fluorescent signal generated by the probe is attributable to the presence of the target of interest, rather than other interfering substances. This is crucial for the accurate and reliable detection, quantification, and imaging of biological processes and events, both in vitro and in vivo. Moreover, high selectivity minimizes false positives and false negatives, reduces background noise, and enhances the sensitivity and specificity of the measurement. We studied the probe selectivity to NAD(P)H in pH 7.4 PBS buffer holding different biologically related species. Both probes display highly selective fluorescence responses to NAD(P)H over 0.1 mM reactive sulfur species, such as cysteine and glutathione (GSH), and 0.1 mM of different other amino acids, including lysine (Lys), glycine (Gly), alanine (Ala), tyrosine (Tyr), and methionine (Met). Moreover, both probes display no significant responses to 0.1 mM anions, including SO32−, Cl−, NO3−, NO2−, NO3−, HCO3−, SO42−, CO32−, and 0.1 mM of biologically important cations, such as Co2+, Zn2+, Fe3+, Fe2+, Na+, and K+. Also, both probes display no significant responses to 0.1 mM of other molecules, including H2O2, glucose, ribose, fructose, and galactose (Fig. S12 and S13, ESI†).
The individual probes display no change in fluorescence intensity in different buffer solutions – varying (from pH 2.0 to 9.0 because intramolecular charge transfer is restricted due to the presence of two electron-withdrawing acceptors within the probes in the absence of NADH (Fig. S14, ESI†). However, the probes exhibit significant fluorescent responses to NADH under neutral and slightly basic pH conditions. Under strongly acidic conditions, the probes show weaker fluorescence responses to NADH presumably due to the decomposition of NADH.
3.5. Probe cytotoxicity and photostability
Ensuring low cytotoxicity is critical for fluorescent probes used in cellular imaging applications because highly cytotoxic probes can cause cell death, inflammation, and other negative effects that can hinder experimental outcomes. Therefore, assessing probe cytotoxicity is a crucial step in determining the biocompatibility of the probes. In our study, we evaluated the cytotoxicity of both probes to A549 cells using an MTT assay (Fig. S15, ESI†).26 The results indicated that both probes exhibited excellent biocompatibility, with cell viability maintained at 90% even at a high probe concentration of 50 μM (Fig. S15, ESI†). These findings demonstrate that the probes are safe to use in live cell experiments and can be considered for further biological studies. As evidenced by Fig. S16 (ESI†), both probes demonstrate excellent resistance to photobleaching.
3.6. Fluorescence cellular imaging
The evaluation of intracellular NADH in live A549 cells is crucial for the understanding of cellular metabolism and various physiological processes. In this study, we investigated the ability of two biocompatible probes to perform this task. After a 1 hour incubation at 37 °C, both probes exhibited moderate cellular fluorescence intensity and excellent cell permeation, suggesting their potential as intracellular NADH sensors. To confirm the probe’s specificity to NADH, we performed an additional hour of incubation with varying extracellular NADH concentrations (20, 50, and 100 μM) in the cell medium. As shown in Fig. 7, the cellular fluorescence of both probes increased in a concentration-dependent manner, indicating their highly selective responses to NADH. These results suggest that the probes have great potential as powerful tools for intracellular NADH detection in live cell experiments.
Fig. 7.

Confocal fluorescence images of A549 cells incubated with 5 μM of either probe A (left) or B (right) in cell medium for one hour, followed by treatment with varying concentrations of NADH in cell medium for an additional hour. The scale bars on the images represent 50 μm.
The conversion of one glucose molecule to two pyruvate molecules during glycolysis is a well-known process that results in the production of two ATP and two NADH molecules, with the reaction rate being dependent on the glucose concentration. However, an imbalance in NADH levels can have negative effects on glucose and lipid metabolism, leading to the development of metabolic diseases, such as diabetes and obesity. NADH is a critical component in cellular energy production, and an imbalance in its levels can interfere with glucose uptake and lipid metabolism. Moreover, NADH imbalance can affect insulin secretion and sensitivity, contributing to metabolic disorders. In diabetes patients with excess glucose, NADH overproduction can severely disrupt the balance between NADH and NAD+, exacerbating the situation.27 In this study, we aimed to investigate the ability of probes A and B to detect NADH production during glycolysis. To achieve this, we conducted an experiment using A549 cells. First, we pre-treated the cells with different concentrations of glucose for one hour to initiate glycolysis. Subsequently, we incubated the glucose-pretreated cells with either 5 μM probe A or B for another hour (as illustrated in Fig. 8). Our findings revealed that the cellular fluorescence intensities increased as the glucose concentration increased from 5 mM to 20 mM. This observation indicates that the probes can accurately monitor intracellular NADH level changes during glycolysis, as higher glucose concentrations lead to increased NADH production. Therefore, the probes have the potential to serve as an effective tool for studying NADH production during glycolysis in cells. The results of this study provide valuable insights into the regulation of energy metabolism and may contribute to the development of new strategies for the diagnosis and treatment of metabolic disorders.
Fig. 8.
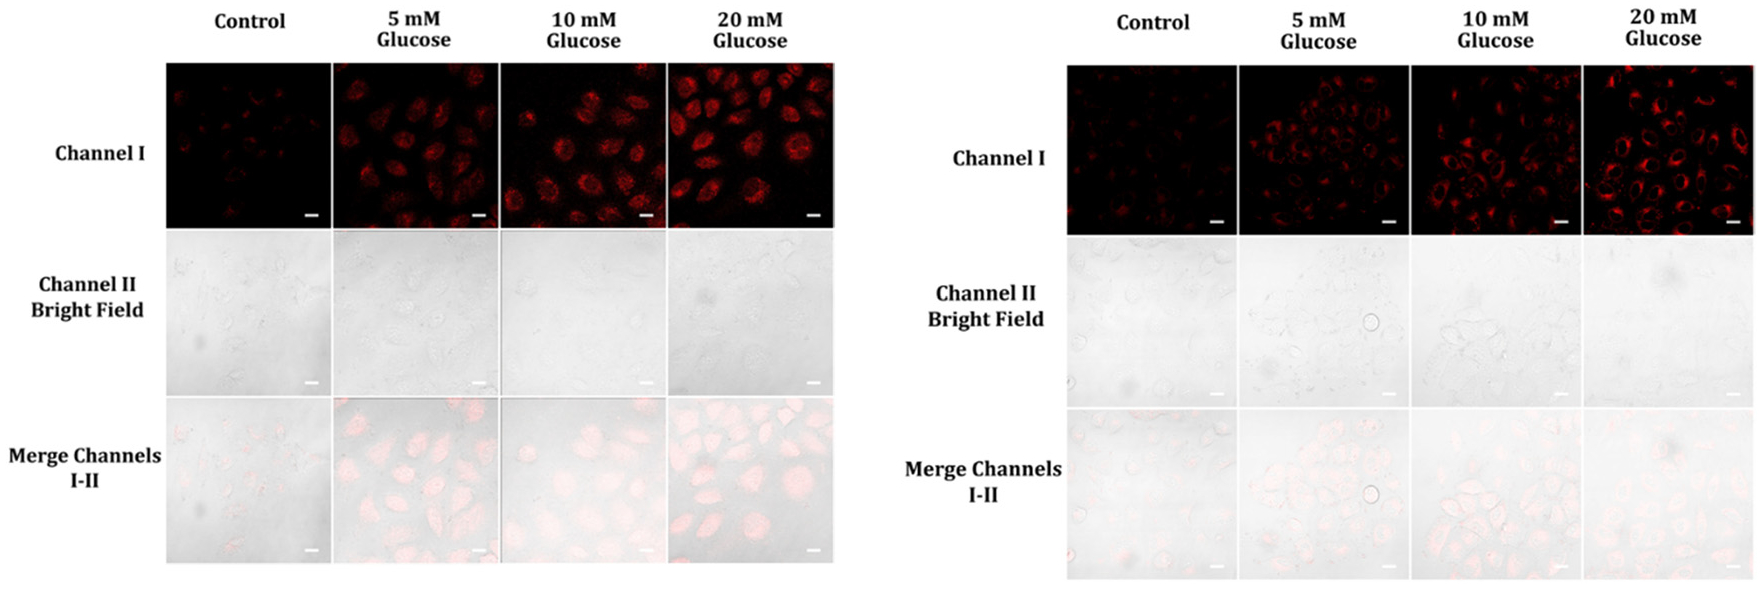
Fluorescence images of A459 cells pre-treated with different concentrations of glucose (0, 5, 10, 20 mM) in cell medium for one hour, followed by incubation with 5 μM of either probe A (left) or B (right) in cell medium for an additional hour. The fluorescence images were acquired from 575 nm to 675 nm for probe A and from 550 nm to 650 nm for probe B, with excitation at 488 nm. The scale bars on the images represent 50 μm.
In order to locate the probes within live cells, co-localization experiments were conducted on A549 cells. These cells were first pretreated with 20 mM glucose for one hour and then incubated with a mitochondria-targeting cyanine dye (IR-780) and either probe A or B for an additional hour. Since the probes have one positively charged residue, it is hypothesized that they specifically target mitochondria through electrostatic interactions with the negatively charged mitochondrial membrane surface. Co-localization experiments were performed to confirm this hypothesis, and the results showed Pearson correlation coefficients greater than 0.94 between the cyanine dye (IR-780) and probe A or B (Fig. 9). This ability of the probes to specifically target mitochondria is particularly useful, as mitochondria are the primary site of NADH production in cells. This feature of the probes allows us to measure changes in mitochondrial NADH levels specifically, which can provide important information about mitochondrial function.
Fig. 9.
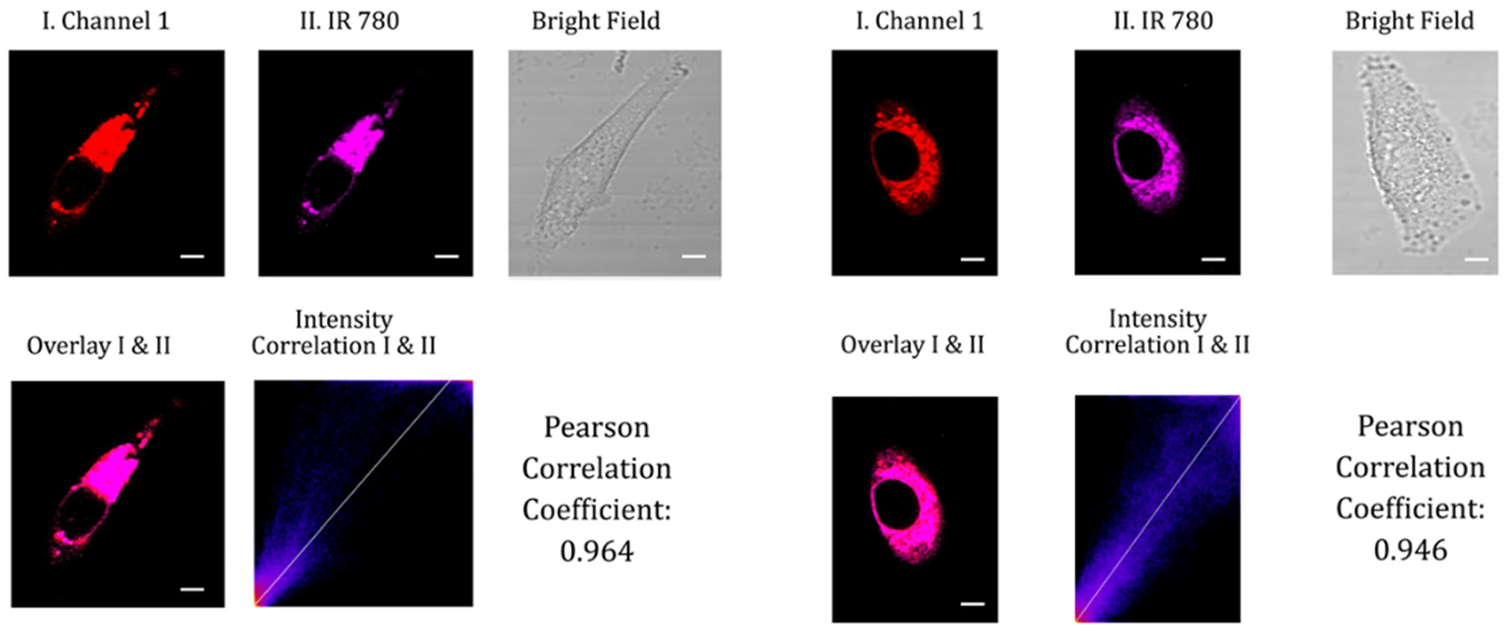
Confocal fluorescence images of A549 cells pre-treated with 50 mM glucose in cell medium for one hour, followed by co-incubation with 5 μM of either probe A (left) or B (right) and 5 μM of the mitochondria-specific cyanine dye IR-780 in cell medium for an additional hour. Fluorescence images were acquired from 575 nm to 675 nm for probe A and from 550 nm to 650 nm for probe B, with excitation at 488 nm. The near-infrared emission of IR-780 was obtained in the magenta channel II from 750 nm to 800 nm under excitation at 635 nm. The scale bars on the images represent 20 μm.
Pyruvate is a key molecule in human biochemistry, playing an important part in metabolic reactions. It is the end product of glycolysis in the cytoplasm and enters the mitochondria where it is oxidized to sustain the flow of carbon through the citric acid cycle.28 Imbalances of pyruvate metabolism can contribute to diseases like heart failure, cancer, and neurodegeneration.28,29 Cancer cells possess a distinctive metabolic pathway that diverts pyruvate into lactate instead of using it as energy like regular cells would do. This process, known as glycolysis, entails transforming NADH into lactate utilizing lactate dehydrogenase while NADH is oxidized to form NAD+. To investigate the repercussions of external pyruvate on NADH levels in still-living cells, A459 cells were initially exposed to either pyruvate, lactate, or a mix of both and subsequently cultivated with probe A or B for one hour (Fig. 10). The fluorescence intensity of A459 cells which were first prepped with 5 mM pyruvate drastically decreased, while the light emitted by cells initially treated with 10 mM lactate increased significantly. On the other hand, the luminescence of cells introduced to a blend of 5 mM pyruvate and 10 mM lactate was less brilliant than that of cells solely treated with 10 mM lactate, inferring that the ratio between pyruvate and lactate has an important influence on NADH levels in living cancerous cells (Fig. 10).
Fig. 10.

Fluorescence images of A459 cells subjected to various pre-treatment conditions, such as lactate, pyruvate, or a mixture of the two in cell medium, for an hour before being incubated with 5 μM of probe A or B in cell medium for a further hour. Images of the fluorescent emission from these cells were then collected at 488 nm excitation and their signals were analyzed at the corresponding wavelength ranges (575 nm to 675 nm for probe A, and 550 nm to 650 nm for probe B). The resulting images, featuring probe A on the left and probe B on the right, are shown. The scale bars on the images represent 50 μm.
Hypoxia, a state of low tissue oxygen level, arises from an imbalance between the oxygen supply and use in retaining cellular functions. Hypoxia is exemplified by low levels of oxygen in tissues and can come from a range of factors, including decreased oxygen availability, decreased oxygen transport, and enhanced oxygen consumption. Hypoxia is known as a well-established feature of a variety of diseases including cardiac ischemia, stroke, and solid tumor.30,31 We investigated NAD(P)H level changes under hypoxic conditions triggered by CoCl2 treatment.32 The study found that cellular fluorescence intensities increased gradually with increasing concentrations of CoCl2, which is consistent with a previous report suggesting that NADH levels accumulate in cells during hypoxia (Fig. 11).33 NADH is a molecule that exerts a crucial role in cellular respiration, and its accumulation can be indicative of altered metabolic activity in cells under hypoxic conditions.
Fig. 11.

Images of A459 cells pre-treated with CoCl2 concentrations of 50, 100, and 150 μM in cell medium for 12 hours and then exposed to probe A (left) or B (right) at a concentration of 5 μM in cell medium for an hour were acquired via fluorescence imaging from 575–675 nm (A) and 550–650 nm (B) when excited at 488 nm. The results indicate an alteration in NADH levels and cellular metabolic activity in response to CoCl2 treatment of different concentrations as observed by the changes in fluorescence intensity. Scale bars on the images represent 50 μm.
We further investigated the effect of a mitochondrial uncoupling agent, FCCP (Carbonyl cyanide-p-trifluoro methoxy-phenylhydrazone) on the NADH level in live cells by treating A459 cells with 5 μM FCCP for 15 min and then further incubating the treated cells with probe A or B for one hour. The results showed that FCCP treatment led to a decrease in cellular fluorescence, which is consistent with a previous report suggesting that FCCP reduces the NADH concentration.34 FCCP can disrupt the electron transport chain in mitochondria, leading to a reduction in ATP production and alterations in metabolic activity. The decrease in NADH levels observed in this study may reflect changes in cellular respiration induced by the FCCP treatment (Fig. 12).
Fig. 12.
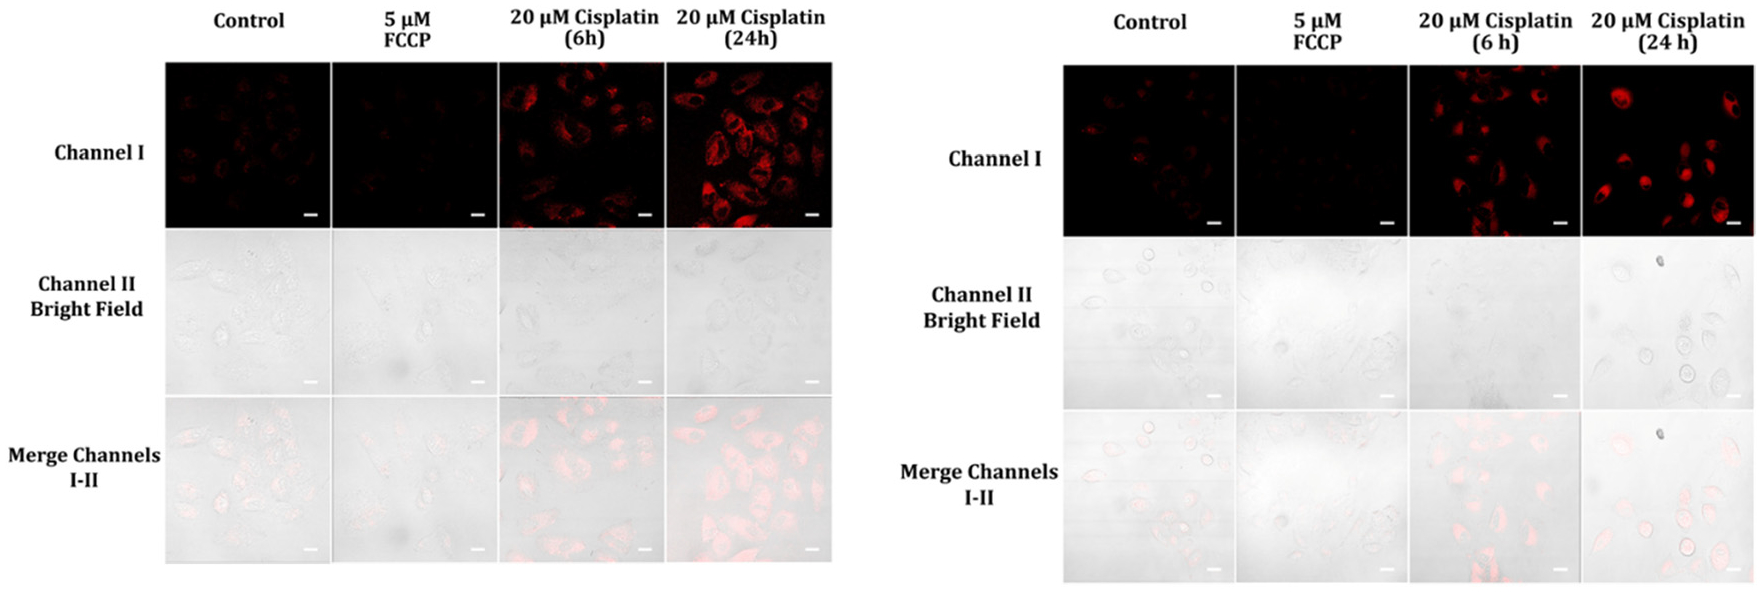
Cellular fluorescence images of A459 cells pre-treated with 5 μM FCCP in cell medium for 15 minutes and 20 μM cisplatin in cell medium for 6 and 24 hours, then incubated with 5 μM probes A (left) and B (right) in cell medium for one hour. The cells’ fluorescence was gathered from a 488 nm excitation within a range of 575–675 nm for probe A and 550–650 nm for probe B. Scale bars of the images were 50 μm.
Cancer drug treatment can trigger changes in NADH levels in cells. Several anti-cancer drugs work by tracking specific cellular pathways and interrupting cellular metabolism, which can change the balance of NADH and other molecules involved in energy production. For example, some chemotherapy drugs impede enzymes involved in the production of NADH, which can lead to decreased levels of NADH in cells. Other cancer drugs may increase NADH levels by changing the cellular metabolism or by impacting enzymes involved in NADH production or utilization. The specific effects of anti-cancer drug treatments on NADH levels can differ depending on the drug, the type of cancer being treated, and other factors, and may have important implications for treatment effectiveness and potential side effects. Monitoring NADH levels during cancer treatment can offer important information about how cancer cells are reacting to therapy and may guide treatment decisions. Cisplatin, an effective and leading anti-cancer drug, has been employed to treat different varieties of cancer including testicular, head, neck ovarian, lung, and bladder cancers.35,36 Cisplatin is reported to target mitochondria in cancer cells and disrupt mitochondrial function.37 It was reported that cisplatin treatment results in decreases in the NAD+/NADH ratio in cancer cells.38 We investigated the feasibility of our probes in detecting NADH level changes during this anti-cancer drug treatment. As a result, A459 cells show strong cellular fluorescence after the cells were treated with 20 μM cisplatin for 6 and 24 hours and further incubated with probe A or B for one hour, indicating that the cisplatin treatment of A459 results in increasing NADH concentrations (Fig. 12).
To demonstrate the feasibility of using our probes in vivo to detect the presence of NAD(P)H, we chose the fruit fly species D. melanogaster as an animal model. Initially, we incubated food-hatched D. melanogaster first-instar larvae with 5 μM probe A (left) and probe B (right) in an aqueous solution for 6 hours, followed by fluorescence microscopy and imaging. The larvae showed strong fluorescence after the 6 hour incubation with probe A or B (Fig. 13), indicating that the probes can effectively visualize NAD(P)H inside larval tissues. The larvae did not exhibit any fluorescence without probe treatment,39,40 supporting the specificity of the probes for detecting NAD(P)H in live organisms.
Fig. 13.

The fluorescence images depict food-hatched Drosophila melanogaster first-instar larvae exposed to a 5 μM aqueous solution of probes A (left) and B (right) for 6 hours. The images were acquired by exciting the probes at 488 nm and collecting emission signals from 575 to 675 nm for probe A and from 550 to 650 nm for probe B with scale bars of 200 μm.
To detect NAD(P)H changes inside Drosophila melanogaster first-instar larvae, we incubated starvation-hatched Drosophila melanogaster first-instar larvae with different NADH concentrations (0, 20 μM, 50 μM, and 100 μM) for 30 minutes. We washed the larvae with pH 7.4 PBS buffer three times and further incubated the NADH-pretreated larvae with 5 μM probe A for one hour. Starvation-hatched larvae without NADH treatment showed lower fluorescence than food-hatched larvae (Fig. 13 and 14). This is because starvation-hatched fruit fly larvae are those that have hatched from eggs that have not been provided with any food. These larvae experience a state of nutrient deprivation, which can lead to a decrease in their NAD(P)H levels. When there is a lack of nutrients, the larvae switch to a metabolic state that conserves energy. This reduces the larvae’s metabolic activity and the demand for NAD(P)H, leading to lower levels of NAD(P)H compared to those in larvae that have hatched in the presence of food. Food-hatched fly larvae, on the other hand, have access to nutrients from the start and can maintain a higher metabolic activity, which requires a higher demand for NAD(P)H. Therefore, the levels of NAD(P)H in these larvae are generally higher than those in starvation-hatched larvae. In addition, the fluorescence intensity of the NADH-pretreated starvation-hatched fly larvae was significantly enhanced with increases in NADH concentrations of the pre-treatment, indicating that probe A can be applied to detect NADH level changes inside the fly larvae.
Fig. 14.
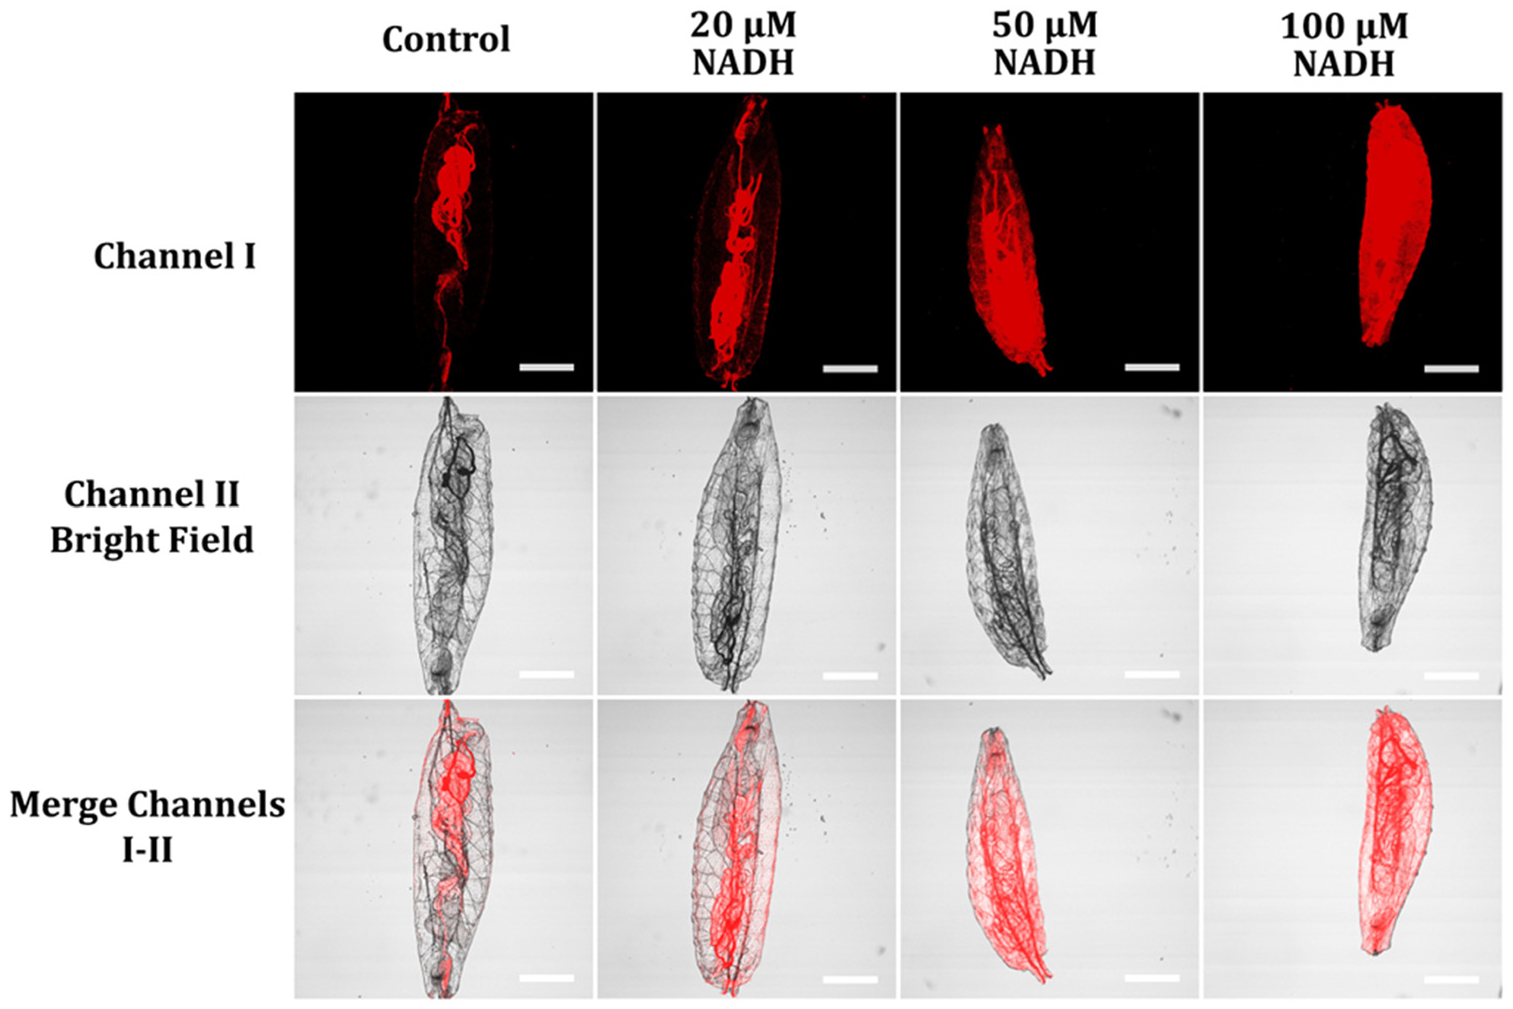
Fluorescence images of starvation-hatched D. melanogaster first-instar larvae pre-incubated with various NADH concentrations (0, 20 μM, 50 μM, and 100 μM) for 30 minutes, washed with pH 7.4 PBS buffer thrice, and subsequently treated with 5 μM probe A in an aqueous solution for an hour. The images were obtained by exciting the probes at 488 nm and collecting emission signals ranging from 575 to 675 nm with scale bars of 200 μm.
4. Conclusion
In summary, fluorescent probes A and B were created, using thiophene and 3,4-ethylenedioxythiophene units as a bridge for the conjugated π system, and linked with 1-methylquinolinium and formyl acceptors, respectively. These probes display mitochondrial specificity, along with favorable biocompatibility and cell permeability. The probes’ capability to monitor changes in NAD(P)H levels under various chemical stimuli, such as glucose, lactate, pyruvate, FCCP, cisplatin, and hypoxia, makes them a versatile choice for investigating a broad range of cellular processes. The probes have been utilized effectively to determine NAD(P)H levels in the first-instar larvae of D. melanogaster, suggesting that they may have the potential for use in other organisms as well. Furthermore, these probes have the potential to be transformed into near-infrared fluorescent probes through the modification of the formyl group through condensation reactions with various electron-withdrawing acceptors, which are currently under investigation and will be reported in due course.
Supplementary Material
Acknowledgements
The National Institute of General Medical Sciences of the National Institutes of Health offered financial backing for the research, through Award Numbers R15GM114751 (for H. Y. Liu), 2R15GM114751-02 (for H. Y. Liu), and R15 GM146206-01 (for H. Y. Liu and R. Luck). We also acknowledge the National Science Foundation under award number 2117318 for fiscal support to purchase a new NMR spectrometer to characterize the fluorescent probes (for H. Y. Liu). Furthermore, the computation calculations of the fluorescent probes were executed on a high-performance computing infrastructure at Michigan Technological University.
Footnotes
Electronic supplementary information (ESI) available. See DOI: https://doi.org/10.1039/d3tb00645j
Conflicts of interest
The final version of the manuscript has received approval from each author. No conflicts of interest are to be reported.
References
- 1.Ying WH, Antioxid. Redox Signaling, 2008, 10, 179–206. [DOI] [PubMed] [Google Scholar]
- 2.Eto K, Tsubamoto Y, Terauchi Y, Sugiyama T, Kishimoto T, Takahashi N, Yamauchi N, Kubota N, Murayama S, Aizawa S, Akanuma Y, Aizawa S, Kasai H, Yazaki Y and Kadowaki T, Science, 1999, 283, 981–985. [DOI] [PubMed] [Google Scholar]
- 3.Alvarez-Gonzalez MI, Saidman SA, Lobo-Castanon MJ, Miranda-Ordieres AJ and Tunon-Blanco P, Anal. Chem, 2000, 72, 520–527. [DOI] [PubMed] [Google Scholar]
- 4.Micheli V, Simmonds HA, Bari M and Pompucci G, Clin. Chim. Acta, 1993, 220, 1–17. [DOI] [PubMed] [Google Scholar]
- 5.Podder A, Murali VP, Deepika S, Dhamija A, Biswas S, Maiti KK and Bhuniya S, Anal. Chem, 2020, 92, 12356–12362. [DOI] [PubMed] [Google Scholar]
- 6.Duan D-C, Liu J, Zheng Y-L, Chen H, Zhang X, Zhang Y, Dai F, Zhang S and Zhou B, Anal. Chem, 2023, 95, 1335–1342. [DOI] [PubMed] [Google Scholar]
- 7.Wang L, Zhang JY, Kim B, Peng JJ, Berry SN, Ni Y, Su DD, Lee J, Yuan L and Chang YT, J. Am. Chem. Soc, 2016, 138, 10394–10397. [DOI] [PubMed] [Google Scholar]
- 8.Xia LL, Hu F, Huang JX, Li N, Gu YQ and Wang P, Sens. Actuators, B, 2018, 268, 70–76. [Google Scholar]
- 9.Maiti M, Vishnu P, Selvakumer D, Podder A, Maiti KK and Bhuniya S, Sens. Actuators, B, 2019, 299, 126964. [Google Scholar]
- 10.Podder A, Koo S, Lee J, Mun S, Khatun S, Kang HG, Bhuniya S and Kim JS, Chem. Commun, 2019, 55, 537–540. [DOI] [PubMed] [Google Scholar]
- 11.Thiruppathi M, Lin PY, Chou YT, Ho HY, Wu LC and Ho JAA, Talanta, 2019, 200, 450–457. [DOI] [PubMed] [Google Scholar]
- 12.Zhao YH, Wei KY, Kong FP, Gao XN, Xu KH and Tang B, Anal. Chem, 2019, 91, 1368–1374. [DOI] [PubMed] [Google Scholar]
- 13.Joo JH, Won M, Park SY, Park K, Shin DS, Kim JS and Lee MH, Sens. Actuators, B, 2020, 320, 128360. [Google Scholar]
- 14.Li MZ, Liu C, Zhang WJ, Xu LF, Yang MM, Chen ZL, Wang XX, Pu LL, Liu WL, Zeng XS and Wang TH, J. Mater. Chem . B, 2021, 9, 9547–9552. [DOI] [PubMed] [Google Scholar]
- 15.Park SY, Yoon SA, Cha YJ and Lee MH, Coord. Chem. Rev, 2021, 428, 213613. [Google Scholar]
- 16.Sun PJ, Zhang HX, Sun YQ and Liu J, Spectrochim. Acta, Part A, 2021, 245, 118919. [DOI] [PubMed] [Google Scholar]
- 17.Zhang YB, Arachchige DL, Olowolagba A, Luck RL and Liu HY, Methods, 2022, 204, 22–28. [DOI] [PMC free article] [PubMed] [Google Scholar]
- 18.Fomin MA, Dmitriev RI, Jenkins J, Papkovsky DB, Heindl D and Konig B, ACS Sens, 2016, 1, 702–709. [Google Scholar]
- 19.Wang HW, Wei YH and Guo HW, Anti-Cancer Agents Med. Chem, 2009, 9, 1012–1017. [DOI] [PubMed] [Google Scholar]
- 20.Buschke DG, Squirrell JM, Fong JJ, Eliceiri KW and Ogle BM, Biol. Cell, 2012, 104, 352–364. [DOI] [PMC free article] [PubMed] [Google Scholar]
- 21.Macrae CF, Bruno IJ, Chisholm JA, Edgington PR, McCabe P, Pidcock E, Rodriguez-Monge L, Taylor R, van de Streek J and Wood PA, J. Appl. Crystallogr, 2008, 41, 466–470. [Google Scholar]
- 22.Austin A, Petersson GA, Frisch MJ, Dobek FJ, Scalmani G and Throssell K, J. Chem. Theory Comput, 2012, 8, 4989–5007. [DOI] [PubMed] [Google Scholar]
- 23.Yanai T, Tew D and Handy N, Chem. Phys. Lett, 2004, 393, 51–57. [Google Scholar]
- 24.Adamo C and Barone V, J. Chem. Phys, 1999, 110, 6158–6170. [Google Scholar]
- 25.Jacquemin D, Perpète EA, Scuseria GE, Ciofini I and Adamo C, J. Chem. Theory Comput, 2008, 4, 123–135. [DOI] [PubMed] [Google Scholar]
- 26.Dwivedi SK, Arachchige DL, Vohs T, Tang J, Usimaki K, Olowoagba AM, Fritz DR, Luck RL, Werner T and Liu H, J. Mater. Chem. B, 2023, 11(13), 2852–2861. [DOI] [PMC free article] [PubMed] [Google Scholar]
- 27.Wu JZ, Jin Z, Zheng H and Yan LJ, Diabetes, Metab. Syndr. Obes.: Targets Ther, 2016, 9, 145–153. [DOI] [PMC free article] [PubMed] [Google Scholar]
- 28.Zangari J, Petrelli F, Maillot B and Martinou JC, Bio-molecules, 2020, 10(7), 1068. [DOI] [PMC free article] [PubMed] [Google Scholar]
- 29.Gray LR, Tompkins SC and Taylor EB, Cell. Mol. Life Sci, 2014, 71, 2577–2604. [DOI] [PMC free article] [PubMed] [Google Scholar]
- 30.Havelund BM, Olsen DA, Andersen RF, Spindler KLG, Brandslund I, Jakobsen A and Soerensen FB, Appl. Immunohistochem. Mol. Morphol, 2013, 21, 298–307. [DOI] [PubMed] [Google Scholar]
- 31.Xiong QX, Liu BY, Ding MX, Zhou JM, Yang CP and Chen YB, Cancer Lett, 2020, 486, 1–7. [DOI] [PubMed] [Google Scholar]
- 32.Wan SL, Vohs T, Steenwinkel TE, White WR, Lara-Ramirez A, Luck RL, Werner T, Tanasova M and Liu HY, ACS Appl. Bio Mater, 2022, 5, 4294–4300. [DOI] [PMC free article] [PubMed] [Google Scholar]
- 33.Spakova I, Graier WF, Rabajdova M, Dubayova K, Nagyova V and Marekova M, Eur. Rev. Med. Pharmacol. Sci, 2020, 24, 4909–4920. [DOI] [PubMed] [Google Scholar]
- 34.Sanchez T, Venturas M, Aghvami SA, Yang XB, Fraden S, Sakkas D and Needleman DJ, Hum. Reprod, 2019, 34, 2349–2361. [DOI] [PMC free article] [PubMed] [Google Scholar]
- 35.Tulunay-Ugur OE, McClinton C, Young Z, Penagaricano JA, Maddox AM and Vural E, Otolaryngol.-Head Neck Surg, 2013, 148, 64–68. [DOI] [PubMed] [Google Scholar]
- 36.Mondal A and Paira P, Curr. Org. Synth, 2018, 15, 179–207. [Google Scholar]
- 37.Brady HR, Kone BC, Stromski ME, Zeidel ML, Giebisch G and Gullans SR, Am. J. Physiol, 1990, 258, F1181–F1187. [DOI] [PubMed] [Google Scholar]
- 38.Oh GS, Kim HJ, Shen A, Lee SB, Yang SH, Shim H, Cho EY, Kwon KB, Kwak TH and So HS, Biomed. Res. Int, 2016, 2016, 4048390. [DOI] [PMC free article] [PubMed] [Google Scholar]
- 39.Wan SL, Xia S, Medford J, Durocher E, Steenwinkel TE, Rule L, Zhang YB, Luck RL, Werner T and Liu HY, J. Mater. Chem. B, 2021, 9, 5150–5161. [DOI] [PMC free article] [PubMed] [Google Scholar]
- 40.Zhang YB, Xia S, Wan SL, Steenwinkel TE, Vohs T, Luck RL, Werner T and Liu HY, ChemBioChem, 2021, 22, 2282–2291. [DOI] [PMC free article] [PubMed] [Google Scholar]
Associated Data
This section collects any data citations, data availability statements, or supplementary materials included in this article.


