Abstract
Objective:
The goal of this study was to test if CFD-based virtual angiograms could be used to automatically discriminate between intracranial aneurysms (IAs) with and without flow stagnation.
Methods:
Time density curves (TDC) were extracted from patient digital subtraction angiography (DSA) image sequences by computing the average gray level intensity inside the aneurysm region and used to define injection profiles for each subject. Subject-specific 3D models were reconstructed from 3D rotational angiography (3DRA) and computational fluid dynamics (CFD) simulations were performed to simulate the blood flow inside IAs. Transport equations were solved numerically to simulate the dynamics of contrast injection into the parent arteries and IAs and then the contrast retention time (RET) was calculated. The importance of gravitational pooling of contrast agent within the aneurysm was evaluated by modeling contrast agent and blood as a mixture of two fluids with different densities and viscosities.
Results:
Virtual angiograms can reproduce DSA sequences if the correct injection profile is used. RET can identify aneurysms with significant flow stagnation even when the injection profile is not known. Using a small sample of 14 IAs of which 7 were previously classified as having flow stagnation, it was found that a threshold RET value of 0.46 sec can successfully identify flow stagnation. CFD-based prediction of stagnation was in more than 90% agreement with independent visual DSA assessment of stagnation in a second sample of 34 IAs. While gravitational pooling prolonged contrast retention time it did not affect the predictive capabilities of RET.
Conclusion:
CFD-Based virtual angiograms can detect flow stagnation in IAs and can be used to automatically identify aneurysms with flow stagnation even without including gravitational effects on contrast agents.
Graphical Abstract
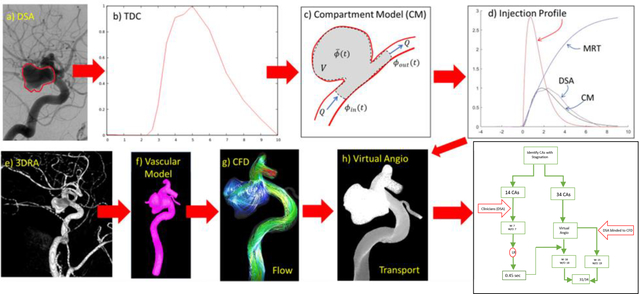
CFD-Based virtual angiograms can accurately detect flow stagnation in IAs and identify aneurysms with stagnation with over 90% accuracy, even without considering gravitational effects on contrast agents.
1. INTRODUCTION
Intracranial aneurysms (IAs) are localized dilatations of cerebral arteries that are thought to be caused by weakening of the vascular wall in response to abnormal blood flows1. Many studies have focused on understanding the biological responses to flow features characteristic of disturbed aneurysmal hemodynamics using idealized in-vitro models such as flow chambers2,3 or animal models 4–6, and much fewer using in-vivo human data7. However, reproducing the complex in-vivo flow structures observed within aneurysms experimentally has proven challenging, and as a result, the mechanisms responsible for the degradation of the IA wall, subsequent enlargement, and potential rupture remain poorly understood.
Flow stagnation has been observed in many intracranial aneurysms during angiography.8,9 Stagnation is defined as the retention of contrast agent in the IAs after the parent artery has been already washed out, i.e. beyond the arterial phase, moving into the capillary or venous phases. Flow stagnation has long been considered a risk factor for aneurysm rupture 10,9,11–15, however the exact mechanisms are still not clear. Several studies have suggested a detrimental effect of localized stagnation on the IA wall that causes endothelium dysfunction.16–18 Stagnation is also thought to result in the accumulation of red blood cells, platelets, and leukocytes along the endothelium.19 It has also been suggested that low flow in the aneurysms may lead to blood stagnation which in turn can cause flow-induced nitric oxide dysfunction and result in wall degradation by stimulation of inflammation processes.20 However, these conjectures need to be further studied with aneurysm-specific flow and biological conditions, which are not always reproduced in experimental settings.
Additionally, Tsuji et. al8 found an association between hemostatic patterns and blood stagnation in cerebral aneurysms. They found that aneurysms with inside-pattern clot formation (when the thrombus is attached to the rupture point inside the aneurysm) have less flow stagnation compared to outside-pattern aneurysms. Knowing the hemostatic pattern could help physicians to identify a ruptured aneurysm in patients with multiple aneurysms and better manage IA treatment, as for example, to not exfoliate the clot on the point of rupture in outside-pattern aneurysms.8 Thus, identifying aneurysms with blood flow stagnation and quantifying the degree of flow stagnation could be used to improve IAs management by understanding which aneurysm walls are exposed to stagnant flow conditions that are likely to result in further degradation and dysfunction of the wall that could lead to rupture.
The purpose of this study was to establish a methodology to quantify the degree of flow stagnation in IAs and to identify IAs that have significant flow stagnation. The proposed method can be used to automatically identify aneurysms with flow stagnation in large databases of IAs that have been modeled with image-based computational fluid dynamics (CFD). This approach eliminates the need to manually inspect actual DSA (Digital Subtraction Angiography) images and facilitates the investigation of the effects of flow stagnation on the aneurysm wall, such as by linking flow stagnation to changes of the IA wall observed in surgical videos21 or enhanced regions of aneurysms observed in high resolution MRI22.
2. METHODS
The proposed approach aims at quantifying the degree of flow stagnation in IAs from virtual angiograms derived from CFD models based on patient-specific vascular geometries extracted from 3D medical images. The following sections describe the CFD methodology to model the blood flow in the aneurysm and connected vessels, the creation of virtual angiograms using the computed flow fields, and their comparison to actual angiograms, which in turn requires extraction of time-density curves from the actual angiograms, reconstruction of the injection profile, and accounting for possible pooling effects. After assessing the agreement between the CFD-based virtual angiograms and the actual angiograms, the study focuses on the definition of a parameter to quantify the degree of stagnation and evaluation of its ability to identify aneurysms with recognizable flow stagnation.
2.1. Angiography Quantification
Time density curves (TDC) were extracted from digital subtraction angiography (DSA) image sequences using a custom Matlab script. This script works as follows. A region of interest (ROI) is first manually drawn around the aneurysm on a selected image frame when the aneurysm is completely filled with contrast. The ROI is then converted to a binary mask image (1 inside the aneurysm region, 0 outside). Each image in the DSA sequence is then multiplied by the mask to eliminate pixels outside the aneurysm region, and the average gray level intensity inside the aneurysm region is computed and stored for each DSA frame to form a TDC. Finally, the TDC is scaled to the interval [0,1]. The time instant corresponding to each frame of the DSA sequence is extracted from the corresponding DICOM header. The process is illustrated in Fig. 1. This figure shows the DSA sequence (a), the ROI drawn on a selected frame (b), the corresponding mask image (c), and the final TDC (d).
Figure 1.
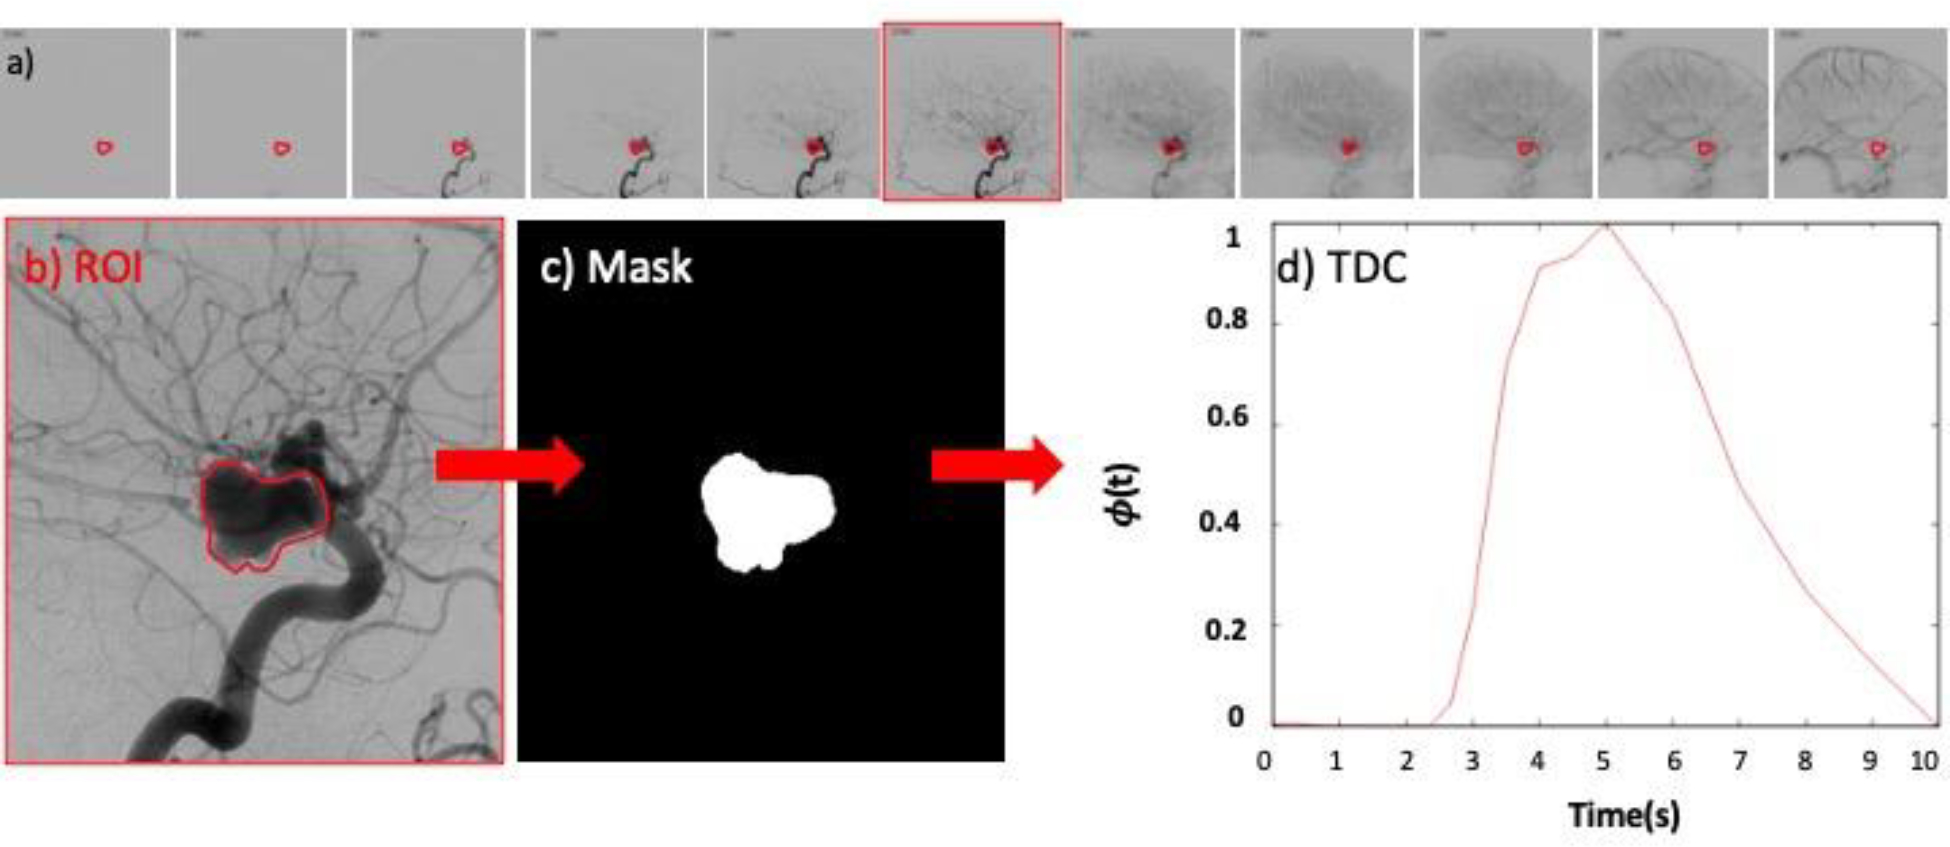
Quantification of time density curve from DSA: a) DSA sequence and selected frame with filled aneurysm and parent artery, b) region of interest manually drawn around aneurysm, c) mask image from ROI, d) extracted time density curve.
2.2. Aneurysm Flow Modeling
Subject-specific vascular models were constructed by segmentation of 3D rotational angiography (3DRA) images using previously described methods.23 Unstructured grids composed of (linear) tetrahedral elements with a minimum resolution of were generated filling the volume of the vascular models. These meshes contained between 2 and 5 million elements. Computational fluid dynamics (CFD) simulations were carried out by numerically solving the Navier-Stokes equations using an implicit finite element solver 24,25. The governing equations were:
| (1) |
| (2) |
where is the velocity vector, is the pressure, the fluid density, and the viscosity. Subject-specific pulsatile inflow boundary conditions were prescribed at the model inlet by scaling population averaged flow waveforms using an empirical law that relates vessel cross-sectional area and mean flow rate in internal carotid and vertebral arteries.26,27 Inflow velocity distributions were imposed by mapping Womersley profiles for the prescribed time-dependent flow rates 28. Out-flow divisions consistent with Murray’s principle of minimum work were applied at the model outlets (i.e. by splitting the flows according to the area to the 3/2 power in order to minimize the cost of maintaining such flows in living vessels).29 Vessel walls compliance was neglected, and blood was approximated as an incompressible Newtonian fluid with density and viscosity . Simulations were performed for two cardiac cycles and flow fields were stored at 100 instants during the second cycle.
2.3. Construction of Virtual Angiograms
Numerical simulations of the dynamics of a contrast agent injected into the parent artery were carried out by solving the transport equation:
| (3) |
where represents the concentration of the contrast agent, is the diffusivity, is a production/destruction source term, and is the fluid velocity obtained by solving the Navier-Stokes equations. For our purposes, only convection was considered since the Peclet number for 30, and the diffusivity and source terms were set to zero (, ). The transport equation was numerically solved using a cell-centered finite volume approach with upwind treatment of the convective flux and explicit time integration (Runge-Kutta scheme) implemented in an in-house code. Timesteps were selected from the stability condition for convective transport:
| (4) |
where is the element size, taken as the average of the lengths of the element sides. The same tetrahedral meshes employed for the CFD simulations were used for the transport calculations. Typical timesteps were of the other of . Simulations were carried out for 10 cardiac cycles. The fluid velocity field was assumed to be periodic over the cardiac cycle and was linearly interpolated in time from the 100 instants stored during the solution of the Navier-Stokes equation. Thus, the fluid and transport equations were decoupled, allowing for faster transport simulations.
No flux boundary conditions were imposed at the vessel walls, and natural boundary conditions were imposed at the model outlets. At the model inlet, the time-dependent concentration of the contrast agent (i.e. the injection profile) was prescribed uniformly over the inlet boundary:
| (5) |
where represents the inlet boundary and , and is the injection profile.
Time density curves were extracted by integrating the concentration over the 3D region of the aneurysm. The aneurysm region (volume grid elements) was labeled by manually tracing the aneurysm neck and identifying elements on each side of the aneurysm orifice as previously described.24 Additionally, TDC curves were also constructed for a region in the proximal parent artery, which was identified by placing a bounding sphere in the parent artery, proximally and close to the aneurysm. As explained below, these regions were later used to quantify the time the contrast remains in the aneurysm compared to the parent artery.
Finally, the dynamics of the simulated contrast transport was visualized by a simple volume rendering of the mesh points colored with gray levels modulated by the contrast concentration and using transparency. For qualitative comparison with the actual DSA images, these virtual angiograms were constructed in a projection similar to the DSA frames.
2.4. Reconstruction of DSA Injection Profile
Since the actual injection profile, used to obtain the DSA sequences was not known, a simple compartment model was used to reconstruct this profile and subsequently compare the TDC obtained from the DSA images and TDC obtained from CFD models. This compartment model (see Fig. 2c) consisted of a single compartment with a tracer concentration and steady inflow and outflow equal to the mean flow into/out of the aneurysm (quantified from the CFD simulation) and the volume corresponding to the aneurysm volume.
Figure 2.
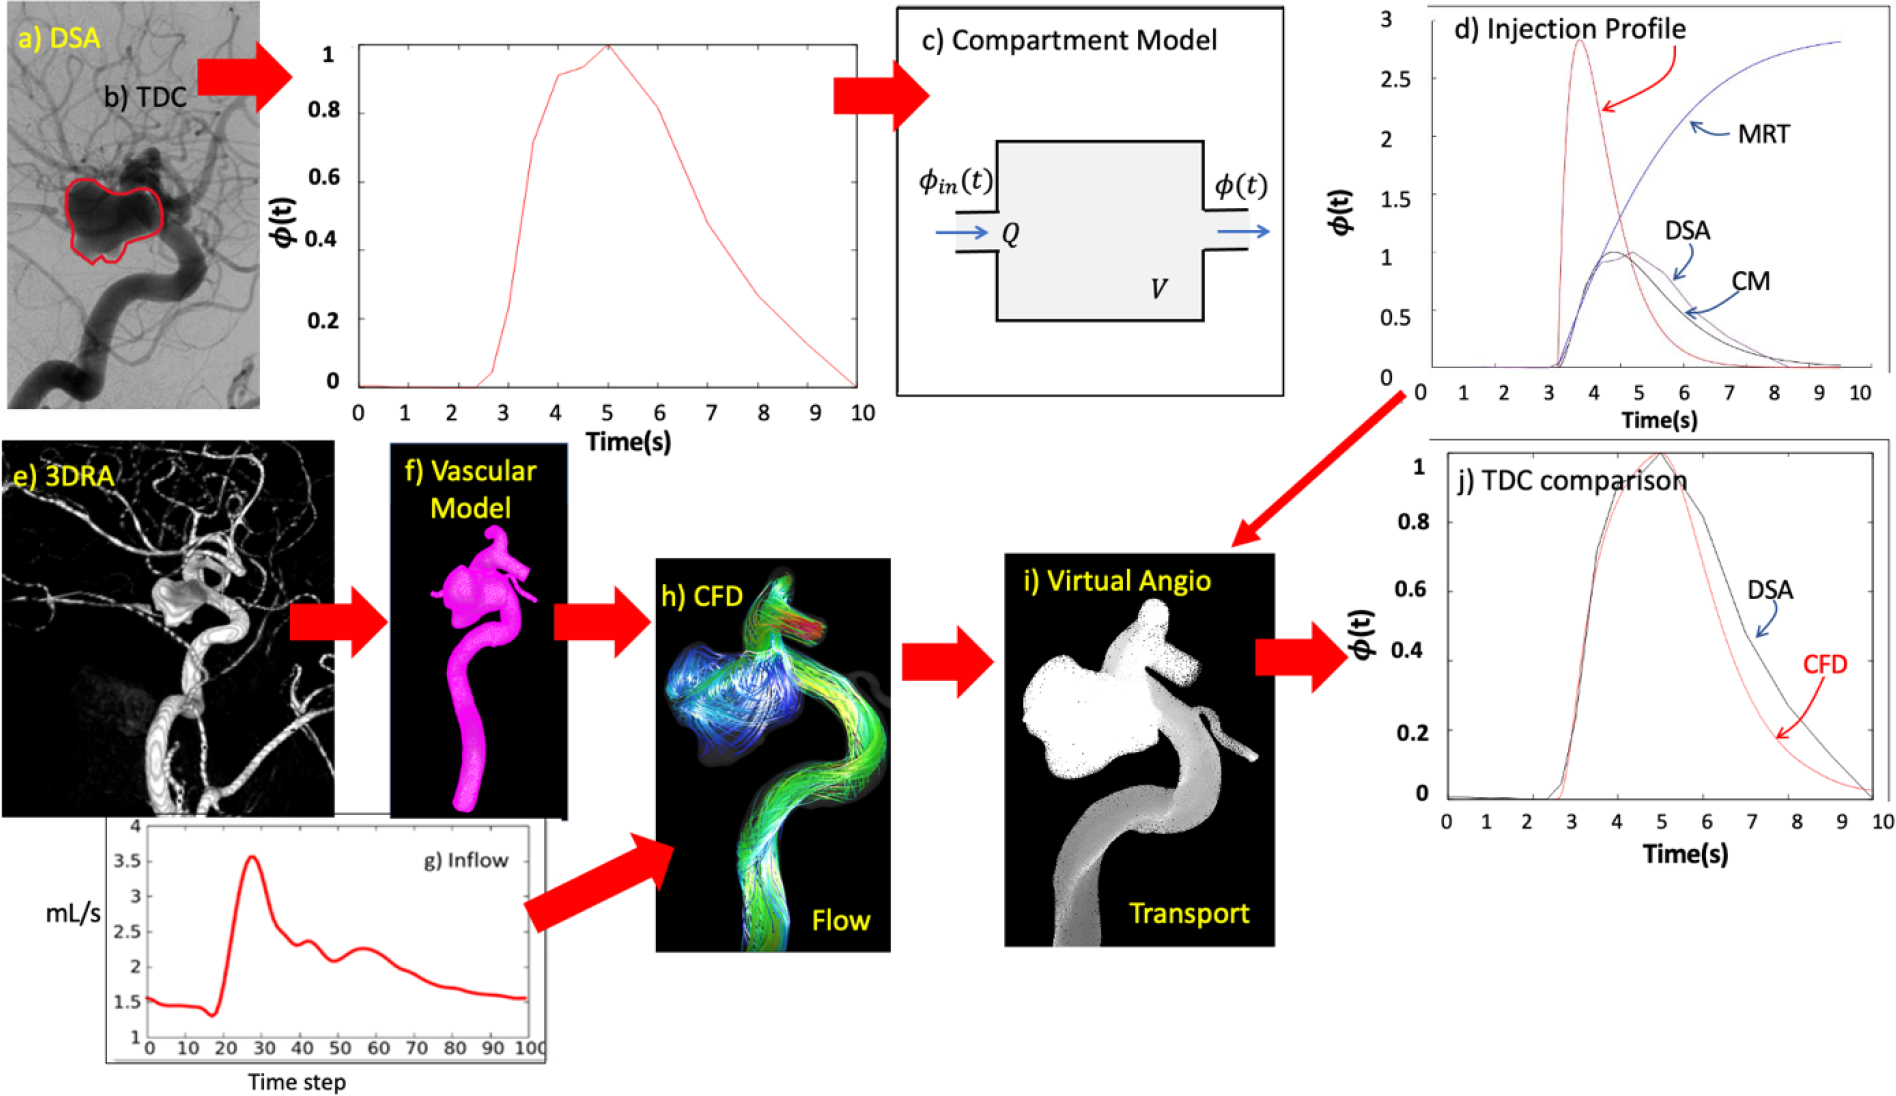
Reconstruction of injection profile from DSA sequences: a) DSA image and aneurysm ROI, b) reconstructed time density curve, c) compartment model (CM), d) reconstructed injection profile that matches DSA time density curve. Virtual angiography procedure: e) 3DRA image, f) reconstructed 3D vascular model, g) inflow waveform, h) flow from CFD simulation, i) CFD-based virtual angiogram (contrast transport simulation), j) comparison of time density curves obtained from DSA sequence and CFD-based virtual angiogram.
The governing equation for this compartment can be derived as follows. Starting with the pure convection equation (no diffusion):
| (6) |
and integrating over a control volume () including the aneurysm, we have
| (7) |
Assuming a fixed control volume (), incompressible flow (), and using the divergence theorem, this equation can be written as
| (8) |
Defining the average concentration over the control volume as:
| (9) |
and assuming the concentration to be roughly uniform over the inlet and outlet cross-sections, we have:
| (10) |
where the flow rate is given by:
| (11) |
The procedure to quantify the time density curves from the DSA angiograms described earlier directly yields the total amount of contrast in the control volume (aneurysm):
| (12) |
Then assuming that the average concentration provides a good approximation for the outflow concentration , the final governing equation for the compartment model becomes:
| (13) |
This equation was solved numerically using a Matlab script and an explicit Euler integration scheme. Finally, the injection profile was approximated with a gamma variate function (also known as the bolus equation), as is commonly done to describe the passage and dispersion of a bolus through a series of compartments31:
| (14) |
where the free parameters “amplitude“ and “injection duration“ were estimated to roughly reproduce the DSA time density curve. The process is illustrated in Fig. 2. The top row of this figure shows the ROI for the DSA quantification (a), the DSA TDC (b), the compartment model (c), and the injection profile that yields a good approximation of the DSA TDC (d).
Once the injection profile was reconstructed in this manner, it was used as inlet boundary condition for the 3D transport equation, and subsequent comparison between the DSA and the virtual angiograms. The entire process is illustrated in Fig. 2. As described above, the top row shows the process for reconstructing the injection profile from the DSA sequences. The bottom row shows the process for constructing the virtual angiograms: 3D rotational angiography image (e), reconstructed patient-specific vascular model (f), CFD flow results (g), one frame of the corresponding virtual angiogram (h), and comparison of the TDCs obtained from the DSA sequence and the numerical simulation (i).
2.5. Virtual Angiograms Accounting for Contrast Pooling
Contrast agents used in DSA imaging are in general heavier and more viscous than blood. This difference in fluid density and viscosity can lead to gravitational pooling of contrast in some aneurysms and is observed as a flat surface of contrast within the aneurysm perpendicular to the gravity direction. Some examples are presented in Fig. 3.
Figure 3.
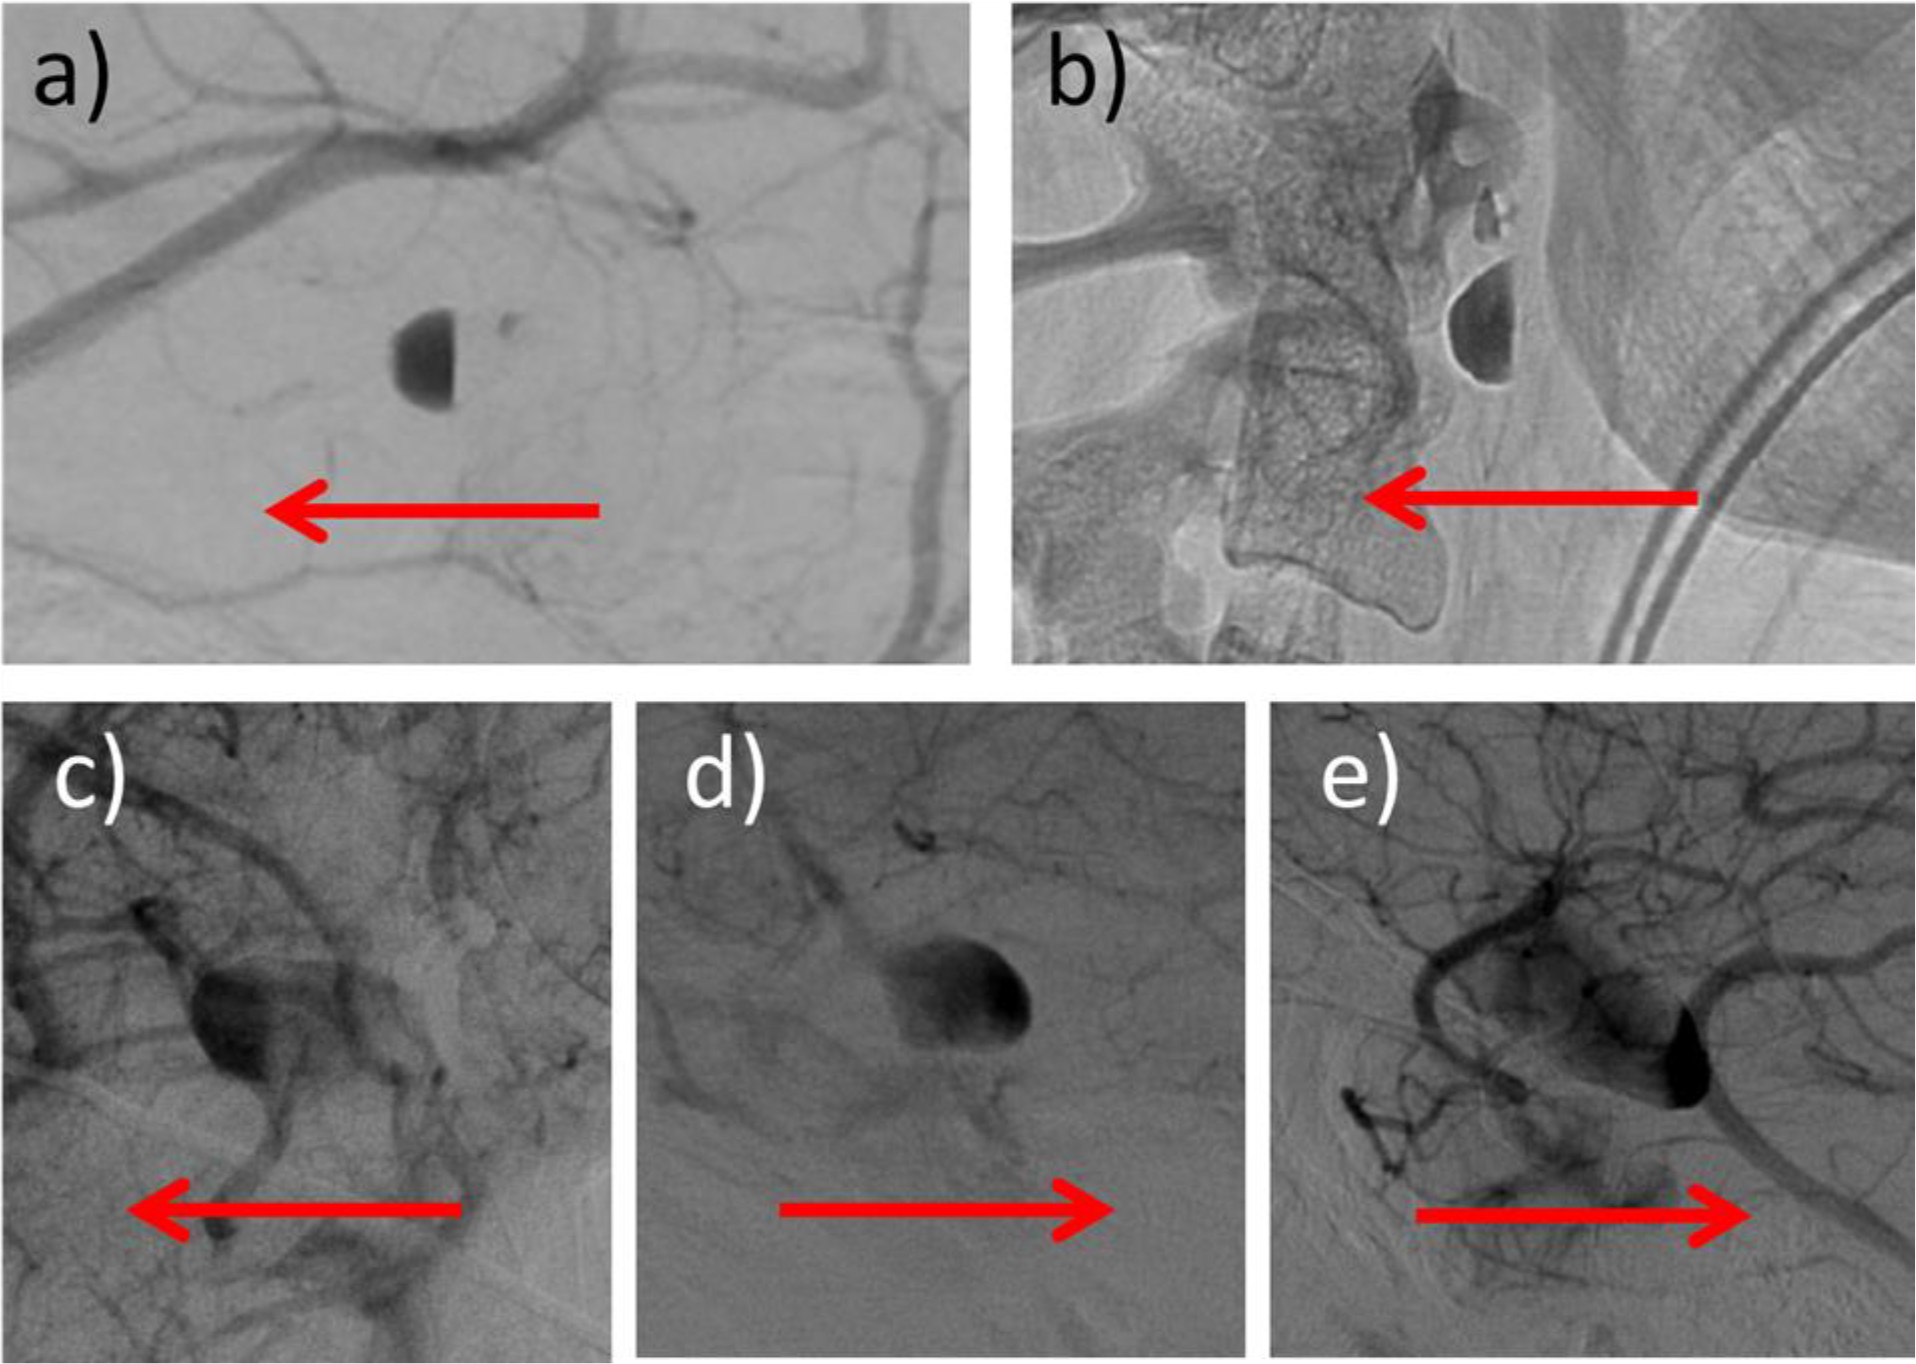
Five aneurysms (two from dataset 1 – top row, and 3 from dataset 2 – bottom row) with contrast pooling observed in their DSA sequences (only a late frame is shown for each case). Red arrows indicate the gravity direction (vertical) in each case.
This phenomenon can be included in the computational models as follows. The (two-way) coupled fluid and transport equations are now solved simultaneously with an explicit Runge-Kutta scheme. A gravitational force is added to the momentum equation:
| (15) |
where now the density and viscosity of the fluid mixture are calculated by linear interpolation using the contrast concentration (i.e. a volume of fluid strategy):
| (16) |
| (17) |
This approach has been implemented into our in-house incompressible CFD solver32.
The contrast agent properties used in simulations accounting for pooling correspond to iopamidol 300 mgl/ml (commercial name Omnipaque) which is commonly used in the clinic were: and 33 The coupled system of equation was then advanced explicitly using a Runge-Kutta method.
2.6. Quantification of Contrast Retention in Cerebral Aneurysms
As mentioned before, the objective of this work was to test if virtual angiograms could be used to automatically discriminate between aneurysms with flow stagnation and those without. In clinical practice, neuroradiologists say that an aneurysm has a stagnant flow if in DSA sequences contrast is continued to be observed inside the aneurysm when the parent artery has been already washed out, i.e. beyond the arterial phase, moving into the capillary or venous phases.
In order to quantify this perception from the virtual angiograms, the mean residence time (a measure of the transit time of the contrast though a specified region) in the aneurysm and the proximal parent artery were computed from the corresponding TDC as:
| (18) |
Typically, this quantity tends to a constant final value when the contrast washes out completely from the region ( becomes zero). Thus, a new quantity was defined to capture the time over which the contrast remained in the aneurysm (aneu) once it was cleared from the proximal parent artery (PPA). This “aneurysm contrast retention time” was defined as:
| (19) |
Note that the calculation of this quantity could be performed for different injection profiles. As such, a simple 1 sec constant injection was used. The process is illustrated in Fig. 4 for a patient with 3 aneurysms in the internal carotid artery. As can be observed in the DSA sequences only aneurysm 2 exhibited contrast retention after parent artery washout (i.e. flow stagnation). Consistently with this observation, the corresponding RET was larger for aneurysm 2 than the other two aneurysms of this patient.
Figure 4.
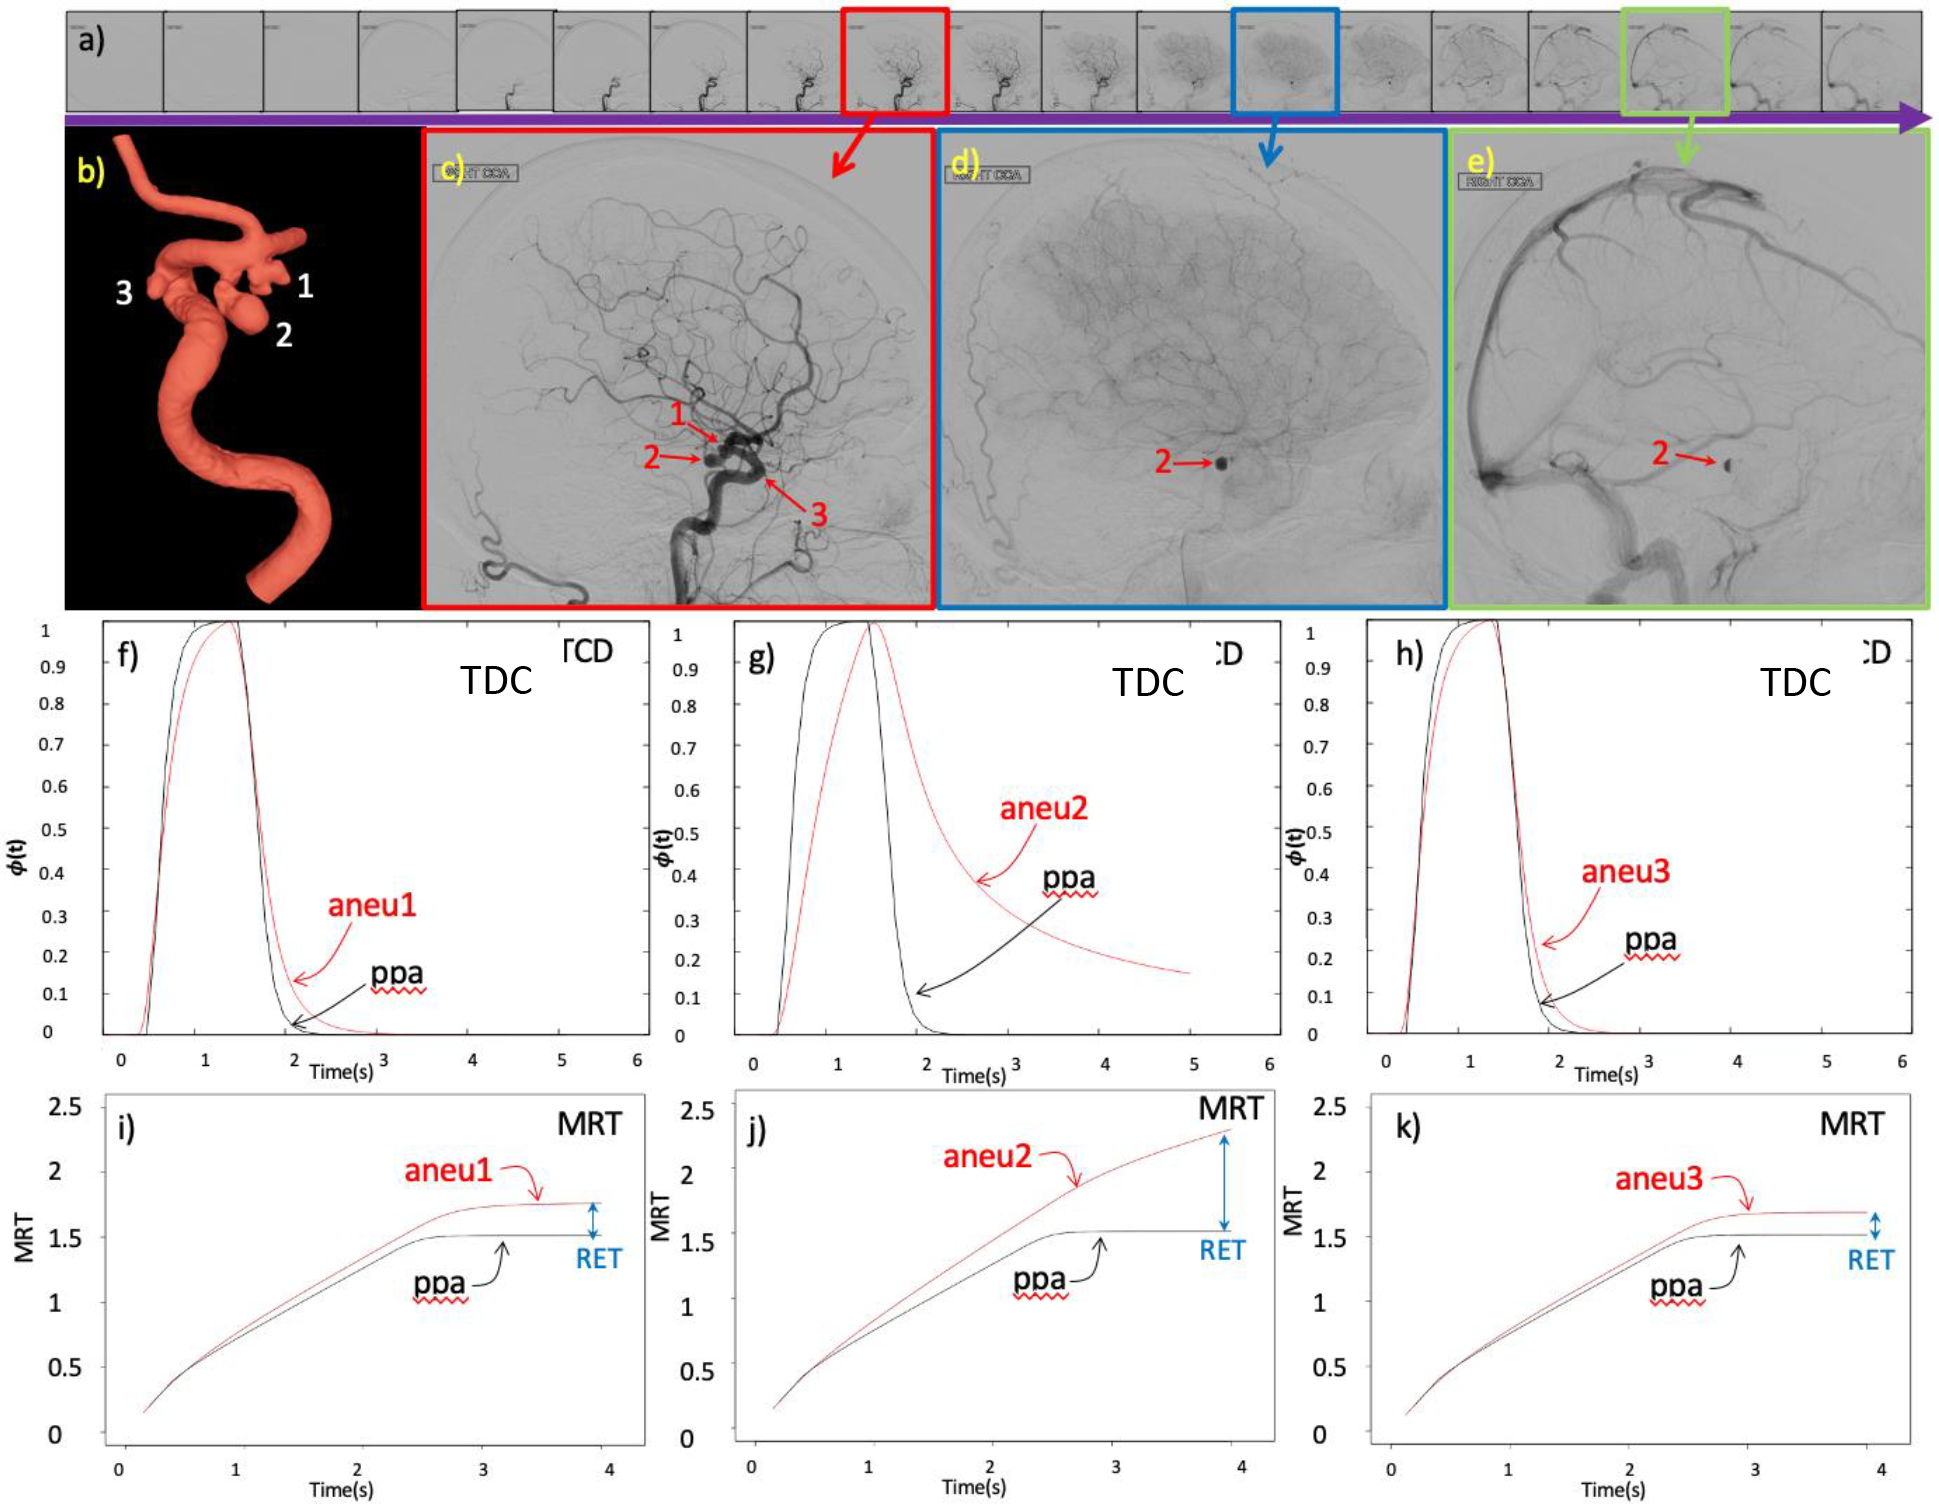
Quantification of aneurysm retention time illustrated with a case of a patient with 3 aneurysms, one with flow stagnation and 2 without flow stagnation: a) DSA sequence, b) 3D vascular model showing the 3 aneurysms, c) DSA frame with the 3 aneurysms and the parent artery filled with contrast during the arterial phase, d) DSA frame showing contrast retention in aneurysm 2 during the capillary phase, e) later DSA frame showing retention of contrast only in aneurysm 2 during the venous phase, f) time density curves (TDC) obtained from virtual angiogram in aneurysm 1 and proximal parent artery (ppa), g) TDC in aneurysm 2 and ppa, h) TDC in aneurysm 3 and ppa, i) mean residence time (MRT) in aneurysm 1 and ppa and corresponding aneurysm retention time (RET), j) MRT in aneurysm 2 and ppa and corresponding RET, k) MRT in aneurysm 3 and ppa and corresponding RET.
2.7. Identification of Aneurysms with Flow Stagnation
In order to test if the RET variable quantified from virtual angiograms was able to distinguish between aneurysms with and without stagnation, we considered two sets of aneurysms with available 3DRA images and DSA sequences.
Dataset 1 contained 14 aneurysms in 7 patients. According to observations made by an experienced neuroradiologist, 7 of these aneurysms were classified as having flow stagnation (contrast retention in the aneurysm once the artery is washed out in the DSA images), and the remaining 7 as not having flow stagnation. CFD models and virtual angiograms were constructed and used to quantify RET in these aneurysms. The RET value between aneurysms with and without stagnation were compared using the Wilcoxon test, and the optimal threshold to separate these two groups was estimated using a logistic regression model.34
Dataset 2 contained 34 aneurysms in 23 patients. By observation of the DSA sequences (blinded to CFD and virtual angiograms results), 15 of these aneurysms were classified as having flow stagnation and the remaining 19 as not having flow stagnation (ground truth). CFD models, virtual angiograms, and RET quantification were performed for all aneurysms in dataset 2 (blinded to ground truth). CFD-based predictions of flow stagnation were made by comparing the value of RET and the threshold found in dataset 1. The agreement between CFD-based prediction and DSA-based observations was then quantified using Fleiss’ Kappa statistics.
3. Results
3.1. CFD-Based Virtual Angiograms Reproduce the Salient Features of DSA Sequences
The results of the CFD-based angiography simulations were in good qualitative agreement with the actual DSA sequences when using the reconstructed injection profiles. The virtual angiographies were able to capture the main flow and contrast dynamics characteristics observed in the in vivo DSA sequences. An example is presented in Fig. 5. This figure shows selected frames of the DSA sequence and corresponding frames of the virtual angiography simulation in roughly the same orientation (the exact projection of the DSA sequence was unknown). The series of images illustrate: a,h) the initial filling of the aneurysm through the distal neck, b,i) continued filling of the aneurysm, c,j) complete filling of the aneurysm and parent artery, d,k) beginning of the washout of the parent artery with the aneurysm still completely filled, e,l) contrast retention when the parent artery is almost completely washed out, f,m) contrast retention after parent artery wash out, g,n) final aneurysm wash out. Note that this aneurysm was classified as having stagnation by inspection of the DSA sequence since contrast is observed in the aneurysm when the parent artery is completely washed out. The same conclusion would be reached by inspection of the virtual angiogram.
Figure 5.

Comparison of DSA sequence (top row) and virtual angiogram (bottom row) obtained with the injection profile reconstructed from the DSA sequence for an aneurysm exhibiting contrast retention (i.e. flow stagnation).
Comparison of the time density curves obtained from the CFD-based virtual angiograms and the corresponding DSA sequences are shown in Fig. 6 for all cases in dataset 1 classified as having flow stagnation (case 1 also includes two additional aneurysms without stagnation, case 1.1 and case 1.3). It can be seen that the curves obtained with the numerical models using the reconstructed injection profiles (red curves) were in general in good agreement with the DSA sequences (black curves). However, in some cases (case 1.2, case 6 and case 7), the DSA-based TDC exhibited substantially larger contrast retention compared to the CFD-based TDC. This is largely due to contrast pooling in case 1.2 and case 7 (see Fig. 3a and b corresponding to these cases, respectively). In case 6 (see Fig. 7), the DSA sequence shows that when the aneurysm is washing out, there is a secondary injection of contrast in the parent artery (Fig. 7c), perhaps because of flushing of the catheter, which was not included in the numerical model. In all other cases, the TDC are very similar between the DSA and virtual angiographies, except from minor differences that could be due to overlapping of distal vessels in the DSA images that tend to increase the observed retention in the DSA images, or due to early termination of the DSA imaging which makes the TDC drop zero suddenly.
Figure 6.
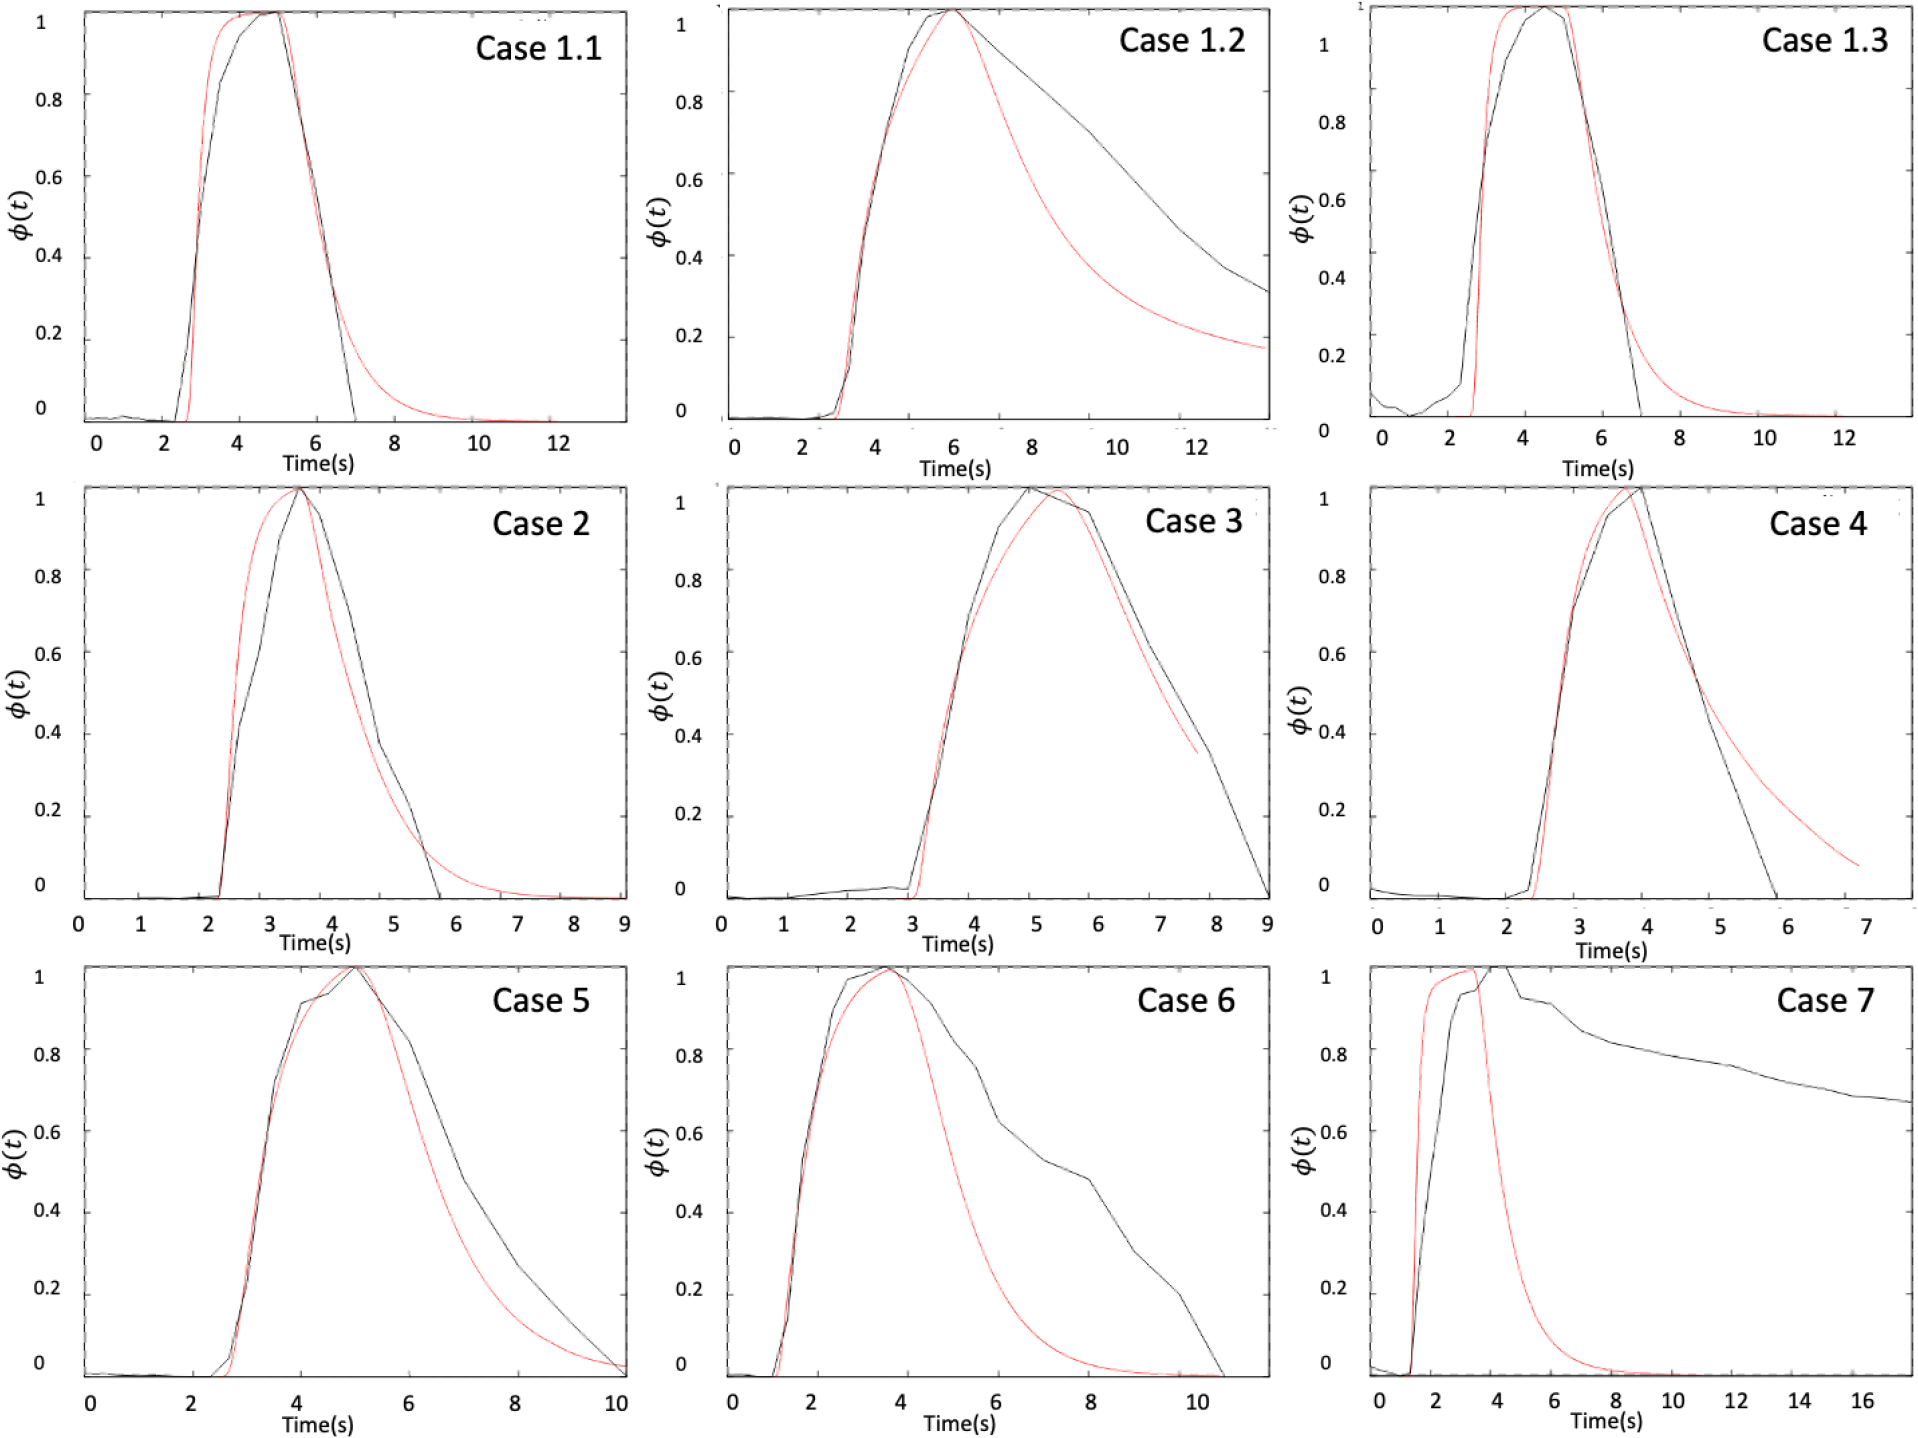
Time density curves obtained from the DSA sequences (black curves) and the virtual angiograms (red curves) for the cases with flow stagnation of dataset 1.
Figure 7.

Case 6 of dataset 1, showing a “secondary injection” of contrast in the DSA sequence (frame c), explaining the difference between the TDC obtained from the virtual angiogram and the DSA (Fig. 6).
3.2. Virtual Angiograms Can Capture Contrast Pooling
As mentioned above, contrast pooling may give the impression of increased aneurysm flow stagnation because of prolonged contrast retention. While this is not a property of the blood flow but of the contrast dynamics, it is important to understand the gravitational effect on contrast material that is heavier than blood. Two aneurysms in dataset 1 and three in dataset 2 exhibited contrast pooling (Fig. 3). For these cases, simulations accounting for different contrast and blood density and viscosity were carried out as described above. An example is presented in Fig. 8. The top row shows selected frames of the DSA sequence, the middle row corresponding frames from the virtual angiogram produced with two fluids of different densities and viscosities, and the bottom row the virtual angiograms obtained without including gravitational effects. It can be seen that, as expected, taking into account gravitational effects results in pooling of the contrast in the numerical simulation and prolonged contrast retention in the aneurysm similar to the actual DSA sequence. Furthermore, the TDC obtained with gravitational effects also shows an increase in the contrast retention in the aneurysm due to pooling, compared to the TDC without gravity (see Fig. 9).
Figure 8.
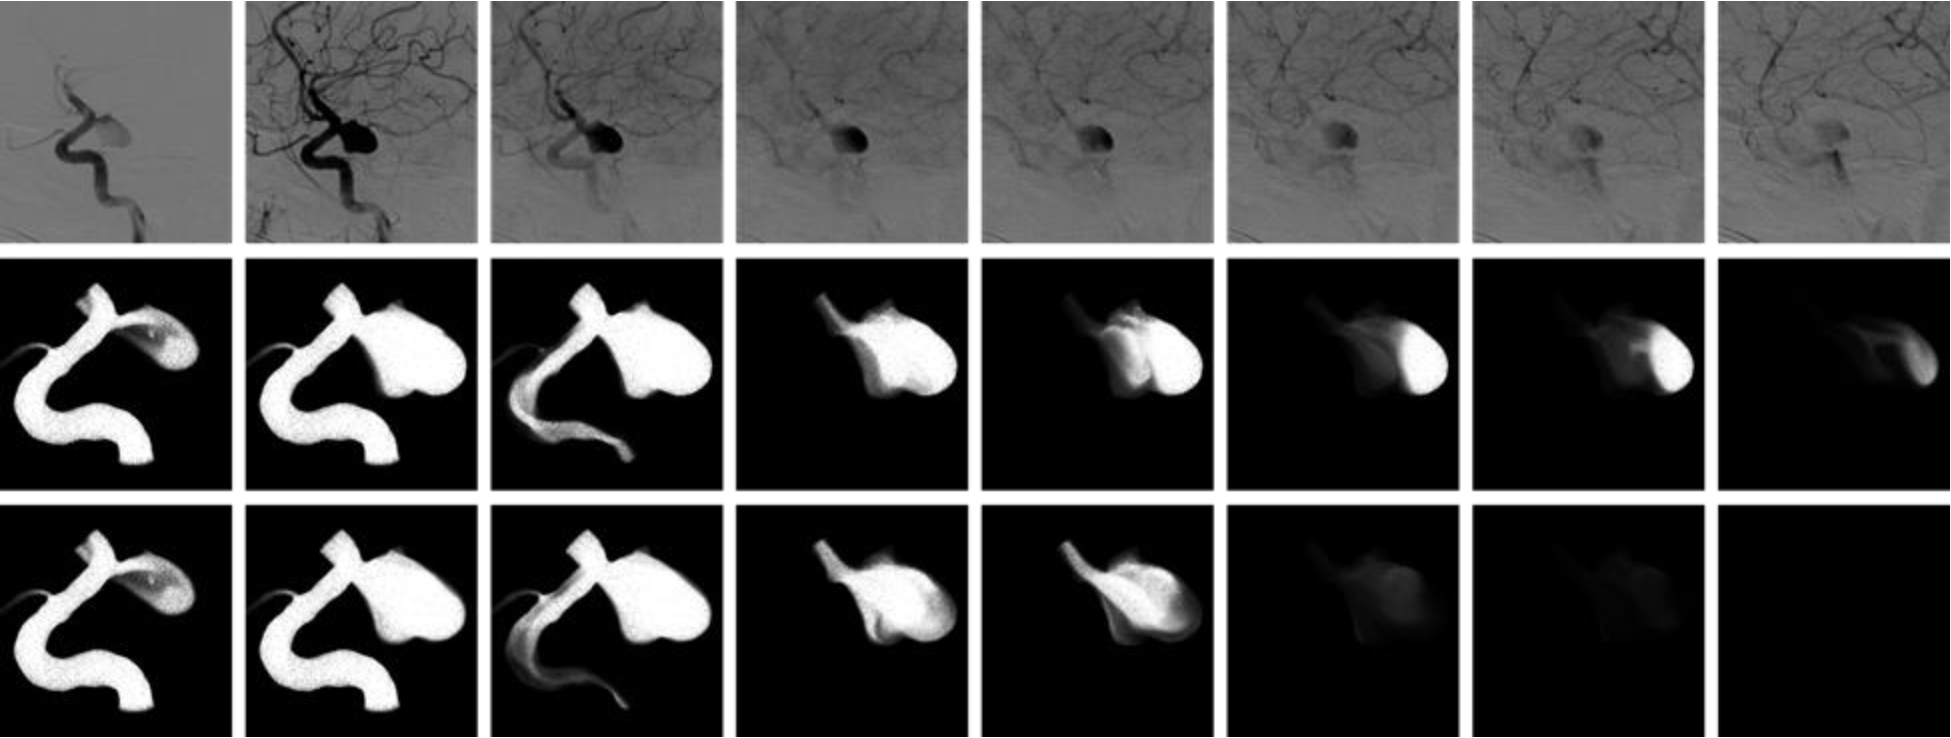
Aneurysm with contrast pooling observed in the DSA sequence (top row). Virtual angiogram considering gravity and a contrast agent heavier and more viscous than blood reproducing the contrast pooling (middle row). Virtual angiogram without considering gravitational effects showing aneurysm retention (i.e. flow stagnation) but no contrast pooling (bottom row), presumably more representative of true blood flow rather than contrast flow dynamics.
Figure 9.
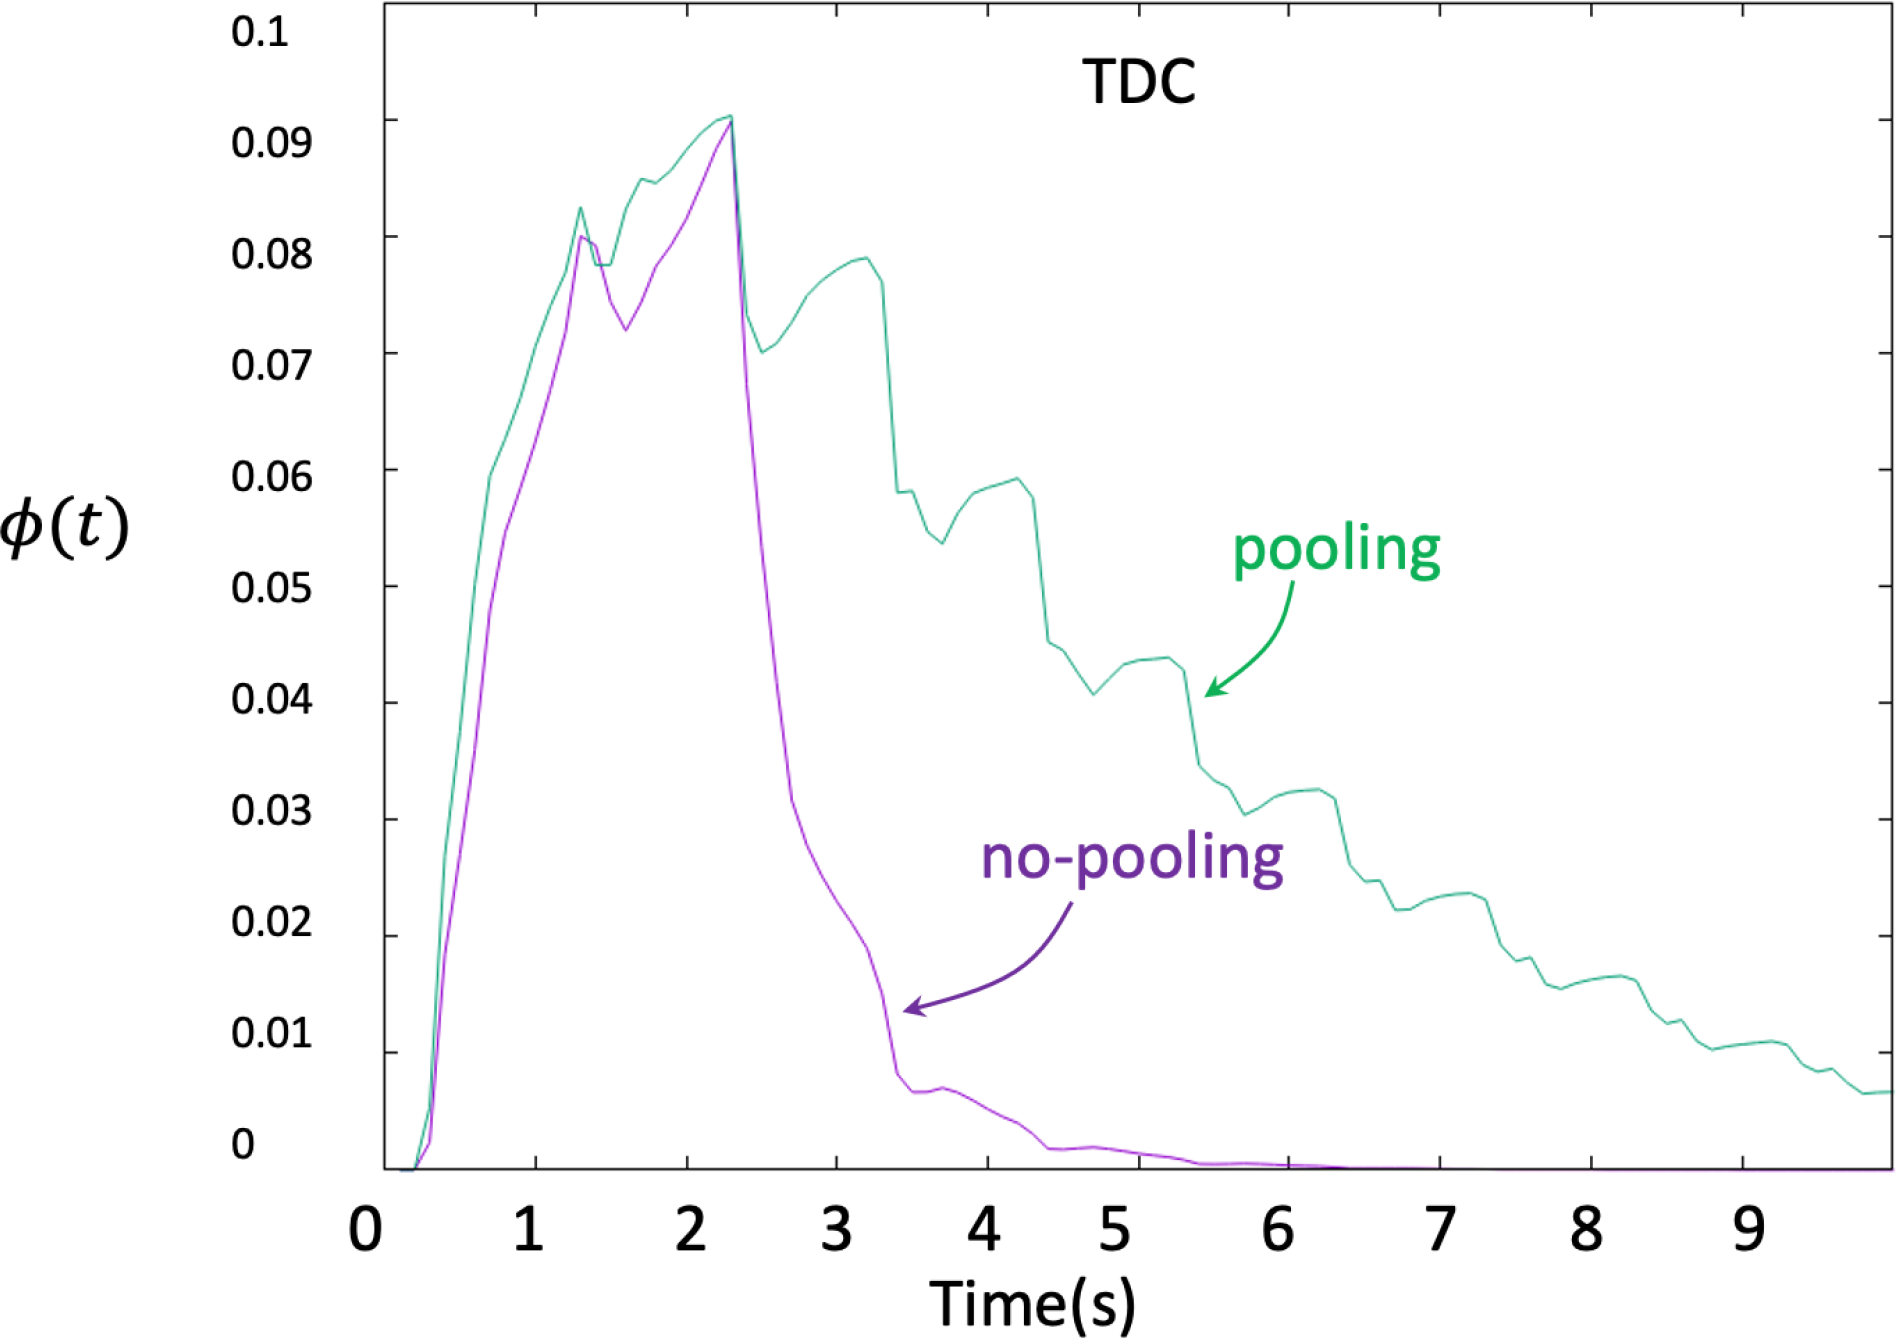
Time density curves obtained from virtual angiograms considering gravitational effects (contrast pooling, green curve) and without gravitational effects (no pooling, purple curve).
3.3. Retention Time is Different in Aneurysm with and without Flow Stagnation
The previous results established that CFD-based virtual angiograms can reproduce the salient features and time density curves of DSA sequences if the inlet conditions were prescribed mimicking the in vivo injection profiles. However, to quantify the aneurysm retention time RET and test whether it could discriminate between aneurysms with and without stagnation, different injections could be used. As such, two new transport simulations were carried out using constant injections for a period of and :
| (20) |
where is the injection duration. The retention times obtained for all aneurysms of dataset 1 with these two injections, and their absolute differences, are presented in Table 1. This table also shows the aneurysm classification as having flow stagnation or not assessed by inspection of the corresponding in vivo DSA sequences.
Table 1.
Dataset 1: Aneurysm retention time (RET) calculated from virtual angiograms with 1 sec and 2 sec constant injections, their absolute difference, and the stagnation status as assessed visually from the DSA sequences.
| N | ID | RET (sec) 1 sec injection | RET (sec) 2 sec injection | Difference (sec) | Status |
|---|---|---|---|---|---|
| 1 | Case1.1 | 0.252 | 0.250 | 0.002 | No-stagnation |
| 2 | Case1.2 | 1.171 | 1.169 | 0.002 | stagnation* |
| 3 | Case1.3 | 0.179 | 0.183 | 0.004 | No-stagnation |
| 4 | Case2 | 0.204 | 0.201 | 0.003 | stagnation |
| 5 | Case3 | 1.00 | 1.01 | 0.010 | stagnation |
| 6 | Case4 | 0.520 | 0.518 | 0.002 | stagnation |
| 7 | Case5 | 0.768 | 0.771 | 0.003 | stagnation |
| 8 | Case6 | 0.700 | 0.699 | 0.001 | stagnation |
| 9 | Case7.1 | 0.042 | 0.041 | 0.001 | No-stagnation |
| 10 | Case7.2 | 1.879 | 1.883 | 0.004 | stagnation* |
| 11 | Case8 | 0.001 | 0.001 | 0.000 | No-stagnation |
| 12 | Case9 | 0.002 | 0.001 | 0.001 | No-stagnation |
| 13 | Case10 | 0.201 | 0.221 | 0.020 | No-stagnation |
| 14 | Case11 | 0.001 | 0.002 | 0.001 | No-stagnation |
Aneurysms with observed contrast pooling have been marked with ‘*’.
It can be seen that the values of the retention time are quite similar for the and injections, and their differences are below . This indicates that these two injections are equivalent for quantifying the aneurysm retention time. Thus, results from the injection were used for the remainder of the study.
The group of aneurysms with stagnation had a mean retention time of and a standard deviation of , while the group of aneurysms without flow stagnation had a mean RET of and a standard deviation of . The non-parametric Wilcoxon (Mann-Whitney) test indicated that the difference between these groups was statistically significant with a p-value of 0.0035 and an odds-ratio of 16.43. This suggests that RET could be used to discriminate between aneurysms with and without stagnation.
3.4. Virtual Angiograms Can Be Used to Detect Flow Stagnation
In order to use RET as a predictor of aneurysm flow stagnation, a logistic model was first used to determine the optimal threshold to classify aneurysms into the stagnation or no-stagnation groups using the injection results for dataset 1. The optimal RET threshold was determined to be in the range . The decision boundary for this classification is presented graphically in Fig. 10. As can be observed, there was only one case with flow stagnation that overlapped with the no-stagnation cases. Therefore, the predictor threshold was chosen close to the upper limit of this range: .
Figure 10.
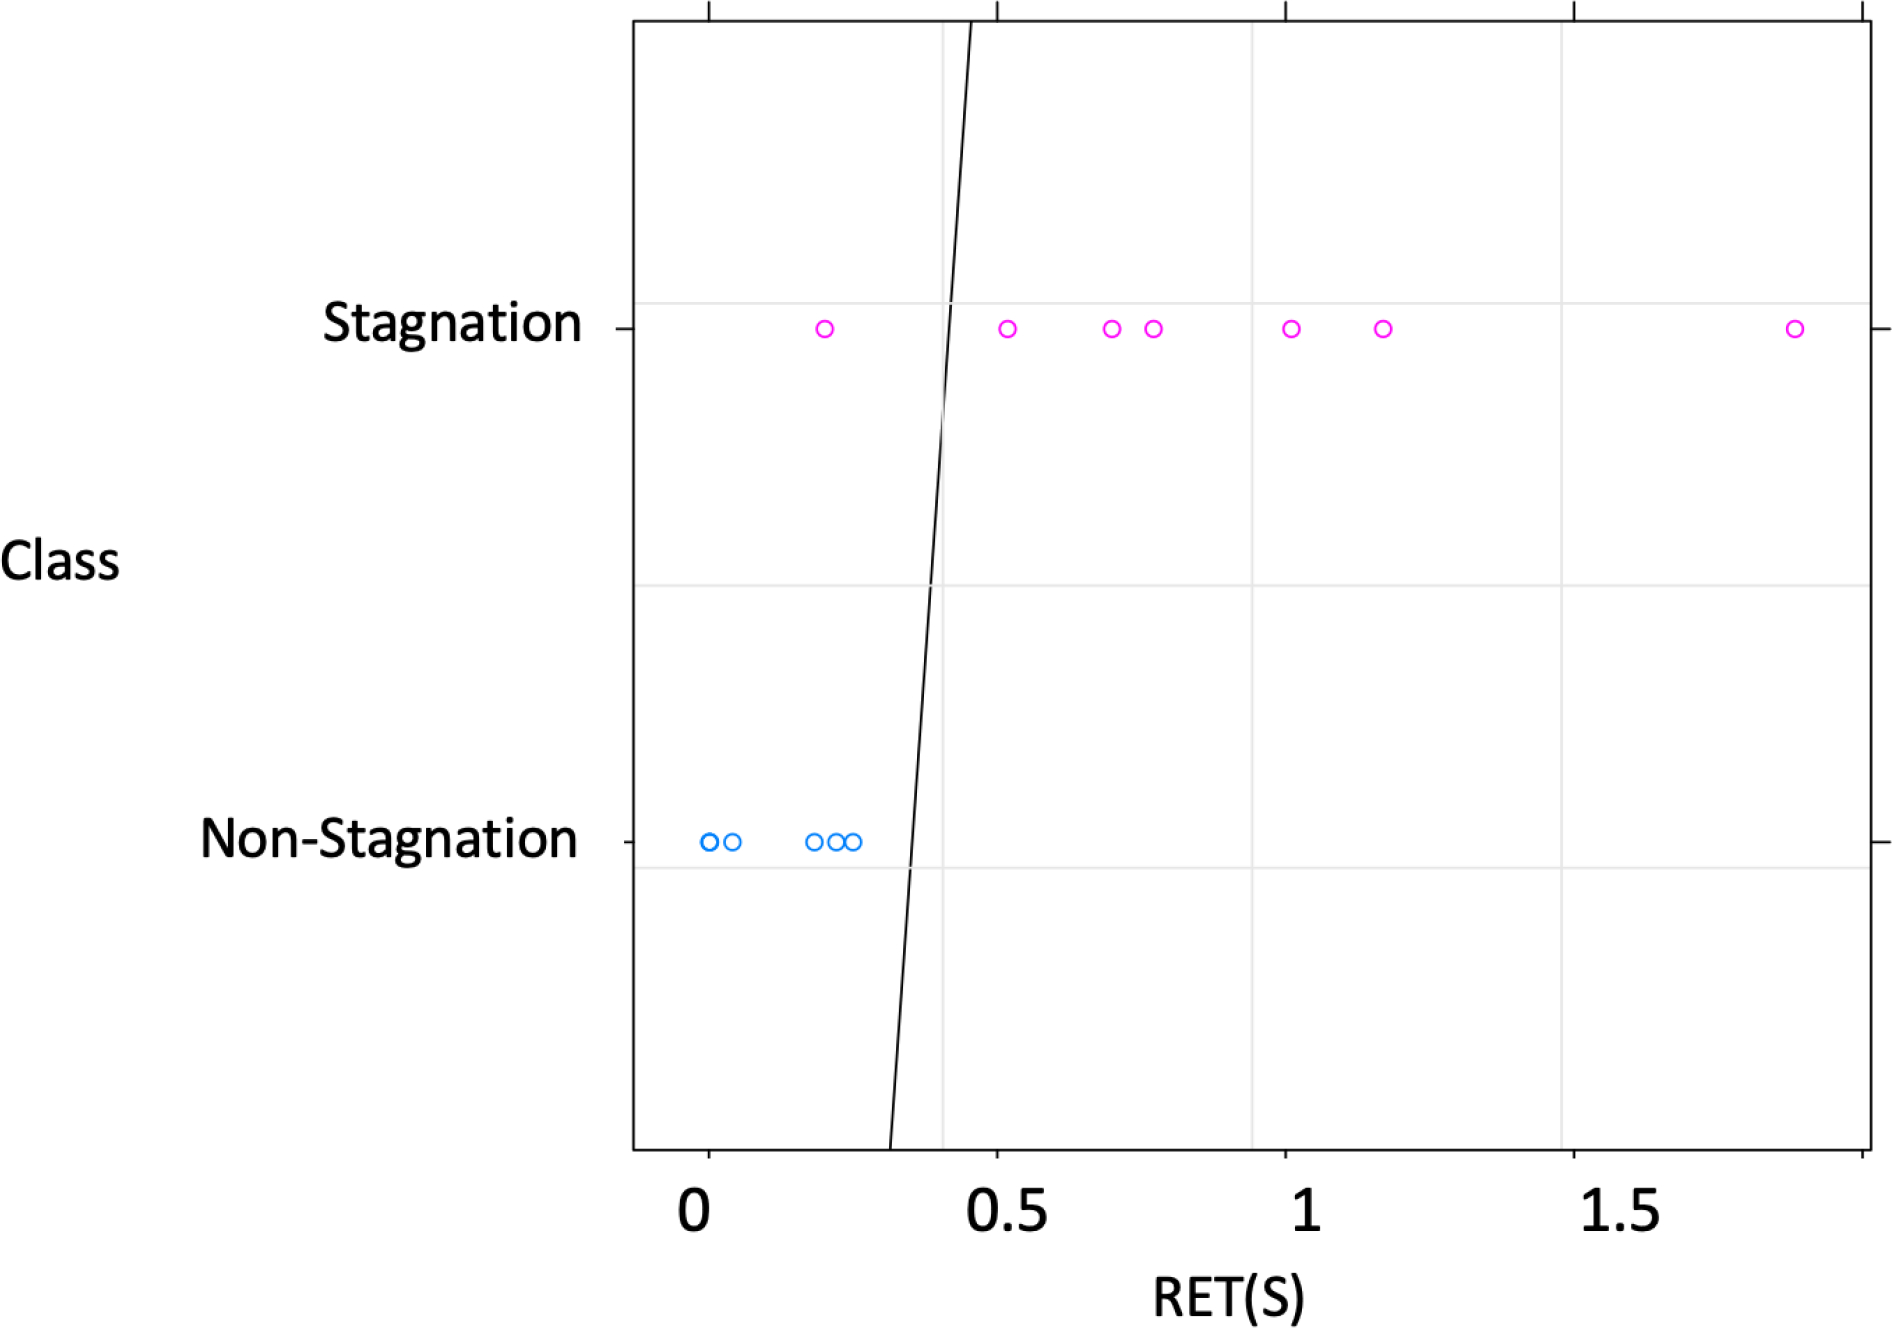
Aneurysm retention time (RET) for all cases of dataset 1, and decision boundary (solid line) found to best discriminate between aneurysms with (pink circles) and without (blue circles) flow stagnation in this dataset. The optimal RET threshold to discriminate is in the range . The predictor threshold was chosen close to the upper limit of this range: .
CFD simulations, virtual angiograms with a 1 sec constant injection, and corresponding time density curves and retention times were calculated for all aneurysms in dataset 2 (n=34). Aneurysms in this dataset were classified into the stagnation or no-stagnation groups depending on whether (no-stagnation) or (stagnation). These CFD-based predictions were then compared with independent (and blinded) visual assessments of flow stagnation based on the DSA sequences. The results are presented in Table 2. This table lists the mean transit time in the aneurysm and parent artery along with the retention time, the CFD-based flow stagnation prediction and the corresponding DSA-based assessment and their agreement. As it can be seen, the predictions agreed with the visual assessments in 31 of the 34 cases (91.18%). Furthermore, the level of agreement was statistically evaluated using the Fleiss’ Kappa statistics, which yielded a value of with , confirming an excellent agreement.
Table 2.
Dataset 2: mean residence time (MRT) in aneurysm (aneu) and parent artery (ppa) region and corresponding aneurysm retention time (RET), along with predicted stagnation status from virtual angiograms and status determined from visual inspection of DSA sequences, and their agreement.
| N | ID | MRT-aneu (sec) | MRT-ppa (sec) | RET (sec) | Prediction | Status (DSA) | Agree |
|---|---|---|---|---|---|---|---|
| 1 | aneu1.1 | 0.82 | 0.71 | 0.11 | no-stagnation | no-stagnation | Y |
| 2 | aneu1.2 | 0.80 | 0.71 | 0.09 | no-stagnation | no-stagnation | Y |
| 3 | aneu1.3 | 0.81 | 0.71 | 0.10 | no-stagnation | no-stagnation | Y |
| 4 | aneu1.4 | 0.75 | 0.71 | 0.04 | no-stagnation | no-stagnation | Y |
| 5 | aneu2 | 0.96 | 0.69 | 0.27 | no-stagnation | no-stagnation | Y |
| 6 | aneu3 | 1.28 | 0.59 | 0.69 | stagnation | stagnation | Y |
| 7 | aneu4 | 1.37 | 0.68 | 0.69 | stagnation | stagnation | Y |
| 8 | aneu5.1 | 2.28 | 0.68 | 1.60 | stagnation | stagnation | Y |
| 9 | aneu5.2 | 1.96 | 0.68 | 1.28 | stagnation | stagnation | Y |
| 10 | aneu6.1 | 0.94 | 0.70 | 0.24 | no-stagnation | no-stagnation | Y |
| 11 | aneu6.2 | 1.66 | 0.70 | 0.96 | stagnation | stagnation | Y |
| 12 | aneu6.3 | 1.47 | 0.70 | 0.77 | stagnation | stagnation | Y |
| 13 | aneu6.5 | 1.36 | 0.70 | 0.66 | stagnation | stagnation | Y |
| 14 | aneu7 | 0.94 | 0.71 | 0.23 | no-stagnation | no-stagnation | Y |
| 15 | aneu8 | 1.20 | 0.74 | 0.46 | no-stagnation | no-stagnation | Y |
| 16 | aneu9 | 1.23 | 0.68 | 0.55 | stagnation | stagnation* | Y |
| 17 | aneu10 | 1.09 | 0.64 | 0.45 | no-stagnation | no-stagnation | Y |
| 18 | aneu11 | 1.23 | 0.71 | 0.52 | stagnation | stagnation | Y |
| 19 | aneu12 | 2.62 | 1.40 | 1.22 | stagnation | no-stagnation | N |
| 20 | aneu13 | 1.97 | 0.71 | 1.26 | stagnation | stagnation | Y |
| 21 | aneu14 | 0.83 | 0.69 | 0.14 | no-stagnation | stagnation | N |
| 22 | aneu15 | 4.87 | 1.01 | 3.86 | stagnation | stagnation* | Y |
| 23 | aneu16 | 1.67 | 0.75 | 0.92 | stagnation | stagnation* | Y |
| 24 | aneu17 | 1.25 | 0.72 | 0.53 | stagnation | no-stagnation | N |
| 25 | aneu18 | 2.81 | 0.76 | 2.05 | stagnation | stagnation | Y |
| 26 | aneu19 | 1.30 | 0.72 | 0.58 | stagnation | stagnation | Y |
| 27 | aneu20 | 1.20 | 0.90 | 0.30 | no-stagnation | no-stagnation | Y |
| 28 | aneu20 | 1.20 | 0.80 | 0.40 | no-stagnation | no-stagnation | Y |
| 29 | aneu21.1 | 0.91 | 0.74 | 0.17 | no-stagnation | no-stagnation | Y |
| 30 | aneu21.2 | 1.08 | 0.81 | 0.27 | no-stagnation | no-stagnation | Y |
| 31 | aneu21.3 | 0.90 | 0.74 | 0.16 | no-stagnation | no-stagnation | Y |
| 32 | aneu22.1 | 0.93 | 0.59 | 0.34 | no-stagnation | no-stagnation | Y |
| 33 | aneu22.2 | 0.65 | 0.60 | 0.05 | no-stagnation | no-stagnation | Y |
| 34 | aneu23 | 1.22 | 0.93 | 0.29 | no-stagnation | no-stagnation | Y |
Aneurysms with observed contrast pooling have been marked with ‘*’.
Interestingly, in dataset 2 there were 3 aneurysms that exhibited contrast pooling in the DSA sequences (marked with a ‘*’) in Table 2 and shown in the bottom row of Fig. 3. Although the CFD-based predictions in these cases did not include the gravitational terms and different densities and viscosity for blood and contrast agent, these aneurysms were correctly classified as having flow stagnation using the constant injection.
4. Discussion
Our study indicated that CFD-based virtual angiography can reproduce DSA sequences if the correct injection profile is used (i.e. similar to the time-dependent injection used in the in vivo DSA sequence). A simple compartment model was used to estimate the in vivo injection profile. The injection profile was approximated by the bolus equation and its parameters were estimated to roughly reproduce the DSA time density curve. With this approach the virtual angiograms were able to capture the salient features observed in the actual DSA sequences, despite not having patient-specific inflow rates to inform the CFD models, and were able to reproduce the time density curves obtained from the in vivo DSA sequences. This is a non-trivial result in part because there are several challenges to quantify TDC from DSA due to: a) vessel overlapping, b) variable time frames, c) unknown injection profile, d) incomplete observation time, e) secondary injections, f) low frame rate, g) in some cases with pooling the aneurysm may be initially filled with contrast from previous injections. Furthermore, virtual angiograms offer the possibility of controlling for these issues (3D regions without overlapping, constant injections profile, simulation until contrast washes out, constant frames, etc.) and more objectively characterize aneurysm flow stagnation.
Contrast pooling was observed in some aneurysms due to different fluid densities and viscosities since contrast agents are in general heavier and more viscous than blood. Pooling prolongs contrast retention in some aneurysms with a particular orientation of the gravitational vector (i.e. patient positioning), consistency with previous studies that showed increased residence time with contrast settling35. However, contrast pooling is not a hemodynamic feature but a feature of the contrast dynamics. Ignoring the gravitational terms and different density and viscosities for blood and the contrast agent in the CFD-based angiograms yields a smaller RET compared to the DSA. Nevertheless, the virtual angiograms were able to correctly identify aneurysms with flow stagnation in all the cases with pooling. Therefore, regardless of pooling, virtual angiograms can be used to automatically identify aneurysms with flow stagnation which is very useful for retrospective studies based on large databases of CFD models without having to look at DSA sequences (which is a more tedious and subjective process). Identifying aneurysms with stagnation is useful to better characterize the effect of flow stagnation on aneurysm wall biology, remodeling, and treatment. For example, by comparing the visual appearance of aneurysm walls in surgical videos (which may contain red regions of thin walls and/or thick regions of hyperplastic or atherosclerotic walls21 corresponding to aneurysms with and without flow stagnation.
In addition to demonstrating that the CFD-based virtual angiograms are able to reproduce flow characteristics and time density curves derived from in vivo DSA sequences, our study indicates that our approach can be used to automatically quantify the level of flow stagnation in an aneurysm (by computing its RET time) and to identify aneurysms with clinically significant flow stagnation, thus enabling studies of the relationship between flow stagnation and further wall degeneration and possibly failure36,37. It is important to note that while flow stagnation is thought to be undesirable in untreated aneurysms because of its potential negative effects on the wall structure, stagnant intra-aneurysmal flows after treatment with, for example flow diverting devices, induces (along with the presence of the metallic wires of the device across the neck) quick thrombus formation within the aneurysm sac and ultimately aneurysm occlusion. Thus, the proposed method could also be used to assess (or predict) the degree of stagnation created after implantation of different endovascular devices.
Previous studies have compared CFD based virtual angiograms and DSA sequences and have shown the reliability of the virtual angiograms and their effective capacity in blood flow visualization. Vali et al.38 modeled surgical interventions of fusiform aneurysms by CFD simulation and found that virtual contrast modeling approaches were more effective for prediction of thrombus deposition. Endres et al.39 introduced a workflow for generating virtual DSA based on CFD results and real patient-specific contrast injection protocols and evaluated the reliability of CFD simulations for blood flow within intracranial aneurysms. The workflow could visualize the blood flow from multiple projection views without additional injection and cost. Ford.40 indicated that virtual angiographic images and residence time maps, extracted from CFD models, agreed with clinical images and maps when accounting for the interaction between contrast agent injection and pulsatile flow. Also, they showed that virtual angiograms provide a way to visualize complex blood flow dynamics in a clinically relevant manner. Sun et al.41 proposed the use of virtual angiography as a method to validate the accuracy of computational fluid dynamic (CFD) simulations by creating X-ray angiograms from CFD results and comparing them with acquired data. They found a great correspondence between the spatial and temporal variation of contrast agent concentration in both clinical and virtual angiograms. Cebral et al.42 evaluated the similarities in the flow structures of cerebral aneurysms by comparing conventional angiography images with virtual angiograms generated from patient-specific CFD models. Their results showed a good agreement between virtual angiogram and images from the conventional angiograms.
There are a few limitations in this study. In general gravity is not considered in virtual angiograms because it is typically assumed to have a small effect on the blood flow characteristics (it is however more important for the contrast dynamics since it can result in contrast pooling). If contrast pooling is to be exactly reproduced, it is necessary to specify the dilution of the contrast material used in the DSA sequence, which was not considered in our study. The transport equation is solved using an explicit scheme which severely limits the timestep size due to the convective term stability condition. This results in millions of timesteps in order to simulate a total of 10 seconds. To mitigate this, several techniques of code parallelization (OpenMP parallelization for shared memory architecture) and optimization (data structures to minimize memory access) were used to reduce the total simulation time. Finally, patient-specific flow conditions were unknown. Nonetheless, we were still able to identify aneurysms with flow stagnation with a high degree of precision when compared with visual inspection of the actual DSA sequences.
5. Conclusions
CFD-Based virtual angiograms can be used to quantify the level of flow stagnation in intracranial aneurysms and can be used to automatically identify aneurysms with significant flow stagnation. This finding and the approach introduced here lay the foundation for the use of CFD-based studies to identify the relationship between flow stagnation and wall degradation, aneurysm growth, and rupture using large databases of patient-specific image-based aneurysm models.
Acknowledgements
This work was supported by NIH grant R01NS121286 and 2R01NS097457.
Footnotes
Ethical Statement: Not applicable.
References
- 1.Frösen J, Cebral J, Robertson AM & Aoki T Flow-induced, inflammation-mediated arterial wall remodeling in the formation and progression of intracranial aneurysms. Neurosurg. Focus 47, E21 (2019). [DOI] [PMC free article] [PubMed] [Google Scholar]
- 2.Hoh BL et al. Estrogen Deficiency Promotes Cerebral Aneurysm Rupture by Upregulation of Th17 Cells and Interleukin-17A Which Downregulates E-Cadherin. J. Am. Heart Assoc. 7, e008863. [DOI] [PMC free article] [PubMed] [Google Scholar]
- 3.Baeriswyl DC et al. Disturbed flow induces a sustained, stochastic NF-κB activation which may support intracranial aneurysm growth in vivo. Sci. Rep. 9, 4738 (2019). [DOI] [PMC free article] [PubMed] [Google Scholar]
- 4.Tang H et al. The development and understanding of intracranial aneurysm based on rabbit model. Neuroradiology 62, 1219–1230 (2020). [DOI] [PubMed] [Google Scholar]
- 5.Hadad S et al. Evaluation of Outcome Prediction of Flow Diversion for Intracranial Aneurysms. Am. J. Neuroradiol. 42, 1973–1978 (2021). [DOI] [PMC free article] [PubMed] [Google Scholar]
- 6.Thompson JW et al. In vivo cerebral aneurysm models. Neurosurg. Focus 47, E20 (2019). [DOI] [PubMed] [Google Scholar]
- 7.Cooke DL et al. Endovascular Biopsy: In Vivo Cerebral Aneurysm Endothelial Cell Sampling and Gene Expression Analysis. Transl. Stroke Res. 9, 20–33 (2018). [DOI] [PMC free article] [PubMed] [Google Scholar]
- 8.Tsuji M et al. Stagnation and complex flow in ruptured cerebral aneurysms: a possible association with hemostatic pattern. J. Neurosurg. 126, 1566–1572 (2017). [DOI] [PubMed] [Google Scholar]
- 9.Lee HJ, Choi JH, Lee KS, Kim BS & Shin YS Clinical and radiological risk factors for rupture of vertebral artery dissecting aneurysm: significance of the stagnation sign. J. Neurosurg. 137, 329–334 (2021). [DOI] [PubMed] [Google Scholar]
- 10.Skipper K Predicting Hemorrhagic Stroke. Physics 15, 178 (2022). [Google Scholar]
- 11.Reza MMS. Computational Analysis of Blood Flow Stagnation and Residence Time in Patient-Specific Aneurysms. (Northern Arizona University; ). [Google Scholar]
- 12.Reza MMS & Arzani A A critical comparison of different residence time measures in aneurysms. J. Biomech. 88, 122–129 (2019). [DOI] [PubMed] [Google Scholar]
- 13.Mutlu O, Olcay AB, Bilgin C & Hakyemez B Evaluating the Effectiveness of 2 Different Flow Diverter Stents Based on the Stagnation Region Formation in an Aneurysm Sac Using Lagrangian Coherent Structure. World Neurosurg. 127, e727–e737 (2019). [DOI] [PubMed] [Google Scholar]
- 14.Kamitani H, Masuzawa H, Kanazawa I & Kubo T Bleeding Risk in Unruptured and Residual Cerebral Aneurysms – Angiographic Annual Growth Rate in Nineteen Patients. Acta Neurochir. (Wien) 141, 153–159 (1999). [DOI] [PubMed] [Google Scholar]
- 15.Wood EH Angiographic Identification of the Ruptured Lesion in Patients with Multiple Cerebral Aneurysms. J. Neurosurg. 21, 182–198 (1964). [DOI] [PubMed] [Google Scholar]
- 16.Griffith TM Modulation of blood flow and tissue perfusion by endothelium-derived relaxing factor. Exp. Physiol. 79, 873–913 (1994). [DOI] [PubMed] [Google Scholar]
- 17.Moncada S, Palmer RM & Higgs EA Nitric oxide: physiology, pathophysiology, and pharmacology. Pharmacol. Rev. 43, 109–142 (1991). [PubMed] [Google Scholar]
- 18.Moritake K, Handa H, Hayashi K & Sato M Experimental studies of intracranial aneurysms (a preliminary report). Some biomechanical considerations on the wall structures of intracranial aneurysms and experimentally produced aneurysms (Japanese). Neurol. Surg. 1, 115–123 (1973). [Google Scholar]
- 19.Valencia A, Morales H, Rivera R, Bravo E & Galvez M Blood flow dynamics in patient-specific cerebral aneurysm models: The relationship between wall shear stress and aneurysm area index. Med. Eng. Phys. 30, 329–340 (2008). [DOI] [PubMed] [Google Scholar]
- 20.Sforza DM, Putman CM & Cebral JR Computational fluid dynamics in brain aneurysms. Int. J. Numer. Methods Biomed. Eng. 28, 801–808 (2012). [DOI] [PMC free article] [PubMed] [Google Scholar]
- 21.Cebral JR et al. Local Hemodynamic Conditions Associated with Focal Changes in the Intracranial Aneurysm Wall. AJNR Am. J. Neuroradiol. 40, 510–516 (2019). [DOI] [PMC free article] [PubMed] [Google Scholar]
- 22.Hadad S et al. Regional Aneurysm Wall Enhancement is Affected by Local Hemodynamics: A 7T MRI Study. Am. J. Neuroradiol. 42, 464–470 (2021). [DOI] [PMC free article] [PubMed] [Google Scholar]
- 23.Cebral JR et al. Efficient pipeline for image-based patient-specific analysis of cerebral aneurysm hemodynamics: technique and sensitivity. IEEE Trans. Med. Imaging 24, 457–467 (2005). [DOI] [PubMed] [Google Scholar]
- 24.Mut F et al. Computational Hemodynamics Framework for the Analysis of Cerebral Aneurysms. Int. J. Numer. Methods Biomed. Eng. 27, 822–839 (2011). [DOI] [PMC free article] [PubMed] [Google Scholar]
- 25.Cebral JR, Yim PJ, Löhner R, Soto O & Choyke PL Blood Flow Modeling in Carotid Arteries with Computational Fluid Dynamics and MR Imaging. Acad. Radiol. 9, 1286–1299 (2002). [DOI] [PubMed] [Google Scholar]
- 26.Durka MJ et al. A data-driven approach for addressing the lack of flow waveform data in studies of cerebral arterial flow in older adults. Physiol. Meas. 39, 015006 (2018). [DOI] [PMC free article] [PubMed] [Google Scholar]
- 27.Cebral JR, Castro MA, Putman CM & Alperin N Flow–area relationship in internal carotid and vertebral arteries. Physiol. Meas. 29, 585 (2008). [DOI] [PMC free article] [PubMed] [Google Scholar]
- 28.Womersley JR Method for the calculation of velocity, rate of flow and viscous drag in arteries when the pressure gradient is known. J. Physiol. 127, 553–563 (1955). [DOI] [PMC free article] [PubMed] [Google Scholar]
- 29.Sherman TF On connecting large vessels to small. The meaning of Murray’s law. J. Gen. Physiol. 78, 431–453 (1981). [DOI] [PMC free article] [PubMed] [Google Scholar]
- 30.Lu Y-H, Cai Y, Zhang Y, Wang R & Li Z-Y Digital Subtraction Angiography Contrast Material Transport as a Direct Assessment for Blood Perfusion of Middle Cerebral Artery Stenosis. Front. Physiol. 12, 716173 (2021). [DOI] [PMC free article] [PubMed] [Google Scholar]
- 31.Patil V & Johnson G An improved model for describing the contrast bolus in perfusion MRI. Med. Phys. 38, 6380–6383 (2011). [DOI] [PMC free article] [PubMed] [Google Scholar]
- 32.Soto O Advances in FEFLO. 39th Aerosp. Sci. Meet. Exhib. (2001). [Google Scholar]
- 33.Sakellariou S, Li W, Paul MC & Roditi G Rôle of contrast media viscosity in altering vessel wall shear stress and relation to the risk of contrast extravasations. Med. Eng. Phys. 38, 1426–1433 (2016). [DOI] [PubMed] [Google Scholar]
- 34.Stoltzfus JC Logistic Regression: A Brief Primer. Acad. Emerg. Med. 18, 1099–1104 (2011). [DOI] [PubMed] [Google Scholar]
- 35.Endres J, Redel T, Kowarschik M & Hornegger J Investigating Contrast Settlement Using Virtual Angiography. in Bildverarbeitung für die Medizin 2014: Algorithmen - Systeme - Anwendungen Proceedings des Workshops vom 16. bis 18. März 2014 in Aachen (eds. Deserno TM, Handels H, Meinzer H-P & Tolxdorff T.) 282–287 (Springer, 2014). doi: 10.1007/978-3-642-54111-7_53. [DOI] [Google Scholar]
- 36.Mantha A, Karmonik C, Benndorf G, Strother C & Metcalfe R Hemodynamics in a Cerebral Artery before and after the Formation of an Aneurysm. AJNR Am. J. Neuroradiol. 27, 1113–1118 (2006). [PMC free article] [PubMed] [Google Scholar]
- 37.Ikeda H et al. Delayed aneurysm rupture due to residual blood flow at the inflow zone of the intracranial paraclinoid internal carotid aneurysm treated with the Pipeline embolization device: Histopathological investigation. Interv. Neuroradiol. 21, 674–683 (2015). [DOI] [PMC free article] [PubMed] [Google Scholar]
- 38.Vali A, Abla AA, Lawton MT, Saloner D & Rayz VL Computational Fluid Dynamics modeling of contrast transport in basilar aneurysms following flow-altering surgeries. J. Biomech. 50, 195–201 (2017). [DOI] [PMC free article] [PubMed] [Google Scholar]
- 39.Endres J et al. Virtual angiography using CFD simulations based on patient-specific parameter optimization. in 2012 9th IEEE International Symposium on Biomedical Imaging (ISBI) 1200–1203 (2012). doi:10.1109/ISBI.2012.6235776. [Google Scholar]
- 40.Ford MD et al. Virtual angiography for visualization and validation of computational models of aneurysm hemodynamics. IEEE Trans. Med. Imaging 24, 1586–1592 (2005). [DOI] [PubMed] [Google Scholar]
- 41.Sun Q et al. Quantitative evaluation of virtual angiography for interventional X-ray acquisitions. in 2009 IEEE International Symposium on Biomedical Imaging: From Nano to Macro 895–898 (2009). doi:10.1109/ISBI.2009.5193197. [Google Scholar]
- 42.Cebral JR, Radaelli A, Frangi A & Putman CM Qualitative comparison of intra-aneurysmal flow structures determined from conventional and virtual angiograms. in Medical Imaging 2007: Physiology, Function, and Structure from Medical Images vol. 6511 433–441 (SPIE, 2007). [Google Scholar]


