

Abstract
Background:
Poor functional status is a key marker of morbidity, yet is not routinely captured in clinical encounters. We developed and evaluated the accuracy of a machine learning algorithm that leveraged electronic health record (EHR) data to provide a scalable process for identification of functional impairment.
Methods:
We identified a cohort of patients with an electronically captured screening measure of functional status (Older Americans Resources and Services ADL/IADL) between 2018–2020 (N=6484). Patients were classifed using unsupervised learning K means and t-distributed Stochastic Neighbor Embedding into normal function (NF), mild to moderate functional impairment (MFI), and severe functional impairment (SFI) states. Using 11 EHR clinical variable domains (832 variable input features), we trained an Extreme Gradient Boosting supervised machine learning algorithm to distinguish functional status states, and measured prediction accuracies. Data was randomly split into training (80%) and test (20%) sets. The SHapley Additive Explanations (SHAP) feature importance analysis was used to list the EHR features in rank order of their contribution to the outcome.
Results:
Median age was 75.3 years, 62% female, 60% White. Patients were classified as 53% NF (n=3453), 30% MFI (n=1947), and 17% SFI (n=1084). Summary of model performance for identifying functional status state (NF, MFI, SFI) was AUROC (area under the receiving operating characteristic curve) 0.92, 0.89, 0.87, respectively. Age, falls, hospitalization, home health use, labs (e.g., albumin), comorbidities (e.g., dementia, heart failure, chronic kidney disease, chronic pain) and social determinants of health (e.g., alcohol use) were highly ranked features in predicting functional status states.
Conclusion:
A machine learning algorithm run on EHR clinical data has potential utility for differentiating functional status in the clinical setting. Through further validation and refinement, such algorithms can complement traditional screening methods and result in a population-based strategy for identifying patients with poor functional status who need additional health resources.
Keywords: machine learning/artificial intelligence, electronic health records, functional status, older adults
Introduction
Functional impairment, difficulty in the ability to carry out instrumental and basic tasks required for daily living, is a prevalent health problem in the aging population, and affects one in seven middle-aged and older Americans.1–4 According to National Health Interview Survey data from 2003–2007, and more recent CDC data from 2018, ADL/IADL limitations are a common experience among US adults, with prevalence rates increasing from 2–4% between ages 45–64 to 12–19% by age 75.1,5 While these limitations can occur in younger adults, they become more prevalent after age 44 and with each decade thereafter.1,5 Functional impairment is also associated with higher rates of hospitalization, nursing home admissions, and death.6–8 Given people with functional impairment are at a greater risk for poor outcomes, it is essential to identify functional impairment when this information has not been directly obtained. Additionally, understanding how to utilize clinical data to identify at-risk patients is also important in order to aid older adults with their health and unmet symptom needs.
Functional impairment screening is rarely conducted in primary care or subspecialty visits and is not typically documented in medical records.9,10 This lack of awareness can lead to incorrect assumptions about a person’s functional status, missed opportunities for appropriate care plans and increased use of health resources, such as emergency department visits or hospitalization. However, electronic health records (EHRs) contain substantial and valuable clinical information routinely collected during patient care. Research has shown that frailty and cognitive impairment clinical biomarkers are present in EHR data,11–14 but how this data can be utilized to identify functional impairment remains unclear.
Machine learning (ML) offers an exciting methodological approach for harnessing EHR data15,16 to estimate an individual’s level of functional impairment. Although recent studies have employed deep learning models to predict cognitive impairment and identify patient subgroups using EHR data,17–21 there is a significant research gap in developing machine learning models for detecting functional impairment, a crucial clinical outcome for older adults. Machine learning, a type of artificial intelligence that leverages data to enhance classification performance, has the potential to identify functional impairments or predict them by detecting patterns in the data. In this study, we aimed to address this gap by developing and evaluating the accuracy of a machine learning algorithm that uses EHR data to provide a targeted and scalable process for identification of functional impairment.
Methods
Data source to train and test model
We identified a cohort of patients aged 18 and older, with one or more encounters within a large tertiary academic health system who had a completed electronically captured Older Americans Resources and Services (OARS)22,23 functional assessment flowsheet between 2018–2020 in the EHR (N=6484). Functional limitations are present in younger adults, but increase with age.1,5 Thus, to improve model generalizability across adulthood, we included all adults over the age of 18. Patients with a total OARS score missing were excluded (n=164). Patients with missing individual item scores were included if a total score had been generated (n=646). Partial OARS scores may occur if a question is intentionally or inadvertently skipped or left blank. For those who had multiple encounters with completed OARS functional assessments, we used only the first OARS encounter in the analysis. The OARS functional assessment is typically completed by clinicians, medical staff, or patients and entered directly into the EHR. The majority of assessments were conducted in the ambulatory setting, with fewer than 3% in the inpatient setting.
Since functional status information was present for these patients, this cohort was useful for clustering functional status types and ascertaining the characteristics associated with different levels of functioning (using unsupervised machine learning), and could be used to train a predictive algorithm (using supervised machine learning model) to correctly identify patients without EHR-recorded functional status who likely had functional impairment.
Functional Status Measure
The OARS functional assessment tool is a brief and reliable assessment that consists of seven basic activities of daily living items (ADL; eating, dressing, grooming, walking, transferring, bathing/showering, and toileting), and seven instrumental items (IADL; housework, cooking, shopping, traveling, medication management, telephone use, financial management). Each item is scored 0–2, (score 0= No independent function, 1= Partial functional impairment, 2= independent). The total score range is 0–28, with lower scores indicating greater functional impairment.22,23 Individual missing items were coded as 0, and contributed to the score of the individual ADL and IADL components as well as to the total score.
Functional Status Clustering using Unsupervised Machine Learning
To identify functional status subtypes from OARS total scores, we used K means unsupervised machine learning because clinically established cut-points were unavailable. K means is a widely used approach that can classify unlabeled data into clusters based on similarities and is relatively simple to implement. Clustering was performed using the following EHR data variables: earliest documented OARS functional status assessment used as index date, age, gender, race, IADL score, ADL score, OARS composite score, death dates, comorbidities, and falls. Comorbidity data was obtained using ICD-10 codes from billing diagnoses or problem lists from the most recent encounter (within 1 year of the OARS functional assessment index date). By including these variables, we aimed to capture key demographic, functional, and clinical characteristics of the patient population that could help identify meaningful subgroups. The optimum number of clusters was found to be 3 by the elbow method. Based on these clusters, the 3 identified clinical subtypes were: 1) normal function (NF), 2) mild to moderate functional impairment (MFI), and 3) severe functional impairment (SFI) states.
Clustering Visualization and Labeling
The results were plotted using t-distributed Stochastic Neighbor Embedding (t-SNE) for visualization of the data. It is preferred because it is particularly good at preserving the local structure of the data points, which can reveal clusters or patterns that may otherwise not be apparent. As shown in Figure 1, the NF patients are represented by blue dots (cluster 2), MFI patients by orange dots (cluster 1), and SFI patients by green dots (cluster 0). To clinically validate the clustering, the following clinical data was reviewed: distribution of age, OARS functional assessment scores, comorbidities, and 1- year mortality (Table 1). These resulting clusters were used as outcome labels for our supervised machine learning predictive model.
Figure 1.

K Means clustering of functional impairment classification
Cluster 0 = severe functional impairment, Cluster 1 = mild to moderate functional impairment, Cluster 2 = normal function; TSNE = t-distributed stochastic neighbor embedding
K means clustering results were plotted using t-distributed Stochastic Neighbor Embedding (t-SNE) for visualization of the data, which preserves the local structure of the data points, and reveals clusters. The NF patients are represented by blue dots (cluster 2), MFI patients by orange dots (cluster 1), and SFI patients by green dots (cluster 0).
Table 1.
Patient characteristics by functional impairment classification (N=6484)
| Variable | Overall (N = 6484) | Normal function (cluster 2) n=3453 | Mild to moderate functional impairment (cluster 1) n=1947 | Severe functional impairment (cluster 0) n=1084 |
|---|---|---|---|---|
| Demographics | ||||
| Age (mean(SD)) Median, IQR [Q1,Q3] |
71.3 (14.1) 74, [65,81] |
69.2 (14.3) | 70.9 (13.1) | 78.6 (12.6) |
| Gender | ||||
| Female | 3941 (60.8) | 1948 (56.4%) | 1324 (68.0%) | 669 (61.7%) |
| Male | 2542 (39.2) | 1505 (43.6%) | 623 (32.0%) | 414 (38.2%) |
| Unknown | 1 ( 0.0) | 0 (0.0%) | 0 (0.0%) | 1 (0.1%) |
| Race | ||||
| White | 4035 (62.2) | 2306 (66.8%) | 1090 (56.0%) | 639 (58.9%) |
| Black | 2126 (32.8) | 963 (27.9%) | 784 (40.3%) | 379 (35.0%) |
| Asian | 73 ( 1.1) | 35 (1.0%) | 21 (1.1%) | 17 (1.6%) |
| Other | 131 ( 2.0) | 63 (1.8%) | 42 (2.2%) | 26 (2.4%) |
| Missing | 108 ( 1.7) | 77 (2.2%) | 10 (0.5%) | 21 (1.9%) |
| Ethnicity | ||||
| Non-Hispanic | 6156 (94.9) | 3235 (93.7%) | 1889 (97.0%) | 1032 (95.2%) |
| Hispanic | 132 ( 2.0) | 82 (2.4%) | 28 (1.4%) | 22 (2.0%) |
| Missing | 196 (3.0%) | 136 (3.9%) | 30 (1.5%) | 30 (2.8%) |
| Alcohol use | 1734 (26.7%) | 1217 (35.2%) | 369 (19.0%) | 148 (13.7%) |
| Hospitalizations | 2583 (39.9%) | 756 (22.0%) | 1273 (65.4%) | 554 (51.2%) |
| Comorbidities | ||||
| Cognitive Impairment/Dementia | 1680 (26.3%) | 498 (14.8%) | 551 (28.3%) | 631 (59.2%) |
| Depression | 2153 (33.7) | 740 (21.9%) | 1019 (52.3%) | 394 (37.0%) |
| Diabetes | 2534 (39.7%) | 1069 (31.7%) | 1051 (54.0%) | 414 (38.8%) |
| Hypertension | 4587 (71.8%) | 2039 (60.4%) | 1727 (88.7%) | 821 (77.0%) |
| Parkinson’s disease | 151 (2.4%) | 40 (1.2%) | 31 (1.6%) | 80 (7.5%) |
| Stroke | 295 (4.6%) | 50 (1.5%) | 146 (7.5%) | 99 (9.3%) |
| Falls | 1678 (26.3%) | 372 (11.0%) | 809 (41.6%) | 497 (46.6%) |
| 1 year mortality | 786 (12.1%) | 188 (5.4%) | 338 (17.4%) | 260 (24.0%) |
| Functional status screening scores | ||||
| OARS composite score Median (25th, 75th) |
24.0 (18.0, 27.0) | 27.0 (25.0, 28.0) | 21.0 (18.0, 24.0) | 12.0 (8.0, 14.0) |
Functional Status Prediction using Supervised Machine Learning
EHR Features Used to Train Supervised Machine Learning
Various clinical EHR variables relevant to functional status prediction, as identified by an expert panel of providers in Geriatrics, Palliative Care, Physical and Occupational Therapy, Care Management, Health Informaticists, and Research Scientists, were used to predict the above-mentioned functional impairment clusters. The selection of these variables for model development was informed by the World Health Organization’s (WHO) International Classification of Functioning, Disability, and Health model for evaluating function.24 EHR data elements were mapped to the WHO’s domains of social contextual factors (e.g., demographics, insurance, smoking, alcohol), health conditions and impairment types (e.g., cognitive, physical, sensory, body mass index), factors that increase impairment demand (e.g., health utilization, medications, laboratory data), and factors that reduce impairment demand (e.g., durable medical equipment, supplemental oxygen, home health use). Supplemental Table 1 contains a complete list of feature domains and the corresponding EHR sources used to train our models. Feature, also known as predictors or independent variables, are data that is used as the input for ML models to make predictions. Some features were categorized as binary variables; for example, diagnoses, referrals, and medications were represented as binary variables indicating whether or not the patient had an ICD-10 code, encounter visit, or was prescribed a medication within the past year.25 A single feature could be represented by multiple binary variables. One example is the discharge destination feature, which treats each destination (such as home with self-care, home with home health, hospice, and skilled nursing facility) as a separate binary variable. The total number of binary features associated with each feature domain can be found in Supplemental Table 1. All features were extracted with a lookback period of one year from the time of their first OARS functional assessment score. Medications, diagnosis codes, labs (actual clinical values), and referrals were from the encounter closest to the OARS functional assessment index encounter date. Numerical values, such as labs, were not included in the analysis if they were missing. Number of hospitalization and emergency room visits were aggregated over the lookback period. The data was randomly split into training and test datasets. A training/validation data set (80% of the data, n = 4863) and a test data set (20% of the data, n = 1621) were obtained.
Developing Supervised Machine Learning Algorithm
To generate prediction models of functional impairment, supervised machine learning Extreme Gradient Boosting (XGboost), a decision-tree based ensemble that implements a gradient boosting framework,26 was applied to the training data set. XGBoost was selected for its ability to handle missing values and unscaled data, and to improve model performance and execution speed. The supervised learning was built with results from the unsupervised machine learning clustering exercise. Clustering results were used as the functional status outcome “label” for supervised learning. The model training utilized features from 11 domains, resulting in a total of 832 features used in the machine learning algorithm. This is because some features were represented by multiple binary variables (see Supplementary Table 1). The prediction target outcome was functional impairment subtype (NF, MFI, SFI). We optimized the performance of our XGBoost decision tree models by using grid search to fine-tune the hyperparameters. The grid search tests every combination of hyperparameter values for the XGBoost algorithm and identifies the optimal combination for the highest accuracy and performance of our models. We then tested the models with the optimized hyperparameters to ensure they accurately captured the relationships between variables. By fine-tuning the hyperparameters in this way, we obtained the best possible results from our models. We used validation data to estimate when to stop training in the multilayer perceptron method. All the codes for the task were written in Python 3.9. The XGBoost model was implemented with XGBoost 1.5.1 and sklearn 1.0.1.
Model Performance, Accuracy, Calibration, and Interpretation
After the hyperparameters of the prediction model were optimized through training, the model was tested using all available test data. The area under the receiver operating characteristic curve (AUROC) and the area under the precision-recall curve (AUPRC) were calculated to evaluate the model’s performance. In general, a high AUROC or AUPRC value (closer to 1.0) suggests that the model is performing well. The model’s accuracy was assessed using a confusion matrix to determine the percentage of functional clusters classified correctly. Model calibrations were also performed to compare individuals’ predicted model outcomes with their observed OARS functional status clusters. For model interpretation, we used the SHAP (Shapley Additive Explanations) module of Python to calculate SHAP values,27 which is a model-agnostic approach for explaining the output of any machine learning model, including XGBoost which we used in our study. SHAP provides a unified way to interpret the contribution of each feature to the final prediction, helping to understand the relationships between input features and the output. Positive SHAP values indicate that a feature is increasing the prediction, while negative SHAP values indicate that it is decreasing the prediction. SHAP value plots help to visualize the relative importance of different features, and we used this analysis to rank EHR features based on their contribution to the outcome. This is considered the best type of approach because it allows for a more comprehensive understanding of the underlying mechanisms of the model’s decision-making process.
Results
The total analytic cohort consisted of 6484 patients. Median age was 74 years, 61% female, 62% White. Functional status categories were derived from unsupervised machine learning, and in our total sample 53% were classified as normal function (n=3453), 30% as mild to moderate functional impairment (n=1947), and 17% as severe functional impairment (n=1084). Patient charateristics based on functional impairment labeling are shown in Table 1. The proportions of NF, MFI, and SFI were 53%, 30%, 17%, respectively, for training data and 54%, 29%, 17%, respectively, for test data. After model training, the AUROC values obtained from the XGBoost were AUROC 0.92 (95% Confidence Interval (CI) 0.91 – 0.93) for NF, 0.89 (95% CI 0.87 – 0.91) for MFI, and 0.87 (95% CI 0.85 – 0.90) for SFI (Figure 2). AUPRC 95% CI results are shown in Supplemental Figure 1.
Figure 2.

Receiver operating characteristic curve performance of XGBoost model on the test set for predicting functional status cluster.
ROC= receiver operative curve; AUC= area under the curve; Cluster 0 = severe functional impairment, Cluster 1=mild to moderate functional impairment, Cluster 2=normal function
To assess the accuracy of the prediction model, we compared the predicted functional impairment to the observed OARS functional impairment cluster for each subject. The model had a training set accuracy of 0.98 and a test set accuracy of 0.71. The functional impairment rates within each group were consistent with the predicted probabilities, as shown in the calibration plots in Figure 3. This suggests that the model is capable of accurately classifying functional impairment subtypes.
Figure 3.
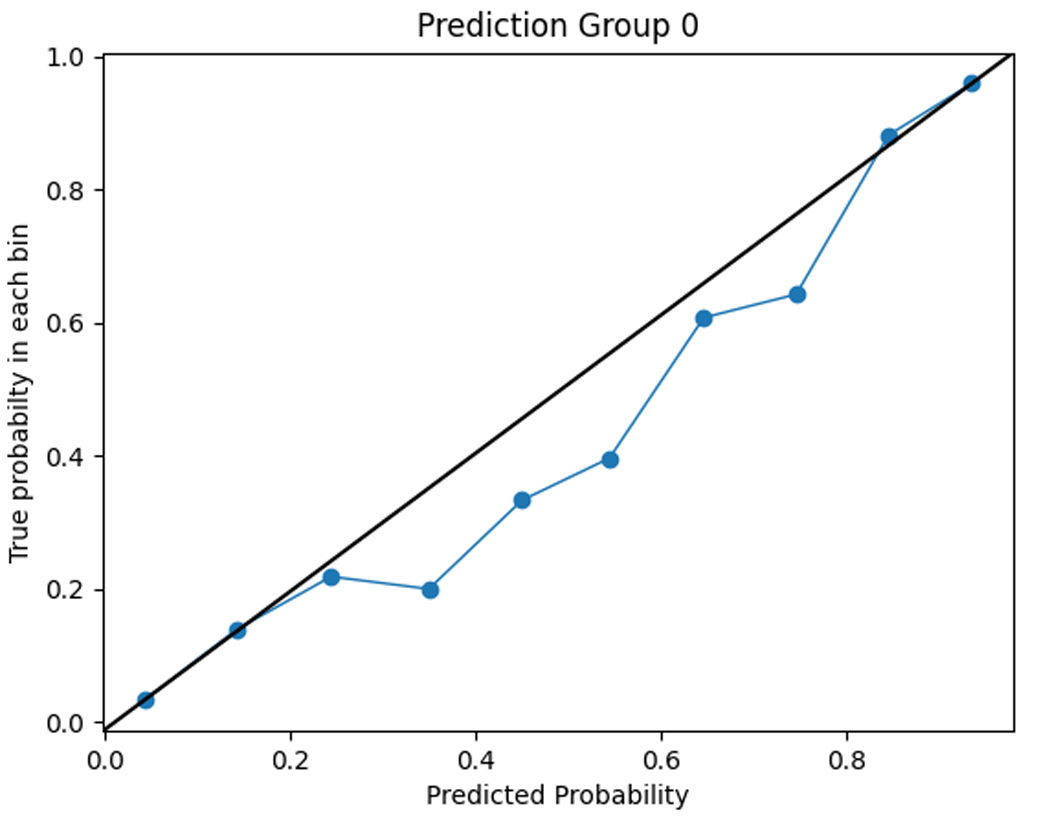
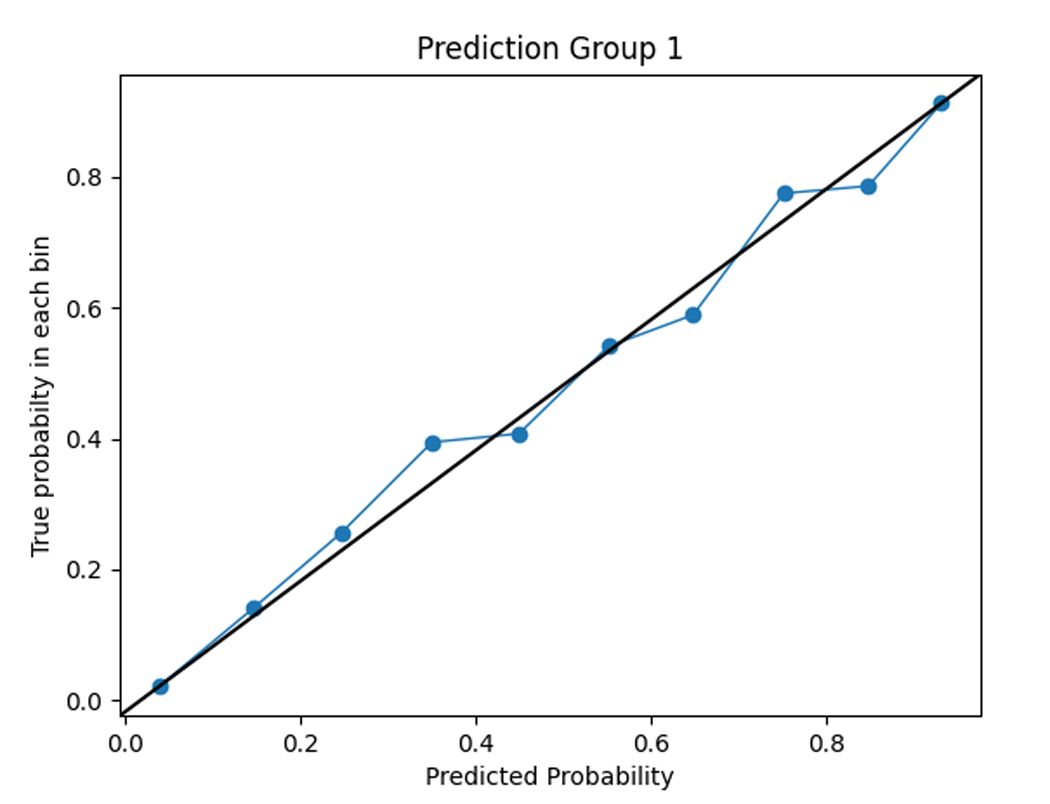
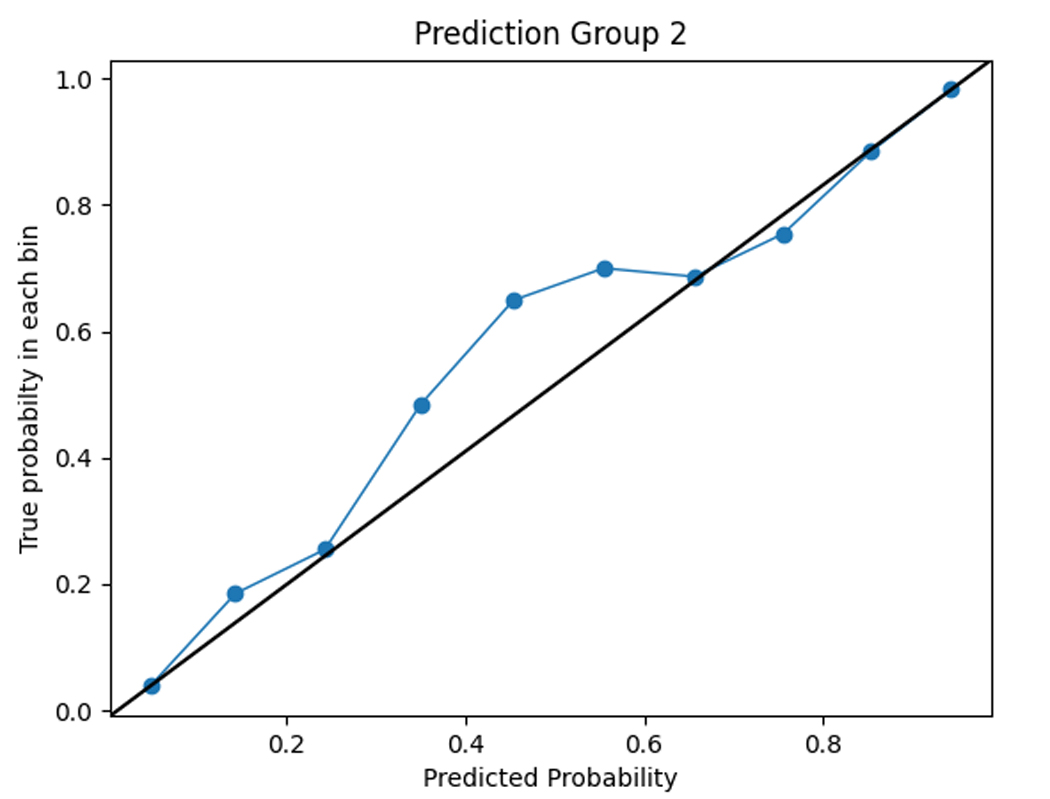
Calibration plots comparing model predictions to observed OARS functional status cluster classification.
Cluster 0 = severe functional impairment; Cluster 1=mild to moderate functional impairment, Cluster 2=normal function
The figures show the predicted probabilities on the x-axis and the observed proportions on the y-axis. The diagonal solid line represents a perfect prediction by an ideal model. The dotted line represents the performance of the machine learning algorithm; a closer fit to the diagonal solid line represents a better prediction. The calibration plot shows good agreement between the observed and expected functional status cluster membership with a slight overestimation of NF cluster membership and a slight underestimation of SFI cluster membership.
SHAP values were used to assess the importance of model features and the accuracy of the prediction algorithm. To interpret these values, users can analyze both the magnitude and sign of each feature’s SHAP value. Plots display the magnitude and sign, with the magnitude shown by the position on the x-axis and the sign represented by color (positive [red] or negative [blue]). Features are ranked by contribution to predictions, with higher magnitude values indicating increased contributions. Figure 4 shows the top features for each functional cluster. For example, the SFI cluster was associated with older age, higher BMI, presence of dementia, mobility and functional impairments, or falls. The MFI cluster was linked to the presence of multiple comorbidities, such as anemia, anxiety, heart failure, depression, hypertension, and chronic pain. To predict membership in the NFI group, the absence of dementia, falls, other comorbidities, and ADL and mobility impairments were considered important factors by the model.
Figure 4.
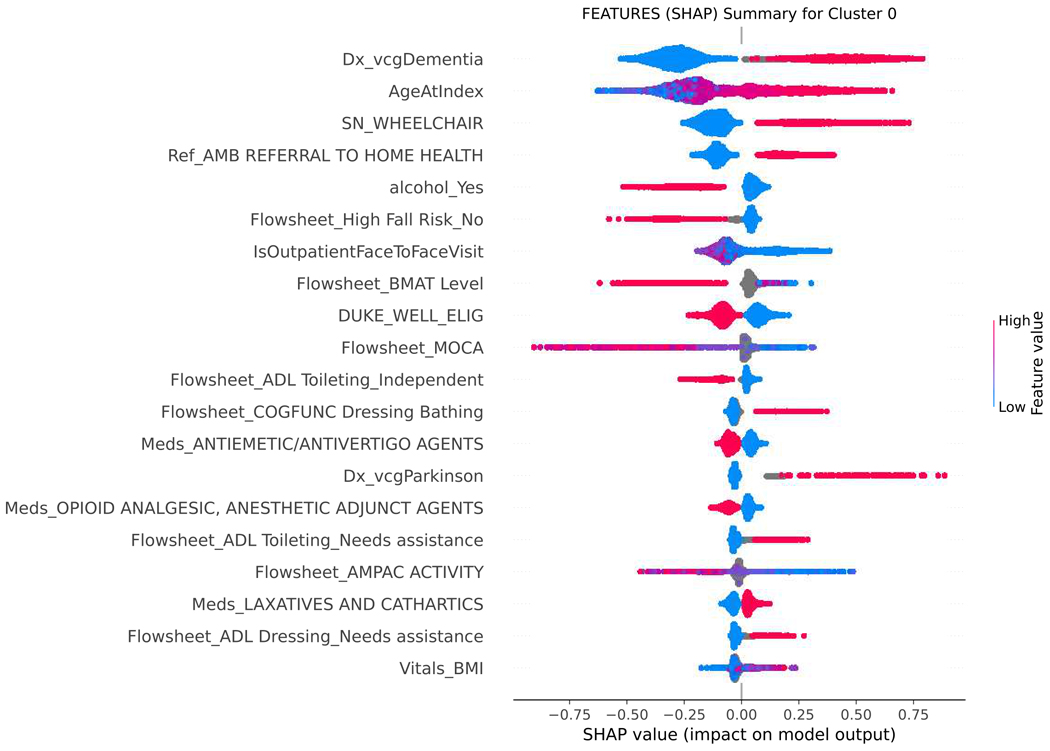
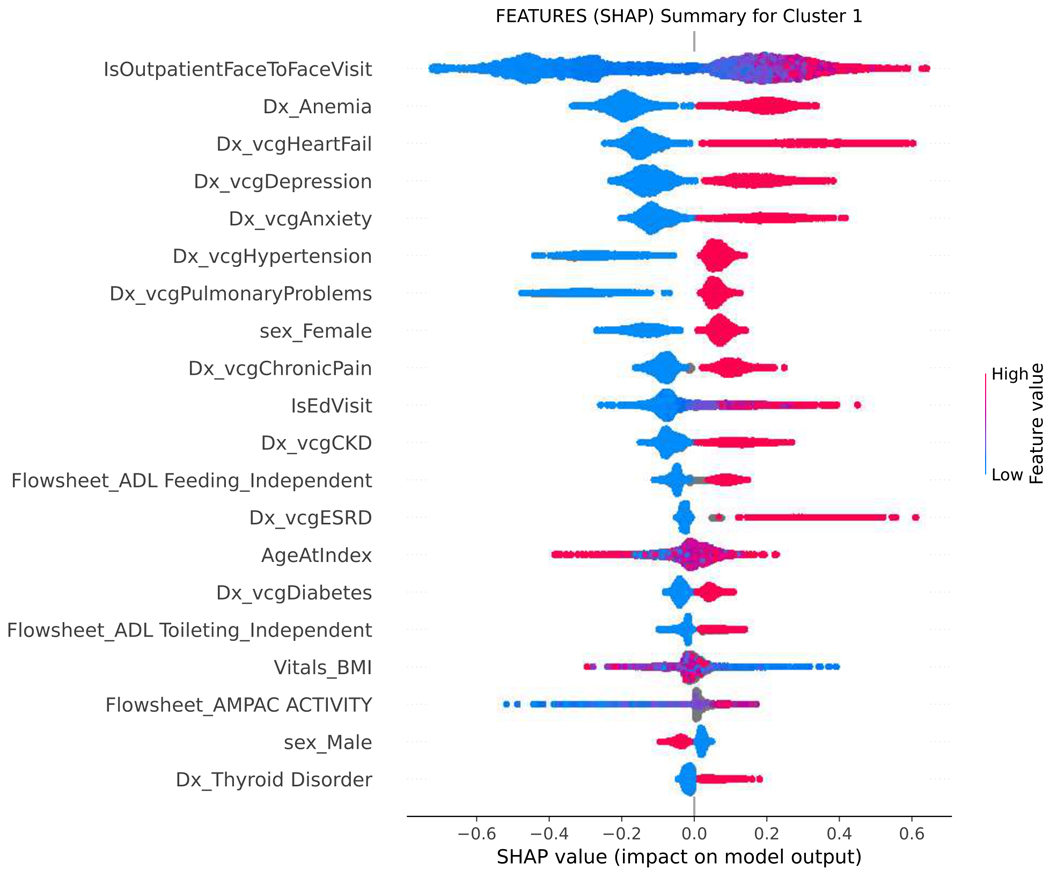
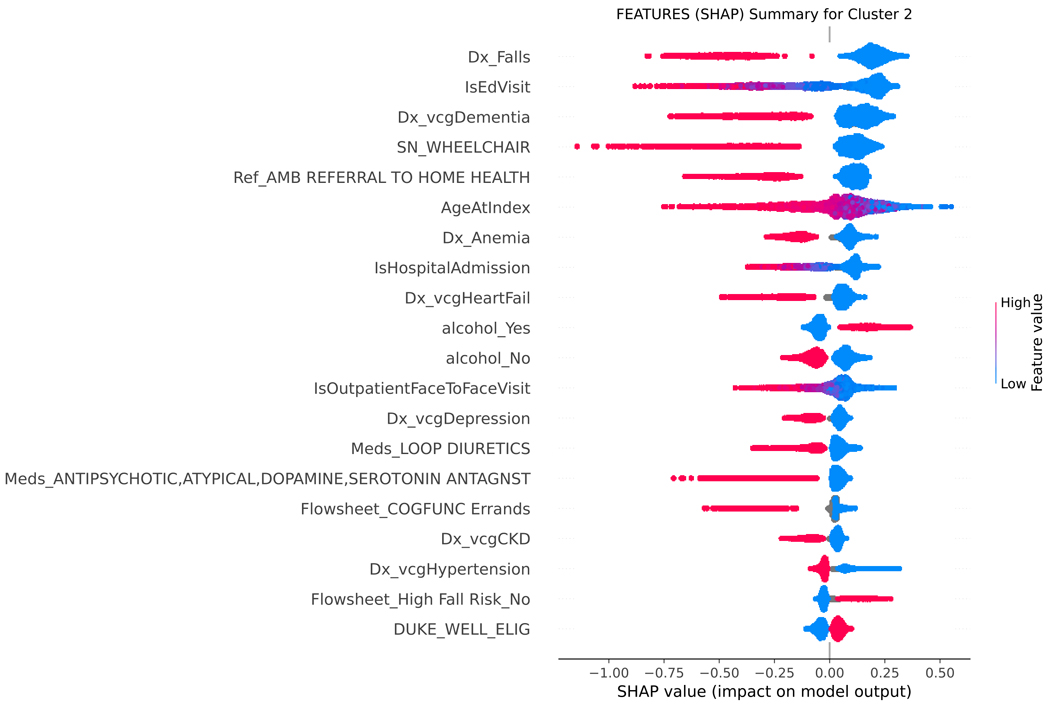
SHAP summary plot, visualizing the Shapley values to assess importance of model features and impact on predicting functional status classification.
SHAP= SHapley Additive explanation; BMI= body mass index; BMAT= Bedside mobility assessment tool; MOCA= Montreal Cognitive Assessment; SLUMS= St. Louis University Mental Status; NuDESC= Nursing Delirium Screening; Flowsheet = term used in Epic EHR to describe a tool to collect data in a discrete format that can be trended over time. Cluster 0 = severe functional impairment; Cluster 1=mild to moderate functional impairment, Cluster 2=normal function
Figure 4 shows the top features for each functional cluster that contribute to the model’s predictions. Raw data labels are shown for each feature. The SHAP value plot shows the distribution of SHAP values assigned to each feature across all cases in the sample. The x-axis represents the SHAP value, which indicates the impact of a feature on the predicted functional status classification. The color of a data point represents the feature value in a case. In the vertical heat map, high (red) indicates higher value of the feature. Most of our features are categorical and binary, coded 1 (red) when present, and 0 (blue) absent. A positive SHAP value means that a feature is pushing the prediction higher than the average prediction. The farther the magnitude of the value is to the right, the more the feature contributes to the prediction. Conversely, a negative SHAP value means that a feature is pushing the prediction lower than the average prediction. The farther the value is to the left, the more the negative value contributes to the prediction. For example, when predicting belonging to the SFI cluster, a positive SHAP value for the dementia feature suggests that the presence of dementia is associated with membership in the SFI cluster, while a negative SHAP value for dementia indicates the opposite. Features are then ranked by contribution to predictions, with higher magnitude values indicating more significant contributions. The top-ranked features, which are the most important features in the prediction, can be different for each functional cluster.
Discussion
Our machine learning model detects evidence of functional impairment from EHR clinical data and achieved strong performance. Unfortunately, there are few automated tools to detect early signs of functional impairment, putting patients at risk for muscle loss, functional decline, falls, high health care utilization, long-term care needs, and pain. We used EHR data to identify functional status and potential decline, with the goal of improving early detection. Machine learning algorithms that predict functional impairment can supplement formal assessment workflows rather than replacing them. These algorithms can help providers efficiently estimate functional needs within a population and connect patients to formal assessments and ameliorative services.
Despite including younger adults in the dataset, this algorithm is primarily relevant to middle-aged and older adults. This is because the ML model was trained and tested using the OARS functional status measure developed for older adults.22,23 While the study included all adults over the age of 18 for generalizability,1,5 the sample was predominantly middle-aged and older adults, making the functional clusters and risk factor patterns detected by the ML algorithm and the model’s performance characteristics most relevant to this population.
The XGBoost model demonstrated its efficacy in predicting functional status by leveraging patterns of patient data automatically derived from the EHR. Previous research in developing predictive models for conditions related to poor function has primarily concentrated on frailty or cognitive impairment.28,29 These models have used both unstructured and structured EHR data elements and have achieved AUCs ranging from 0.7 to 0.9. 18,30–32 In contrast, our study is the first to focus on predicting impaired performance of daily living activities, utilizing only predictors available in structured patient data from the EHR, making data abstraction and analysis more feasible, reliable, timely, and lower cost compared to also using unstructured data. Despite this difference, our results are comparable to those of previous models. Algorithms developed to detect functional impairment can complement existing work on frailty by targeting a crucial clinical endpoint. Frailty-targeted algorithms aim to identify patients at an earlier point in their clinical trajectory, while algorithms targeting functional impairment identify patients who have already reached clinical endpoints, making them distinct in terms of patient identification.33 Moreover, when it comes to risk prediction, frailty assessment can be approached using different methods, such as phenotype or cumulative deficit approaches,34–37 whereas functional status assessment has a more consistent and universally agreed-upon approach.22,23,38,39 This makes it easier to establish labeled outputs for ML model development.
Further, the XGBoost model recovered many well-known functional impairment risk factors as being highly ranked features in predicting functional status, including older age, presence of hospitalization, chronic comorbidities, falls and mobility impairment.40–44 Variables less commonly associated with functional impairment were also recovered by the model, including labs (e.g., albumin) and medications (e.g., diuretics). Past studies have shown that these variables are associated with frailty,34,45 a multi-factorial clinical syndrome of age-related physiological decline of reserve and resistance to stressors that is independently predictive of worsening functional decline.37 Thus, these results indicate that internal algorithms of the prediction models were learning predictors of function that are consistent with previous evidence.
There is an evolving landscape of machine learning in geriatrics. However, very few models are successfully implemented into clinical workflows, and none have been reported within geriatric clinical workflows. Our model development followed implementation guidelines proposed by Hofer and colleagues to help overcome these challenges.46 First, we selected an important problem target, functional status, which has high clinical value for patients and health systems. Next, we created a team with abilities and roles that are critical to implementation efforts, including clinical subject matter experts, clinical champions, data teams capable of extracting data from the electronic health records, able to perform data validation, and experts in machine learning. Next we developed a model using readily available data features within EHRs, which would allow it to interface with different EHRs, overcoming a significant challenge in model deployment into clinical workflows. We also employed commonly used ML metrics to facilitate rapid clinical interpretation. However, a significant technical challenge remains for deploying ML models using EHR data into clinical workflows. Few EHR companies provide a ML platform within the EHR. Therefore, despite the growing utility of EHR data and ML capabilities, most models will need to run on a platform outside the EHR, and then integrate the data back into the EHR. Future work is needed that leverages implementation methodology to study strategies for successful ML deployment and integration into clinical workflows.
Our model performance could be enhanced in several ways. Firstly, implementing a classification method for functional impairment from OARS using pre-defined cut-points could boost label accuracy. Secondly, incorporating unstructured data from clinical notes in the EHR system can provide richer insights into a patient’s physical function than what is captured in the existing structured codes. Lastly, utilizing deep-learning or representation learning architectures may improve the model’s predictive capabilities compared to simpler, yet more easily deployable, gradient boosting machine models.
The limitations of this study include the use of a single academic health system’s EHR clinical data, which may limit generalizability. It is possible that some cases of functional impairment were missed because the OARS functional assessment measure was not administered, questions were answered incorrectly, or were answered correctly but with false-negative results. Further, using partial scores in ML training/validation can impact the model’s performance and reduce accuracy and generalizability. Future work should explore alternative methods, such as imputation techniques, to handle incomplete data. It is also possible that other model architectures (e.g., generalized linear models, random forests, and neural networks) may match or outperform the proposed XGBoost models. However, when model deployment into clinical care becomes a more critical design criterion, future work using performance vs. ease of implementation benchmarking will lead to optimal model selection. Overall, the XGBoost model is a simpler model that could be readily integrated into clinical workflows for most health systems, and is a first step towards better understanding the use of machine learning to identify the defining features of functional impairment within a health system population. Another limitation is incomplete EHR data,47,48 which is mitigated via the XGBoost model where missingness issues are alleviated by the intrinsic covariate sampling used by the weak learners (classification trees), which is part of the gradient boosting bag. Future work could explore using alternative missing data methods such as SMOTE59 or gradient importance learning,50 which may yield better performance. Alternative measures of ADL/IADL functioning, variation in screening for related risk factors such as cognitive impairment, delirium, or mobility, overall data availability, and EHR capabilities, limit the ability to generalize model performance to other health systems. Future work that compiles comprehensive EHR data across multiple sites could improve model generalizability.
Conclusions:
Our study demonstrates the feasibility of accurate prediction of functional status from routine clinical data available in the EHR, and provides a list of function-related variables other institutions can use to develop their own models. Through further validation and refinement, such a model may enable more population-based strategies for identifying functional impairment, and more precise targeting of prevention or treatment resources within health system populations to patients likely to benefit most, including addressing possible unmet geriatric and palliative care needs.
Supplementary Material
Supplemental Table 1. Electronic health record feature domains and input features used to train the supervised machine learning model to predict functional status clusters.
Supplemental Figure 1. Precision recall curves performance for XGBoost model. Legend: AUC=area under curve; PPV = positive predictive value; Cluster 0 = severe functional impairment, Cluster 1=mild to moderate functional impairment, Cluster 2=normal function
Key Points:
In this cohort study using routinely captured electronic health record (EHR) data of 6484 patients, unsupervised machine learning methods were applied to categorize functional status and then a well-performing supervised machine learning algorithm was developed to correctly classify functional status by those categories.
Machine learning methods indicate a range of EHR standardized data elements that may be useful in identifying patients with functional impairment.
Machine learning algorithms can detect evidence of functional impairment from clinical data in the EHR, potentially facilitating earlier detection of functional impairment within health systems.
Why does this matter:
Functional status is a key marker of morbidity in older adults but functional status screening is rarely recorded in the electronic health record. Machine learning algorithms can complement traditional screening methods and result in a population-based strategy for identifying patients with poor functional status who need additional health system resources.
Acknowledgements:
Sponsor’s Role:
This work was supported by Duke AI Health (Center for Ethical and Equitable Data Science). Health data science at Duke is supported by the Center for Advancing Translational Sciences of the National Institutes of Health under Award Number UL1TR002553; (Pavon, Previll, Woo, Henao, Rogers, Olson, Casarett); Mary Solomon is a member of the AI Health Data Science Fellowship Program, which is supported in part by a gift from Microsoft; NIA P30-AG028716 (Fillenbaum, Hoenig); NIA 2P30-AG028716–16 (Pavon, Hoenig); 5K23-AG058788 (Pavon). The funding agency had no role in the design or conduct of the study; collection, analysis, or interpretation of the data; or preparation, review, or approval of the manuscript.
Funding Support and Meeting Abstract:
This work was supported by Duke AI Health (Center for Ethical and Equitable Data Science). Health data science at Duke is supported by the Center for Advancing Translational Sciences of the National Institutes of Health under Award Number UL1TR002553; Mary Solomon is a member of the AI Health Data Science Fellowship Program, which is supported in part by a gift from Microsoft; NIA P30-AG028716 and 2P30-AG028716-16; and 5K23-AG058788. This work was presented at the American Geriatrics Society annual meeting, Orlando, FL May 12–14, 2022
Footnotes
Conflict of Interest: The authors have no conflicts.
References
- 1.Lucas JW, Benson V. Tables of Summary Health Statistics for the U.S. Population: 2018 National Health Interview Survey. National Center for Health Statistics. 2019. Available from: https://www.cdc.gov/nchs/nhis/SHS/tables.htm. Accessed March 8, 2023. [Google Scholar]
- 2.Freedman VA, Spillman BC, Andreski PM, et al. Trends in late-life activity limitations in the United States: an update from five national surveys. Demography. 2013;50(2):661–671. [DOI] [PMC free article] [PubMed] [Google Scholar]
- 3.Okoro CA, Hollis ND, Cyrus AC, Griffin-Blake S. Prevalence of Disabilities and Health Care Access by Disability Status and Type Among Adults - United States, 2016. Morb Mortal Wkly Rep. 2018;67:882–887. [DOI] [PMC free article] [PubMed] [Google Scholar]
- 4.Brown RT, Diaz-Ramirez LG, Boscardin WJ, Lee SJ, Steinman MA. Functional Impairment and Decline in Middle Age: A Cohort Study. Ann Intern Med. 2017;167:761–768. [DOI] [PMC free article] [PubMed] [Google Scholar]
- 5.National Health Interview Survey, 2003–2007. Centers for Disease Control (online). https://www.cdc.gov/nchs/data/health_policy/ADL_IADL_tables.pdf. Accessed March 8, 2023. [Google Scholar]
- 6.Brown RT, Diaz-Ramirez LG, Boscardin WJ, Lee SJ, Williams BA, Steinman MA. Association of Functional Impairment in Middle Age With Hospitalization, Nursing Home Admission, and Death. JAMA Intern Med. 2019;179:668–675. [DOI] [PMC free article] [PubMed] [Google Scholar]
- 7.Greysen SR, Stijacic Cenzer I, Auerbach AD, Covinsky KE. Functional impairment and hospital readmission in Medicare seniors. JAMA Intern Med. 2015;175:559–565. [DOI] [PMC free article] [PubMed] [Google Scholar]
- 8.Ankuda CK, Levine DA, Langa KM, Ornstein KA, Kelley AS. Caregiving, Recovery, and Death After Incident ADL/IADL Disability Among Older Adults in the United States. J Appl Gerontol. 2020;39(4):393–397. [DOI] [PMC free article] [PubMed] [Google Scholar]
- 9.Fu S, Vassilaki M, Ibrahim OA, et al. Quality assessment of functional status documentation in EHRs across different healthcare institutions. Front Digit Health. 2022;4:958539 [DOI] [PMC free article] [PubMed] [Google Scholar]
- 10.Brown RT, Komaiko KD, Shi Y, et al. Bringing functional status into a big data world: Validation of national Veterans Affairs functional status data. PLoS One. 2017;12:e0178726. [DOI] [PMC free article] [PubMed] [Google Scholar]
- 11.Clegg A, Bates C, Young J, et al. Development and validation of an electronic frailty index using routine primary care electronic health record data. Age Ageing. 2016;45:353–360. [DOI] [PMC free article] [PubMed] [Google Scholar]
- 12.Pajewski NM, Lenoir K, Wells BJ, Williamson JD, Callahan KE. Frailty Screening Using the Electronic Health Record Within a Medicare Accountable Care Organization. J Gerontol A Biol Sci Med Sci. 2019;74:1771–1777. [DOI] [PMC free article] [PubMed] [Google Scholar]
- 13.Amra S, O’Horo JC, Singh TD, et al. Derivation and validation of the automated search algorithms to identify cognitive impairment and dementia in electronic health records. J Crit Care. 2017;37:202–205. [DOI] [PubMed] [Google Scholar]
- 14.Shao Y, Zeng QT, Chen KK, Shutes-David A, Thielke SM, Tsuang DW. Detection of probable dementia cases in undiagnosed patients using structured and unstructured electronic health records. BMC Med Inform Decis Mak. 2019;19:128. [DOI] [PMC free article] [PubMed] [Google Scholar]
- 15.Rajkomar A, Oren E, Chen K, et al. Scalable and accurate deep learning with electronic health records. NPJ Digit Med. 2018;1:18. [DOI] [PMC free article] [PubMed] [Google Scholar]
- 16.Shickel B, Tighe PJ, Bihorac A, Rashidi P. Deep EHR: A Survey of Recent Advances in Deep Learning Techniques for Electronic Health Record (EHR) Analysis. IEEE J Biomed Health Inform. 2018;22:1589–1604. [DOI] [PMC free article] [PubMed] [Google Scholar]
- 17.Fouladvand S, Mielke MM, Vassilaki M, Sauver JS, Petersen RC, Sohn S. Deep Learning Prediction of Mild Cognitive Impairment using Electronic Health Records. Proceedings (IEEE Int Conf Bioinformatics Biomed). 2019;2019:799–806. [DOI] [PMC free article] [PubMed] [Google Scholar]
- 18.Wang L, Laurentiev J, Yang J, et al. Development and Validation of a Deep Learning Model for Earlier Detection of Cognitive Decline From Clinical Notes in Electronic Health Records. JAMA Netw Open. 2021;4:e2135174. [DOI] [PMC free article] [PubMed] [Google Scholar]
- 19.Nori VS, Hane CA, Crown WH, et al. Machine learning models to predict onset of dementia: A label learning approach. Alzheimers Dement (N Y). 2019;5:918–925. [DOI] [PMC free article] [PubMed] [Google Scholar]
- 20.Goudarzvand S, St Sauver J, Mielke MM, et al. Analyzing Early Signals of Older Adult Cognitive Impairment in Electronic Health Records. 2018 IEEE International Conference on Bioinformatics and Biomedicine (BIBM). 2018:1636–1640. [Google Scholar]
- 21.Takahashi PY, Lee Y, Sohn S. Early temporal characteristics of elderly patient cognitive impairment in electronic health records. BMC Med Inform Decis Mak. 2019;19(Suppl 4):149. [DOI] [PMC free article] [PubMed] [Google Scholar]
- 22.Fillenbaum GG, Smyer M. The development, validity and reliability of the OARS Multidimensional Functional Assessment Questionnaire. J Gerontol. 1981;36:428–434. [DOI] [PubMed] [Google Scholar]
- 23.Fillenbaum GG. Multidimensional functional assessment of older adults: The Duke Older Americans Resources and Services Procedures. Erlbaum, Hillsdale, N.J., 1988 [Google Scholar]
- 24.World Health Organization. Geneva, Switzerland: WHO; 2002. Towards a common language for functioning, disability and health: ICF. [Google Scholar]
- 25.Singh A, Nadkarni G, Gottesman O, Ellis SB, Bottinger EP, Guttag JV. Incorporating temporal EHR data in predictive models for risk stratification of renal function deterioration. J Biomed Inform. 2015;53:220–228. [DOI] [PMC free article] [PubMed] [Google Scholar]
- 26.Chen T, Guestrin C. XGBoost: A Scalable Tree Boosting System. In Proceedings of the 22nd ACM SIGKDD International Conference on Knowledge Discovery and Data Mining. 2016;785–794. New York, NY, USA: ACM. [Google Scholar]
- 27.Lundberg S, SHAP Python package (2021), https://github.com/slundberg/shap. Accessed March 8, 2023. [Google Scholar]
- 28.Wassan JT, Zheng H, Wang H. Role of Deep Learning in Predicting Aging-Related Diseases: A Scoping Review. Cells. 2021;10:2924. [DOI] [PMC free article] [PubMed] [Google Scholar]
- 29.Choudhury A, Renjilian E, Asan O. Use of machine learning in geriatric clinical care for chronic diseases: a systematic literature review. JAMIA Open. 2020;3:459–471. [DOI] [PMC free article] [PubMed] [Google Scholar]
- 30.Sau A, Bhakta I. Predicting anxiety and depression in elderly patients using machine learning technology. Healthc. Technol. Lett. 2017;4: 238–243. [Google Scholar]
- 31.Chowdhury M, Cervantes EG, Chan WY, Seitz DP. Use of Machine Learning and Artificial Intelligence Methods in Geriatric Mental Health Research Involving Electronic Health Record or Administrative Claims Data: A Systematic Review. Frontiers in Psychiatry. 2021;12:738466. [DOI] [PMC free article] [PubMed] [Google Scholar]
- 32.Tarekegn A, Ricceri F, Costa G, Ferracin E, Giacobini M. Predictive Modeling for Frailty Conditions in Elderly People: Machine Learning Approaches. JMIR Med Inform. 2020;8:e16678. [DOI] [PMC free article] [PubMed] [Google Scholar]
- 33.Sajeev S, Champion S, Maeder A., et al. Machine learning models for identifying pre-frailty in community dwelling older adults. BMC Geriatr. 2022;22:794. [DOI] [PMC free article] [PubMed] [Google Scholar]
- 34.Kim DH, Newman AB, Lipsitz LA. Prediction of severe, persistent activity-of-daily-living disability in older adults. Am J Epidemiol. 2013;178:1085–1093. [DOI] [PMC free article] [PubMed] [Google Scholar]
- 35.Bell TM, Wang J, Nolly R et al. Predictors of functional limitation trajectories after injury in a nationally representative U.S. older adult population. Ann Epidemiol 2015;25:894–900. [DOI] [PubMed] [Google Scholar]
- 36.De Vries NM, Staal JB, van Ravensburg CD et al. Outcome instruments to measure frailty: a systematic review. Ageing Res Rev 2011;10:104–114. [DOI] [PubMed] [Google Scholar]
- 37.Searle D, Mitnitski A, Gahbauer EA et al. A standard procedure for creating a frailty index. BMC Geriatrics 2008;8:24. [DOI] [PMC free article] [PubMed] [Google Scholar]
- 38.Fried LP, Tangen CM, Walston J, et al. Cardiovascular Health Study Collaborative Research Group. Frailty in older adults: evidence for a phenotype. J Gerontol A Biol Sci Med Sci. 2001;56:M146–156. [DOI] [PubMed] [Google Scholar]
- 39.Katz S, Downs T, Cash H, Grotz RC. Progress in the development of an index of ADL. Gerontologist 1970;10:20–27. [DOI] [PubMed] [Google Scholar]
- 40.Lawton MP, Brody EM. Assessment of older people: self-maintaining and instrumental activities of daily living. Gerontologist 1969;9:179–186. [PubMed] [Google Scholar]
- 41.Arnau A, Espaulella J, Serrarols M, Canudas J, Formiga F, Ferrer M. Risk factors for functional decline in a population aged 75 years and older without total dependence: A one-year follow-up. Arch Gerontol Geriatr. 2016;65:239–247. [DOI] [PubMed] [Google Scholar]
- 42.Ryan A, Wallace E, O’Hara P, Smith SM. Multimorbidity and functional decline in community-dwelling adults: a systematic review. Health Qual Life Outcomes 2015;13:168. [DOI] [PMC free article] [PubMed] [Google Scholar]
- 43.Gill TM, Murphy TE, Gahbauer EA, Allore HG. Association of injurious falls with disability outcomes and nursing home admissions in community-living older persons. Am J Epidemiol. 2013;178:418–425. [DOI] [PMC free article] [PubMed] [Google Scholar]
- 44.King KE, Fillenbaum GG, Cohen HJ. A Cumulative Deficit Laboratory Test-based Frailty Index: Personal and Neighborhood Associations. J Am Geriatr Soc. 2017;65:1981–1987. [DOI] [PMC free article] [PubMed] [Google Scholar]
- 45.Uragami Y, Takikawa K, Kareki H, Kimura K, Yamamoto K, Iihara N. Effect of number of medications and use of potentially inappropriate medications on frailty among early-stage older outpatients. J Pharm Health Care Sci. 2021;7:15. [DOI] [PMC free article] [PubMed] [Google Scholar]
- 46.Hofer IS, Burns M, Kendale S, Wanderer JP. Realistically Integrating Machine Learning Into Clinical Practice: A Road Map of Opportunities, Challenges, and a Potential Future. Anesth Analg. 2020. May;130:1115–1118. [DOI] [PMC free article] [PubMed] [Google Scholar]
- 47.Skinner KM, Miller DR, Lincoln E, et al. Concordance between respondent self-reports and medical records for chronic conditions: experience from the Veterans Health Study. J Ambul Care Manage. 2005;28:102–110. [DOI] [PubMed] [Google Scholar]
- 48.Corser W, Sikorski IA, Olomu A, Stommel M, Proden C, Holmes-Rovner M. Concordance between comorbidity data from patient self-report interviews and medical record documentation. BMC Health Services Research 2008;8:85. [DOI] [PMC free article] [PubMed] [Google Scholar]
- 49.Fernández A, Garcia S, Herrera F, Chawla NV. SMOTE for learning from imbalanced data: progress and challenges, marking the 15-year anniversary. Journal of artificial intelligence research. 2018;61:863–905. [Google Scholar]
- 50.Gao Q, Wang D, Amason JD, et al. Gradient Importance Learning for Incomplete Observations in The Tenth International Conference on Learning Representations (2022). 10.48550/arXiv.2107.01983. [DOI] [Google Scholar]
Associated Data
This section collects any data citations, data availability statements, or supplementary materials included in this article.
Supplementary Materials
Supplemental Table 1. Electronic health record feature domains and input features used to train the supervised machine learning model to predict functional status clusters.
Supplemental Figure 1. Precision recall curves performance for XGBoost model. Legend: AUC=area under curve; PPV = positive predictive value; Cluster 0 = severe functional impairment, Cluster 1=mild to moderate functional impairment, Cluster 2=normal function