

Abstract
Chronic gastric symptoms are common, however differentiating specific contributing mechanisms in individual patients remains challenging. Abnormal gastric motility is present in a significant subgroup, but reliable methods for assessing gastric motor function in clinical practice are lacking. Body surface gastric mapping (BSGM) is a new diagnostic aid, employing multi-electrode arrays to measure and map gastric myoelectrical activity non-invasively in high-resolution. Clinical adoption of BSGM is currently expanding following studies demonstrating the ability to achieve specific patient subgrouping, and subsequent regulatory clearances. An international working group was formed in order to standardize clinical BSGM methods, encompassing a technical group developing BSGM methods and a clinical advisory group. The working group performed a technical literature review and synthesis focusing on the rationale, principles, methods, and clinical applications of BSGM, with secondary review by the clinical group. The principles and validation of BSGM were evaluated, including key advances achieved over legacy electrogastrography (EGG). Methods for BSGM were reviewed, including device design considerations, patient preparation, test conduct, and data processing steps. Recent advances in BSGM test metrics and reference intervals are discussed, including four novel metrics, being the ‘principal gastric frequency’, BMI-adjusted amplitude, Gastric Alimetry Rhythm Index™, and fed:fasted amplitude ratio. An additional essential element of BSGM has been the introduction of validated digital tools for standardized symptom profiling, performed simultaneously during testing. Specific phenotypes identifiable by BSGM and the associated symptom profiles were codified with reference to pathophysiology. Finally, knowledge gaps and priority areas for future BSGM research were also identified by the working group.
Graphical Abstract
This is a technical literature review and synthesis focusing on the rationale, principles, methods and clinical applications of body surface gastric mapping.
Introduction
Chronic gastric symptoms affect up to 10% of the population and pose a vast health and socioeconomic burden.1,2 However, defining and diagnosing these disorders has been a longstanding challenge. Although clinically recognized under categories such as gastroparesis, chronic nausea and vomiting syndrome, and functional dyspepsia, the lines between these disorders are blurred, due to overlapping symptom profiles and pathophysiologies, and a lack of diagnostic specificity.3,4 Gastric emptying is the only widely used test of gastric function, but its reproducibility and utility are controversial.3 Other modalities such as barostat, manometry, magnetic resonance imaging, and pyloric EndoFLIP® still occupy relatively niche applications or are predominantly used in research contexts.5 New tests of gastric motor function that can guide routine care, are needed.
Electrogastrography (EGG) is now in its centennial year and has accrued a vast base of clinical studies, but has not achieved widespread use, primarily owing to persisting questions regarding test reliability, sensitivity to noise, and clinical utility.6–8 However, a new generation of EGG devices have recently emerged, underpinned by high-resolution (HR) electrode arrays, modern bioelectronics, automated artifact rejection, and novel analytical strategies.8–13 This approach has been called HR-EGG,14,15 although the alternative term ‘Body Surface Gastric Mapping’ (BSGM) is now preferred as it encompasses a broader array of outputs including spatial wave profiling that move this test beyond the classical scope of EGG.9
Beyond hardware advances, BSGM technologies have also optimized and extended data processing pipelines to maximally extract and separate the weak underlying gastric signals from noise, thereby representing a critical advance over legacy EGG systems.9,16 Recent studies have yielded new insights into gastric physiology, disease phenotypes, mechanisms, and symptoms,10,15,16 and a first BSGM device has now achieved regulatory clearance in the United States and United Kingdom (Gastric Alimetry®, Alimetry, New Zealand). This system employs a scalable flexible electronics array for rapid setup and an automated reporting pipeline, enabling large-scale clinical evaluations.9,16
In order to advance and standardize the clinical use of BSGM, it is timely to undertake a comprehensive technical review and consensus-based standardization of BSGM principles, methodological considerations, and current and emerging test metrics and outputs. The review also summarizes recent progress made in BSGM methods and applications and identifies priority areas for future research on technical aspects of BSGM.
Methods
A Body Surface Gastric Mapping Working Group was established comprising international research-active users of BSGM. The Working Group consisted of a Technical Group, including bioengineers and clinical scientists developing methodologies, and a Clinical Group who functioned as reviewers and advisors to clinical applications, with both adult and pediatric motility specialists. Each site was asked to nominate a representative lead and collaborators. A comprehensive literature search was performed using Ovid Medline and Embase databases from inception August 2022. The terms ‘body surface gastric mapping’ OR ‘gastric mapping’ OR ‘BSGM’ OR ‘high-resolution electrogastrography’ OR ‘HR-EGG’ were combined, and clinical and translational studies were retrieved. A manual search of the reference lists was also performed. Based on the search results, a working document was developed by the Technical Group, intended to aid in the standardization of clinical methodologies for BSGM. This document was then circulated to the members of the Clinical Group via the leads for review, comment, and refinement. Expert consensus was used to formalize and standardize clinical BSGM practices. The leads were also asked to list key research priorities in the field of BSGM arising from the review process. The focus of the current work was limited to principles, methodologies, and applications, with care pathway implementation and therapeutic implications intended for subsequent work.
Technical Principles
What does BSGM measure?
BSGM (as for EGG) measures the cutaneous dispersion of gastric myoelectrical potentials, arising from extracellular ion current flows during depolarization and repolarization of gastric tissues.17 This encompasses both gastric slow wave activity, generated and propagated by interstitial cells of Cajal (ICC), and coupled smooth muscle contractions.18,19 The measured activity reflects only corpus and antrum activity, because slow waves to do not propagate in the relatively depolarized human gastric fundus.18,20 The underlying sources are complex, because multiple waves (typically 3–4) simultaneously propagate through the human stomach, traveling at a slow velocity of ~3 mm s−1 prior to the terminal antral acceleration.21,22 This means that gastric potentials recorded at the body surface cannot be definitively related to a single specific wave sequence, as in electrocardiography, but instead must be considered as a summation of such sources.17,23
The classical EGG morphology nevertheless shows a distinct 3 cycle per minute (cpm) waveform,24 because when gastric slow waves are entrained to a single frequency, that dominant frequency is adequately captured in the body-surface potential (Figure 1A).14,17,25 However, the amplitude of the resultant body-surface potential falls exponentially as a function of distance from source,14,26 and is affected by the conductivity profile of the abdominal tissue layers.27 This means that waves traveling through the gastric antrum are considered to contribute most to the potentials detected at the adjacent epigastrium as compared to waves traveling deeper in the corpus, with classical EGG methodologies therefore targeting the antrum to optimize signal to noise ratio (SNR).19,28 However, biophysically-based modeling studies employing large datasets have indicated that sources propagating throughout the stomach can theoretically be adequately captured with a sufficiently large array.29
Figure 1.

Specific human gastric slow wave patterns can be correlated with body surface signatures on BSGM. Top row: Normal gastric conduction yields highly stable and regular activation profiles, propagating from the proximal to distal stomach, centered on a frequency of 3 cpm (reference interval: 2.65 – 3.35),18 which yields a regular sinusoidal body surface signal of the same frequency. A typical BSGM profile is shown (top right) with an amplitude that increases after the meal, before returning towards baseline as the meal response wanes. Middle row: Retrograde propagation may arise from distal gastric pacemakers at a regular rate and normal frequency, with a reversed activation profile detectable by phase mapping of body surface signals recorded over the epigastrium.18 Bottom row: disorganized gastric activity may arise due to dysrhythmias and/or neuromuscular disorders, leading to chaotic gastric activity in electrograms, detectable as disordered spatial propagation and spectral instability at the body surface.34,35,48,72
Several studies have achieved recordings from both the stomach and body surface simultaneously, with the aim of resolving and validating the sources of EGG (e.g. 19,30–32). These studies have shown definitive frequency correlations, and also indicate that the increase in signal amplitude that typically occurs after a meal or other stimulus is partially attributable to the onset of gastric contractions.19,24 Shifts in gastric position relative to electrodes or gastric expansion have also been shown to contribute to postprandial changes in signal amplitude,32 however, positional influences relative to electrodes are minimized in BSGM by sampling from a large recording field. An important limitation of these previous studies has been their low resolution, which meant that sparse data had to be extrapolated over the whole stomach and torso. The first study of simultaneous HR serosal mapping and BSGM was therefore recently conducted on anesthetized pigs, which showed excellent correlations of both frequency and slow wave direction (antegrade vs retrograde wave propagation), thereby extending validation of BSGM metrics into spatial wave profiling (Figure 1B).33 In human patients with nausea and vomiting disorders, invasive (serosal) HR mapping studies have shown that gastric dysrhythmias can be spatially complex, involving competing or colliding wavefronts, ectopic sources, and conduction blocks occurring over wide areas of the stomach.34,35 In BSGM, such events are expected to summate to generate spectral and spatial instabilities (Figure 1C).
In summary, it can be seen that the essential biophysical principles of BSGM are broadly understood and validated. However, some knowledge gaps and misconceptions remain relevant, particularly concerning states of human gastric dysrhythmia, which are discussed below (‘Clinical Methods’.)
EGG to BSGM: technical limitations and solutions
After Alvarez first introduced EGG in 1922, he stated a ‘little prophecy’ that gastrointestinal clinicians would come to rely upon electrophysiology ‘just as the heart specialist [does]’.36 Many investigators have productively pursued this goal, particularly during the late 20th century, culminating in hundreds of studies showing significant EGG differences between patients and controls, most prominently in nausea and vomiting disorders / gastroparesis, functional dyspepsia, reflux, and several pediatric disorders.37–40 Promising syntheses on clinical applications were also developed,41–43 however, the test ultimately did not translate well beyond controlled research settings into routine clinical practice and is now typically viewed as a research tool by clinical guideline authors.6,7,41 Several critiques have profiled the specific limitations of EGG (e.g. 6,7,44), which are summarized in Table 1.
Table 1:
Traditional EGG - Limitations, Problems and Solutions
| EGG Limitation | Problem | BSGM Solutions |
|---|---|---|
| Low signal to noise ratio and contamination by non-gastric signals | Signal diminution from stomach serosa to skin surface, variable impedance at the skin-electrode interface, and weak signal strength exacerbate noise contamination11 | • Multiple electrodes enables combination of weak signals from several electrodes • Automated artifact detection and rejection algorithms98 • Standardized preparation steps including shaving, thorough skin preparation with NuPrep®, and mandatory impedance check prior to data capture • Use of Ag/AgCl electrodes with hydro-gel conductive layers on a cableless flexible patch to optimize charge transfer. |
| Signal loss due to gastric anatomical biovariability or requirement for prior gastric imaging | Gastric biovariability means electrodes frequently missed the stomach, with hyperbolic signal decay from source location9 | • Large 8 × 8 electrode grid with 11 mm diameter, 20 mm center-to-center electrode spacing on a 21 × 16 cm array9 • Array placement algorithm to optimize electrode positioning overlying the stomach based on individual subject anthropometrics49 |
| Signal amplitude affected by BMI | BMI confounds traditional amplitude and stability EGG metrics16,99 | • BMI adjustment of amplitude and stability metrics99 |
| Frequency and stability conflation | Frequency and stability were conflated in instability coefficient metrics such that % normal / bradygastric frequency metrics that did not measure the gastric frequency independently of rhythm stability.99 | • Separate and independent frequency and rhythm stability metrics, i.e. Principal Gastric Frequency which measures sustained frequency associated with gastric activity and Gastric Alimetry Rhythm Index (GA-RI) which independently assesses spectral stability with no correlation to the Principal Gastric Frequency6,32,100 |
| Lack of spatial analysis | Inability to describe propagation patterns or spatial slow wave dynamics.9,15 | • Introduction of spatial stability metrics, polar histograms of slow wave direction, and phase maps for spatiotemporal gastric profiling11 |
| High susceptibility to artifacts | EGG signals are susceptible to biological and extrinsic noise.11 | • Validated artifact detection and rejection techniques101 |
| Excessive filtering | Loss of physiological data through filtering11,46,95 | • Refined filtering and artifact rejection algorithms validated against induced noise sources 18,99 |
| Conflation of rhythm instability, true isolated tachygastria, and noise | EGG frequently reported tachygastrias >5 cpm which is a frequency range not found in invasive in-vivo gastric recordings16,99 | • Separation of frequency and stability metrics through the Principal Gastric Frequency and GA-RI21,22 • Limitation of spectral analysis to human gastric frequency ranges determined from invasive HR serosal mapping and pacing studies15 |
| Poor correlation with symptoms | EGG metrics were unable to distinguish patient groups or reliably correlate with symptoms47 | • Validation symptom logging App enabling more accurate correlations.15 • New metrics show promising symptom correlations in patients with functional dyspepsia,48,53 gastroparesis, chronic nausea and vomiting syndromes42 |
| Lack of reference intervals | Numerous reference ranges proposed, but lacking validation in large datasets, consensus or agreement16 | • Reference intervals for standardized spectral metrics validated in a large cohort of healthy volunteers with further cross-validation corroborating external validity37–40 |
| Inconsistent methodologies and clinical applications | Highly heterogeneous test protocols, electrode designs, electrode placement, fasting protocols, meals, durations of recording.99 | • Standardized test protocol, including a specified meal, test duration, and electrode placement algorithm |
| Test duration | Typical EGG tests were <90 minutes, including 45 minutes of postprandial recording. This risked underestimated power ratios, and incomplete recognition of gastric abnormalities9 | • A standardized BSGM test protocol currently encompasses 4 h postprandial recordings to capture the entire gastric cycle, allowing assessment of meal response dynamics in the majority99 • Metrics tuned to 4-hr postprandial test duration aiding improved accuracy.99 |
| Limited diagnostic utility | Judged to have low clinical utility.10,15,48 | • Identification of specific patient phenotypes and symptom patterns used to guide clinical care at the individual patient level.16 |
Key to the development of BSGM has been a series of steps to identify, isolate, and overcome each of these limitations in turn. These steps are also overviewed in Table 1. It can therefore be appreciated that there is no single ‘breakthrough’ to BSGM, but rather that synergistic progress has been achieved through a cumulative sequence of innovations focusing on enhancing signal quality, developing novel metrics, and advancing clinical utility.8,9,15 Gastric signals are weak, being two orders of magnitude lower in amplitude than electrocardiography potentials, such that dedicated attention to optimizing signal to noise ratio (SNR) is essential when designing and implementing systems for clinical use. A selection of features that have contributed most to SNR optimization in BSGM systems are briefly overviewed below.
A HR electrode array is fundamental for several reasons. Gastric position is variable,15,29 and a large measurement field means that a core set of electrodes can be expected to overlie the stomach’s location,9 obviating the impractical requirement for image-guided placement of electrodes using ultrasound or computed tomography.15,43 For example, the Gastric Alimetry System employs an 8×8 grid of electrodes at 2 cm inter-electrode separation (area ~225 cm2) on a flexible substrate (Figure 2A,B). However, even this scale was deemed insufficient for reliably capturing gastric anatomical variability during the design of this device.9 An additional step of personalized array positioning was therefore implemented in an app that guides users through subject-specific anatomical measurements and placement, thereby capturing the gastric position centrally in the vast majority of subjects (Figure 2C).9 An algorithm then automatically selects multiple electrodes that demonstrate the highest SNR from within this grid, and combines them to extract maximal signal quality from the weak underlying field.9
Figure 2.
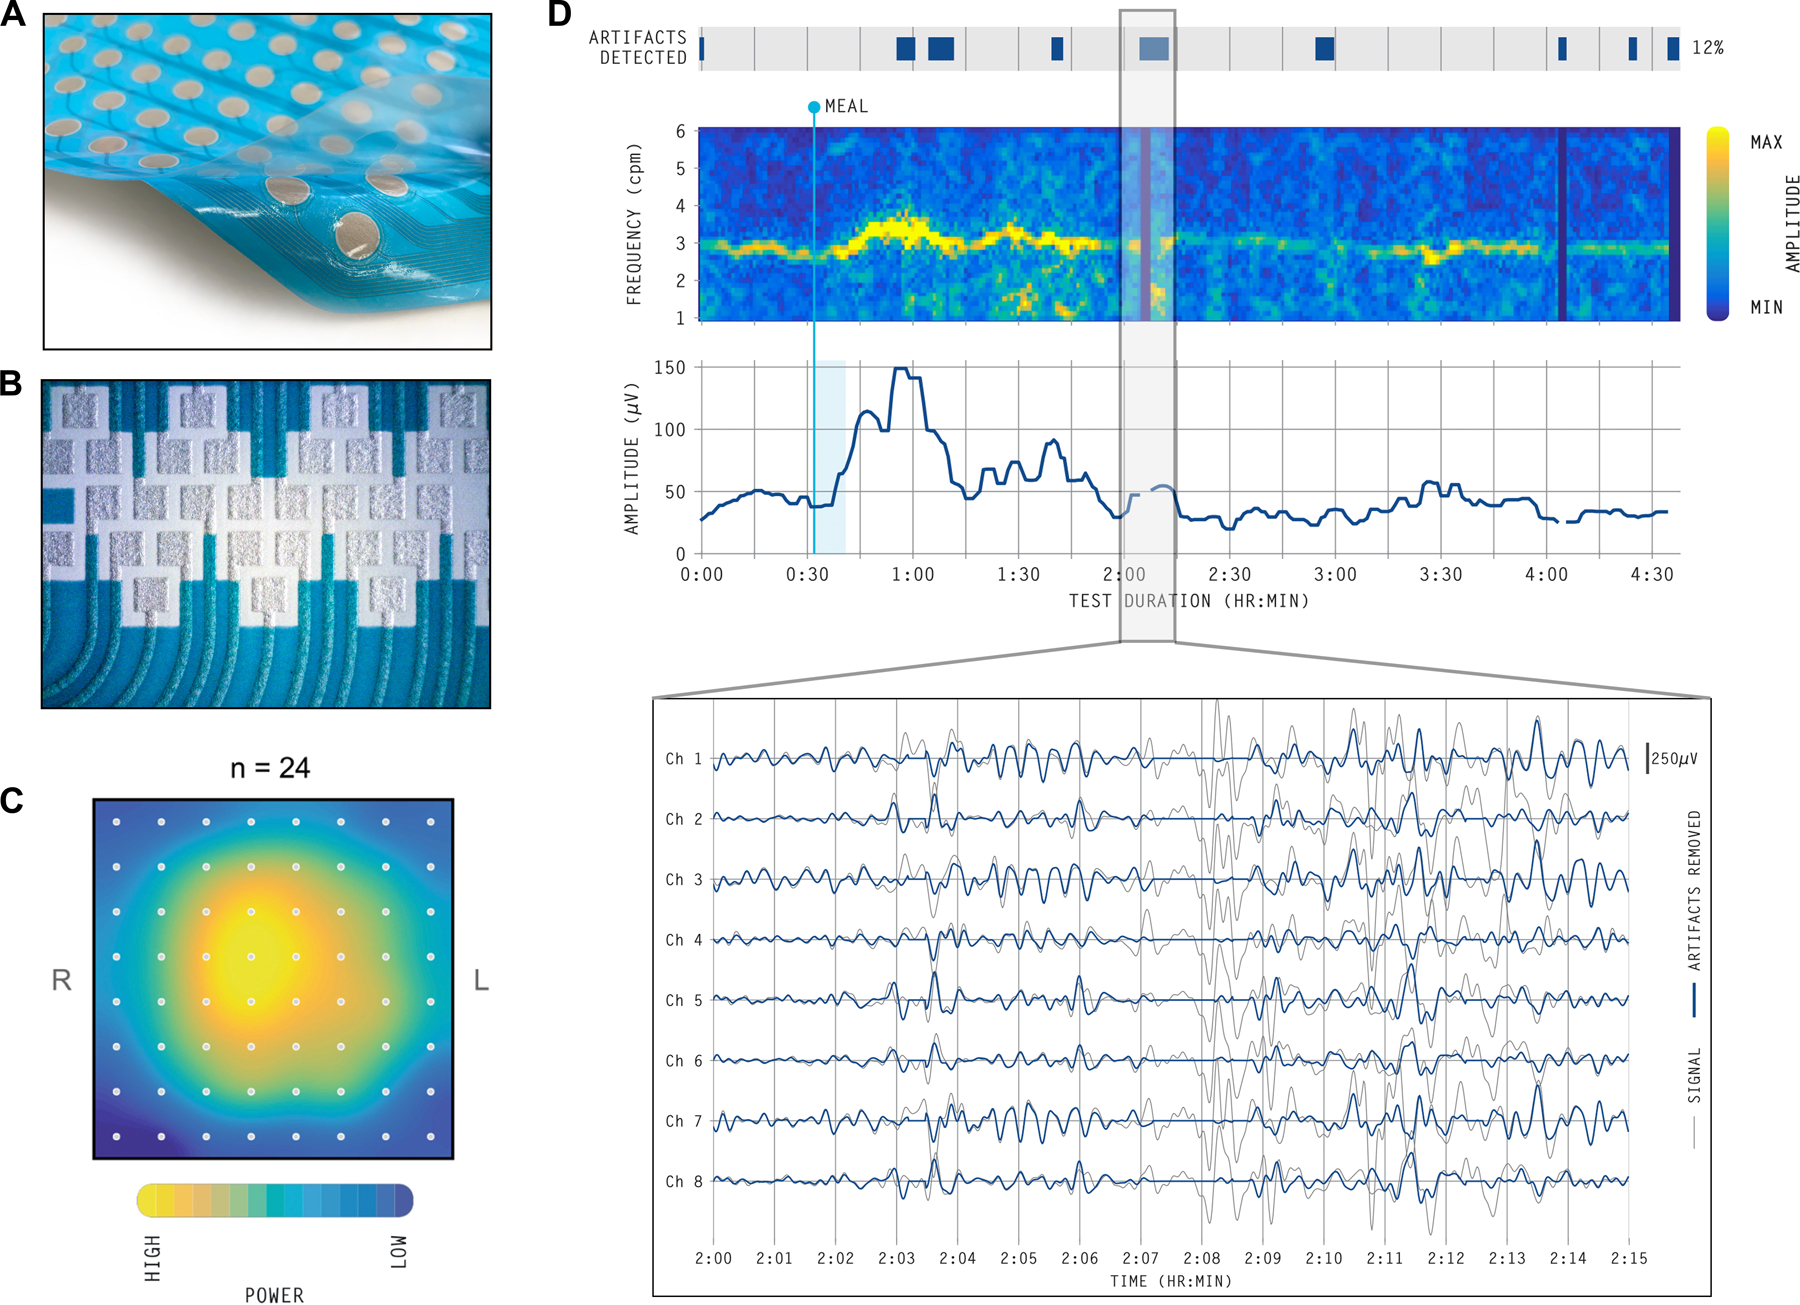
Example technical developments of the commercially-available Gastric Alimetry BSGM system. A) A peel and stick HR array with an 8×8 grid of electrodes at 2 cm inter-electrode separation (area ~225 cm2). The Array has conductive hydrogel pre-applied to the electrodes to optimize conduction and minimize impedance. B) Customized conformable electronics eliminate cables and wires using printed circuits. C) Spatial heat map of healthy volunteer participants demonstrating the estimated signal power in the gastric range over the recording duration (n = 24) lying centrally within the mapped field when using the methods in C).9 D) Automated algorithms detect and reject artifacts to yield the highest SNR (grey lines show raw signal data; blue lines show signals with artifacts corrected).16 When noise-contaminated signal is unrecoverable, these areas are not shown in the spectral plots.
Further essential developments have addressed artifact contamination, which was a common pitfall in clinical EGG interpretation.45 Robust signal quality begins with minimal impedance at the skin-electrode interface, electrode material considerations to optimize charge transfer, and the use of conductive hydrogels.45 The design of electronic components, connectors, circuitry, and firmware must then also all be tailored to avoid signal loss, minimize noise, and maximize gastric data capture. This is achieved in the Gastric Alimetry System with conformable electronics, wearable hardware, and elimination of all cables and wires, while also improving usability through a platform that is simple to set up and apply. Another important advance has been the development of robust post-processing algorithms to clean and filter the captured data to isolate gastric signal components, and to reliably detect and reject artifacts automatically, with a BSGM clinical algorithm showing ≥95% sensitivity and specificity against manual artifact marking by experts (Figure 2D).11,46
A collection of innovations encompassing all aspects of BSGM design have been successful in elevating signal quality beyond the limitations of traditional EGG. However, these technical improvements alone are insufficient; advances in test methods, metric development, data visualization and disease phenotyping are equally important to achieving clinical utility.
Standardized Test Methods
In order to define reference intervals, clarify disease phenotypes and progress clinical use, it has been necessary to develop standardized clinical methods for performing BSGM tests. A lack of standardized methodologies was one limitation of EGG,37–40 and complicated comparisons between studies.42 A basis for the standardization of BSGM has now been realized through a series of recent studies (summarized in Figure 3),9,16,47,48 although several opportunities remain to further refine this protocol. Comparison methods for legacy EGG have been reviewed elsewhere.24,49
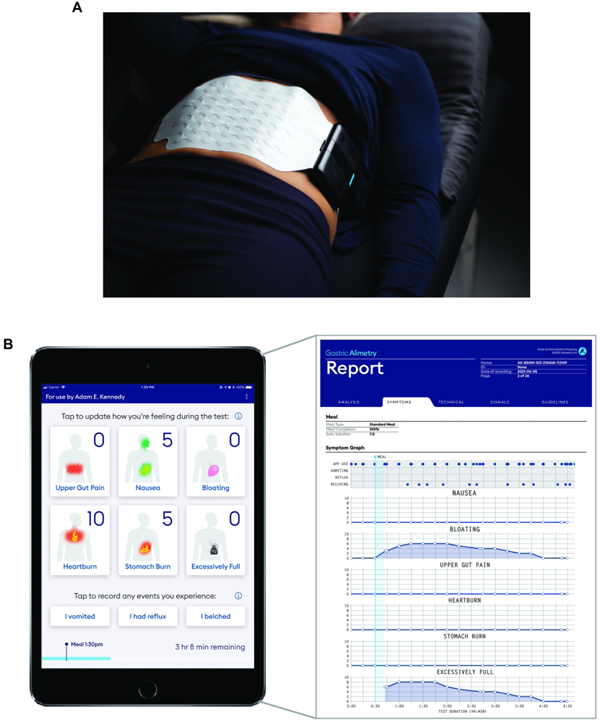
Figure 3.
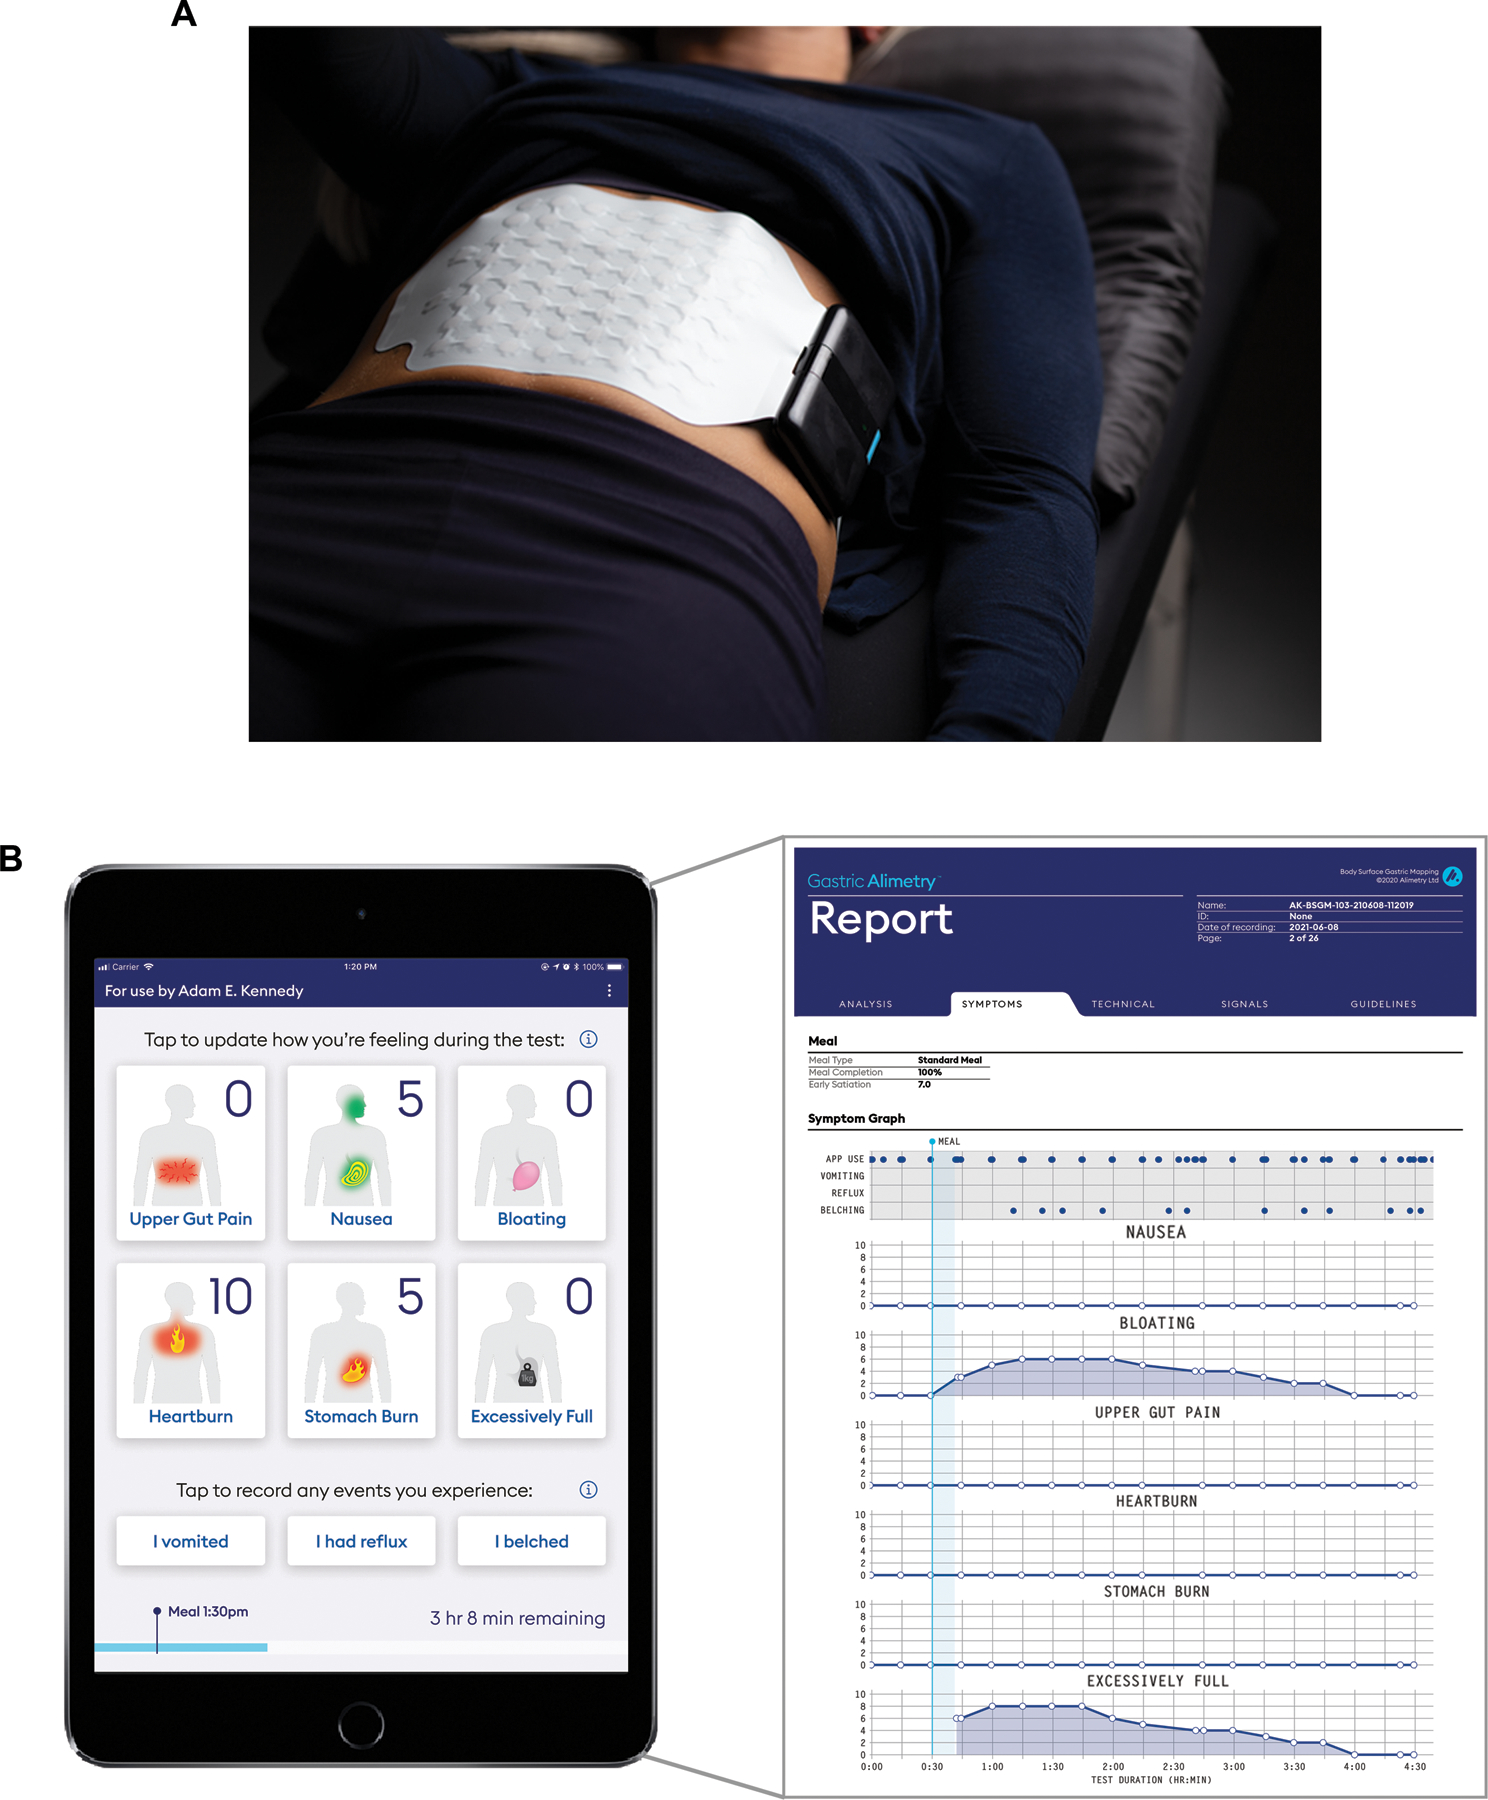
A) A photograph is shown of the wearable Reader and Array setup in the Gastric Alimetry system. B) Screenshots of the iOS Symptom-Logging App dashboard display and an example symptom report of a participant with functional dyspepsia.
Test protocol applied in the Gastric Alimetry System
Similar to gastric emptying testing,50 the standard Gastric Alimetry test protocol requires participants to fast for >6 hrs, and avoid medications modifying gastric function as well as caffeine and nicotine on the day of testing. Tests are usually conducted in the morning. Array placement should be preceded by shaving if necessary, followed by skin preparation with an exfoliant conductive gel such as NuPrep® (Weaver & Co, CO, USA) to minimize impedance. The Gastric Alimetry App mandates an impedance threshold check prior to allowing recording.9 Fasted recordings are then performed for 30 minutes, followed by standardized meal consumed over 10 minutes, and a 4-hr postprandial recording. A 4-hr postprandial recording period is currently advisable to capture a full gastric activity cycle, and because meal responses may be delayed with peak BSGM responses sometimes occurring 2–4 hrs after a meal.9,13,16 The extended postprandial recording also enables validated postprandial symptom profiling.47,51,52 It is possible that this test duration can be abbreviated for specific clinical applications in future, but this requires further evaluation.
Reference intervals for Gastric Alimetry have been developed using a standardized test meal consisting of an off-the-shelf nutrient drink (e.g., Ensure 232 kcal, 250 mL; Abbott Nutrition, IL, USA) and oatmeal energy bar (e.g., a Clif Bar with 250 kcal, 5 g fat, 45 g carbohydrate, 10 g protein, 7 g fiber; Clif Bar & Company, CA, USA). Meals with similar nutritional composition can be substituted per availability or for patients with specific dietary needs, such as those with diabetes or gluten intolerance without substantially affecting test data.53 It is necessary to monitor and manage blood sugars in diabetics during testing as hyperglycemia can induce gastric myoelectrical abnormalities.54 The above meal size is designed to stimulate gastric symptoms in patients with diverse gastric disorders, including milder degrees of functional dyspepsia,51 and although some patients will find this meal too large, eating 50% has been reported to adequately profile patients with neuromuscular disorders and centrally-mediated symptoms in a recent study.48 Defining differences in meal responses for alternative meal compositions and sizes is an important area for future research.
Ensuring Recording Quality
The standardized BSGM test protocol includes several critical steps to optimize recording quality. As with EGG, these include limiting movement, talking, sleeping (which suppresses gastric activity)55, and avoiding touching the electrode array to reduce artifact contamination, other than overlying clothes or blankets.24,41 It is mandatory that participants are positioned in a comfortable zero-gravity chair, reclined at 45–60° with their legs elevated, to avoid abdominal wall contractions.49 It is also necessary that the selected chair can be locked in a set reclined position, otherwise restless abdominal tensing will contaminate data with electromyographic noise. During the test, patients may mobilize for comfort or bathroom breaks, with an accelerometer being used to track periods of excessive motion.11
Symptoms
Robust symptom profiling concurrent to BSGM testing is essential to clinical utility, because temporal associations between physiological events and symptoms inform mechanistic interpretations.56 A patient symptom-logging app (Figure 3B) was therefore developed to differentiate symptoms with severity lying on a continuum (nausea, bloating, upper gut pain, heartburn, stomach burn, and excessive fullness) from those that are discrete events (vomiting, reflux and belching).47 Continuous symptoms are assessed during the test at suitably granular 15 minute intervals51 via a pictographic interface that aids accurate standardized reporting,57 and using 0–10 visual analog scales where 0 indicates ‘no symptom’ and 10 indicates the ‘worst imaginable extent’ of a symptom.58 Early satiation is recorded after the meal. This App has been validated to demonstrate robust convergent, concurrent, face, and content validity.47 The symptoms selected for logging cover the diverse symptomatology experienced in chronic gastroduodenal disorders.59,60 This includes the dominant symptoms for functional dyspepsia, gastro-esophageal reflux disease, and chronic nausea and vomiting syndromes (including gastroparesis).60,60
Patient symptom inputs are used to generate a standardized report covering the course of the test meal (Figure 3B), with these data correlating well with patients’ overall symptom burden and quality of life.47 These validated symptom reports offer an important clinical aid in combination with BSGM physiological data, as discussed further below (‘BSGM Phenotypes’).
Spectral Metrics and their Reference Intervals
BSGM analytics generate two categories of metrics: i) spectral metrics which encompass frequency, amplitude, rhythm stability, and meal responses; and ii) spatial metrics which describe spatiotemporal dynamics of slow waves projected to the body surface. An overview of how these metrics are derived is provided in Figure 4. Spectral metrics are derived from the spectrogram, akin to an HR-EGG, generated from those channels with the highest SNR on the array. Spatial metrics reflect summated depolarizations across the array which can resolve the predominant direction of wave propagation,9,10,15,33 and the stability of slow wave patterns.48,53 Spectral metrics have achieved regulatory clearances and have demonstrated clinical utility in establishing specific phenotypes of gastric dysfunction (e.g. 48,53). Spatial metrics have demonstrated promising clinical utility but currently remain a research tool because regulatory clearances are still pending.10,15,48,53
Figure 4.
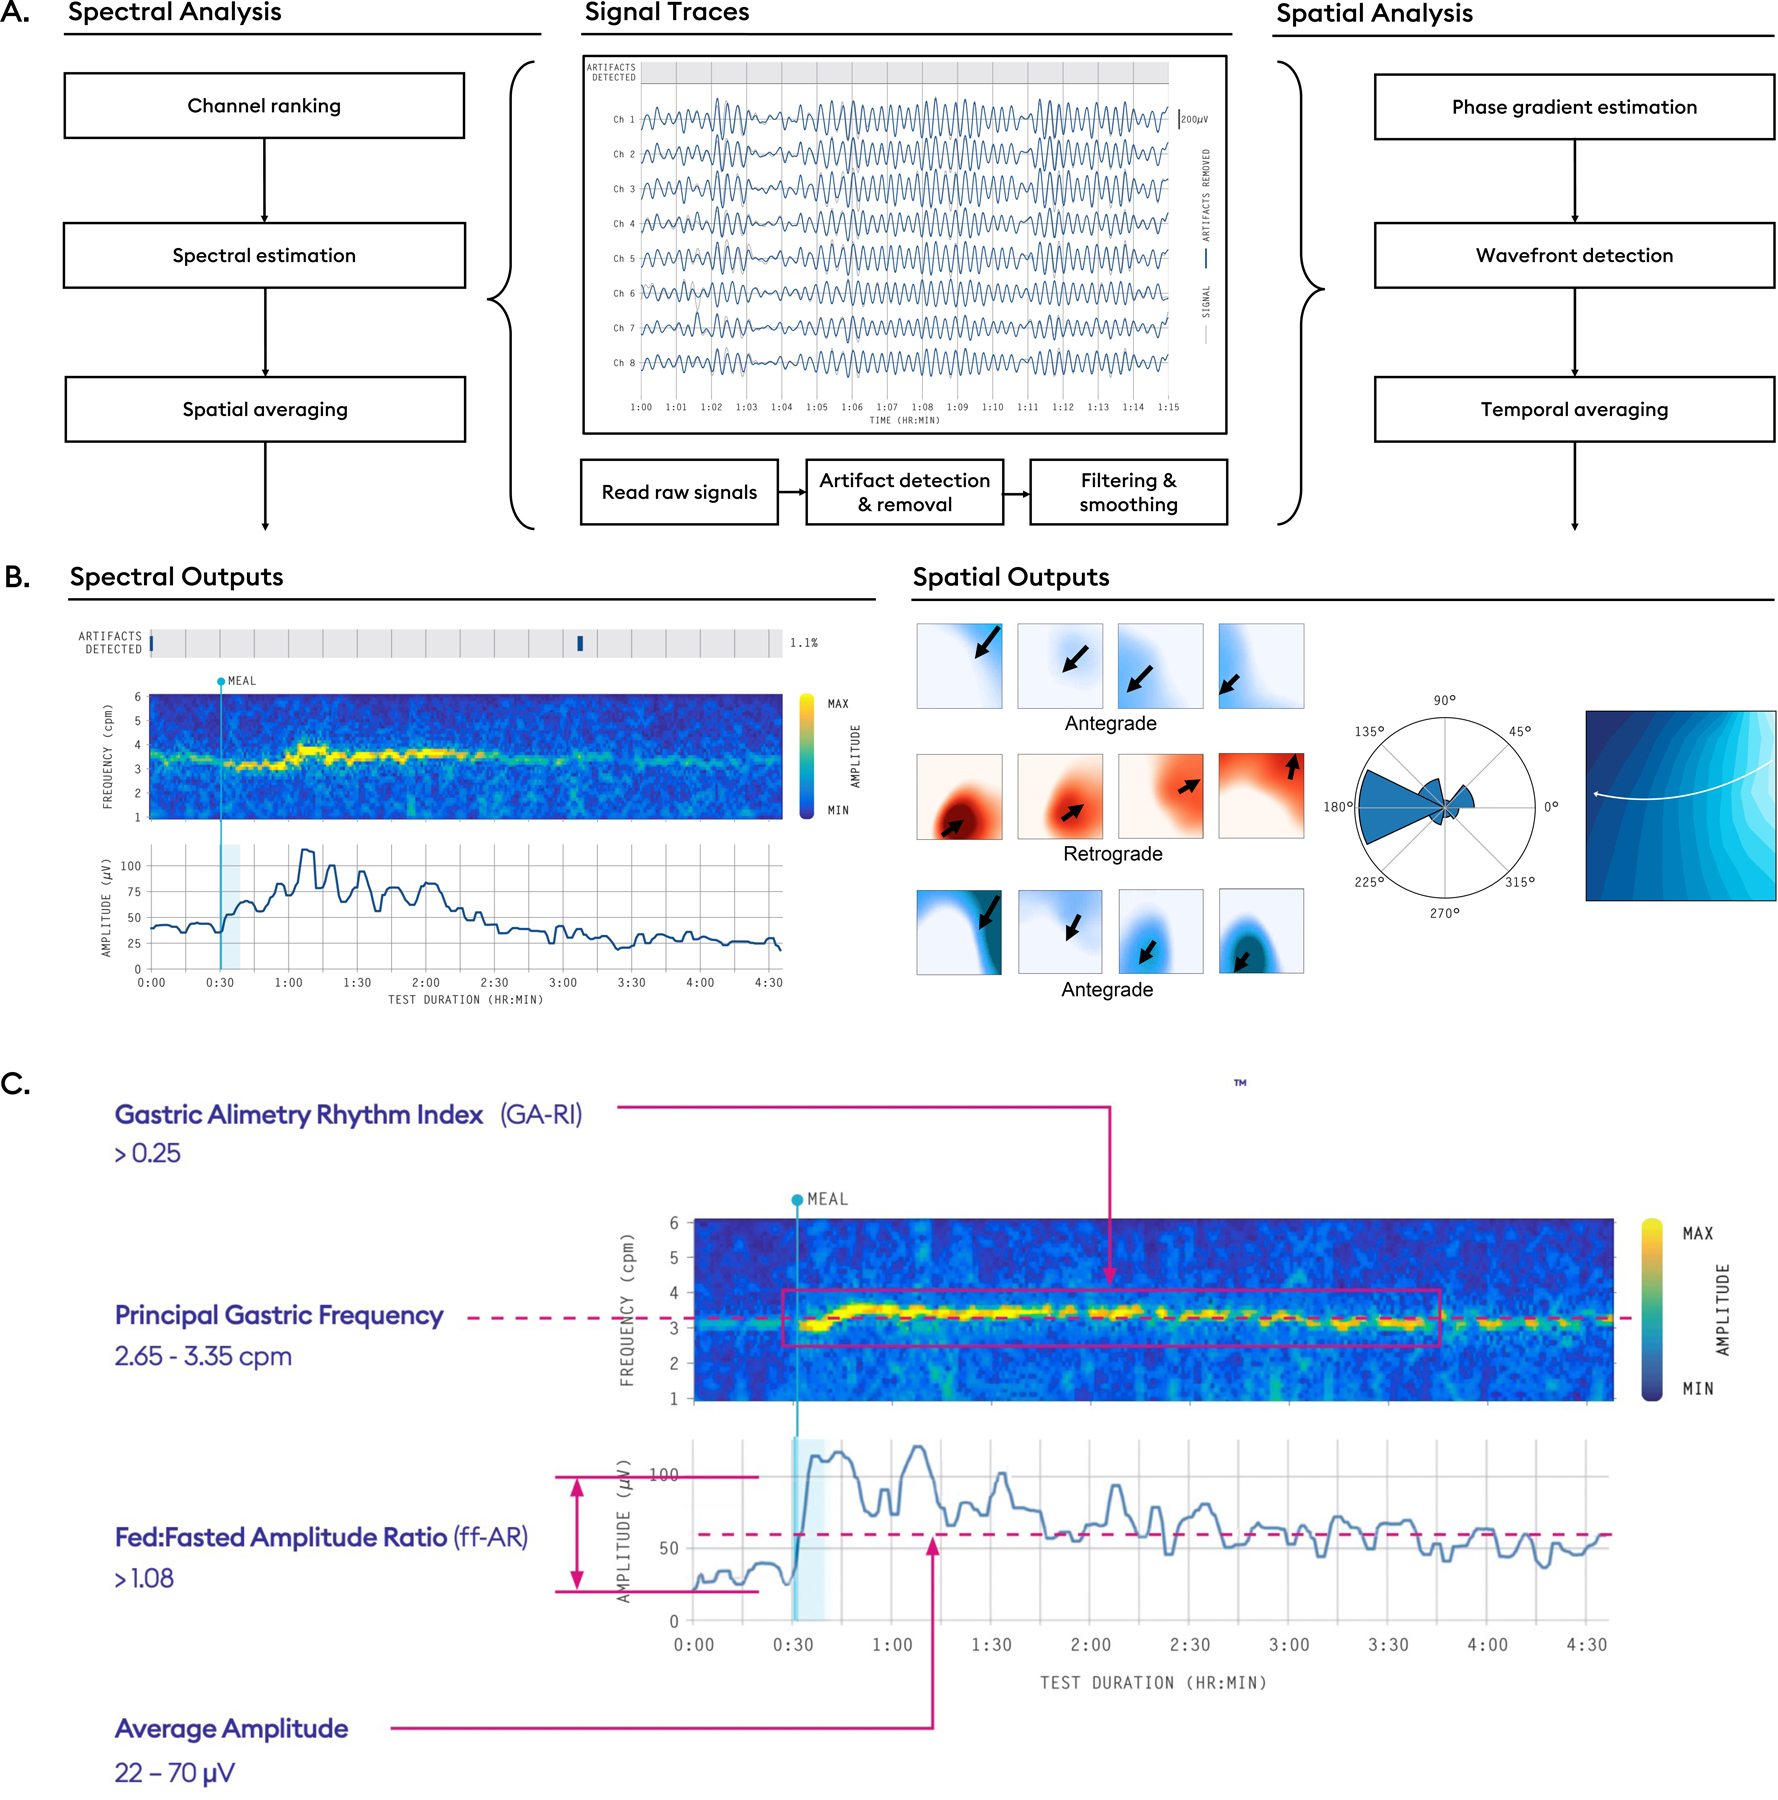
A) Analysis pipelines from raw signal traces to spectrograms and spatial outputs. Raw signals are processed by automated algorithms that detect and reject artifacts, followed by a filtering and smoothing step. B) Thereafter, a selection of top channels are used to generate spectral outputs, whereas the entire array is used to generate spatial outputs. Spectral outputs include frequency-time spectrograms and amplitude-time curves, while spatial outputs include phase maps from which propagation direction and summative polar histograms can be computed. C) Summary diagram of reference intervals for BSGM as generated from a large database of healthy adults of diverse demographics (n=110).48
Spectral metrics
Customized BSGM spectral metrics have recently been introduced with reference intervals.13,16,53 The four metrics are summarized below in Figure 4C, with comparison metrics used in legacy EGG reviewed elsewhere.13,24
Principal Gastric Frequency
BMI-Adjusted Amplitude
Gastric Alimetry Rhythm Index™ (GA-RI)
Fed:Fasted Amplitude Ratio (ff-AR)
These metrics present a considerable revision from comparable classical EGG metrics to resolve important pitfalls (Table 1), optimize performance, and ensure each metric measures a distinct physiological aspect of gastric function.13 Key considerations in the development of these metrics are summarized as follows:
Frequency measurements are susceptible to contamination by high-amplitude low-frequency transients arising from motion artifacts and by periodic adjacent colonic activity,13 which critically impair accuracy in ~5% of cases (refer 13 for further detail). The Principal Gastric Frequency metric was therefore introduced to overcome this pitfall by measuring only the sustained frequency within the plausible gastric range,18 while excluding other transients and irregularities irrespective of their influence on the power spectrum.13
Amplitude measurements are confounded by BMI due to signal attenuation through abdominal adipose.49 A BMI-adjusted amplitude metric was therefore developed using a multiplicative regression model, enabling comparison of amplitudes across populations up to a current test threshold of BMI 35.13
Legacy EGG metrics for assessing the stability of gastric rhythm included ‘percentage bradygastria’ and ‘percentage tachygastria’, which conflated frequency with rhythm stability, and the ‘instability coefficient’, which was incorrectly motivated due to its dependence on frequency.13 A new metric of stability was therefore developed in the Gastric Alimetry Systemm, GA-RI, which is a measure of concentrated gastric activity within a narrow gastric frequency band over time relative to the residual spectrum (further explained in Schamberg et al)13. The GA-RI is scaled between 0 (no rhythm stability) and 1 (maximum rhythm stability), and is independent of frequency.13
The gastric meal response, as measured by postprandial amplitude curves, demonstrates considerable temporal variability. A study of 110 control subjects showed that the median time of peak amplitude was 1.6 h (IQR 0.7 – 2.7 h) after meal completion.9,16 EGG power-ratio calculations were typically based on shorter intervals, such as the initial 45-minute postprandial period, potentially underestimating the gastric meal response. The revised ff-AR metric measures the gastric response based on the maximum amplitude in any single 1-hour period of a 4-hour postprandial window and is therefore adaptive to variable meal response profiles.
Reference Intervals and their interpretation
Reference intervals for the four BSGM spectral metrics were developed from a cohort of 110 healthy volunteers of diverse age, sex and ethnicity, with cross-validation analysis demonstrating external validity.16 These intervals were generated for participants aged ≥18 years with BMI <35 kg/m2, where >50% of the meal is consumed during the test and <50% of the test duration is affected by artifacts.16 These reference intervals, summarized in Figure 4C, are used to guide clinical interpretations of BSGM data (see ‘BSGM Phenotypes’).16 Reference intervals for children and adolescents are the subject of ongoing work.
Several general considerations are crucial to the design and interpretation of clinical reference intervals for BSGM metrics.61 These include inappropriately assuming metrics fit Gaussian distributions, and as BMI-adjusted amplitude and ff-AR were found to be skewed, these reference intervals were defined using non-parametric methods.16 Other pitfalls include incorrectly assuming the central 95% reflects physiological normality, ignoring overlapping distributions between controls and patients, ignoring intra-individual variability, and conflating reference intervals with diagnostic tests. These pitfalls are avoided in the BSGM framework by treating the reference intervals as guides for patient phenotyping, to be viewed holistically alongside patient history and symptom profiles (e.g. Figure 5). The effect of demographic parameters (age, sex, and ethnicity) on BSGM have also been evaluated, and while minor differences were found with regard to sex, these differences were sufficiently trivial to allow a single common set of adult reference intervals.16
Figure 5.
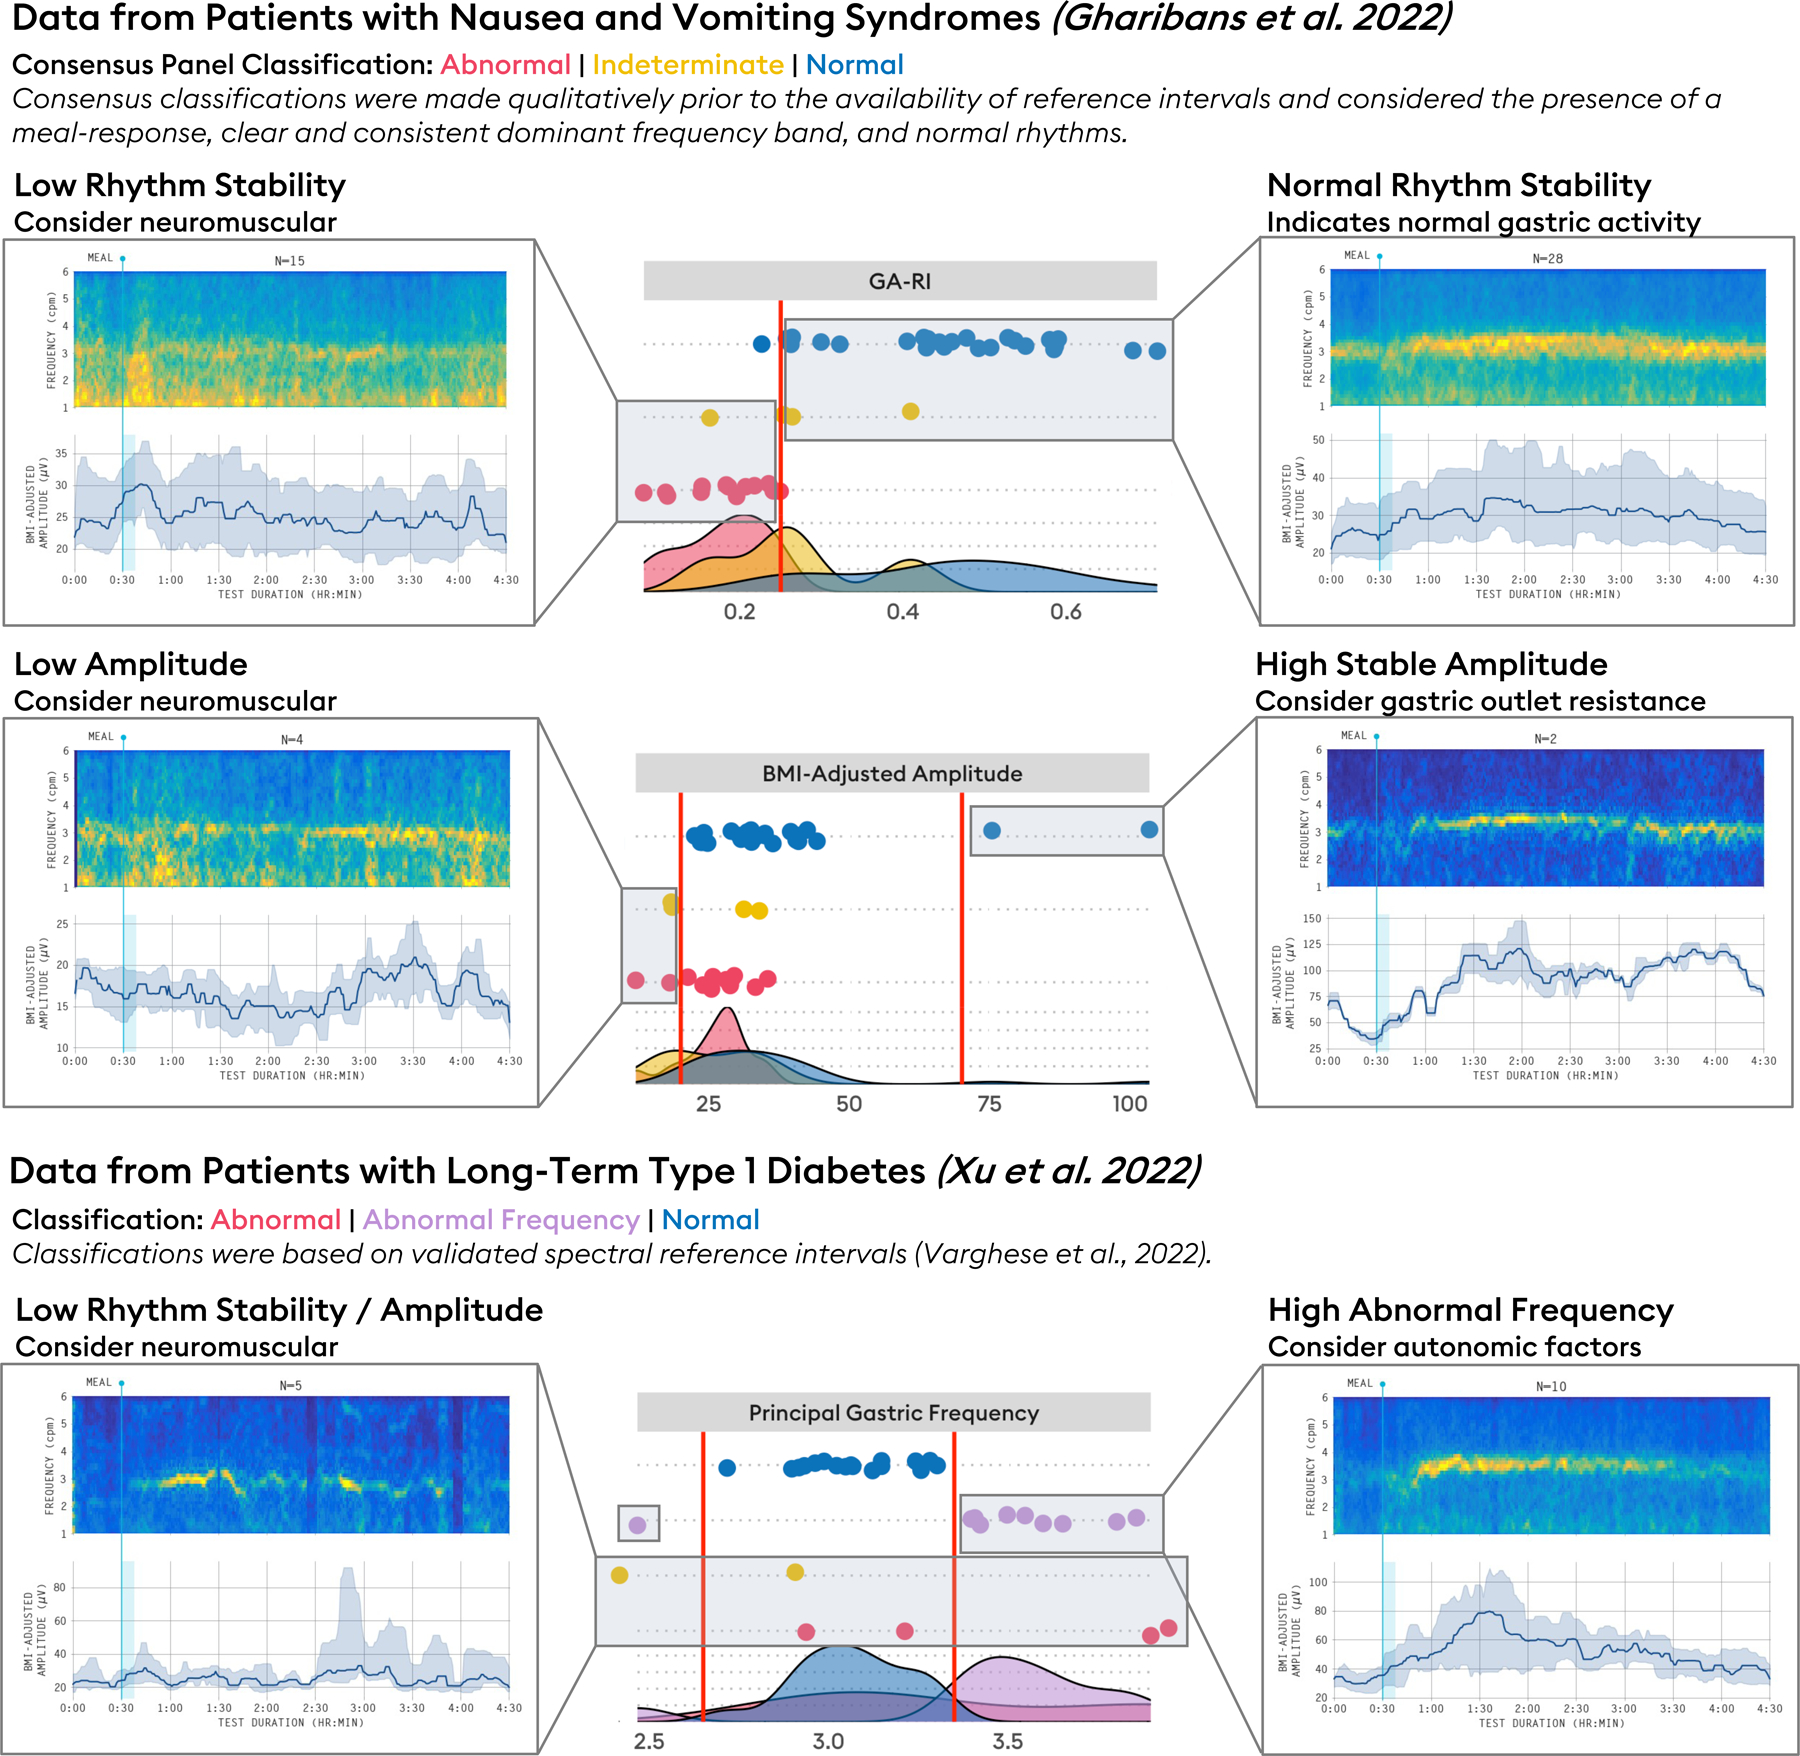
Summary of spectral phenotypes arising from BSGM. Low rhythm stability: a phenotype characterized by low GA-RI (<0.25). Example averaged spectrogram shown from a series of patients with nausea and vomiting syndromes (NVS) considered to have neuromuscular dysfunction (n=13).48 Low amplitude: a phenotype characterized by low BMI-Adjusted Amplitude (<20 μV), a finding supportive of a neuromuscular disorder and/or myopathy. Example averaged spectrogram shown from patients, with low BMI-adjusted amplitudes considered to have neuromuscular dysfunction (n=4).48 Normal rhythm stability: characterized by spectral reference intervals in the normal ranges (averaged spectrograms of n=26 patients with chronic gastric symptoms).79 High stable amplitude: characterized by normal GA-RI (≥0.25) and high BMI-adjusted amplitude (>70 μV) suggesting possible gastric outlet resistance (data shown from n=2 patients with nausea and vomiting syndromes).53 Abnormal frequency: Principal Gastric Frequency outside of 2.65 – 3.35 cpm. Average spectrograms shown from long-term type 1 diabetic subjects (n=10).11 As these phenotypes are derived from reference intervals defined by a population of healthy controls, they are intended to serve as guidelines, not definitive diagnoses. They should be interpreted alongside relevant clinical data.
Two-sided reference intervals (Principal Gastric Frequency and BMI-adjusted amplitude) are reported as 5th and 95th percentiles, in line with previous motility diagnostics literature,62,63 whereas one-sided reference intervals (GA-RI and ff-AR) are reported using the 5th percentile. Five percent of healthy volunteers can therefore be expected to fall outside of the end of an interval. It is also important to reinforce that BSGM is a diagnostic aid according to regulatory classifications, such that the use of reference intervals provides a valuable indication of pathology, but should be integrated with symptom evaluations, clinical history, examination, and other investigations to form a clinical diagnosis of specific diseases. The intervals offer a guide, rather than a binary test for normality, especially when considering the increasing probability of false positive results when utilizing multiple metric intervals.61
It should also be remembered that chronic gastroduodenal disorders have multiple other contributors beyond disordered motor activity, such as disorders of gut-brain interaction, visceral hypersensitivity, neurological impairment, connective tissue pathology, and potentially immunological, microbial and mucosal dysregulation.64–66 While BSGM spectral metrics and intervals are valuable for detecting gastric motor dysfunction, a normal test does not rule out alternative extra-gastric pathologies.48 Lastly, it should be noted that the BSGM metrics represent averages over a test duration, and manual review of spectral plots may still be required to detect transient deviations that may be associated with symptoms but otherwise missed in averaged data tables (e.g. Figure 6A).
Figure 6.
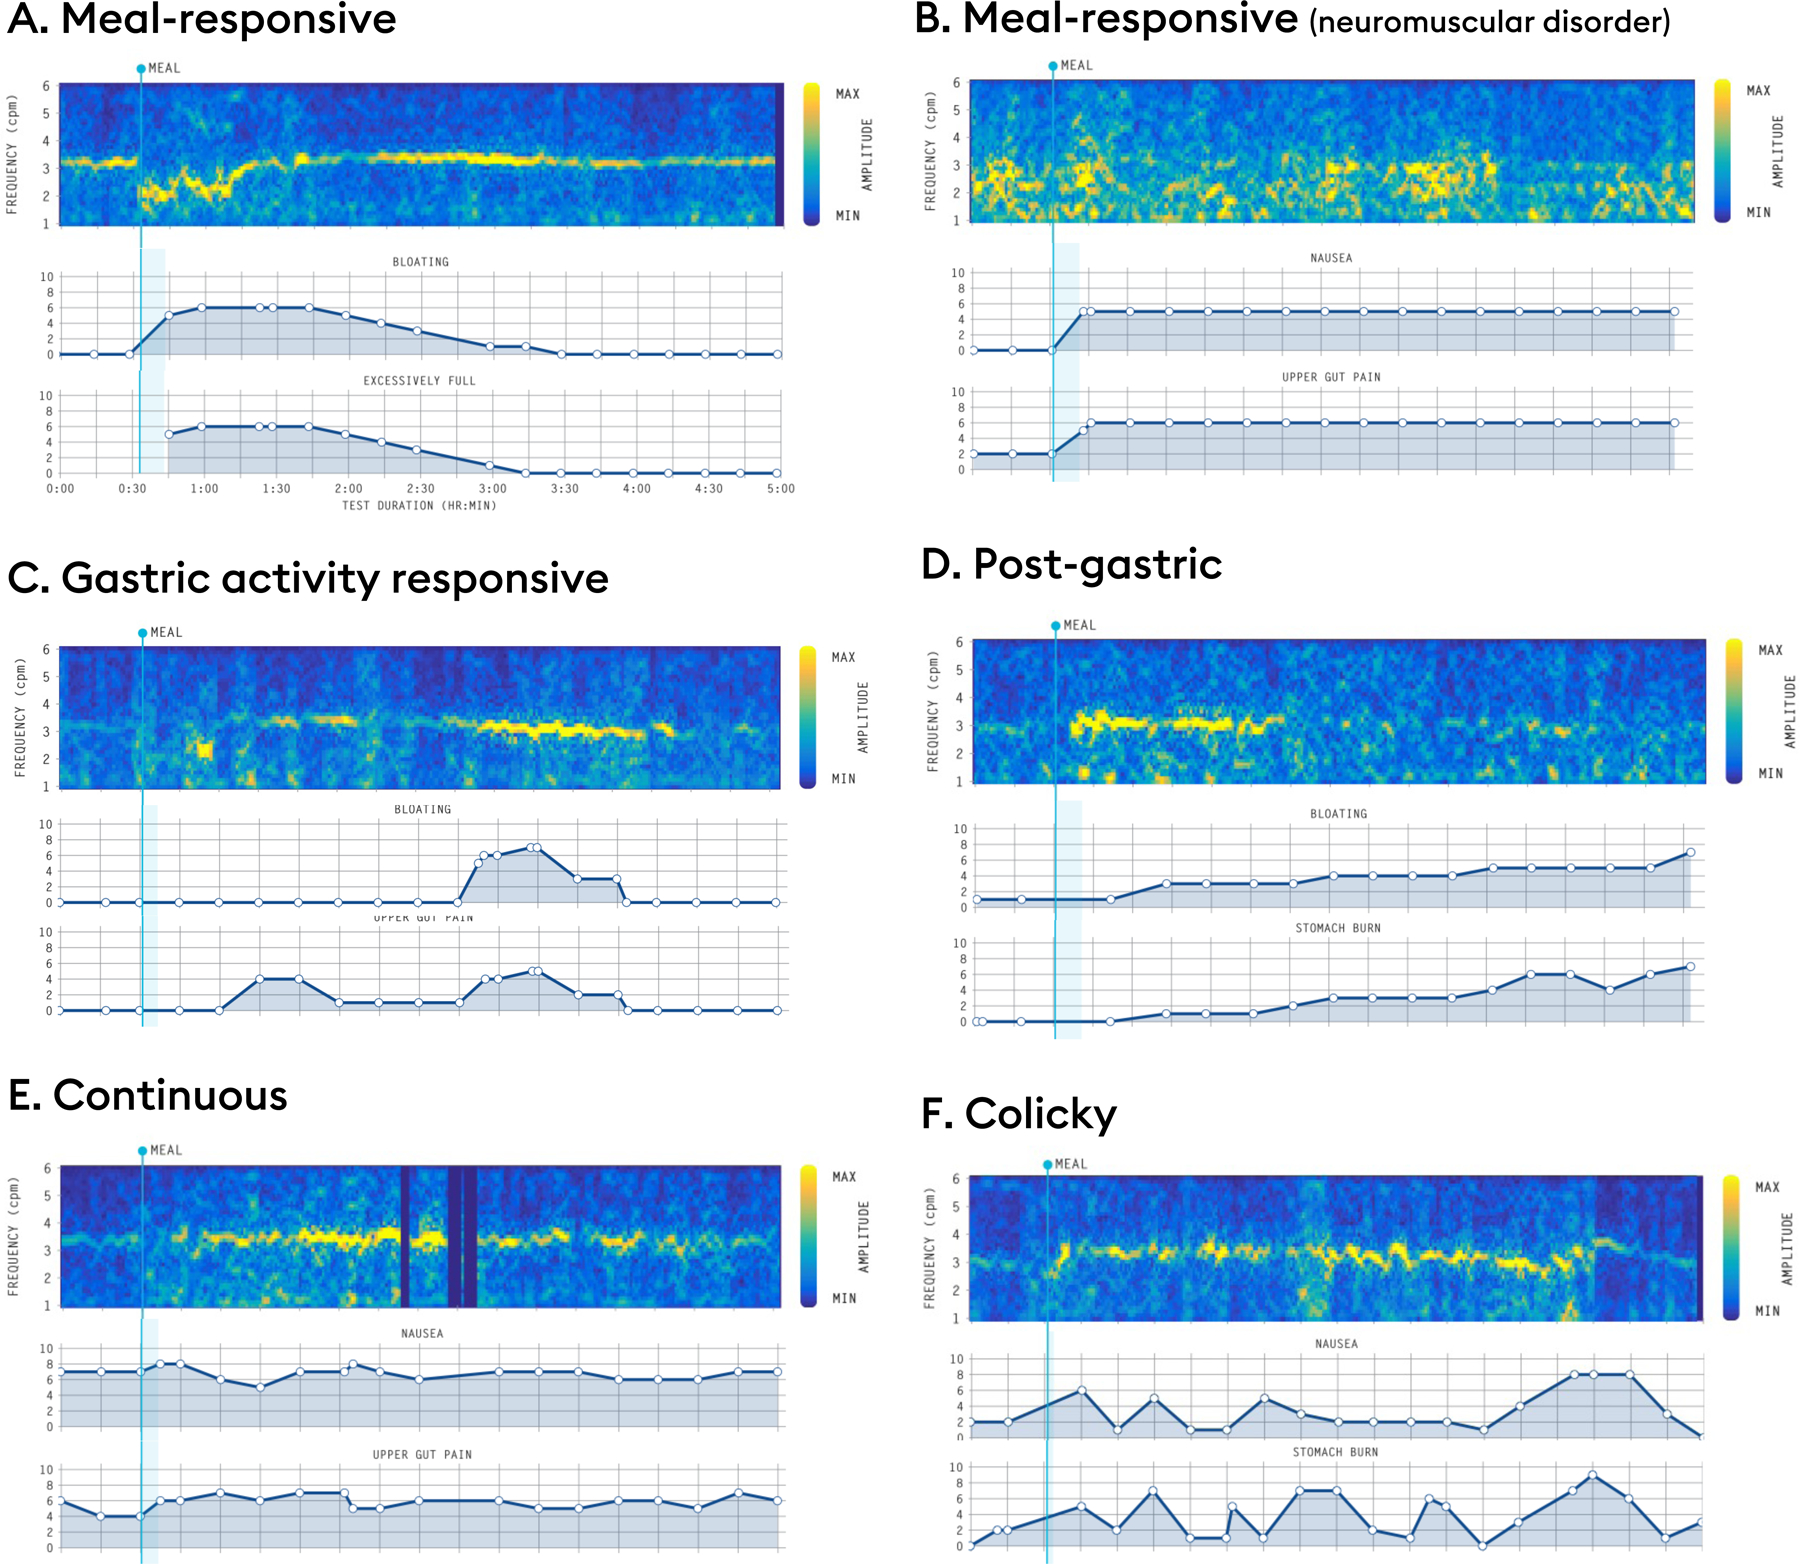
Representative symptom profile phenotypes. (A,B) Meal-responsive: symptoms onset occurs after meal-consumption. Examples shown for a transient frequency deviation (A) and a patient with a phenotype suggestive of a neuromuscular disorder (B). (C) Gastric activity responsive: symptom burden increases in parallel with gastric activity (i.e., symptoms present when gastric motility is maximal and absent when quiescent). (D) Post-gastric: symptom burden maximal in the latter half of the postprandial recording, discordant with the amplitude curve, indicating that small-intestine pathologies should be considered. (E) Continuous: Symptoms are present in the preprandial period, only modestly exacerbated by meal ingestion, and remain elevated postprandially without declining when the BSGM meal response curve wanes. Continuous symptoms are not clearly related to gastric motor activity. (F) Colicky: Symptoms that show an on-off paroxysmal pattern suggesting the need for radiological investigations.
With these caveats understood, BSGM metrics and reference intervals offer a valuable opportunity to clarify specific phenotypes of gastric dysfunction, thereby improving the diagnostic uncertainty surrounding chronic gastric symptoms. Current and emerging BSGM phenotypes are discussed in the next section.
Clinical Applications
Indications and Uses
BSGM is applied as an aid to the diagnosis of patients presenting with chronic gastric symptoms, which includes any patient with a suspicion of gastric or pan-gut dysmotility. This also encompasses postoperative gastric dysfunction, where anatomical manipulations can induce pathological changes in the gastric conduction system.67 The test offers potential utility in assessing for gastric dysrhythmia, neuromuscular disorders, myopathies, gastric outlet resistance, autonomic dysregulation, and to generally specify the origins of gut symptoms.
Gastric dysrhythmias were classically defined by frequency deviations in EGG,37–40 with BSGM adding independent measures of rhythm (GA-RI) and spatial metrics.10,13,15,48,53 Multiple potential causes of gastric dysrhythmia exist including pharmacological, hormonal, and neural influences (recently reviewed in 18). However, the predominant use of rhythm metrics concerns the identification of neuromuscular disorders.24,48 Significant recent knowledge has been gained in this regard from invasive HR electrical mapping studies,8,18,68,69 and pathological analyses of ICC network damage in diverse conditions including idiopathic gastroparesis and diabetic gastropathy.3,70,71 Disrupted slow wave patterns have been observed in association with ICC loss on invasive HR serosal mapping,34,35 and increasing degrees of ICC network damage have also been correlated to greater myoelectrical abnormalities on EGG.72,48 Future areas of research include further defining specific pathological relationships between ICC loss and BSGM metrics, and quantifying the biophysical relationship between gastric slow wave dynamics and specific body surface signatures through the use of sophisticated experimental and/or in-silico techniques.33,73
Amplitude or power has long been evaluated as a metric in EGG studies, including in association with ICC loss. However due to the lack of a BMI-adjusted amplitude metric and reference intervals, attention was previously placed on intra-patient ‘fed-to-fasted power ratios’ as a biomarker of neuromuscular dysfunction, rather than comparing standardized amplitude measures between patients.24,41,72 Notably, recent BSGM data has indicated that ff-AR alone is not a specific metric for pathology because approximately 30% of healthy volunteers also show a low ff-AR (<1.5), in part due to the presence of a high fasting baseline amplitude at the time of testing,16 possibly reflecting cephalic-phase gastric activity,74 migrating motor complex activity,75 or circadian variations.46 Therefore, a low ff-AR (reference interval <1.08) should be interpreted in combination with other more specific metrics for neuromuscular dysfunction including BMI-adjusted amplitude and rhythm stability (GA-RI). A recent BSGM study in patients with nausea and vomiting syndromes demonstrated that the constellation of low amplitude, low ff-AR and rhythm instability defined a specific subgroup of patients with neuromuscular dysfunction, including symptom correlations (Figure 5).48 Impaired fed-fasted power ratio on EGG has also previously been shown to discriminate gastric smooth muscle disorders such as in visceral myopathy 76,77 and myotonic dystrophy.78 Evaluating the diagnostic utility of new BSGM metrics in these and other myopathic and connective tissue disorders will be a useful avenue of future enquiry.
Brzana et al previously reported that patients with mechanical gastric outlet obstruction showed high-amplitude myoelectrical activity that was ‘excessively regular’ on EGG.79 In view of this finding, BSGM reference intervals for BMI-adjusted amplitude were formulated to be two-sided, allowing for more objective interpretations of what constitutes a high amplitude.16 ‘Excessively regular’ is a misnomer, because gastric slow waves should normally be of a regular rhythm for the high majority of the time;18,21 however this salient feature can instead be recognized on BSGM as a GA-RI lying in the high normal range, being a one-sided metric (Figure 5).
Gastric myoelectrical activity is co-regulated by autonomic (vagal) innervation, with integration from ICC and smooth muscle cells.18,80 Vagal stimulation can exert chronotropic and dysrhythmic influences on slow waves, whereas vagal injury can variably result in frequency disturbances, suppressed smooth muscle action potentials, reduced contractility, and delayed gastric emptying.18 These abnormalities therefore provide targets to identify gastric dysfunction by BSGM in the context of autonomic dysregulation, as previously demonstrated with EGG (Figure 5).81,82
Phenotypes
Based on the pathophysiological insights above, together with validated symptom profiling, BSGM informs several specific phenotypes of gastric dysfunction. Achieving phenotyping has been an important milestone in clinical utility because it reduces the application of BSGM from cohort-level comparisons to the practical level of individual patients, thereby informing patient care. This represents a key advance over legacy EGG, where phenotypes were not standardized or robustly defined with reference intervals. Current BSGM phenotypes are restricted to spectral metrics but will expand in future as spatial profiling and other data becomes available.9,10,15 Current clinical phenotypes are summarized in Figures 5 and 6 and are detailed below.
Low rhythm stability / low amplitude. A low GA-RI (<0.25) is suggestive of gastric dysrhythmia and/or neuromuscular dysfunction. Neuromuscular dysfunction is further supported by the presence of reduced BMI-adjusted amplitude (<20 μV) and low ff-AR (<1.08).16,48 This phenotype was found to be present in approximately one third of patients with nausea and vomiting syndromes with otherwise undifferentiated symptom profiles,48 matching rates of neuromuscular abnormalities demonstrated histologically in similar cohorts, including in functional dyspepsia seen at tertiary referral centers.3,70,71 An isolated low amplitude with normal GA-RI is also suggestive of neuromuscular dysfunction and/or myopathy.
High stable amplitude. A normal GA-RI (≥0.25) and high BMI-Adjusted Amplitude (>70 μV) implies the possibility of increased gastric outlet resistance.79
Isolated frequency deviations. Reference intervals for frequency are tighter in BSGM (2.65 – 3.35 cpm) than those previously used in EGG, which reflects more accurate slow wave profiling,13,16 with the abnormal range generally not being lower than 2 or greater than 5 cpm.18 Low stable frequencies may arise when normal gastric pacemaking is disrupted, such as following surgical resection of the greater curvature.67 High stable frequencies have been observed in BSGM studies in association with vagal pathologies (e.g. 53), although multiple potential causal influences are possible based on EGG data (reviewed in 18). Frequency changes occur in tandem with significant shifts in conduction velocity,83 which may have important implications for gastric function. However, the clinical significance of isolated stable frequency deviations on gastric function and symptoms requires further research, and minor or transient changes in frequency can occur asymptomatically.
Normal BSGM. When all BSGM spectral metrics lie within the normal reference intervals, gastric motor dysfunction is less likely and a broad range of alternative pathologies should be considered. A recent study of subjects with nausea and vomiting showed disorders of gut-brain interaction are more common in this group.48,84 In EGG, features of test normality in the context of delayed gastric emptying were shown to help stratify patients who may be more likely to benefit from pyloric therapies.85 Consideration should also be given to other mechanisms not measured by BSGM including disordered accommodation, visceral hypersensitivity, neuropathic pain syndromes, and non-gastric causes. These patients could also have spatial propagation abnormalities, which requires ongoing research.15
Symptom Profiling
Another critical advance in BSGM has been to present optimized symptom and physiological data in directly adjacent graphs, allowing visual correlations of the temporal association between specific symptom profiles, the test meal, and gastric activity. The following framework has been developed to codify the symptom-profiles seen to date in BSGM recordings, as summarized in Figure 6.
Meal-responsive: Symptom burden increases immediately after the meal (i.e., when meal-responsive symptoms correlate in time with abnormal BSGM features (e.g. Figures 6A,B)), this supports a pathophysiological relationship.56 Alternatively, when meal-responsive symptoms occur in the context of normal BSGM tests, this indicates that alternative gastric pathologies such as visceral hypersensitivity and disordered accommodation should be considered, depending on the specific symptom expression. When meal-responsive symptoms show a declining curve (e.g. Figure 6A), this indicates that symptom relief is likely to be associated with contents transiting to the small intestine, also pointing to a gastric cause.86
Gastric activity responsive: Symptom burden increases in parallel with gastric activity (i.e., symptoms present when gastric motility is maximal and absent when quiescent) (e.g. Figure 6C). This symptom profile is relatively infrequently observed and less well understood, but it likely indicates a sensory component to symptoms.87
Post-gastric: Symptom burden maximal in the latter half of the postprandial recording, discordant with the amplitude curve (e.g. Figure 6D).86 This phenotype indicates that small-intestinal pathologies should be considered.
Continuous: Symptoms are present in the preprandial period, only modestly exacerbated by meal ingestion, and remain elevated postprandially without declining when the BSGM meal response curve wanes (e.g. Figure 6E). These symptoms cannot be clearly related to gastric function, and alternative mechanisms such as neuropathy,53 ‘centrally-mediated’ (gut-brain axis),48,84 abdominal pain syndromes,88 and organic causes should therefore be considered.
Colicky: Symptoms that show an on-off paroxysmal pattern (e.g. Figure 6F), indicating the possibility of chronic partial intestinal obstruction and implying the need for radiological investigation.
These six profiles are not an exhaustive list and may be refined or expanded in future as BSGM data evolves. In addition, different symptom patterns in any given patient may be mixed, indicating overlapping pathologies, gut-brain axis overlays,89 or the involvement of multiple GI tract segments. Finally, it should be noted that motility responses to a meal are also triggered in the distal GI tract,90 meaning that meal-responsive symptoms such as nausea and bloating could also reflect a colonic origin.
Conclusions and Future Directions
In a 1998 review, Bortolotti critiqued the status of EGG as ‘A seductive promise only partially kept’, stating that “the future of EGG rests in the hands of the electronic engineers, who are alone capable of resolving [its] fundamental technical problems”.10,13 This technical review shows that in the subsequent two decades engineers have risen to the challenge, now presenting BSGM as a mature successor technology to EGG. Progress has been driven by a raft of innovations encompassing stretchable arrays, modern bioelectronics, wearable hardware, robust artifact rejection techniques, and novel analytical and visualization strategies, in concert with simultaneous digital symptom profiling, cloud computing and big-data analytics.9,11,13,16,47,48,53,91 The result is a next-generation clinical tool for evaluating gastric myoelectrical activity and symptoms, building on the considerable legacy of EGG, but yielding specific phenotyping of gastric dysfunction at the individual patient level.
The ultimate value for BSGM will be determined by its ability to guide treatment choices or predict outcomes of specific therapeutic approaches. Therefore, the baton of progress can now be handed back to gastrointestinal clinicians to define the full clinical potential of BSGM. Gastric symptoms are common, and reliable tests of gastric motor function are lacking,15,90 such that a non-invasive and radiation-free tool could achieve a priority position in diagnostic algorithms and care pathways. An evidence-based status report of these pathways is intended as the next stage for our BSGM Working Group, with the additional goal of generating a first classification scheme to further inform the clinical utility of the phenotypes introduced here. Additional research opportunities are considerable, and include comparing BSGM to existing tests of gastric function such as gastric emptying, antroduodenal manometry, pyloric EndoFLIP, and accommodation measures, as well as resolving the capability of BSGM phenotypes to predict the success of current and future therapies. It should also be noted that while current BSGM phenotypes are promising, they are based on a relatively small number of studies, and further data is desirable to confirm and extend current findings.
Several knowledge gaps are evident from this review that now require further attention. These include:
Defining the relationships between BSGM profiles and symptoms. Symptoms expressed during a BSGM study could arise as a consequence of motility abnormalities or as associations. Resolving symptom causality is important to guiding therapeutic targets, and one useful framework to approach this problem is the ‘Plausibility Criteria’ proposed by Tack et al.56
Defining correlations between gastric electrophysiology and motor activity. BSGM phenotypes are summated gastric electrophysiology patterns, and their associated motor profiles now need to be defined. These may include links to accommodation / receptive relaxation, antral contractions, and pyloric dyscoordination. This problem can be approached by studies simultaneously employing BSGM and symptom profiling together with other motility techniques such as magnetic resonance imaging, barostat, and manometry.92,93
Defining the pathophysiological basis of BSGM profiles. The pathophysiological basis of BSGM profiles are currently inferred, often from legacy techniques such as EGG or invasive gastric mapping. These links should be further advanced through studies correlating BSGM profiles with pathophysiology at tissue, cellular and subcellular levels, including addressing ICC, smooth muscle and neural function.
The technical evolution of BSGM will also continue with several priorities. Spatial metrics are expected to offer additional phenotypes,10,15 and advancing these through pivotal clinical studies and regulatory approvals comprises perhaps the next important evolutionary step for BSGM. In particular, there is deep interest in the role and meaning of retrograde activation, which correlates with symptoms and appears to be a prominent feature in subgroups of adults and children with gastric disorders.15,94 Other novel classes of metrics are also being explored, including meal response curves and velocity of propagating waves.48,53,95 It would also be valuable to correlate current and future BSGM phenotypes with contraction profiles through magnetic resonance imaging.92
BSGM generates vast volumes of high-dimensional data that are presently passed through refined signal processing pipelines for spectral and spatial analytics. It is expected that artificial intelligence (AI) methods will reveal novel insights in the underlying signals that are predictive of specific symptom profiles.96 Feasibility has been presented in small cohorts,96 but as repositories of BSGM recordings and associated symptom data now grow into the thousands of cases, AI approaches can begin to be meaningfully applied. Furthermore, the role of AI could theoretically be extended to automated and/or enhanced phenotyping.
BSGM is particularly attractive in pediatric care due to its non-invasiveness. Postprandial pain, nausea and vomiting, rumination syndrome, aerophagia, diabetic gastropathy, pseudo-obstruction and abdominal migraine present exemplary pediatric disorders for the application of BSGM.38,97 Next steps will be to extend regulatory approvals to children and adolescents (the latter having already been achieved in the UK and New Zealand), and to evaluate the suitability of current electrode arrays and symptom logging tools for children younger than 12 years old.
In conclusion, at the centennial of the discovery of EGG, Alvarez’s ‘little prophecy’ predicting the widespread use of ‘electrical measures’ in GI diagnostics may finally be within reach.36 BSGM reflects a sustained period of technical progress, and is now clinically available as a diagnostic aid for evaluating gastric motor function and symptoms in patients. BSGM offers unique phenotyping capability that is not found in other gastric tests, and with clinical data now emerging rapidly, the opportunity exists to definitively elucidate the role of electrophysiology in gastrointestinal care.
Funding
This work was supported by the New Zealand Health Research Council, the National Institutes of Health (R56 DK126935), and the Royal Australasian College of Surgeons.
Footnotes
Disclosures
AG, CNA, and GO hold grants and intellectual property in the field of GI electrophysiology and are members of University of Auckland spin-out companies: The Insides Company (GO), FlexiMap (PD), and Alimetry (AG, SC, CNA, PD, GS and GO). CV and WX have no relevant conflicts to declare.
References
- 1.Sperber AD et al. Worldwide Prevalence and Burden of Functional Gastrointestinal Disorders, Results of Rome Foundation Global Study. Gastroenterology 160, 99–114.e3 (2021). [DOI] [PubMed] [Google Scholar]
- 2.Robin SG et al. Prevalence of Pediatric Functional Gastrointestinal Disorders Utilizing the Rome IV Criteria. J. Pediatr 195, 134–139 (2018). [DOI] [PubMed] [Google Scholar]
- 3.Pasricha PJ et al. Functional Dyspepsia and Gastroparesis in Tertiary Care are Interchangeable Syndromes With Common Clinical and Pathologic Features. Gastroenterology 160, 2006–2017 (2021). [DOI] [PMC free article] [PubMed] [Google Scholar]
- 4.Pasricha PJ et al. Characteristics of patients with chronic unexplained nausea and vomiting and normal gastric emptying. Clin. Gastroenterol. Hepatol 9, 567–76.e1–4 (2011). [DOI] [PMC free article] [PubMed] [Google Scholar]
- 5.Lacy BE et al. Diagnostic Evaluation of Gastric Motor and Sensory Disorders. American Journal of Gastroenterology vol. 116 2345–2356 Preprint at 10.14309/ajg.0000000000001562 (2021). [DOI] [PubMed] [Google Scholar]
- 6.Bortolotti M Electrogastrography: a seductive promise, only partially kept. The American journal of gastroenterology vol. 93 1791–1794 (1998). [DOI] [PubMed] [Google Scholar]
- 7.Verhagen MA, Van Schelven LJ, Samsom M & Smout AJ Pitfalls in the analysis of electrogastrographic recordings. Gastroenterology 117, 453–460 (1999). [DOI] [PubMed] [Google Scholar]
- 8.Carson DA, O’Grady G, Du P, Gharibans AA & Andrews CN Body surface mapping of the stomach: New directions for clinically evaluating gastric electrical activity. Neurogastroenterology and 33, (2021). [DOI] [PubMed] [Google Scholar]
- 9.Gharibans AA et al. A novel scalable electrode array and system for non-invasively assessing gastric function using flexible electronics. Neurogastroenterol. Motil e14418 (2022). [DOI] [PMC free article] [PubMed]
- 10.Somarajan S et al. The effect of chronic nausea on gastric slow wave spatiotemporal dynamics in children. Neurogastroenterol. Motil 33, e14035 (2021). [DOI] [PMC free article] [PubMed] [Google Scholar]
- 11.Calder S et al. An automated artifact detection and rejection system for body surface gastric mapping. Neurogastroenterol. Motil e14421 (2022). [DOI] [PMC free article] [PubMed]
- 12.Olson JD et al. Automated Machine Learning Pipeline Framework for Classification of Pediatric Functional Nausea Using High-resolution Electrogastrogram. IEEE Trans. Biomed. Eng PP, (2021). [DOI] [PubMed]
- 13.Schamberg G et al. Revised spectral metrics for body surface measurements of gastric electrophysiology. Neurogastroenterol. Motil. e14491 (2022). [DOI] [PubMed]
- 14.Calder S, O’Grady G, Cheng LK & Du P Torso-Tank Validation of High-Resolution Electrogastrography (EGG): Forward Modelling, Methodology and Results. Ann. Biomed. Eng 46, 1183–1193 (2018). [DOI] [PubMed] [Google Scholar]
- 15.Gharibans AA, Coleman TP, Mousa H & Kunkel DC Spatial Patterns From High-Resolution Electrogastrography Correlate With Severity of Symptoms in Patients With Functional Dyspepsia and Gastroparesis. Clin. Gastroenterol. Hepatol 17, 2668–2677 (2019). [DOI] [PubMed] [Google Scholar]
- 16.Varghese C et al. Normative values for body surface gastric mapping evaluations of gastric motility using Gastric Alimetry: spectral analysis. Am. J. Gastroenterol 00, 1–11 (2022). [DOI] [PubMed] [Google Scholar]
- 17.Du P, O’Grady G, Cheng LK & Pullan AJ A multiscale model of the electrophysiological basis of the human electrogastrogram. Biophys. J 99, 2784–2792 (2010). [DOI] [PMC free article] [PubMed] [Google Scholar]
- 18.O’Grady G, Gharibans AA, Du P & Huizinga JD The gastric conduction system in health and disease: a translational review. Am. J. Physiol. Gastrointest. Liver Physiol 321, G527–G542 (2021). [DOI] [PubMed] [Google Scholar]
- 19.Smout AJPM, Smout AJP, Van Der Schee EJ & Grashuis JL What is measured in electrogastrography? Digestive Diseases and Sciences vol. 25 179–187 Preprint at 10.1007/bf01308136 (1980). [DOI] [PubMed] [Google Scholar]
- 20.Hinder RA & Kelly KA Human gastric pacesetter potential. Site of origin, spread, and response to gastric transection and proximal gastric vagotomy. Am. J. Surg 133, 29–33 (1977). [DOI] [PubMed] [Google Scholar]
- 21.O’Grady G et al. Origin and propagation of human gastric slow-wave activity defined by high-resolution mapping. Am. J. Physiol. Gastrointest. Liver Physiol 299, G585–92 (2010). [DOI] [PMC free article] [PubMed] [Google Scholar]
- 22.Berry R et al. Functional physiology of the human terminal antrum defined by high-resolution electrical mapping and computational modeling. Am. J. Physiol. Gastrointest. Liver Physiol 311, G895–G902 (2016). [DOI] [PMC free article] [PubMed] [Google Scholar]
- 23.Cheng LK et al. Detailed measurements of gastric electrical activity and their implications on inverse solutions. Conf. Proc. IEEE Eng. Med. Biol. Soc 2009, 1302–1305 (2009). [DOI] [PMC free article] [PubMed] [Google Scholar]
- 24.Yin J & Chen JDZ Electrogastrography: methodology, validation and applications. J. Neurogastroenterol. Motil 19, 5–17 (2013). [DOI] [PMC free article] [PubMed] [Google Scholar]
- 25.Du P et al. Progress in mathematical modeling of gastrointestinal slow wave abnormalities. Front. Physiol 8, 1136 (2018). [DOI] [PMC free article] [PubMed] [Google Scholar]
- 26.Angeli TR et al. The bioelectrical basis and validity of gastrointestinal extracellular slow wave recordings. The Journal of Physiology vol. 591 4567–4579 Preprint at 10.1113/jphysiol.2013.254292 (2013). [DOI] [PMC free article] [PubMed] [Google Scholar]
- 27.Bradshaw LA, Richards WO & Wikswo JP Jr. Volume conductor effects on the spatial resolution of magnetic fields and electric potentials from gastrointestinal electrical activity. Med. Biol. Eng. Comput 39, 35–43 (2001). [DOI] [PubMed] [Google Scholar]
- 28.Chen J & McCallum RW Electrogastrography: measuremnt, analysis and prospective applications. Med. Biol. Eng. Comput 29, 339–350 (1991). [DOI] [PubMed] [Google Scholar]
- 29.Ruenruaysab K et al. Effects of Anatomical Variations of the Stomach on Body-Surface Gastric Mapping Investigated Using a Large Population-Based Multiscale Simulation Approach. IEEE Trans. Biomed. Eng 69, 1369–1377 (2022). [DOI] [PubMed] [Google Scholar]
- 30.Chen JD, Schirmer BD & McCallum RW Serosal and cutaneous recordings of gastric myoelectrical activity in patients with gastroparesis. Am. J. Physiol 266, G90–8 (1994). [DOI] [PubMed] [Google Scholar]
- 31.Lin Z, Chen JDZ, Schirmer BD & McCallum RW Postprandial response of gastric slow waves: Correlation of serosal recordings with the electrogastrogram. Dig. Dis. Sci 45, 645–651 (2000). [DOI] [PubMed] [Google Scholar]
- 32.Mintchev MP, Kingma YJ & Bowes KL Accuracy of cutaneous recordings of gastric electrical activity. Gastroenterology 104, 1273–1280 (1993). [DOI] [PubMed] [Google Scholar]
- 33.Calder S et al. Validation of non-invasive body-surface gastric mapping for detecting gastric slow wave spatiotemporal features by simultaneous serosal mapping in porcine. American Journal of Physiology-Gastrointestinal and Liver Physiology Preprint at 10.1152/ajpgi.00049.2022 (2022). [DOI] [PubMed]
- 34.O’Grady G et al. Abnormal Initiation and Conduction of Slow-Wave Activity in Gastroparesis, Defined by High-Resolution Electrical Mapping. Gastroenterology 143, 589–598.e3 (2012). [DOI] [PMC free article] [PubMed] [Google Scholar]
- 35.Angeli TR et al. Loss of Interstitial Cells of Cajal and Patterns of Gastric Dysrhythmia in Patients With Chronic Unexplained Nausea and Vomiting. Gastroenterology 149, 56–66.e5 (2015). [DOI] [PMC free article] [PubMed] [Google Scholar]
- 36.Alvarez WC The electrogastrogram and what it shows. JAMA 78, 1116–1119 (1922). [Google Scholar]
- 37.Varghese C et al. Clinical associations of functional dyspepsia with gastric dysrhythmia on electrogastrography: A comprehensive systematic review and meta-analysis. Neurogastroenterol. Motil 33, e14151 (2021). [DOI] [PubMed] [Google Scholar]
- 38.Bhat S et al. Electrogastrography Abnormalities in Pediatric Gastroduodenal Disorders: A Systematic Review and Meta-analysis. J. Pediatr. Gastroenterol. Nutr 73, 9–16 (2021). [DOI] [PubMed] [Google Scholar]
- 39.Bhat S et al. Gastric dysrhythmia in gastroesophageal reflux disease: a systematic review and meta-analysis. Esophagus 18, 425–435 (2021). [DOI] [PubMed] [Google Scholar]
- 40.Carson DA et al. Abnormalities on Electrogastrography in Nausea and Vomiting Syndromes: A Systematic Review, Meta-Analysis, and Comparison to Other Gastric Disorders. Dig. Dis. Sci (2021) doi: 10.1007/s10620-021-07026-x. [DOI] [PubMed]
- 41.Koch KL & Stern RM Handbook of Electrogastrography (Oxford University Press, 2003). [Google Scholar]
- 42.Parkman HP, Hasler WL, Barnett JL, Eaker EY & American Motility Society Clinical GI Motility Testing Task Force. Electrogastrography: a document prepared by the gastric section of the American Motility Society Clinical GI Motility Testing Task Force. Neurogastroenterol. Motil 15, 89–102 (2003). [DOI] [PubMed] [Google Scholar]
- 43.Chen JDZ & McCallum RW Clinical applications of electrogastrography. Am. J. Gastroenterol 88, 1324–1336 (1993). [PubMed] [Google Scholar]
- 44.Abid S & Lindberg G Electrogastrography: poor correlation with antro-duodenal manometry and doubtful clinical usefulness in adults. World J. Gastroenterol 13, 5101–5107 (2007). [DOI] [PMC free article] [PubMed] [Google Scholar]
- 45.McAdams E Bioelectrodes. Encyclopedia of Medical Devices and Instrumentation Preprint at 10.1002/0471732877.emd013 (2006). [DOI]
- 46.Gharibans AA et al. Artifact Rejection Methodology Enables Continuous, Noninvasive Measurement of Gastric Myoelectric Activity in Ambulatory Subjects. Sci. Rep 8, 5019 (2018). [DOI] [PMC free article] [PubMed] [Google Scholar]
- 47.Sebaratnam G et al. Standardized system and App for continuous patient symptom logging in gastroduodenal disorders: Design, implementation, and validation. Neurogastroenterol. Motil e14331 (2022). [DOI] [PMC free article] [PubMed]
- 48.Gharibans AA et al. Gastric dysfunction in patients with chronic nausea and vomiting syndromes defined by a novel non-invasive gastric mapping device. bioRxiv (2022) doi: 10.1101/2022.02.07.22270514. [DOI] [PMC free article] [PubMed]
- 49.Wolpert N, Rebollo I & Tallon-Baudry C Electrogastrography for psychophysiological research: Practical considerations, analysis pipeline, and normative data in a large sample. Psychophysiology 57, e13599 (2020). [DOI] [PMC free article] [PubMed] [Google Scholar]
- 50.Abell Camilleri & Donohoe. Consensus recommendations for gastric emptying scintigraphy: a joint report of the American Neurogastroenterology and Motility Society and the Society of Nuclear …. J. Nucl. Med [DOI] [PubMed]
- 51.Bisschops R et al. Relationship between symptoms and ingestion of a meal in functional dyspepsia. Gut 57, 1495–1503 (2008). [DOI] [PubMed] [Google Scholar]
- 52.Kuwelker S, Prichard DO, Bailey K & Bharucha AE Relationship between symptoms during a gastric emptying study, daily symptoms and quality of life in patients with diabetes mellitus. Neurogastroenterol. Motil e14154 (2021). [DOI] [PMC free article] [PubMed]
- 53.Xu W et al. Defining and phenotyping gastric abnormalities in long-term type 1 diabetes using body surface gastric mapping. medRxiv (2022) doi: 10.1101/2022.08.10.22278649. [DOI] [PMC free article] [PubMed]
- 54.Coleski R & Hasler WL Coupling and propagation of normal and dysrhythmic gastric slow waves during acute hyperglycaemia in healthy humans. Neurogastroenterol. Motil 21, 492–9, e1–2 (2009). [DOI] [PubMed] [Google Scholar]
- 55.Elsenbruch S, Orr WC, Harnish MJ & Chen JDZ Disruption of normal gastric myoelectric functioning by sleep. Sleep 22, 453–458 (1999). [PubMed] [Google Scholar]
- 56.Tack J et al. Plausibility criteria for putative pathophysiological mechanisms in functional gastrointestinal disorders: a consensus of experts. Gut 67, 1425–1433 (2018). [DOI] [PubMed] [Google Scholar]
- 57.Tack J et al. The use of pictograms improves symptom evaluation by patients with functional dyspepsia. Aliment. Pharmacol. Ther 40, 523–530 (2014). [DOI] [PubMed] [Google Scholar]
- 58.Food Drug Administration. Gastroparesis: Clinical Evaluation of Drugs for Treatment: Guidance for Industry. Drug Administration Center for Drug Evaluation …
- 59.Camilleri M et al. Gastroparesis. Nat Rev Dis Primers 4, 41 (2018). [DOI] [PubMed] [Google Scholar]
- 60.Stanghellini V et al. Gastroduodenal Disorders. Gastroenterology 150, 1380–1392 (2016). [DOI] [PubMed] [Google Scholar]
- 61.Whyte MB & Kelly P The normal range: it is not normal and it is not a range. Postgrad. Med. J (2018). [DOI] [PMC free article] [PubMed]
- 62.Farmer AD et al. Regional gastrointestinal contractility parameters using the wireless motility capsule: inter-observer reproducibility and influence of age, gender and study country. Alimentary Pharmacology & Therapeutics vol. 47 391–400 Preprint at 10.1111/apt.14438 (2018). [DOI] [PubMed] [Google Scholar]
- 63.Nandhra GK et al. Normative values for region-specific colonic and gastrointestinal transit times in 111 healthy volunteers using the 3D-Transit electromagnet tracking system: Influence of age, gender, and body mass index. Neurogastroenterol. Motil 32, e13734 (2020). [DOI] [PubMed] [Google Scholar]
- 64.Ford AC, Mahadeva S, Florencia Carbone M, Lacy BE & Talley NJ Functional dyspepsia. The Lancet vol. 396 1689–1702 Preprint at 10.1016/s0140-6736(20)30469-4 (2020). [DOI] [PubMed] [Google Scholar]
- 65.Drossman DA Functional Gastrointestinal Disorders: History, Pathophysiology, Clinical Features and Rome IV. Gastroenterology (2016) doi: 10.1053/j.gastro.2016.02.032. [DOI] [PubMed]
- 66.Tack J, Bisschops R & Sarnelli G Pathophysiology and treatment of functional dyspepsia. Gastroenterology 127, 1239–1255 (2004). [DOI] [PubMed] [Google Scholar]
- 67.Carson DA et al. The Impact and Clinical Implications of Gastric Surgery on the Gastric Conduction System. Foregut doi: 10.1177/26345161221130117. [DOI]
- 68.O’Grady G et al. Recent progress in gastric arrhythmia: Pathophysiology, clinical significance and future horizons. Clin. Exp. Pharmacol. Physiol 41, 854–862 (2014). [DOI] [PMC free article] [PubMed] [Google Scholar]
- 69.O’Grady G et al. Methods for High-Resolution Electrical Mapping in the Gastrointestinal Tract. IEEE Rev. Biomed. Eng 12, 287–302 (2019). [DOI] [PubMed] [Google Scholar]
- 70.Grover M et al. Cellular changes in diabetic and idiopathic gastroparesis. Gastroenterology 140, 1575–85.e8 (2011). [DOI] [PMC free article] [PubMed] [Google Scholar]
- 71.Grover M et al. Clinical-histological associations in gastroparesis: results from the Gastroparesis Clinical Research Consortium. Neurogastroenterol. Motil 24, 531–9, e249 (2012). [DOI] [PMC free article] [PubMed] [Google Scholar]
- 72.Lin Z et al. Association of the status of interstitial cells of Cajal and electrogastrogram parameters, gastric emptying and symptoms in patients with gastroparesis. Neurogastroenterol. Motil 22, 56–61, e10 (2010). [DOI] [PubMed] [Google Scholar]
- 73.Calder S, O’Grady G, Cheng LK & Peng Du. A Theoretical Analysis of Electrogastrography (EGG) Signatures Associated With Gastric Dysrhythmias. IEEE Trans. Biomed. Eng 64, 1592–1601 (2017). [DOI] [PubMed] [Google Scholar]
- 74.Nederkoorn C, Smulders FT & Jansen A Cephalic phase responses, craving and food intake in normal subjects. Appetite 35, 45–55 (2000). [DOI] [PubMed] [Google Scholar]
- 75.Deloose E, Janssen P, Depoortere I & Tack J The migrating motor complex: control mechanisms and its role in health and disease. Nat. Rev. Gastroenterol. Hepatol 9, 271–285 (2012). [DOI] [PubMed] [Google Scholar]
- 76.Di Lorenzo C, Reddy SN, Flores AF & Hyman PE Is electrogastrography a substitute for manometric studies in children with functional gastrointestinal disorders? Dig. Dis. Sci 42, 2310–2316 (1997). [DOI] [PubMed] [Google Scholar]
- 77.Debinski HS, Ahmed S, Milla PJ & Kamm MA Electrogastrography in chronic intestinal pseudoobstruction. Dig. Dis. Sci 41, 1292–1297 (1996). [DOI] [PubMed] [Google Scholar]
- 78.Ronnblom A, Hellstrom PM, Holst JJ, Theodorsson E & Danielsson A Gastric myoelectrical activity and gut hormone secretion in myotonic dystrophy. Eur. J. Gastroenterol. Hepatol 13, 825–831 (2001). [DOI] [PubMed] [Google Scholar]
- 79.Brzana RJ, Koch KL & Bingaman S Gastric myoelectrical activity in patients with gastric outlet obstruction and idiopathic gastroparesis. Am. J. Gastroenterol 93, 1803–1809 (1998). [DOI] [PubMed] [Google Scholar]
- 80.Huizinga JD & Lammers WJEP Gut peristalsis is governed by a multitude of cooperating mechanisms. Am. J. Physiol. Gastrointest. Liver Physiol 296, G1–8 (2009). [DOI] [PubMed] [Google Scholar]
- 81.Barczynski M & Thor P Reversible autonomic dysfunction in hyperthyroid patients affects gastric myoelectrical activity and emptying. Clin. Auton. Res 11, 243–249 (2001). [DOI] [PubMed] [Google Scholar]
- 82.Chelimsky G & Chelimsky TC Evaluation and Treatment of Autonomic Disorders of the Gastrointestinal Tract. Semin. Neurol 23, 453–458 (2003). [DOI] [PubMed] [Google Scholar]
- 83.Wang TH-H et al. Relationships between gastric slow wave frequency, velocity, and extracellular amplitude studied by a joint experimental-theoretical approach. Neurogastroenterol. Motil 30, (2018). [DOI] [PubMed] [Google Scholar]
- 84.Drossman DA & Tack J Rome Foundation Clinical Diagnostic Criteria for Disorders of Gut-Brain Interaction. Gastroenterology 162, 675–679 (2022). [DOI] [PubMed] [Google Scholar]
- 85.Wellington J, Scott B, Kundu S, Stuart P & Koch KL Effect of endoscopic pyloric therapies for patients with nausea and vomiting and functional obstructive gastroparesis. Auton. Neurosci 202, 56–61 (2017). [DOI] [PubMed] [Google Scholar]
- 86.Vanheel H et al. Postprandial symptoms originating from the stomach in functional dyspepsia. Neurogastroenterol. Motil 25, 911–e703 (2013). [DOI] [PubMed] [Google Scholar]
- 87.Mercado-Perez A & Beyder A Gut feelings: mechanosensing in the gastrointestinal tract. Nat. Rev. Gastroenterol. Hepatol 19, 283–296 (2022). [DOI] [PMC free article] [PubMed] [Google Scholar]
- 88.Mayer EA & Tillisch K The brain-gut axis in abdominal pain syndromes. Annu. Rev. Med 62, 381–396 (2011). [DOI] [PMC free article] [PubMed] [Google Scholar]
- 89.Black CJ, Drossman DA, Talley NJ, Ruddy J & Ford AC Functional gastrointestinal disorders: advances in understanding and management. Lancet 396, 1664–1674 (2020). [DOI] [PubMed] [Google Scholar]
- 90.Dinning PG et al. Quantification of in vivo colonic motor patterns in healthy humans before and after a meal revealed by high-resolution fiber-optic manometry. Neurogastroenterol. Motil 26, 1443–1457 (2014). [DOI] [PMC free article] [PubMed] [Google Scholar]
- 91.Calder S et al. Validation of non-invasive body-surface gastric mapping for detecting electrophysiological biomarkers by simultaneous high-resolution serosal mapping in a porcine model. bioRxiv 2021.08.01.454685 (2021) doi: 10.1101/2021.08.01.454685. [DOI]
- 92.Ajaj W et al. Real time high resolution magnetic resonance imaging for the assessment of gastric motility disorders. Gut 53, 1256–1261 (2004). [DOI] [PMC free article] [PubMed] [Google Scholar]
- 93.O’Grady G, Carbone F & Tack J Gastric sensorimotor function and its clinical measurement. Neurogastroenterology & Motility n/a, e14489 (2022). [DOI] [PMC free article] [PubMed] [Google Scholar]
- 94.O’Grady G, Gharibans A, Calder S & Andrews C Retrograde slow-wave activation: a missing link in gastric dysfunction? Neurogastroenterology and motility: the official journal of the European Gastrointestinal Motility Society vol. 33 e14112 (2021). [DOI] [PubMed] [Google Scholar]
- 95.Gharibans AA, Kim S, Kunkel D & Coleman TP High-Resolution Electrogastrogram: A Novel, Noninvasive Method for Determining Gastric Slow-Wave Direction and Speed. IEEE Trans. Biomed. Eng 64, 807–815 (2017). [DOI] [PMC free article] [PubMed] [Google Scholar]
- 96.Agrusa AS, Gharibans AA, Allegra AA, Kunkel DC & Coleman TP A Deep Convolutional Neural Network Approach to Classify Normal and Abnormal Gastric Slow Wave Initiation From the High Resolution Electrogastrogram. IEEE Trans. Biomed. Eng 67, 854–867 (2020). [DOI] [PubMed] [Google Scholar]
- 97.Hyams JS et al. Childhood Functional Gastrointestinal Disorders: Child/Adolescent. Gastroenterology 150, 1456–1468.e2 (2016). [Google Scholar]
- 98.Ruenruaysab K et al. Effects of Anatomical Variations on Body Surface Gastric Mapping. Conf. Proc. IEEE Eng. Med. Biol. Soc 2020, 2388–2391 (2020). [DOI] [PubMed] [Google Scholar]
- 99.Schamberg G et al. Revised spectral metrics for body surface measurements of gastric electrophysiology. medRxiv 2022.07.05.22277284 (2022). [DOI] [PubMed]
- 100.Familoni BO, Bowes KL, Kingma YJ & Cote KR Can transcutaneous recordings detect gastric electrical abnormalities? Gut 32, 141–146 (1991). [DOI] [PMC free article] [PubMed] [Google Scholar]
- 101.Abell TL & Malagelada JR Electrogastrography. Current assessment and future perspectives. Dig. Dis. Sci 33, 982–992 (1988). [DOI] [PubMed] [Google Scholar]