

Abstract
Glioblastoma (GBM) is an immunologically “cold” tumor that does not respond to current immunotherapy. Here, we demonstrate a fundamental role for the α-isoform of the catalytic subunit of protein phosphatase-2A (PP2Ac) in regulating glioma immunogenicity. Genetic ablation of PP2Ac in glioma cells enhanced double stranded DNA (dsDNA) production and cGAS-type I interferon (IFN) signaling, MHC-I expression, and tumor mutational burden. In co-culture experiments, PP2Ac deficiency in glioma cells promoted dendritic cell (DC) cross presentation and clonal expansion of CD8+ T cells. In vivo, PP2Ac depletion sensitized tumors to immune checkpoint blockade and radiotherapy treatment. Single cell analysis demonstrated that PP2Ac deficiency increased CD8+ T cell, NK cell, and DC accumulation and reduced immunosuppressive tumor associated macrophages. Furthermore, loss of PP2Ac increased IFN signaling in myeloid and tumor cells and reduced expression of a tumor gene signature associated with worse patient survival in TCGA. Collectively, this study establishes a novel role for PP2Ac in inhibiting dsDNA-cGAS-STING signaling to suppress anti-tumor immunity in glioma.
Introduction
Despite ongoing improvements in surgery, radiation, and chemotherapy, GBM has a 5-year survival less than 5% and a median survival less than 15 months(1). More effective therapies are needed. Immune checkpoint blockade, including anti-PD1/PDL1 and anti-CTLA4, have been approved for multiple cancers but have not demonstrated clinical efficacy in GBM(2,3). Low immunogenicity of GBM with minimal MHC-I expression and paucity of T cells infiltration are major barriers for effective immune checkpoint blockade(4–7).
PP2A is composed of a catalytic (C), regulatory (B) and scaffolding (A) subunit. PP2A is a major protein phosphatase that account for 50% to 70% of the total serine/threonine phosphatase activity in eukaryotic cells to counterbalance the regulatory effects of kinases in modulating signaling pathways that underlie normal physiology and pathobiology of cancer and other diseases(8,9). We and others have demonstrated that inhibiting PP2Ac in tumor cells can impair DNA damage response(10–12). However, prior studies using immunocompromised models failed to address if PP2Ac inhibition alters antitumor immunity. Our group was the first to report that pharmacological inhibition of the PP2Ac enhances the efficacy of immune checkpoint blockade in multiple PD-1-resistant mouse tumor models (13,14). However, given the ubiquity of PP2A expression in many cell types and the involvement of PP2A in many cellular pathways, the mechanisms of how PP2A regulates anti-tumor immunity is unclear.
cGAS is a critical sensor for cytosolic double strand DNA (dsDNA) to activate innate immunity through STING-Type I IFN signaling(15,16). cGAS binding to dsDNA in tumors cells leads to the formation of 2′,3′-cyclic GMP-AMP (cGAMP). cGAMP can activate STING in tumor cells or can be exported as an “immunotrasmitter” to activate STING in DC and tumor associated myeloid cells (17,18). STING activation induces phosphorylation of interferon regulatory factor 3 (IRF3) to promote Type I IFN production and anti-tumor immune responses(19). Here, using SB28, a glioma model with low tumor mutational burden, MHC-I expression, and resistance to immune checkpoint blockade (20), we found that PP2A deficiency can unleash a CD8+ T cell–dependent antitumor immune response and sensitizes tumor to checkpoint immunotherapy. Mechanistically, glioma specific PP2A deficiency promotes accumulation of cytosolic dsDNA and cGAMP production, which in turn stimulate IFN signaling in both tumor and immune cells to remodel the immunosuppressive tumor microenvironment. Our results add to accumulating evidence that PP2A inhibition represent a promising novel strategy for anti-tumor immunotherapy. However, this study is the first to establish a role for PP2A in regulating cytosolic dsDNA production to mediate STING signaling activation.
Materials and Methods
Cell Lines
Mouse glioma cell line SB28 (RRID: CVCL_A5ED) was kindly provided by Dr. Hideho Okada of UCSF. Mouse GL261 (RRID: CVCL_Y003) glioma cell line was kindly provided by Dr. Zhengping Zhuang of the National Institutes of Health. Human SF8628 (RRID:CVCL_IT46) diffuse intrinsic pontine glioma (DIPG) cell line glioma cell line was purchased from Millipore Sigma. Human medulloblastoma cell line D425 (RRID:CVCL_1275) was provided by Dr. Samuel Cheshier of University of Utah. All cell lines were regularly examined (every 6–12 months) for mycoplasma contamination (IDEXX, Clongen Laboratories, or Invivogen), last tested 03/2023. SB28 and SF8628 are maintained in DMEM with 10% FBS. GL261 cells are maintained in RPMI 1640 with 10% FBS. D425 cells were plated in neural stem cell expansion medium (NSCEM) consisting of Neurobasal (-A) (Invitrogen), B27 (-A) (Invitrogen), human-bFGF (20 ng/ml) (Shenandoah Biotech), human-EGF (20 ng/ml) (Shenandoah Biotech), human recombinant LIF (Shenandoah Biotech), and heparin (10 ng/ml). All cells were maintained at 37 °C under 5% CO2. Cells were passaged for not longer than 3 weeks from thawing to collection for experiments.
Animals
All animal work was approved by the Institutional Animal Care and Use Committee at the University of Texas at Austin and University of California San Francisco. Mice of both sexes, between the ages of 6–10 weeks of age were used for the study. C57BL/6 (RRID:MGI:2159769) were obtained from Jackson Laboratory. All mice are maintained under pathogen-free conditions.
In vivo experiments
For orthotopic brain tumor models, 8–10-week-old C57BL/6 mice (male and female in equal numbers) were used for intracranial studies. Cell lines were suspended in DMEM for inoculation. Mice were anaesthetized with isoflurane and 30,000 tumor cells injected orthotopically in 3 uL. Using a stereotactic frame, a burr hole was formed on the skull via 0.7 mm drill bit 1.5mm laterally to the right and 1.5mm rostrally from the bregma, and a non-coring needle (Hamilton 7804–04, 26s gauge) was used to inject the cells at a depth of 3 mm into the brain from the burr hole. Skin incision was sutured. Mice were then monitored daily. Survival endpoint was defined as weight loss greater than 20% relative to baseline, body conditioned score less than 2 or presence of focal neurological deficits. For radiotherapy, 4 days after implantation, mice head was focally irradiated with an X-ray radiator (MultiRad 350, Precision), with 4Gy daily for 2 consecutive days (4 × 4Gy). Lead shield was applied to cover the mice except the cranium to achieve local radiation to the brain.
Flow cytometry analysis (FACS)
Cells were trypsinized and washed with FACS buffer (PBS, 2%FBS, 1 mM EDTA). Surface staining was performed by adding the surface antibodies to the cell suspension in 100 μl FACS buffer. After incubating for 30 min, cells were washed with FACS buffer and analyzed using the Cytek Aurora cytometer and analyzed using SpectroFlo (Cytek Bioscience) and FlowJo software (RRID:SCR_008520). For intracellular phospho-staining, cells were washed and resuspended in 4% formaldehyde for 15 mins then in ice for 10 mins with chilled 100% methanol. Cells were then stained for phospho-protein.
DC –SB28-OVA Coculture
Bone marrow derived dendritic cells (BMDC) were derived as previously described(21). Briefly, mouse bone marrow cells were isolated from C57BL/6 mice and cultured in complete RPMI-1640 media with 50 uM of β-mercaptoethanol (BME) and recombinant murine GM-CSF (20 ng/mL) (Peprotech) for 8 days. 50K BMDC were plated with 250K of either WT or PP2A KO SB28 OVA cells in a 12 well plate. After 24 hours of incubation, the dendritic cells were collected for flow cytometry analysis.
Cell Cycle Analysis
Click-iT EdU Alexa Fluor 647 Flow Cytometry Assay Kit (Thermo Scientific, C10424) was used per manufacture’s instruction. EdU was incubated with cells for 2 hours prior to analysis by flow cytometry. DNA content was counterstained using FxCycle Violet (Thermo Scientific, F10347).
Tumor Proliferation Assay
Electrical impedance was measured every 30 min over 72 hours and normalized to the starting value (normalized cell index). For the data analysis, the time-points from when the signal is stable (after cell seeding or drug treatment) to 72 hours was used on the xCELLigence RTCA Software Pro (ACEA Biosciences Inc.).
T cell Proliferation Assay
BMDC was differentiated in the same manner as above. Splenocytes from OT-I mouse were harvested and CD8+ T cell were isolated using column-based magnetic cell isolation (Miltenyi Biotec). CD8+ cells were stained with cell trace violet (Thermo Scientific) before cultured with BMDC and either WT or PP2AKO-OVA tumor at a ratio of 5:1:1 (CD8+: BMDC: Tumor). After 48 hours, suspension cells were collected for flow cytometry analysis.
T-cell Intracellular Straining Assay
Splenocytes from OT-I mouse were harvested and CD8+ T cell were isolated using column-based magnetic cell isolation (Miltenyi Biotec). 2 × 10⁶ CD8+ cells were then plated with IL2 (50 ng/mL) and 25 uL of CD3/CD28 Dynabeads (Gibco). After 3 days, CD8 cells were plated with the WT or PP2AKO-OVA SB28 tumors at a ratio of 1:1, 1:5, and 1:10 (tumor: CD8). After 1 hour, Brefeldin A (Invitrogen) was added and after another 5 more hours, the cells were stained underwent surface staining for CD8+ and were then washed and resuspended in IC Fixation Buffer (Thermo Scientific) at room temperature for 20 mins then wash with Perm/Wash buffer (Thermo Scientific) before being stained for IFNγ and collected for flow cytometry analysis.
HMGB Assay
50K of SB28 or GL261 cells were plated in 96 well plate in 100uL of medium. After 24 hours, supernatant was collected. For LB-100 treatment, cells were first treated with a dose titration of LB-100 and 3 hours later supernatant was collected. HMGB in the supernatant was quantified using Lumit HMGB1 Human/Mouse Immunoassay kit (Promega, W6110) per manufacture’s instruction.
PP2A Phosphatase Assay
PP2A Phosphatase Assay Kit (Millipore) was used according to the manufacturer’s instructions. Briefly, using the same amount of starting protein lysate for each condition, PP2A was immunoprecipitated using Anti-PP2A, C subunit (clone 1D6, Millipore) and Protein A agarose slurry. The slurry was then washed with TBS before a standard amount of threonine phosphopeptide, a substrate of PP2A, was added to the mixture. Phosphate was released as a product of the reaction. The absolute amount of phosphate released was quantified with malachite green solution, which was used as a measure of PP2A activity. Experiments were performed in triplicate, and the data are presented as a percentage mean of relative PP2A activity compared with control ± SEM.
Real time PCR
Total RNA was extracted using PureLink™ RNA Mini Kit (Invitrogen, 12183025) according to the manufacturer’s instructions. cDNA synthesis was performed with 0.5~1 μg of total RNA using High-Capacity cDNA Reverse Transcription Kit (Invitrogen, 4374967). mRNA levels were measured with gene-specific primers using the SYBR™ Green PCR Master Mix (BioRad, 1725120). The results were normalized to GAPDH or OAZ in human or mouse samples respectively. The primers used are shown in Table S1.
Immunofluorescence staining
For CD8 and CALR visualization in mouse SB28 tissue collected at survival endpoint. Frozen tissue sections on slides were set at room temperature, then fixed with 4% paraformaldehyde followed by washing with PBSx2, and then permeabilized with PBST (0.25% TritonX-100) and blocked with 10% normal goat serum/PBST for 30 min at room temperature. Samples were then incubated with primary antibodies at 4C overnight in a humid box. After washing the samples with PBST for 5× 10min, secondary antibodies in PBST were added to the sample and incubate for 1 hour. 4,6-diamidino-2-phenylindole (DAPI) (300nM) was used to stain nuclei. Samples were covered with coverslip with mounting medium and sealed with nail polish then subject for imaging using Zeiss confocal microscope. CD8+ cells were quantified by counting the number of CD8 within each field of view. CALR expression was quantified by the MFI of the red channel of the region of interest, Analysis was performed on 3 independent samples per group (n=3) and 3 regions of interest per sample.
Immune blotting and cell surface protein detection
For immunoblot analysis, whole-cell lysates were prepared in RIPA lysis buffer (Thermo Scientific, 89900) containing Halt Protease Inhibitor Cocktail (Thermo Scientific, 78429). The protein concentrations were determined by BCA Protein Assay Kits (Pierce, 23227). 20–30 μg protein samples were mixed with 4x Laemmli buffer (BioRad, 1610747) and denatured at 95°C for 10 minutes. Sample was separated by SDS-PAGE and transferred to nitrocellulose membrane (BioRad, 1704270). Membranes were blocked with 3.5% BSA (Fisher, BP1600) and incubated with primary antibodies overnight at 4°C followed by HRP-conjugated secondary antibodies for 2 hours at room temperature. Signal was detected using Clarity Western ECL (BioRad, 1705061) and captured using the ChemiDoc Imaging System (BioRad). Antibodies were included in the Table S2.
Quantification and statistical analysis
No statistical methods were used to predetermine sample size. For cell-based experiments, biological triplicates were performed in each single experiment in general, unless otherwise stated. Animal experiments were performed in C57BL/6 mice. Animals were randomized into different groups after tumor cell inoculation; at least 9–10 mice were used for each group, unless otherwise indicated. Survival functions were estimated by the Kaplan-Meier methods and compared using the log-rank test or Wilcoxon rank tests as indicated. Two tailed t-test were used to compare treatments vs. control groups. ANOVA models were used to compare continuous outcomes across multiple experimental groups, unless otherwise indicated in each figure legend. Statistical analysis was performed using GraphPad Prism8 software (GraphPad Software, Inc.) (RRID:SCR_002798).
Data and materials availability
Data including total RNA-seq, single-cell RNA-seq are deposited at NCBI GEO GSE213309. Whole exome sequencing have been deposited to SRA and released under access SUB12057901(PRJNA973640). Codes, QC results and supplementary files could be found at Figshare (DOI: 10.6084/m9.figshare.21094390). Publicly available data generated by others were used by the authors includes “Merged Cohort of LGG and GBM” (TCGA, Cell 2016, https://www.cbioportal.org/study/summary?id=lgggbm_tcga_pub). All other raw data generated in this study are available upon request from the corresponding author.
Results
PP2Ac deficiency in glioma cells promotes Type I IFN signaling and MHC-I expression
We previously showed that pharmacologic inhibition of PP2Ac synergizes with PD1 blockade in GL261 murine glioma model(13). However, the underlying mechanism or cell type responsible for the PP2Ac mediated effect on antitumor immunity is unclear. To investigate the effect of PP2Ac deficiency in glioma cells on antitumor immune response, we performed genetic KO of the predominant alpha-isoform of PP2Ac (PPP2CA) by CRISPR in murine SB28. A clone with confirmed protein level knock-out by western blot and frameshift mutations in both allele of PPP2CA by whole exome sequencing (WES) was selected for further experiments (Fig. S1A–B). Compared to GL261, SB28 more consistently recapitulate the immune-silent nature of human glioma with low mutational burden, minimal MHC-I expression, and resistance to immune checkpoint blockade(20). We obtained global gene expression profile of WT and PP2AcKO cultured SB28 cells using RNAseq. Gene ontology (GO) Pathway analysis using differentially upregulated genes (Log2FC>0.5, FDR<0.01) in PP2AcKO SB28 demonstrated that the top enriched biological pathways are related to Type I IFN signaling and MHC-I antigen processing/presentation (Fig. 1A). Gene set enrichment analysis (GSEA) confirmed that Type I IFN response pathway was enriched in PP2AcKO SB28 (Fig. 1B). Additionally, we confirmed the transcription of IFNβ and IFN response-related genes to be highly upregulated in PP2AcKO SB28 using RT-PCR (Fig. 1C). Phosphorylation of IRF3, which controls Type I IFN transcription, and phosphorylation of STAT1, which is the direct downstream signaling of IFN-α/β receptor (IFNAR) were both enhanced in PP2AcKO (Fig. 1D and Fig. S1C). Given Type I-IFN has been shown to inhibit glioma proliferation (22), we examined if PP2Ac deficiency will impact tumor proliferation using the xCELLigence platform that provide continuous real-time measurement of cellular viability. PP2AcKO SB28 grew at a significantly lower rate than WT (Fig. 1E). We then performed cell cycle analysis that showewd PP2AcKO cells have decreased S and increased G0 and G2/M phases (Fig. 1F), suggesting that PP2AcKO cells have enhanced cell cycle arrest. We then asked if increased cell death or apoptosis also contributed to decreased viability. We found no significant change in frequency of apoptosis marker, Annexin V (Fig. 1G). Given the enhanced IFN signaling, a known marker of immunogenic cell death (ICD), we asked if PP2AcKO tumors had increase in other markers of ICD (23). Calreticulin (CALR) when exposed on plasma surface facilitate phagocytosis by dendritic cells (DCs) and in turn antigen uptake and presentation(23). CALR expression was significantly enhanced in PP2AcKO SB28 (Fig. 1H–I). Another ICD marker, High-mobility group box 1(HMGB1), when secreted, activate innate immune cells via TLR4-MYD88 signaling(23). We quantified HMGB1 level in tumor conditioned medium and found marked elevation of HMGB1 secretion by PP2AcKO cells (Fig. 1J). Down regulation of MHC-I in cancer cells is a common mechanism of immune evasion(24) and Type I IFN is known to positively regulate MHC-I expression(25). Consistently, transcription of genes encoding an essential component of MHC-I (β2m), MHC loading machinery (Erap1, Tap 1, Tap2) and transcriptional coactivator of MHC-I (NLRC5) were upregulated in PP2AcKO SB28 (Fig. 1K). Surface presentation of MHC-I was consistently enhanced in PP2AcKO (Fig. 1L). We confirm the generalizability of this observation by generating CRISPR KO of PP2Ac in GL261 murine glioma, SF8628 human diffuse intrinsic pontine glioma (DIPG), and D425 human medulloblastoma cell lines, all of which demonstrated increased MHC-I expression (Fig. 1M and Fig. S1D). Next, we asked if the observed increase in MHC-I expression in PP2AcKO cells is dependent on enhanced IFN signaling. Treatment of PP2AcKO SB28 with anti-IFNAR, which antagonizes Type I IFN receptor, IFNAR, (Fig. 1N) or ruxolitnib, a janus kinase (JAK) inhibitor (Fig. S1E) that blocks JAK/STAT1 activity downstream of IFNAR, reduced MHC-I expression to level close to WT. In addition, the enhanced expression of IFN-related genes in PP2Ac deficient tumor was also reversed by anti-IFNAR treatment (Fig. 1O). To confirm these mechanistic findings are not limited to SB28, we showed that PP2A deficiency in GL261 similarly resulted in decreased cellular proliferation (Fig. S2A), increased pIRF3 and pSTAT1 (Fig. S2B), enhanced IFN stimulated genes (Fig. S2C) that is dependent on IFNAR signaling (Fig. S2D).
Fig. 1. PP2A deficiency in glioma cells promote Type I IFN signaling, ICD and MHC-I expression.

(A) WT and PP2AcKO SB28 transcriptome profiles were analyzed by RNAseq of (n=3 per group). GO Pathway enrichment analysis showing the top 10 enriched pathways ranked with highest fold enrichment using differentially upregulated genes in PP2AcKO compared to WT SB28 (Log2FC>0.5, FDR<0.01). * indicate p-value of individual pathway. P value adjustment was performed using Bonferroni correction. (B) Gene set enrichment analysis (GSEA) plots for Type I IFN signature among PP2AcKO vs WT SB28. NES: Normalized Enrichment Score. (C) WT and PP2AcKO SB28 expression of IFN-related genes were measured via RT-qPCR (D) WT and PP2AcKO SB28 protein expression of pSTAT1 and pIRF3 were analyzed by immunoblotting. (E) Time course of XCelligence assay showing the normalized cell index over 30 h of the assay for WT and PP2AcKO SB28. Each time-point measurement was from n = 4 biological replicates. (F) Cell cycle analysis of WT and PP2AcKO SB28 cells. Representative plots of DNA vs. EDU content. EDU positivity was used to identify S-phase, while DNA content was used to distinguish G0/1 and G2M phase. * indicate level of significance for difference between WT and PP2AcKO..(G) The expression of apoptosis marker, Annexin V, in WT and PP2AcKO SB28 was determined by flow cytometry. (H-I) Expression of ICD marker CALR. In WT and PP2AcKO SB28 was determined by flow cytometry (I) and immunofluorescence staining for CALR (red) and nucleus (4,6-diamidino-2-phenylindole (DAPI), blue). Scale bar, 20 μm.. (J) Conditioned medium was collected from WT and PP2AcKO SB28 cultures after 3 hours. Secreted HMGB levels were quantified using ELISA. (K) WT and PP2AcKO SB28 expression of MHC-I components and antigen-presenting machinery genes were measured via RT-qPCR. (L) WT and PP2AcKO SB28 surface expression of MHC-I were determined by flow cytometry. (M) Surface expression of MHC-I in WT and PP2AcKO GL261 (murine glioma), SF8628 (human DIPG), D425 (human medulloblastoma) were determined by flow cytometry. PP2Ac protein expression were analyzed by immunoblotting to confirm downregulation of protein expression. (N) WT and PP2AcKO SB28 were treated with isotype control or anti-IFNAR for 72 hours. Surface expression of MHC-I were then determined by flow cytometry (O) WT and PP2AcKO SB28 were treated with isotype control or anti-IFNAR for 72 hours. Expression of IFN-related genes were measured via RT-qPCR. Heat maps reflect log2FC of indicated gene relative to isotype treated WT SB28. Data for C-O are from at least two independent experiments with similar results. Error bars depict standard error of mean (SEM). P values were calculated by unpaired t-test (**P<0.01, ***P<0.001, ****P<0.0001).
Pharmacologic inhibition of PP2Ac promote ICD and IFN signaling
LB100, a small molecule inhibitor of PP2Ac, is currently under clinical investigations (NCT04560972, NCT03027388). We have previously demonstrated in GL261 orthotopic model that LB-100 synergized with anti-PD1 blockade(13). However, the ubiquity of PP2Ac expression precluded the understanding of what cell type(s) is responsible for the immunogenic effect of LB-100. Our data suggest that tumor intrinsic PP2Ac deficiency is sufficient to promote IFN signaling in vitro. To show the translation relevance of this effect, we asked if LB-100 can reproduce the phenotypes observed in PP2AcKO glioma cells. First, we confirmed the dose-dependent inhibition of PP2Ac activity in WT SB28 by LB-100 relative to PP2AcKO cells (Fig. 2A). The observed “residual” PP2Ac activity in PP2AcKO SB28 is likely attributed to the persistence of the beta isoform of the PP2Ac (PPP2CB) that is not distinguished by the immunoprecipitation technique used for the assay. Using the xCELLigence platform, we found that WT SB28 was sensitive to LB-100 treatment resulting in a dose-dependent decrease in cell viability (Fig. 2B–C) within several hours of drug treatment. We also found that LB-100 induced ICD in a dose-dependent fashion, with increased expression of CALR (Fig. 2D) and secretion of HMGB (Fig. 2E). Similarly, the phosphorylation of STAT1 (Fig. 2F), transcription of IFN stimulated genes (Fig. 2G), and surface expression of MHC-I (Fig. 2H) were all enhanced by LB-100. We confirmed these are similarly observed in GL261 cells (Fig. S2D–G).
Fig. 2. Pharmacologic inhibition of PP2Ac, using LB-100, in glioma promote ICF, Type I IFN signaling, ICD and MHC-I expression.

(A) LB-100 treated WT SB28 with indicated concentration for 3 hours and PP2AcKO SB28 were assessed for PP2A activity measured using phosphatase assay and expressed as ratio relative to untreated WT SB28. (B) Time course of XCelligence assay showing the normalized cell index following LB-100 treatment in WT SB28 cells at indicated concentrations. Each time-point measurement was from n = 4 biological replicates.(C) The relative normalized cell index 3 hour after LB-100 treatment at indicated concentrations compared to untreated WT SB28. (D) LB-100 treated WT SB28 with indicated concentration for 3 hours and PP2AcKO SB28 were assessed for surface CALR expression by flow cytometry. (E) Conditioned medium from LB-100 treated WT SB28 with indicated concentration for 3 hours and PP2AcKO SB28 were assessed for HMGB secretion using ELISA. (F) LB-100 treated WT SB28 with indicated concentration for 72 hours and PP2AcKO SB28 were assessed for p-STAT1 expression by flow cytometry. (G) LB-100 treated WT SB28 with indicated concentration for 72 hours and PP2AcKO SB28. Expression of IFN-related genes were measured via RT-qPCR. Heat maps reflect log2FC of indicated gene relative to isotype treated WT SB28. (H) LB-100 treated WT SB28 with indicated concentration for 72 hours and PP2AcKO SB28 were assessed for MHC-I expression by flow cytometry.All data from at least two independent experiments with similar results. Error bars depict standard error of mean (SEM).
PP2Ac deficiency in glioma cells promote tumor associated antigen (TAA) expression, TAA-specific CD8+ T cell cytotoxicity and dendritic cell (DC) cross presentation
Type I IFN is known to promote DC activation (26,27). Given the increased expression of IFN-stimulated genes in PP2AcKO glioma cells, we asked if they are more efficient in activating DC. We generated WT and PP2AcKO SB28 cells expressing ovalbumin (OVA) and co-cultured WT or PP2cKO SB28 cells with bone marrow derived dendritic cells (BMDC). BMDC co-cultured with PP2AcKO SB28 compared to WT has increased expression of activation markers, including MHC-II, MHC-I and CD86 on BMDCs (Fig. 3A). Moreover, they also had increased expression of OVA-H2Kb (SIINFEKL) (Fig. 3A), which is an OVA peptide fragment presented on MHC-I of DC after phagocytosis of tumor. Expression of SIINFEKL on DC is an indication of cross presentation, suggesting that tumor PP2A deficiency can promote DC activation of TAA specific CD8+ T cells. Expression of activation markers was similarly enhanced in BMDC co-cultured with non-OVA expressing SB28 or GL261 glioma cells (Fig. S3A–C). Next, we asked if this enhanced activation of DC is cell-contact dependent by performing co-culture in a trans well insert. We similarly found an increase in activation of DC cells (Fig. 3B), suggesting soluble factors secreted by tumor cells contributed to the promotion of DC activation.
Fig. 3. PP2A deficiency in glioma cells promote expression of tumor associated antigen (TAA), TAA-specific CD8+ T cell cytotoxicity and DC activation.

(A) BMDC was co cultured with WT or PP2AcKO SB28-OVA with a ratio of 1:5 for 24 hours. Surface expressions of SIINFEKL, CD86, MHC-I, and MHC-II were then determined by flow cytometry. (Diagram created with BioRender.com) (B) BMDC was co cultured with WT or PP2AcKO SB28 using a transwell insert with a ratio of 1:5 for 24 hours. Surface expressions of CD86, MHC-I, and MHC-II were then determined by flow cytometry. (Diagram created with BioRender.com) (C) WT and PP2AcKO SB28-OVA expression of OVA-H2Kb (SIINFEKL) were determined by flow cytometry. (D-F) CD8 T cells were isolated from splenocytes of OT-I mice and then activated by CD3/CD28 beads and IL2 (50 ng/ml) for 72 hours. Activated T cells were then: (E) co-cultured with WT and PP2AcKO SB28-OVA cells using 3 different Effector:Target ratios. After 24 hours, the percentage of dead tumor cells (CD45-DAPI+) were quantified via flow cytometry; (F) co-cultured with WT and PP2AcKO SB28-Ova cells with a E:T ratio of 1:1 for 6 hours in the presence of Brefeldin A (5ug/ml) for the last 5 hours. Intracellular staining was then performed and the percentages of IFNγ+ CD8+ T cells were quantified using flow cytometry. (G) BMDC was co cultured with WT or PP2AcKO SB28 and naïve OT-I CD8 T cells at a ratio of (1:5:1). CD8 T cells were pre-stained with cell trace violet (CTV). 48 hours later, proliferation of CD8 T cells were quantified by analyzing the dilution of CTV using flow cytometry. Division index was calculated using Flowjo software. Representative FACS plots of CTV on CD8+ OT-I T cells. Data are from one experiment representative of at least two independent experiments with similar results. Error bars depict SEM. P values were calculated by unpaired t-test (**P<0.01, ***P<0.001, ****P<0.0001).
Next, we investigated whether enhanced MHC-I expression in PP2Ac deficient glioma impacts tumor killing by TAA-specific CD8+ T cells. We first confirmed that PP2AcKO SB28 cell have increased expression of OVA-H2Kb (SIINFEKL) (Fig. 3C). Then, we tested if PP2Ac deficiency mediated enhanced MHC-I expression is functionally relevant for TAA-specific CD8+ T-cell cytotoxicity by incubating WT or PP2AcKO SB28-OVA cells with OT-I T cells pre-activated by CD3/CD28 beads (Fig. 3D). We found a significant increase in OT-I T cells mediated killing against PP2AcKO SB28-OVA cells (Fig. 3E) across a range of Effector:Target (E:T) ratios. The percentage of IFNγ producing OT-I T-cells were also significantly enhanced when OT-I T-cells were co-cultured with PP2AcKO SB28 (Fig. 3F), suggesting that PP2AcKO SB28 cells were more susceptible to TAA-specific T-cell cytotoxicity. Given the enhanced activation of BMDC primed by PP2Ac deficient tumors, (25,26), we tested the ability of tumor-primed BMDC to activate naïve CD8+ OT-I T cells by co-culturing BMDC, WT or PP2AcKOSB28-OVA tumors and naïve CD8+ OT-I T cells labelled with Cell Trace Violet (CTV) dye. BMDC primed by PP2AcKO tumor significantly enhanced OT-I CD8+ cells proliferation (Fig. 3G). Collectively, these data showed that PP2Ac deficiency in glioma cells enhances TAA presentation on MHC-I, promotes DC maturation and cross-presentation of TAA-specific antigen to activate naïve CD8+ T cells and increases susceptibility to TAA-specific T cell mediated killing.
PP2Ac deficiency enhances survival of glioma tumor bearing mice and sensitizes checkpoint therapy
We next examined the effect of PP2Ac deficiency in glioma cells in vivo by orthotopically implanting WT or PP2AcKO tumors in C57BL/6 mice. Survival was significantly prolonged in mice bearing PP2AcKO compared to WT SB28 in both SB28 and GL261(Fig. 4A–B). We first examined the degree of CD8+ T cells infiltration in the tumor microenvironment. At survival endpoint, tumors were stained for CD8 T cells by immunofluorescence. We found a significant increase in tumor infiltrating CD8+ T cells in PP2AcKO tumors (Fig. 4C). Given the increased abundance of tumor infiltrating CD8+ T cells, we asked if they are required or contributed to the prolonged survival of PP2AcKO glioma bearing mice. We performed systemic CD8+ T cell depletion by treating with isotype or anti-CD8 depleting antibody prior to tumor implantation and throughout the study. CD8 depletion significantly diminished, but did not completely abolish, the survival benefit of PP2Ac deficiency, suggesting that CD8-mediated adaptive immune response contributed to but is not completely responsible for the beneficial effects of PP2Ac deficiency (Fig. 4D). Since we have previously showed that tumor intrinsic Type I IFN signaling promoted MHC-I expression and other IFN-stimulated genes, we tested if PP2Ac deficiency-mediated enhanced survival is dependent on IFN signaling by systemic blockade of IFNAR. Abrogation of Type I IFN signaling completing reversed the survival benefit of PP2Ac deficiency (Fig. 4E). Given we observed a significant increase in ICD in vitro (Fig. 1H), we asked if this is similarly observed in vivo. Tumors harvested from mice in Fig. 4E at survival endpoint was stained for CALR by immunofluorescence. We found a significant increase in CALR expression in PP2AcKO tumors (Fig. 4F), which is abolished when mice were treated with anti-IFNAR (Fig. 4F). This suggests that PP2Ac deficiency promoted ICD in a Type I IFN dependent manner. Next, we asked if PP2Ac deficiency sensitizes mice to checkpoint blockade. We treated tumor-bearing mice with isotype or combined anti-CTLA4/PD1 blockade. While dual checkpoint blockade marginally increased median survival of animals bearing WT SB28, it dramatically prolonged survival of mice with PP2AcKO SB28. In addition, rate of mice with complete response (CR) were strikingly increased from 10% to 80% (Fig. 4G). We then asked if CR mice from PP2AcKO tumors carry immunologic memory against WT and PP2AcKO SB28 tumors by re-challenging CR mice by implanting WT and PP2AcKO SB28 simultaneously in the left and right flank respectively (Fig. 4H). We found that CR mice had protective immunity against PP2AcKO SB28 and partial immunity against WT SB28. PP2AcKO SB28 was unable to grow in cured mice while WT SB28 grew to smaller sizes in CR mice than in naïve mice (Figure 4H and Fig. S4A–C). These data indicate that PP2Ac deficient glioma cured by checkpoint blockade can elicit adaptive memory antitumor immunity. However, the fact that memory immunity against WT tumors was incomplete suggests that WT tumors can evade immunosurveillance despite shared neoantigens with PP2AcKO tumors.
Fig. 4. PP2A deficiency enhances survival of glioma tumor bearing mice and sensitizes checkpoint therapy.
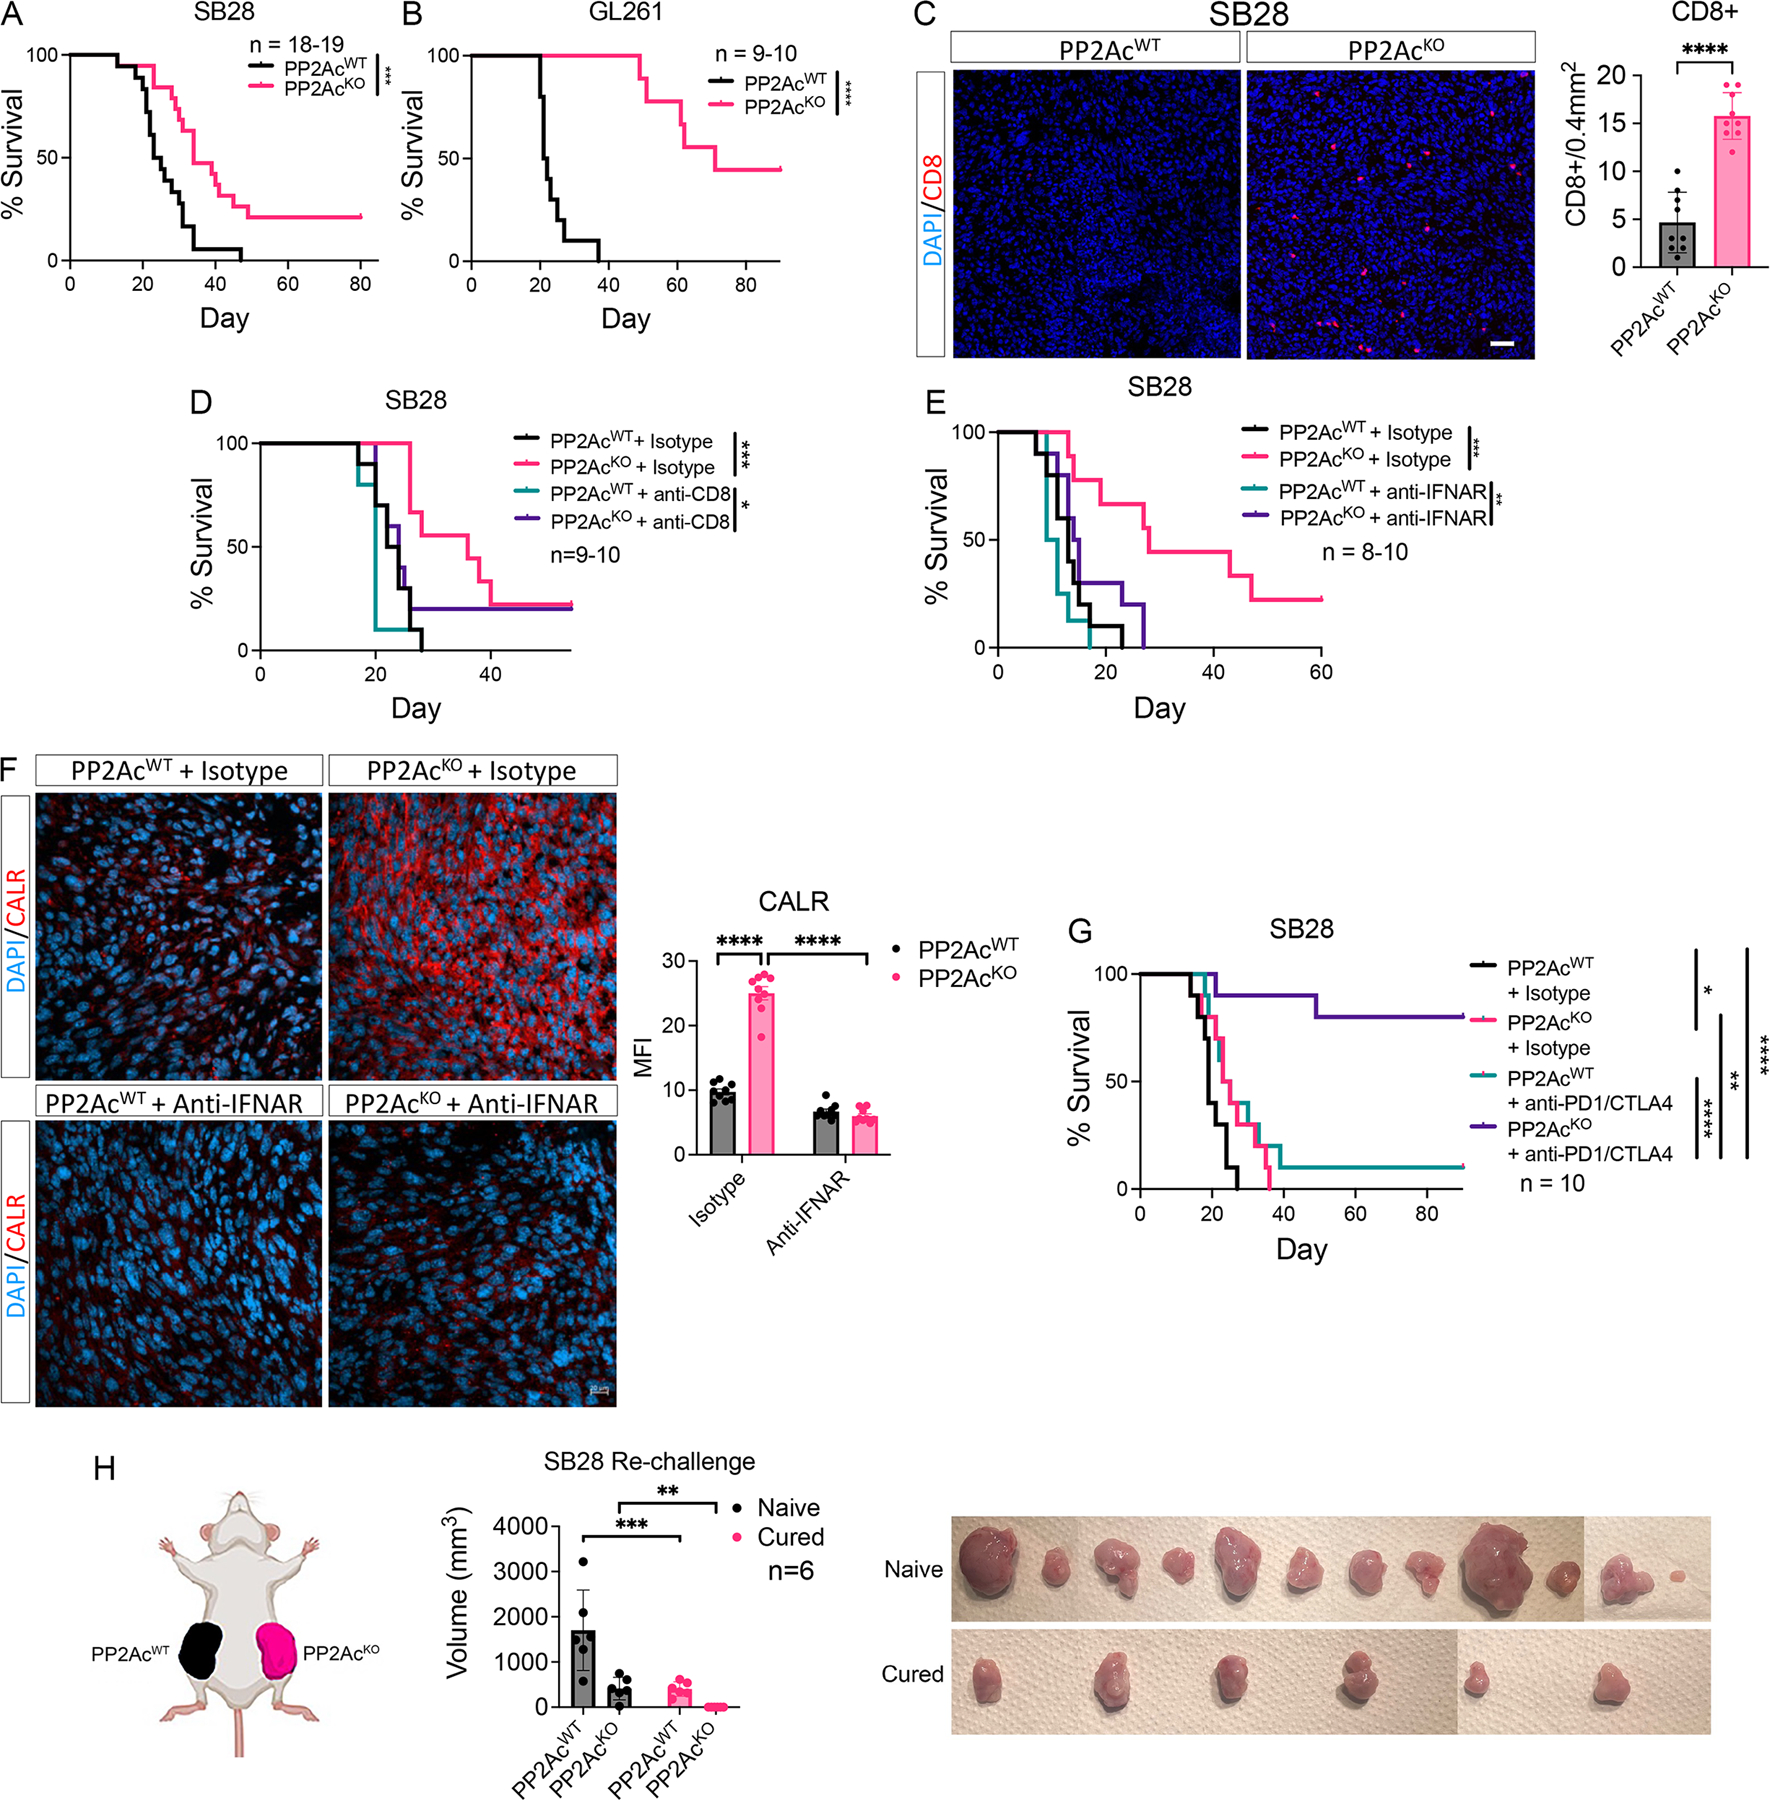
(A) C57BL/6 mice were inoculated with 3 × 10⁴ WT or PP2AcKO SB28 cells in the brain. (n=18–19). Cumulative survival over time. (B) C57BL/6 mice were inoculated with 5 × 10⁴ WT or PP2AcKO GL261 cells in the brain. (n=9–10). Cumulative survival over time. (C) At survival endpoint, WT or PP2AcKO SB28 tumors were harvested, and histological analysis performed staining for CD8 (red) and nucleus (DAPI, blue). Scale bar, 10 μm. 9 total regions from 2 tumor samples were used for quantification. (D) C57BL/6 mice were treated with anti-CD8 (clone 2.43) depletion antibody or isotype control (rat IgG2B). Mice were given 250 μg i.p. on day −3, −2, −1 then inoculated with 3×10⁴ WT or PP2AKO SB28 cells in the brain (day 0). Depleting antibody or isotype was then given 2x/week until endpoint. (n=9–10). Cumulative survival over time. (E) C57BL/6 mice were inoculated with 3×10⁴ WT or PP2AcKO SB28 cells in the brain. On day 0, mice were randomized to treatment with isotype (mouse IgG1) or anti-IFNAR(MAR1-5A3) blocking antibody (200µg/mouse). Treatment was continued 2x/week until end point (n=8–10). Cumulative survival over time. (F) At survival endpoint, WT or PP2AcKO SB28 tumors treated with isotype or anti-IFNAR were harvested, and histological analysis performed staining for CALR (red) and nucleus (DAPI, blue). Scale bar, 20 μm. 3 regions from each sample and 3 tumor samples were used for quantification. MFI of the red channel was used to quantify CALR staining. (G) C57BL/6 mice were inoculated with 3×10⁴ WT or PP2AcKO SB28 cells in the brain. At day 5, mice were randomized to treatment with isotype (hamster IgG + rat IgG2a) or anti-PD1(RMP1-14) + anti-CTLA4 (9H10) blocking antibody (250µg/mouse, 2x/week for 5 weeks). Cumulative survival over time. (H) C57BL/6 mice inoculated with PP2AcKO SB28 tumors and cured by treatment with anti-PD1+anti-CTLA4 were rechallenged by subcutaneous injection of 6×10⁵ WT and PP2AcKO SB28 tumors in the left and right flank respectively. Naïve C57BL/6 mice were used as control. Tumor volume of both WT and PP2AcKO SB28 were measured 20 days after implantation in naïve and cured mice. Tumors were harvested and photographed. No tumor was grossly noted in cured mice re-challenged with PP2AcKO SB28 tumors. Wilcoxon rank tests were used for survival analysis. Error bars depict SEM. P values were calculated by unpaired t-test for (C-D) and one-way ANOVA with Tukey’s multiple comparison test for (H). (*< 0.05, **P<0.01, ***P<0.001, ****P<0.0001). Data are from two experiments and combined in (A). Data are representative of one independent experiment (B-H).
PP2Ac deficiency increases tumor mutational burden, promotes cytoplasmic DNA accumulation and cGAS-STING activation
PP2A is known to play a role in modulating DNA damage repair (DDR)(11,12,28,29). A recent study demonstrated that inactivation of a PP2A scaffolding subunit promotes microsatellite instability in colon cancer(30). We asked if increased antigenicity by enhanced neoantigen production contributed to increased immunogenicity in PP2AcKO SB28 by analyzing the mutational landscape of WT and PP2AcKO SB28 using WES. We identified a significant increase in tumor mutational burden (TMB) attributed to new missense mutations in PP2AcKO cells (Fig. 5A). Frequency of frameshift and inframe deletion was unchanged (Fig. S5A). In addition, we ran algorithms to predict peptide binding to MHC-I or MHC-II to estimate potential neoepitope formation and found a significant increase in neoepitopes for MHC-I and MHC-II in PP2AcKO SB28 (Fig. 5B and Fig. S5B). These data suggest that PP2Ac deficiency, likely through its impact on DDR, promotes TMB and in turn neoantigen formation to enhance tumor antigenicity. We confirmed that PP2Ac deficient glioma cells harbor increased unrepaired double stranded DNA breaks in the nucleus by quantifying phosphorylated γH2x in SB28 (Fig. 5C–D) and GL261 cells (Fig. S6A–B). However, our in vitro data using OVA-OTI model showed that PP2Ac deficiency could enhance DC priming and OVA-specific T-cell cytotoxicity, suggesting that tumor immunogenicity is enhanced not solely by the promotion of neoantigen formation. Our group and others have previously shown that PP2Ac is critical in regulating G2/M transition, and PP2A inhibition in combination with DNA-damaging treatment (such as chemotherapy or radiation) can promote aberrant entry into mitosis resulting in cell death by mitotic catastrophe (10–12,28,31,32). It has also been shown that mitotic progression following DNA damage can promote micronuclei formation to induce cGAS-STING-IFN activation(33). We therefore hypothesize that PP2Ac deficiency can promote activation of cGAS-STING-Type I IFN by promoting accumulation of cytosolic dsDNA. We measured the level of dsDNA in the cytoplasmic fraction of WT and PP2AcKO SB28, GL261 and D425 cells and found a significant increase in dsDNA accumulation in PP2AcKO tumor cells (Fig. 5E). We confirmed this using immunofluorescence staining of dsDNA in SB28 (Fig. 5F) and GL261 (Fig. S6C). Next, we asked if enhanced cytosolic accumulation of dsDNA translates into increased production of cGAMP, which can be exported by tumor cells as “immunotransmitter” and be taken up by host antigen presenting cells, such as macrophages and DC, to activate STING to produce Type I IFN(17,18). We measured cGAMP in whole cell lysate of WT and PP2AcKO SB28, GL261 and D425 cells and found cGAMP production to be enhanced in PP2Ac deficient tumors (Fig. 5G). This is consistent with our co-culture experiment that showed PP2Ac deficiency could promote DC activation in a contact independent fashion (Fig. 3B), as cGAMP can be exported by tumor to activate immune cells. To determine if the increase in IFN signaling in PP2AcKO tumors is dependent on cGAS, we generated PP2Ac/cGAS double KO (dKO) SB28 cells. We found the promotion of IFN signaling in PP2AcKO SB28 as assessed by protein expression of p-IRF3 and p-STAT1 was markedly reduced in dKO SB28 compared to PP2AKO SB28 cells (Fig. 5H). We also found a host of overexpressed IFN simulated genes in PP2AcKO to be significantly decreased in dKO SB28 (Fig. 5I). These data suggest that PP2Ac deficiency promotes Type-I IFN signaling in a cGAS dependent fashion.
Fig. 5. PP2Ac deficiency promotes cytoplasmic DNA accumulation and cGAS-STING activation.

(A-B) Whole exome sequencing (WES) was performed on WT and PP2AcKO SB28 cells. Total number of non-synonymous somatic mutations (left) and missense mutations (right) were quantified. (B) Numbers of predicted neoepitopes for MHC-I and MHC-II binding. (C-D) Unrepaired double stranded DNA breaks in the nucleus of WT and PP2AcKO SB28 cells were assessed by: (C) immunofluorescence staining for phosphorylated γH2x (red) and nucleus (DAPI), blue). 15 cells were randomly chosen for quantification. Scale bar, 10 μm; and (D) immunoblotting for protein expression of phosphorylated γH2x in whole cell lysate. (E) Cytoplasmic extract was collected from WT or PP2AKO SB28, GL261 and D425 cells. Double-stranded DNA (dsDNA) normalized to 106 live cells were quantified. (F) WT and PP2AcKO SB28 cells underwent immunofluorescence staining for dsDNA(red) and nucleus (DAPI), blue. Scale bar, 20 μm. (G) Whole cell lysate was collected from WT or PP2AKO SB28, GL261 and D425 cells and cGAMP level measured with ELISA. (H) WT, PP2AcKO, cGASKO and PP2AcKO cGASKO dKO SB28 protein expression of pSTAT1 and pIRF3 were analyzed by immunoblotting. (I) WT, PP2AcKO, cGASKO and PP2AcKO cGASKO dKO SB28 expression of IFN-related genes, MHC-I components and antigen-presenting machinery genes were measured via RT-qPCR. P values indicate comparison between cGASKO and PP2Ac+cGAS dKO. (J) WT and PP2AcKO SB28 cells were radiated with the indicated dose. 24 hours later, cytoplasmic extract was collected and dsDNA/106 live cells were measured. (K) C57BL/6 mice were inoculated with 3×10⁴ WT or PP2AcKO SB28 cells in the brain. At day 4, mice were randomized to sham or focal brain radiation (4Gy on day 4 and day 5 for a total dose of 8Gy). (n=9–10). Cumulative survival over time. Wilcoxon rank tests were used for survival analysis. Error bars depict SEM. P values were calculated by unpaired t-test (**P<0.01, ***P<0.001, ****P<0.0001) for (A,B,C,E,G) and by unpaired one-way ANOVA with Tukey’s multiple comparison test for (I-J). Data are representative of at least two independent experiments with similar results for (C-J). Data are representative of one experiment in (K).
Previous studies demonstrated that radiation could promote antitumor immunity through activation of cGAS-STING signaling by enhancing dsDNA production (34). We therefore asked if PP2Ac deficiency can promote radiation induced dsDNA accumulation and further enhance radiation induced anti-tumor immunity. We radiated WT or PP2AcKO SB28 with increasing dosage (0 to 20Gy) and found that radiation complemented the effect of PP2Ac deficiency in promoting dsDNA production (Fig. 5J). To test this effect in vivo, we orthotopically implanted WT or PP2AcKO SB28 and administered focal brain radiation on post-implant day 4 (4Gy on day 4 and 5 for a total dose of 8Gy). PP2AcKO SB28 tumors were significantly more sensitive to radiation, achieving 50% durable response compared to 0% in WT (Fig. 5K). These data suggest that PP2Ac deficiency in tumor cells can synergize with radiation therapy.
scRNA-seq analysis reveals glioma specific PP2Ac deficiency remodeled immune compartment of the tumor microenvironment
To explore how glioma PP2Ac deficiency re-shapes the tumor microenvironment in vivo, we performed scRNA-seq of WT and PP2AcKO SB28 murine glioma after orthotopic implantation. Tumors were harvested on post-implant day 18 and disaggregated. Tissues from 3 mice were pooled for each condition and the whole cell content was analyzed by scRNAseq. Unsupervised clustering and uniform manifold approximation and projection (UMAP) analyses were performed on 15,448 cells (Fig. 6A). Immune cells were segregated by the expression of CD45+ and tumor cells by expression of GFP. We utilized the Seurat package to perform fine clustering (Fig. S7 and Data S1). PP2Ac deficiency in glioma cells distinctly remodeled both the tumor and immune compartments (Fig. 6B). We first focused on the effect of glioma PP2Ac deficiency on immune cells. We utilized gene expression of canonical markers to classify CD8+T cells (CD3+CD8b1); CD4+T cells (CD3+CD4+); NK cells (NKG7+CD3-); Macrophages (TAMs) (CD11b+CD11c-); Dendritic cells (DC) (CD11b+CD11c+) (Fig. S8A). The DC population was further subclassified into conventional type 1 DC cDC1 (CD11c+, CD103+), which is critical for antigen cross-presentation. We found the frequency of CD8 T cells, NK cells and cDC1 cells increased 3.8–5.5 fold in PP2AcKO tumors (Fig. 6C and Fig. S8B). The infiltration of T cells, NK and cDC1s in human cancers has each been associated with improved prognosis and response to immunotherapy (35–37). Consistent with PP2Ac deficient tumors being more sensitive to checkpoint blockade, we found an increase in expression of PD1 in T cells and PD-L1 in tumor and myeloid cells of PP2AcKO tumors (Fig. S8C)(38).
Fig. 6. scRNA-seq analysis reveals tumor-specific PP2Ac deficiency remodeled immune compartment of the tumor microenvironment.
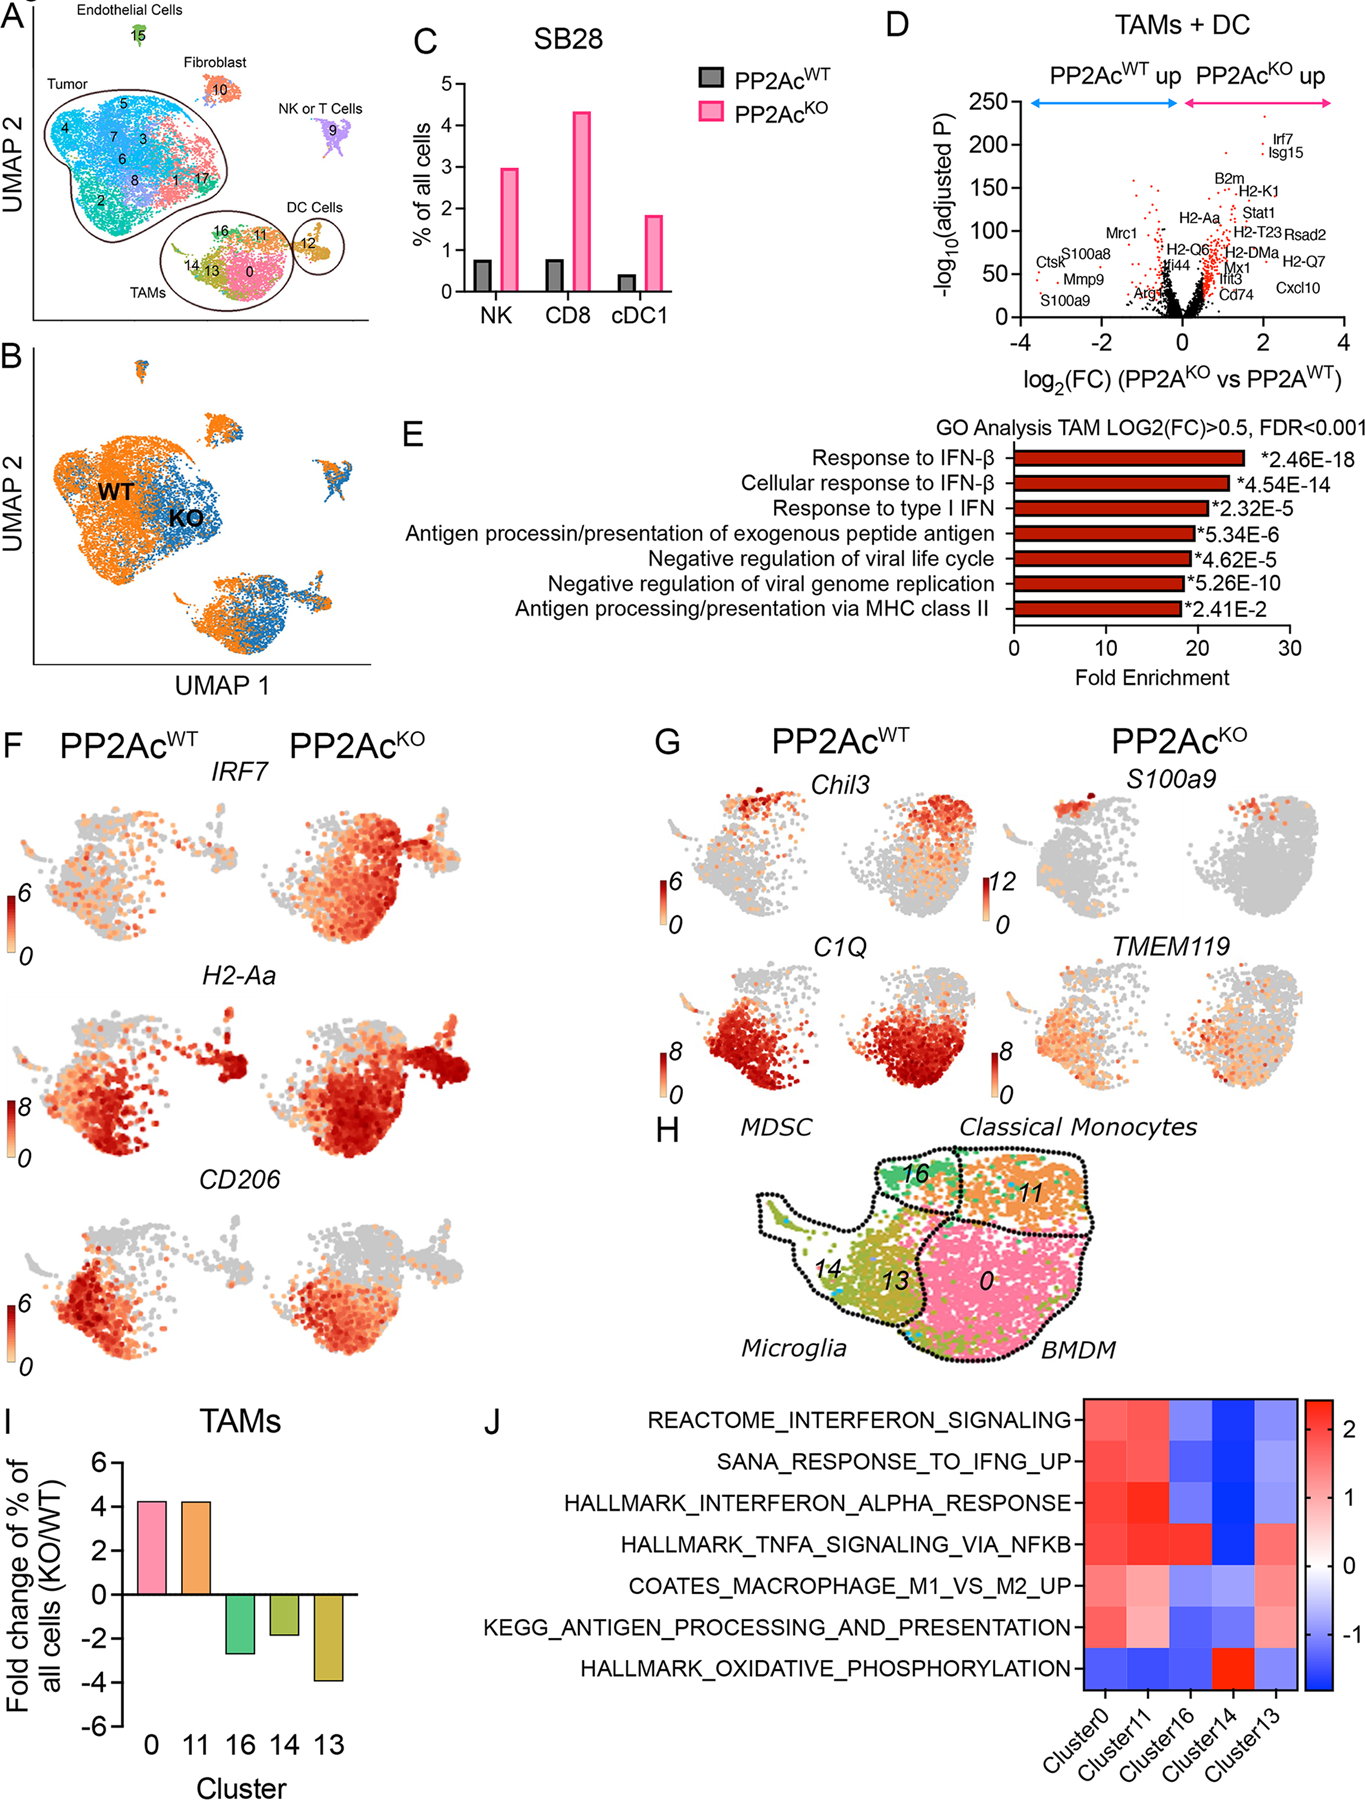
C57BL/6 mice were inoculated with 3×10⁴ WT or PP2AcKO SB28 cells in the brain. On day 18 after implantation, tumors were harvested and 3 mice per group were pooled and analyzed by scRNA-seq. (A) Uniform manifold approximation and projection (UMAP) analyses were performed on 15,448 cells. Expression of GFP and CD45 identify tumor and immune cells respectively. (B) Glioma-specific PP2Ac KO significantly remodeled both tumor and immune compartments. (C) Canonical markers were then used to identified major immune population. The frequencies of NK (NKG7+, CD3-), CD8 (CD8+, CD3+) and cDC1 (CD11c+, CD103+) cells among all sequenced cells were compared between WT and PP2AcKO tumors. (D) Volcano plots showing DEGs (−log10(adjusted P) > 20, log2(FC) > 0.5 or < −0.5, colored in red) in TAMs between WT and PP2AcKO tumors. (E) GO Pathway enrichment analysis performed using upregulated DEGs in TAMs and DCs from PP2AcKO versus WT SB28. The top 7 enriched biological processes for upregulated DEGs ranked by fold enrichment are shown. * indicate p-value of individual pathway. P value adjustment was performed using Bonferroni correction. (F) UMAP plot of TAMs and DC comparing expression levels of IRF7 (IFN- response element), H2-Aa (MHC class I) and CD206 (marker of “M2”-like immunosuppressive TAMs) between WT and PP2AcKO SB28 tumors. (G) UMAP plots showing the expression of key signature genes that are differential between the various TAM subsets. (H) Overview of TAM subsets: (16) m-MDSC derived macrophage; (11) classical monocyte; (14) and (13) microglia; (0) IFN BMDM. (I)The fold change in frequency of the 5 TAMs clusters between WT and PP2AcKO SB28 tumors. (J) Heatmap of Normalized Enrichment Score (NES) from GSEA identifying pathway enrichment by each TAM cluster.
Next, we examined the impact of glioma PP2Ac deficiency on myeloid cells, which are the predominant immune cells. We identified the differentially expressed genes (DEGs) (-log10(adjusted P) > 20, log2(FC) > 0.5 or log2(FC) <−0.5) in myeloid cell clusters (TAMs + DC: clusters 0, 11, 12, 13, 14, 16) between WT and PP2AcKO tumors (Fig. 6D). Consistent with our in vitro finding of PP2A deficiency enhancing tumor cGAMP production, which can activate STING-IFN signaling in myeloid cells, we found the top upregulated DEGs in myeloid cells to be known IFN response genes (ISG15, IRF7, STAT1, CXCL19, RSAD2, Mx1). In addition, components of MHC-I (B2m, H2-Q1, H2-Q7, H2-Q6), MHC-I loading machinery (TAP1, TAPBP), MHCII (H2-DMa, H2-Aa) and CD74—an invariant MHCII chain implicated in trafficking of MHCII proteins – were all highly enriched (Fig. 6D). An unbiased GO Pathway analysis demonstrated the top enriched biological pathways of myeloid DEGs in PP2AcKO tumors were related to Type I IFN signaling and MHC-II antigen processing/presentation (Fig. 6E–F). On the other hand, among genes in myeloid cells that were down regulated in PP2AcKO tumors were Mrc1(CD206) and Arg1 (Fig. 6D, F), markers frequently associated with anti-inflammatory, immunosuppressive macrophages (39–41). Next, we further characterized the heterogenous TAMs populations. Seurat analysis identified 5 TAMs clusters (0, 11, 13, 14, 16). We examined the expression of known myeloid markers among these clusters (Fig. 6G–H). Cluster 11 expressed markers of classical bone marrow derived monocytes (Chil3+), while cluster 0 had low Chil3 expression and high expression of mature macrophage markers such as C1Q. Clusters 13,14 expressed TMEM119, indicating they are likely resident microglia. Cluster 16 exclusively expressed S100A9, which is a marker of immunosuppressive monocytic myeloid-derived suppressor cells (M-MDSC)-derived macrophages (42). We calculated the fold change in cluster frequencies between WT and PP2AcKO tumors and found that clusters 0 and 11 were enriched in PP2AcKO tumors while clusters 13, 14, 16 were enriched in PP2AcWT tumors (Fig. 6I). To delineate the functional significance of these clusters, we performed GSEA using cluster-defining gene lists (Data S1) and compared the relative expression of selected pathways across the five clusters (Fig. 6J). Cluster 0, 11, which were enriched in PP2AcKO tumors, had increased Type I/II IFN signature in addition to NFkB activation. This is consistent with increased STING activation as STING is known to stimulate both IFN and NFkB downstream signaling (43). They also expressed high antigen processing/presentation activity. Clusters 13,14,16, which were enriched in WT tumors, all had suppressed IFN-signature. Cluster 14 was notable for a distinctly high oxidative phosphorylation signature, which is associated with immunosuppressive “M2”-like macrophages(44). S100A9-positive M-MDSC-derived macrophages (cluster 16), is associated with shorter survival in patients with head and neck cancer and poor response to PD-1 antibody treatment in patients with metastatic melanoma(42). In summary, our data demonstrated that PP2A deficiency in glioma cells significantly remodel the immune tumor microenvironment. There was a significant increase in IFN-activated macrophages with enhanced markers of activation and antigen presentation. There was also a decrease in immunosuppressive macrophages. cDC1 DCs infiltration were also enhanced, which presumably led to influx of cytotoxic CD8 T cells and NK cells. These observations are consistent with PP2A deficiency-mediated dsDNA accumulation and cGAMP production that can activate STING signaling in antigen presenting cells (TAMs and DC).
scRNA-seq analysis reveals glioma specific PP2Ac deficiency remodeled tumor compartment
Finally, we examined the impact of glioma PP2A deficiency on GFP+ SB28 cells. Seurat analysis identified 9 clusters (1, 2, 3, 4, 5, 6, 7, 8, 17). We analyzed the DEGs (-log10(adjusted P) > 20, log2(FC) > 0.5 or log2(FC) <−0.5) between WT and PP2AcKO tumors and found the top overexpressed genes in PP2AcKO glioma cells were IFN response elements (ISG15, STAT1, CXCL10, IRF7) including components of MHC-I (B2m, H2-D1) and MHC-I loading machinery (TAP1, TAPBP) (Fig. 7A). GO Pathway analysis using upregulated DEGs in glioma cells of PP2AcKO tumor demonstrated that the top enriched biological pathways were predominately related to Type I IFN signaling (Fig. 7B–C). We calculated fold change in cluster frequencies between WT and PP2AcKO tumors and found that clusters 17 and 1 were enriched in PP2AcKO, while clusters 7, 8, 5 were enriched in WT tumors (Fig. 7D). GSEA was performed to compare the relative expression of gene signatures of selected pathway across the 5 clusters (Fig. 7E). Cluster 17, which was markedly enriched in PP2AcKO tumors (by >30 fold), was defined by high Type I/II IFN signature. Cluster 5,7,8, which were enriched in WT tumors, had enhanced signature of oxidative phosphorylation. In addition, cluster 8 had increased expression stem cell makers, while clusters 5 and 7 had increased MYC target expression. To establish if the downregulated DEGs (Log2FC<−0.5, FDR<0.01) signature in GFP+ tumor clusters (1,2,3,4,5,6,7,8,17) in PP2AcKO tumors (PP2ADN) (Table S3) have clinical significance in human samples, we obtained bulk RNAseq dataset from TCGA with combined low-grade glioma (LGG) and glioblastoma (GBM). We calculated the average normalized expression of PP2ADN genes and found its expression to be significantly higher in GBM compared to LGG (Fig. 7F). Survival is also worse for patients with higher PP2ADN expressions in the combined GBM/LGG cohort (Fig. 7G). When grading is stratified, PP2ADN expressions continue to significantly predict worse survival in LGG patients (Fig. S9A), while there is a trend towards worse survival in GBM patients (p=0.08) with limited sample size (Fig. S9B). In summary, the scRNAseq data demonstrated that glioma PP2Ac deficiency resulted in a marked increase in IFN activation and MHC-I expression in an immune-silent glioma model. In addition, the gene signature downregulated in PP2Ac deficient glioma cells corresponds with higher grading and worse prognosis in human clinical data. Therefore, this study strongly argues for PP2A inhibition as an appealing strategy for novel treatment of GBM.
Fig. 7. scRNA-seq analysis reveals tumor-specific PP2Ac deficiency remodeled immune compartment of the tumor microenvironment.

(A) Volcano plots showing DEGs (−log10(adjusted P) > 20, log2(FC) > 0.5 or < −0.5, colored in red) in GFP+ SB28 cells between WT and PP2AcKO tumors. Pseudovalue 1e−300 were added to adjusted P to avoid 0 before log-transformation. (B) GO Pathway enrichment analysis performed using upregulated DEGs in glioma cells from PP2AcKO versus WT SB28 tumors. The top 7 enriched biological processes for upregulated DEGs ranked by fold enrichment are shown. * indicate p-value of individual pathway. P value adjustment was performed using Bonferroni correction. (C) UMAP plot of glioma cells comparing expression levels of ISG15 (IFN- response element), H2-D1 (MHC class I) and TAP1 (MHC-I loading machinery) between WT and PP2AcKO SB28 tumors. (D) The fold change in frequency of the glioma clusters between WT and PP2AcKO SB28 tumors. (E) Heatmap of Normalized Enrichment Score (NES) from GSEA identifying pathway enrichment by each tumor cluster with altered frequency between WT and PP2AcKO SB28. (F) Average expression level of PP2ADN gene signature (down regulated DEGs in glioma cells in (a)) is higher in high grade glioma (n=171) compared to low grade glioma (n=530) from TCGA dataset. P value was calculated by unpaired t-test (****P<0.0001). (G) Average expression level of PP2ADN gene signature is associated with worse survival in patients with glioma (LGG+GBM) using TCGA bulk RNAseq dataset. Q4 represent patients with highest quartile of average expression and Q1 with lowest quartile of average expression. Mantel-Cox log-rank tests were used for survival analysis. (****P<0.0001)
Discussion
Our group previously reported that LB-100, a small molecule inhibitor of PP2A currently in Phase Ib and II clinical trials (NCT03027388, NCT04560972), can synergize with anti-PD1 checkpoint blockade in preclinical models of non-CNS(14) and CNS tumors(13). However, since PP2A is ubiquitously expressed in many cell types, from tumor to immune cells, our previous work using LB-100 failed to delineate what cell types are responsible for the effect of enhanced tumor immunogenicity. In addition, LB-100 also has an antagonistic effect against another phosphatase family, PPP5C, thereby raising the question of whether PP2A is the target responsible for promoting tumor immunogenicity(45). In this study, we found that tumor specific PP2Ac deficiency can promote tumor immunogenicity and sensitize checkpoint blockade in vivo using a non-immunogenic glioma model SB28. Mechanistically, we found that PP2Ac deficiency promotes ICD, dsDNA accumulation, cGAMP production and tumor mutational burden. scRNAseq demonstrated that glioma specific PP2AcKO can remodel the immune microenvironment by enhancing infiltration of IFN-activated TAMs. Tumor infiltration of cross-presenting cDC1 cells, NK cells and cytotoxic CD8 T-cells are all concomitantly increased. This data suggests that downregulation of PP2A in tumor cells can promote antitumor immunity through enhanced cGAS-STING-IFN signaling.
PP2A is known to be required in various steps of DNA damage response (46). A recent study showed that te inactivation of a scaffolding subunit of PP2A, PPP2r1a, can induce microsatellite-instability by increasing phosphorylation of retinoblastoma protein and histone deacetylase(HDAC)2, which trigger neoantigen production and in turn promote immunogenicity of tumors in non-CNS cancer models (30). Consistently, we found an increase in tumor mutational burden and predicted neoepitope bound to MHC-I and MHC-II in PP2AcKO glioma. However, we demonstrate in this study that PP2Ac inactivation can enhance cGAS-STING-IFN signaling in both tumor and immune cells, providing a complementary mechanistic rationale to inhibit PP2A to enhance anti-tumor immunity. The connection between tumor PP2A and cGAS-STING-IFN stimulation has not been reported and is the principal novelty and significance of the current study. The precise mechanism of how PP2Ac deficiency leads to accumulation of cytosolic dsDNA remains to be elucidated. In macrophages, PP2A has also been implicated in dephosphorylation of IRF3 as a deactivation mechanism that contributes to termination of IRF3-type I IFN signaling in response to Toll-like receptor (TLR) and STING (47,48). Whether this is a relevant regulatory mechanism in tumor cells, and specifically in response to cGAS-STING activation, has not been explored. Therefore, beyond the increase in cytosolic dsDNA, we cannot rule out the possibility that PP2Ac deficiency can contribute to enhanced IFN signaling through downstream regulation of STING-IFN pathway.
Our in vitro data demonstrated that PP2A deficiency in tumor cells promoted MHC-I expression in a IFNAR and JAK-STAT dependent manner suggesting that KO of PP2Ac promotes autocrine activation of tumor IFN signaling. Systemic IFNAR blockade in vivo abolished the survival benefit of tumor PP2Ac deficiency. While activation of IFNAR-JAK/STAT pathway induces expression of interferon stimulated genes and acutely promotes the efficacy of cancer immunotherapies(25–27), it is also recognized that chronic tumor IFNAR-JAK/STAT stimulation could be counterproductive(49,50). The role of Type I IFN in GBM microenvironment is controversial as both beneficial(51,52) and detrimental effects(53,54) of IFN stimulation had been suggested. A recent study in melanoma showed that the impact of Type I IFN signaling on antitumor immunity depends on the balance between immune and tumor Type I IFN stimulation(49). Type I IFN signaling in immune cells is beneficial, whereas tumor Type I IFN stimulation can have opposing effects. On one hand, it carries the benefit of promoting MHC-I expression, on the other it induces “adaptive resistance” mechanisms such as upregulation of PDL1 or IDO that can be immunosuppressive(50). Our scRNAseq data suggest that IFN signaling is enhanced in both immune and tumor cells and it is possible that in the context of a highly immune-silent tumor such as glioma with low baseline MHC-I expression, the benefits of IFN induced MHC-I expression outweigh the detriment of adaptive resistance.
Not only is PP2A expressed in many cell types, but also implicated in many signaling pathways. The diverse function of PP2A holoenzyme is dictated by the heterogenous regulatory B subunits. Therefore, there is reservation in systemically inhibiting the conserved PP2Ac subunit for fear of eliciting unacceptable side effects or antagonizing specific PP2A complexes that function as tumor suppressors(55). In fact, some groups advocate for the development of allosteric PP2A activators of specific PP2A holoenzyme (56) involved in positively regulating tumor suppressor pathways. Our study is significant in providing the rationale that, at least in the context of glioma, while inhibition of PP2Ac in tumor cells may perturb various pathways, on balance it results in a favorable therapeutic outcome of increased immunogenicity and sensitivity to checkpoint blockade. It is also possible that PP2Ac deficiency can have a non-immune mediated, tumor intrinsic effect on glioma cells. Our in vivo CD8 depletion studies demonstrated a residual benefit of PP2Ac deficiency with CD8 depletion in the absence of checkpoint blockade, which can be attributed to other immune cells (NK, CD4, DC) or a direct effect on tumor growth. Our scRNAseq data showed that the down regulated gene signature in PP2Ac deficient glioma cells are correlated with higher histological grade of glioma and predicts worse survival in patients, which suggests that PP2Ac deficiency has the potential to directly impact tumor growth independent of is effect on immunogenicity. The translational significance of this study is the implication that if systemic, pharmacological inhibition (i.e. with LB-100), cannot achieve sufficient PP2A inhibition in glioma, either due to the blood-brain barrier or systemic intolerance, local delivery of LB-100, such as via convection enhanced delivery can circumvent that and be a viable alternative strategy.
Supplementary Material
Significance.
PP2A deficiency promotes cGAS-STING signaling in glioma to induce a tumor suppressive immune microenvironment, highlighting PP2A as a potential therapeutic target to enhance tumor immunogenicity and improve response to immunotherapy.
Funding:
Department of Defense PRCRP W81XWH-20-1-0428 (RL)
National Institutes of Health, R01NS126501 (RL)
National Institutes of Health, R01NS131545 (WH)
National Institutes of Health, R35GM142504 (ZM)
RNASeq and scRNAseq were performed by the Genomic Sequencing and Analysis Facility at UT Austin, Center for Biomedical Research Support. RRID#: SCR_021713.
Footnotes
Competing interests: WH and RL hold patents related to targeting PP2A for immunotherapy. All other authors have no competing interests.
References
- 1.. Tamimi AF, Juweid M. Epidemiology and Outcome of Glioblastoma [Internet]. Glioblastoma 2017. Available from: http://www.ncbi.nlm.nih.gov/pubmed/29251870 [PubMed]
- 2.Reardon DA, Brandes AA, Omuro A, Mulholland P, Lim M, Wick A, et al. Effect of Nivolumab vs Bevacizumab in Patients with Recurrent Glioblastoma: The CheckMate 143 Phase 3 Randomized Clinical Trial. JAMA Oncol American Medical Association; 2020;6:1003–10. [DOI] [PMC free article] [PubMed] [Google Scholar]
- 3.Lim M, Weller M, Idbaih A, Steinbach J, Finocchiaro G, Raval RR, et al. Phase 3 Trial of Chemoradiotherapy With Temozolomide Plus Nivolumab or Placebo for Newly Diagnosed Glioblastoma With Methylated MGMT Promoter. Neuro Oncol 2022; [DOI] [PMC free article] [PubMed]
- 4.Yeung JT, Hamilton RL, Ohnishi K, Ikeura M, Potter DM, Nikiforova MN, et al. LOH in the HLA class I region at 6p21 is associated with shorter survival in newly diagnosed adult glioblastoma. Clinical Cancer Research 2013;19:1816–26. [DOI] [PMC free article] [PubMed] [Google Scholar]
- 5.Wei J, Barr J, Kong L-Y, Wang Y, Wu A, Sharma AK, et al. Glioblastoma cancer-initiating cells inhibit T-cell proliferation and effector responses by the signal transducers and activators of transcription 3 pathway. Mol Cancer Ther 2010;9:67–78. [DOI] [PMC free article] [PubMed] [Google Scholar]
- 6.Alexandrov LB, Nik-Zainal S, Wedge DC, Aparicio SAJR, Behjati S, Biankin A v., et al. Signatures of mutational processes in human cancer. Nature Nature Publishing Group; 2013;500:415–21. [DOI] [PMC free article] [PubMed] [Google Scholar]
- 7.Jackson CM, Choi J, Lim M. Mechanisms of immunotherapy resistance: lessons from glioblastoma. Nat Immunol Nature Publishing Group; 2019. page 1100–9. [DOI] [PubMed] [Google Scholar]
- 8.Westermarck J Targeted therapies don’t work for a reason; the neglected tumor suppressor phosphatase PP2A strikes back. FEBS J 2018;285:4139–45. [DOI] [PubMed] [Google Scholar]
- 9.Sangodkar J, Farrington CC, McClinch K, Galsky MD, Kastrinsky DB, Narla G. All roads lead to PP2A: exploiting the therapeutic potential of this phosphatase. FEBS Journal [Internet] 2016;283:1004–24. Available from: 10.1111/febs.13573 [DOI] [PMC free article] [PubMed] [Google Scholar]
- 10.Ho WS, Sizdahkhani S, Hao S, Song H, Seldomridge A, Tandle A, et al. LB-100, a novel Protein Phosphatase 2A (PP2A) inhibitor, sensitizes malignant meningioma cells to the therapeutic effects of radiation. Cancer Lett [Internet] 2018;415:217–26. Available from: http://www.ncbi.nlm.nih.gov/pubmed/29199006 [DOI] [PMC free article] [PubMed] [Google Scholar]
- 11.Lu J, Kovach JS, Johnson F, Chiang J, Hodes R, Lonser R, et al. Inhibition of serine/threonine phosphatase PP2A enhances cancer chemotherapy by blocking DNA damage induced defense mechanisms. Proc Natl Acad Sci U S A [Internet] 2009;106:11697–702. Available from: http://www.ncbi.nlm.nih.gov/pubmed/19564615 [DOI] [PMC free article] [PubMed] [Google Scholar]
- 12.Wei D, Parsels LA, Karnak D, Davis MA, Parsels JD, Marsh AC, et al. Inhibition of protein phosphatase 2A radiosensitizes pancreatic cancers by modulating CDC25C/CDK1 and homologous recombination repair. Clin Cancer Res 2013;19:4422–32. [DOI] [PMC free article] [PubMed] [Google Scholar]
- 13.Maggio D, Ho WS, Breese R, Walbridge S, Wang H, Cui J, et al. Inhibition of protein phosphatase-2A with LB-100 enhances antitumor immunity against glioblastoma. J Neurooncol [Internet] 2020;148:231–44. Available from: http://www.ncbi.nlm.nih.gov/pubmed/32342332 [DOI] [PMC free article] [PubMed] [Google Scholar]
- 14.Ho WS, Wang H, Maggio D, Kovach JS, Zhang Q, Song Q, et al. Pharmacologic inhibition of protein phosphatase-2A achieves durable immune-mediated antitumor activity when combined with PD-1 blockade. Nat Commun [Internet] 2018;9:2126. Available from: http://www.ncbi.nlm.nih.gov/pubmed/29844427 [DOI] [PMC free article] [PubMed] [Google Scholar]
- 15.Woo SR, Fuertes MB, Corrales L, Spranger S, Furdyna MJ, Leung MYK, et al. STING-dependent cytosolic DNA sensing mediates innate immune recognition of immunogenic tumors. Immunity Cell Press; 2014;41:830–42. [DOI] [PMC free article] [PubMed] [Google Scholar]
- 16.Sun L, Wu J, Du F, Chen X, Chen ZJ. Cyclic GMP-AMP synthase is a cytosolic DNA sensor that activates the type I interferon pathway. Science [Internet] 2013;339:786–91. Available from: http://www.ncbi.nlm.nih.gov/pubmed/23258413 [DOI] [PMC free article] [PubMed] [Google Scholar]
- 17.Li J, Duran MA, Dhanota N, Chatila WK, Bettigole SE, Kwon J, et al. Metastasis and Immune Evasion from Extracellular cGAMP Hydrolysis. Cancer Discov [Internet] 2021;11:1212–27. Available from: 10.1158/2159-8290.CD-20-0387 [DOI] [PMC free article] [PubMed] [Google Scholar]
- 18.Carozza JA, Böhnert V, Nguyen KC, Skariah G, Shaw KE, Brown JA, et al. Extracellular cGAMP is a cancer cell-produced immunotransmitter involved in radiation-induced anti-cancer immunity. Nat Cancer [Internet] 2020;1:184–96. Available from: http://www.ncbi.nlm.nih.gov/pubmed/33768207 [DOI] [PMC free article] [PubMed] [Google Scholar]
- 19.Yum S, Li M, Fang Y, Chen ZJ. TBK1 recruitment to STING activates both IRF3 and NF-κB that mediate immune defense against tumors and viral infections. Proceedings of the National Academy of Sciences [Internet] 2021;118:e2100225118. Available from: 10.1073/pnas.2100225118 [DOI] [PMC free article] [PubMed] [Google Scholar]
- 20.Genoud V, Marinari E, Nikolaev SI, Castle JC, Bukur V, Dietrich P-Y, et al. Responsiveness to anti-PD-1 and anti-CTLA-4 immune checkpoint blockade in SB28 and GL261 mouse glioma models. Oncoimmunology [Internet] 2018;7:e1501137. Available from: 10.1080/2162402X.2018.1501137 [DOI] [PMC free article] [PubMed] [Google Scholar]
- 21.Roney K Bone marrow-derived dendritic cells. Methods Mol Biol 2013;1031:71–6. [DOI] [PubMed] [Google Scholar]
- 22.Chen K-S, Reinshagen C, Schaik TA van, Rossignoli F, Borges P, Mendonca NC, et al. Bifunctional cancer cell-based vaccine concomitantly drives direct tumor killing and antitumor immunity [Internet] 2023. Available from: https://r2.amc.nl [DOI] [PMC free article] [PubMed]
- 23.Fucikova J, Kepp O, Kasikova L, Petroni G, Yamazaki T, Liu P, et al. Detection of immunogenic cell death and its relevance for cancer therapy. Cell Death Dis Springer Nature; 2020. [DOI] [PMC free article] [PubMed] [Google Scholar]
- 24.Dhatchinamoorthy K, Colbert JD, Rock KL. Cancer Immune Evasion Through Loss of MHC Class I Antigen Presentation. Front Immunol Frontiers Media S.A.; 2021. [DOI] [PMC free article] [PubMed] [Google Scholar]
- 25.Dighe AS, Richards E, Old LJ, Schreiber RD. Enhanced in vivo growth and resistance to rejection of tumor cells expressing dominant negative IFNγ receptors. Immunity 1994;1:447–56. [DOI] [PubMed] [Google Scholar]
- 26.Fuertes MB, Kacha AK, Kline J, Woo S-R, Kranz DM, Murphy KM, et al. Host type I IFN signals are required for antitumor CD8+ T cell responses through CD8α+ dendritic cells. Journal of Experimental Medicine 2011;208:2005–16. [DOI] [PMC free article] [PubMed] [Google Scholar]
- 27.Diamond MS, Kinder M, Matsushita H, Mashayekhi M, Dunn GP, Archambault JM, et al. Type I interferon is selectively required by dendritic cells for immune rejection of tumors. Journal of Experimental Medicine 2011;208:1989–2003. [DOI] [PMC free article] [PubMed] [Google Scholar]
- 28.Hong CS, Ho W, Zhang C, Yang C, Elder JB, Zhuang Z. LB100, a small molecule inhibitor of PP2A with potent chemo- and radio-sensitizing potential. Cancer Biol Ther 2015;16. [DOI] [PMC free article] [PubMed] [Google Scholar]
- 29.Gordon IK, Lu J, Graves CA, Huntoon K, Frerich JM, Hanson RH, et al. Protein phosphatase 2A inhibition with LB100 enhances radiation-induced mitotic catastrophe and tumor growth delay in glioblastoma. Mol Cancer Ther 2015;14. [DOI] [PMC free article] [PubMed] [Google Scholar]
- 30.Yen YT, Chien M, Wu PY, Ho CC, Ho C te, Huang KCY, et al. Protein phosphatase 2A inactivation induces microsatellite instability, neoantigen production and immune response. Nat Commun. Nature Research; 2021;12. [DOI] [PMC free article] [PubMed] [Google Scholar]
- 31.Ho WS, Feldman MJ, Maric D, Amable L, Hall MD, Feldman GM, et al. PP2A inhibition with LB100 enhances cisplatin cytotoxicity and overcomes cisplatin resistance in medulloblastoma cells. Oncotarget 2016;7:12447–63. [DOI] [PMC free article] [PubMed] [Google Scholar]
- 32.Lv P, Wang Y, Ma J, Wang Z, Li JL, Hong CS, et al. Inhibition of protein phosphatase 2A with a small molecule LB100 radiosensitizes nasopharyngeal carcinoma xenografts by inducing mitotic catastrophe and blocking DNA damage repair. Oncotarget 2014;5:7512–24. [DOI] [PMC free article] [PubMed] [Google Scholar] [Retracted]
- 33.Harding SM, Benci JL, Irianto J, Discher DE, Minn AJ, Greenberg RA. Mitotic progression following DNA damage enables pattern recognition within micronuclei. Nature Nature Publishing Group; 2017;548:466–70. [DOI] [PMC free article] [PubMed] [Google Scholar]
- 34.Deng L, Liang H, Xu M, Yang X, Burnette B, Arina A, et al. STING-dependent cytosolic DNA sensing promotes radiation-induced type I interferon-dependent antitumor immunity in immunogenic tumors. Immunity [Internet] 2014;41:843–52. Available from: https://www.ncbi.nlm.nih.gov/pmc/articles/PMC5155593/ [DOI] [PMC free article] [PubMed] [Google Scholar]
- 35.Cance JC, Crozat K, Dalod M, Mattiuz R. Are conventional type 1 dendritic cells critical for protective antitomor immunity and how? Front Immunol Frontiers Media S.A.; 2019. [DOI] [PMC free article] [PubMed] [Google Scholar]
- 36.Li F, Li C, Cai X, Xie Z, Zhou L, Cheng B, et al. The association between CD8+ tumor-infiltrating lymphocytes and the clinical outcome of cancer immunotherapy: A systematic review and meta-analysis. EClinicalMedicine Elsevier Ltd; 2021;41. [DOI] [PMC free article] [PubMed] [Google Scholar]
- 37.Nersesian S, Schwartz SL, Grantham SR, MacLean LK, Lee SN, Pugh-Toole M, et al. NK cell infiltration is associated with improved overall survival in solid cancers: A systematic review and meta-analysis. Transl Oncol Neoplasia Press, Inc.; 2021;14. [DOI] [PMC free article] [PubMed] [Google Scholar]
- 38.Lu S, Stein JE, Rimm DL, Wang DW, Bell JM, Johnson DB, et al. Comparison of Biomarker Modalities for Predicting Response to PD-1/PD-L1 Checkpoint Blockade: A Systematic Review and Meta-analysis. JAMA Oncol American Medical Association; 2019. page 1195–204. [DOI] [PMC free article] [PubMed] [Google Scholar]
- 39.Murray PJ, Allen JE, Biswas SK, Fisher EA, Gilroy DW, Goerdt S, et al. Macrophage Activation and Polarization: Nomenclature and Experimental Guidelines. Immunity Cell Press; 2014. page 14–20. [DOI] [PMC free article] [PubMed] [Google Scholar]
- 40.Biswas SK, Mantovani A. Macrophage plasticity and interaction with lymphocyte subsets: Cancer as a paradigm. Nat Immunol 2010. page 889–96. [DOI] [PubMed]
- 41.Qian BZ, Pollard JW. Macrophage Diversity Enhances Tumor Progression and Metastasis. Cell Elsevier B.V.; 2010. page 39–51. [DOI] [PMC free article] [PubMed] [Google Scholar]
- 42.Kwak T, Wang F, Deng H, Condamine T, Kumar V, Perego M, et al. Distinct Populations of Immune-Suppressive Macrophages Differentiate from Monocytic Myeloid-Derived Suppressor Cells in Cancer. Cell Rep Elsevier B.V.; 2020;33. [DOI] [PMC free article] [PubMed] [Google Scholar]
- 43.Li T, Chen ZJ. The cGAS-cGAMP-STI NG pathway connects DNA damage to inflammation, senescence, and cancer. Journal of Experimental Medicine 2018;215:1287–99. [DOI] [PMC free article] [PubMed] [Google Scholar]
- 44.Zhang Q, Wang J, Yadav DK, Bai X, Liang T. Glucose Metabolism: The Metabolic Signature of Tumor Associated Macrophage. Front Immunol Frontiers Media S.A.; 2021. [DOI] [PMC free article] [PubMed] [Google Scholar]
- 45.D’Arcy BM, Swingle MR, Papke CM, Abney KA, Bouska ES, Prakash A, et al. The antitumor drug LB-100 is a catalytic inhibitor of protein phosphatase 2A (PPP2CA) and 5 (PPP5C) coordinating with the active-site catalytic metals in PPP5C. Mol Cancer Ther American Association for Cancer Research Inc.; 2019;18:556–66. [DOI] [PMC free article] [PubMed] [Google Scholar]
- 46.Ramos F, Villoria MT, Alonso-Rodríguez E, Clemente-Blanco A. Role of protein phosphatases PP1, PP2A, PP4 and Cdc14 in the DNA damage response. Cell Stress Shared Science Publishers OG; 2019. page 70–85. [DOI] [PMC free article] [PubMed] [Google Scholar]
- 47.Long L, Deng Y, Yao F, Guan D, Feng Y, Jiang H, et al. Recruitment of phosphatase PP2A by RACK1 adaptor protein deactivates transcription factor IRF3 and limits Type I interferon signaling. Immunity [Internet] Elsevier Inc.; 2014;40:515–29. Available from: 10.1016/j.immuni.2014.01.015 [DOI] [PubMed] [Google Scholar]
- 48.Ho WS, Mondal I, Xu B, Das O, Sun RC, Chiou P, et al. PP2Ac/STRN4 negatively regulates STING-Type I interferon signaling in tumor associated macrophages. J Clin Invest [Internet] 2023; Available from: http://www.ncbi.nlm.nih.gov/pubmed/36757811 [DOI] [PMC free article] [PubMed]
- 49.Benci JL, Johnson LR, Choa R, Xu Y, Qiu J, Zhou Z, et al. Opposing Functions of Interferon Coordinate Adaptive and Innate Immune Responses to Cancer Immune Checkpoint Blockade. Cell Cell Press; 2019;178:933–948.e14. [DOI] [PMC free article] [PubMed] [Google Scholar]
- 50.Benci JL, Xu B, Qiu Y, Wu TJ, Dada H, Twyman-Saint Victor C, et al. Tumor Interferon Signaling Regulates a Multigenic Resistance Program to Immune Checkpoint Blockade. Cell Cell Press; 2016;167:1540–1554.e12. [DOI] [PMC free article] [PubMed] [Google Scholar]
- 51.Du Z, Cai C, Sims M, Boop FA, Davidoff AM, Pfeffer LM. The effects of type I interferon on glioblastoma cancer stem cells. Biochem Biophys Res Commun 2017;491:343–8. [DOI] [PubMed] [Google Scholar]
- 52.Ohkuri T, Ghosh A, Kosaka A, Zhu J, Ikeura M, David M, et al. STING contributes to antiglioma immunity via triggering type I IFN signals in the tumor microenvironment. Cancer Immunol Res 2014;2:1199–208. [DOI] [PMC free article] [PubMed] [Google Scholar]
- 53.Silginer M, Nagy S, Happold C, Schneider H, Weller M, Roth P. Autocrine activation of the IFN signaling pathway may promote immune escape in glioblastoma. Neuro Oncol Oxford University Press; 2017;19:1338–49. [DOI] [PMC free article] [PubMed] [Google Scholar]
- 54.Khan S, Mahalingam R, Sen S, Martinez-Ledesma E, Khan A, Gandy K, et al. Intrinsic interferon signaling regulates the cell death and mesenchymal phenotype of glioblastoma stem cells. Cancers (Basel). MDPI; 2021;13. [DOI] [PMC free article] [PubMed] [Google Scholar]
- 55.Vainonen JP, Momeny M, Westermarck J. Druggable cancer phosphatases. Sci Transl Med [Internet] 2021;13. Available from: http://www.ncbi.nlm.nih.gov/pubmed/33827975 [DOI] [PubMed] [Google Scholar]
- 56.Leonard D, Huang W, Izadmehr S, O’Connor CM, Wiredja DD, Wang Z, et al. Selective PP2A Enhancement through Biased Heterotrimer Stabilization. Cell Cell Press; 2020;181:688–701.e16. [DOI] [PMC free article] [PubMed] [Google Scholar]
Associated Data
This section collects any data citations, data availability statements, or supplementary materials included in this article.