

Abstract
Small molecule inhibitors targeting JAK2 provide symptomatic benefits for myeloproliferative neoplasm (MPN) patients and are among first-line therapeutic agents. However, despite all having potent capacity to suppress JAK-STAT signaling, they demonstrate distinct clinical profiles suggesting contributory effects in targeting other ancillary pathways. Here, we performed comprehensive profiling on four JAK2 inhibitors either FDA-approved (ruxolitinib, fedratinib, and pacritinib) or undergoing phase 3 studies (momelotinib) to better outline mechanistic and therapeutic efficacy. Across JAK2-mutant in vitro models, all four inhibitors demonstrated similar anti-proliferative phenotypes, whereas pacritinib yielded greatest potency on suppressing colony formation in primary samples, while momelotinib exhibited unique erythroid colony formation sparing. All inhibitors reduced leukemic engraftment, disease burden, and extended survival across patient-derived xenograft (PDX) models, with strongest effects elicited by pacritinib. Through RNA-sequencing and gene-set enrichment analyses, differential suppressive degrees of JAK-STAT and inflammatory response signatures were revealed, which we validated with signaling and cytokine suspension mass cytometry across primary samples. Lastly, we assessed the capacity of JAK2 inhibitors to modulate iron regulation, uncovering potent suppression of hepcidin and SMAD signaling by pacritinib. These comparative findings provide insight into the differential and beneficial effects of ancillary targeting beyond JAK2 and may help guide the use of specific inhibitors in personalized therapy.
Introduction
Myeloproliferative neoplasms (MPNs) are clonal myeloid disorders characterized by aberrant overproduction of red blood cells and platelets in polycythemia vera and essential thrombocythemia, respectively, and abnormal deposition of collagen in the bone marrow in myelofibrosis. Gain-of-function mutations in three genes (JAK2, MPL, or CALR) are found in the majority of MPN patients and result in hyperactive JAK-STAT signaling, which coupled with a pro-inflammatory niche propagated by NFκB drive disease development and potential transformation to secondary acute myeloid leukemia (sAML)1–4. In addition to phlebotomy, aspirin, hydroxyurea, and interferon, standard therapy for MPN patients includes tyrosine kinase inhibitors targeting JAK25. Since the approval of ruxolitinib in 2011, two additional inhibitors, fedratinib and pacritinib, have received FDA approval for myelofibrosis, and a new drug application for a fourth inhibitor, momelotinib has been submitted in June 2022.
These small molecule inhibitors act primarily as ATP competitors in the JAK2 kinase domain but do not discriminate between wild-type and mutant enzymes6. All four inhibitors reduce constitutional symptoms and splenomegaly, providing symptom relief for patients7–11. In addition to having nanomolar affinity in suppressing JAK2 activity, meaningful and unique clinical benefits can be observed by individual inhibitors, which may be a consequence of their capacity to simultaneously suppress auxiliary targets12.
In addition to JAK2, ruxolitinib also targets JAK1, a key mediator of inflammatory and interferon responses, but can be myelosuppressive, resulting in thrombocytopenia and anemia in many patients13. Thrombocytopenic patients are more likely to be anemic and transfusion-dependent, and anemia is the most important negative prognostic indicator in myelofibrosis14 In contrast, pacritinib has demonstrated efficacy in thrombocytopenic patients presenting with a platelet count < 50–100 ×109/L, which may be related to lack of activity against JAK1 and/or its capacity to suppress inflammation mediator interleukin-1 receptor-associated kinase 1 (IRAK1), CSF1R, and FLT311,15. FLT3 is also a target of fedratinib, which is typically utilized as a second-line treatment for patients that have previously exhausted or developed resistance to ruxolitinib9. Lastly, momelotinib is a JAK2/JAK1/ACVR1 inhibitor that has also been shown to target TBK1 and IKBKE12. The suppressive effect of momelotinib on the BMP6/ACVR1/SMAD axis decreases liver production of the master iron regulator, hepcidin, and consequently increases iron availability16. As such, momelotinib has demonstrated capacity to ameliorate anemia and reverse or reduce transfusion dependency in transfusion-dependent myelofibrosis patients12.
Despite clear clinical benefit across stratified subsets of patients, direct head-to-head comparisons and mechanistic studies of these inhibitors have been lacking, especially their impact on oncogenic and cytokine-mediated signaling pathways that are characteristic of MPN disease. Here, we take a comprehensive approach to profile and assess the unique proliferative, transcriptional, and signaling pathways altered by these four JAK2 inhibitors.
Results
Anti-proliferative effects of JAK inhibitors
We first tested the potency of the four JAK2 inhibitors ruxolitinib, fedratinib, momelotinib, and pacritinib across in vitro settings. Auxiliary targets of these small molecule inhibitors are indicated in Fig 1A. In addition, JAK1 inhibitor itacitinib, which does not inhibit JAK2, was included as a comparative control. We performed cell viability assays across three human leukemic cells lines harboring the JAK2 V617F mutation (HEL, UKE-1, and SET2) and the murine line Ba/F3 cell line engineered to ectopically co-expresses the EPO receptor and mutant JAK2 (EpoR-JAK2VF). Across these four JAK2 mutant lines, ruxolitinib demonstrated the greatest potency followed by pacritinib, fedratinib, and momelotinib (Fig. 1B). As expected, anti-proliferative effects by itacitinib were observed only at much higher concentrations (Fig. 1B), consistent with dependency of these cell lines on JAK2 over JAK1. The effect of IL-3 on hyperactivation of the EPO receptor/JAK pathway conferred greater resistance to all five inhibitors in Ba/F3 cells, reiterating a potential mechanism of drug resistance via sustained JAK-STAT signaling (Fig. 1B, Supplemental Fig. 1). Since JAK2 inhibitors have ancillary targets, we sought to determine if combinatory treatment at lower doses would be synergistic. HEL cells were treated with 250nM either alone or in combination with 250nM of a second inhibitor. These assays were also performed using 500nM of inhibitors either alone or in combination. Mild synergy and/or additive effects were observed with combination treatment at both doses (Supplemental Fig. 2), suggesting anti-proliferative effects here were mainly due to on-target JAK2 inhibition.
Figure 1. In vitro efficacy of JAK inhibitors.

A) Table of primary and secondary targets of JAK inhibitors.
B) Cell viability assay of a cell line panel treated with JAK inhibitors. Cells were treated for 72 hours at the indicated drug doses. N= 6 replicates per condition.
C) Apoptosis assay of HEL and UKE-1 cells treated with JAK inhibitors at the indicated doses and duration. N = 3 replicates per condition.
D) Cell cycle assay of HEL and UKE-1 cells treated with JAK inhibitors at the indicated doses and duration. N = 3 replicates per condition.
E) CD34+ colony assay of eight MPN (colored dots) and three NBM (black dots) patient samples. Cells were seeded in MethoCult H4034 in the presence of 1 μM JAK inhibitors and grown for 14 days. Cells were plated in duplicate and numerated.
F) Relative potency ranking of JAK inhibitors from E).
We also treated the BCR-ABL+ K562 leukemia cell line, which lacks the JAK2 mutation, in which fedratinib and pacritinib demonstrated overlapping inhibitory curves and were ~10x more potent than momelotinib, ruxolitinib, and itacitinib (Fig. 1B). These observations suggest that inhibition of additional targets such as FLT3 in leukemic cell lines may be contributory to the anti-proliferative effects in JAK2VF-negative settings. To this, we also treated two JAK2VF-negative but FLT3-ITD (internal tandem duplication) mutant cell lines MOLM-13 and MV4–11 and compared their potency to FLT3-ITD inhibitors midostaurin and quizartinib (Fig. 1B). Dual JAK2/FLT3 inhibitors fedratinib and pacritinib at low doses eliminated almost all cells to a similar degree as conventional FLT3 inhibitors, followed by momelotinib as next potent, which recently was reported to demonstrate some affinity in targeting FLT317. Non-FLT3 targeting JAK2 inhibitors ruxolitinib and itacitinib demonstrated lower potency. These results in addition to our previous report18 that CD34+ HSPCs from sAML patients exhibit elevated wild-type FLT3 expression suggest that inhibitors with the capacity to simultaneously target FLT3 and JAK-STAT could prove to be beneficial across leukemias with distinct underlying genomic alterations.
Following, we performed apoptosis and cell cycle assays after treatment with JAK inhibitors across two time points. Pacritinib treatment led to the strongest induction of apoptosis, especially evident in the more sensitive UKE-1 cells (Fig. 1C). A similar degree of apoptosis in UKE-1 cells was also observed with fedratinib. In HEL cells, a more necroptotic profile was observed after treatment with fedratinib, momelotinib, and pacritinib. In cell cycle assays, JAK2 inhibitor-treated UKE-1 cells had varying abundance of sub-G1/non-viable cells but were consistent with phenotypes from apoptosis assays, and HEL cells demonstrated a milder profile (Fig. 1D). Of note, the apoptosis and cell cycle profiles of ruxolitinib and itacitinib were similar, however cells were significantly more sensitive to ruxolitinib in viability assays, indicating that ruxolitinib may inhibit survival through additional mechanisms.
CD34+ primary cells (Supplemental Table 1) from MPN patients (n= 8) and healthy bone marrow donors (n= 3) were then seeded for colony formation assays, in which erythroid colonies were more sensitive to drug inhibition than myeloid colonies as ruxolitinib, fedratinib, and pacritinib nearly abrogated formation of all erythroid colonies (Fig. 1E). Consistent with cell line in vitro assays, itacitinib also demonstrated lower potency compared to JAK2 inhibitors. Somewhat unexpectedly, we also observed that momelotinib spared erythroid colonies relative to other inhibitors. Clinically, anemia amelioration by momelotinib is a differentiator from ruxolitinib and fedratinib and patients treated with momelotinib demonstrated reversal of transfusion dependency through proposed mechanistic inhibition of tertiary target ACVR1/ALK2 and a decrease in the production of central iron regulator hepcidin12. Our observation of increased erythroid colony retainment by momelotinib ex vivo suggests contribution from additional mechanisms underlying anemia reversal potential. Lastly, given the innate heterogeneity of MPN patient samples, we adopted an inhibition index to assess the potency of JAK2 inhibitors in suppressing erythroid and myeloid colony formation. Across individual patient samples, each inhibitor was ranked from 1 (most) to 5 (least) potent. Pacritinib demonstrated greatest potency ex vivo, followed by ruxolitinib and fedratinib, momelotinib, and itacitinib (Fig. 1F). These findings contrast with our in vitro experiments, where ruxolitinib consistently exhibited a lower IC50 across all cell lines and may reflect additional underlying biology of human HSPCs.
Differentially altered expression profiles by JAK inhibitors
Next, we performed bulk RNA-sequencing (RNA-seq) on HEL cells treated with JAK inhibitors for 4 and 48 hours to assess acute and adaptive feedback effects. Differential gene expression (DEG) analysis relative to DMSO control revealed a total of 1,017 (ruxolitinib), 189 (fedratinib), 679 (momelotinib), 3,934 (pacritinib), and 74 (itacitinib) candidates with adjusted p-value < 0.05 after 4 hours drug treatment, and respectively, 3,856, 1,263, 505, 2,753, and 196 candidates with 48 hours treatment (Fig. 2A, B, Table S2). As expected, itacitinib treatment had the least transcriptional impact, while pacritinib induced the strongest acute alterations, with ruxolitinib exerting a greater impact with longer treatment. These findings may reflect distinctions between each inhibitor with regard to dynamic effects on transcriptional regulation. Consistent with this notion, only 82 and 103 DEGs relative to DMSO treatment were shared across the four JAK2 inhibitor treatments at 4 and 48 hours, respectively, indicating that overall, at the individual gene level, each drug imparts a unique inhibitory transcriptional profile.
Figure 2. RNA-seq of HEL cells treated with JAK inhibitors.
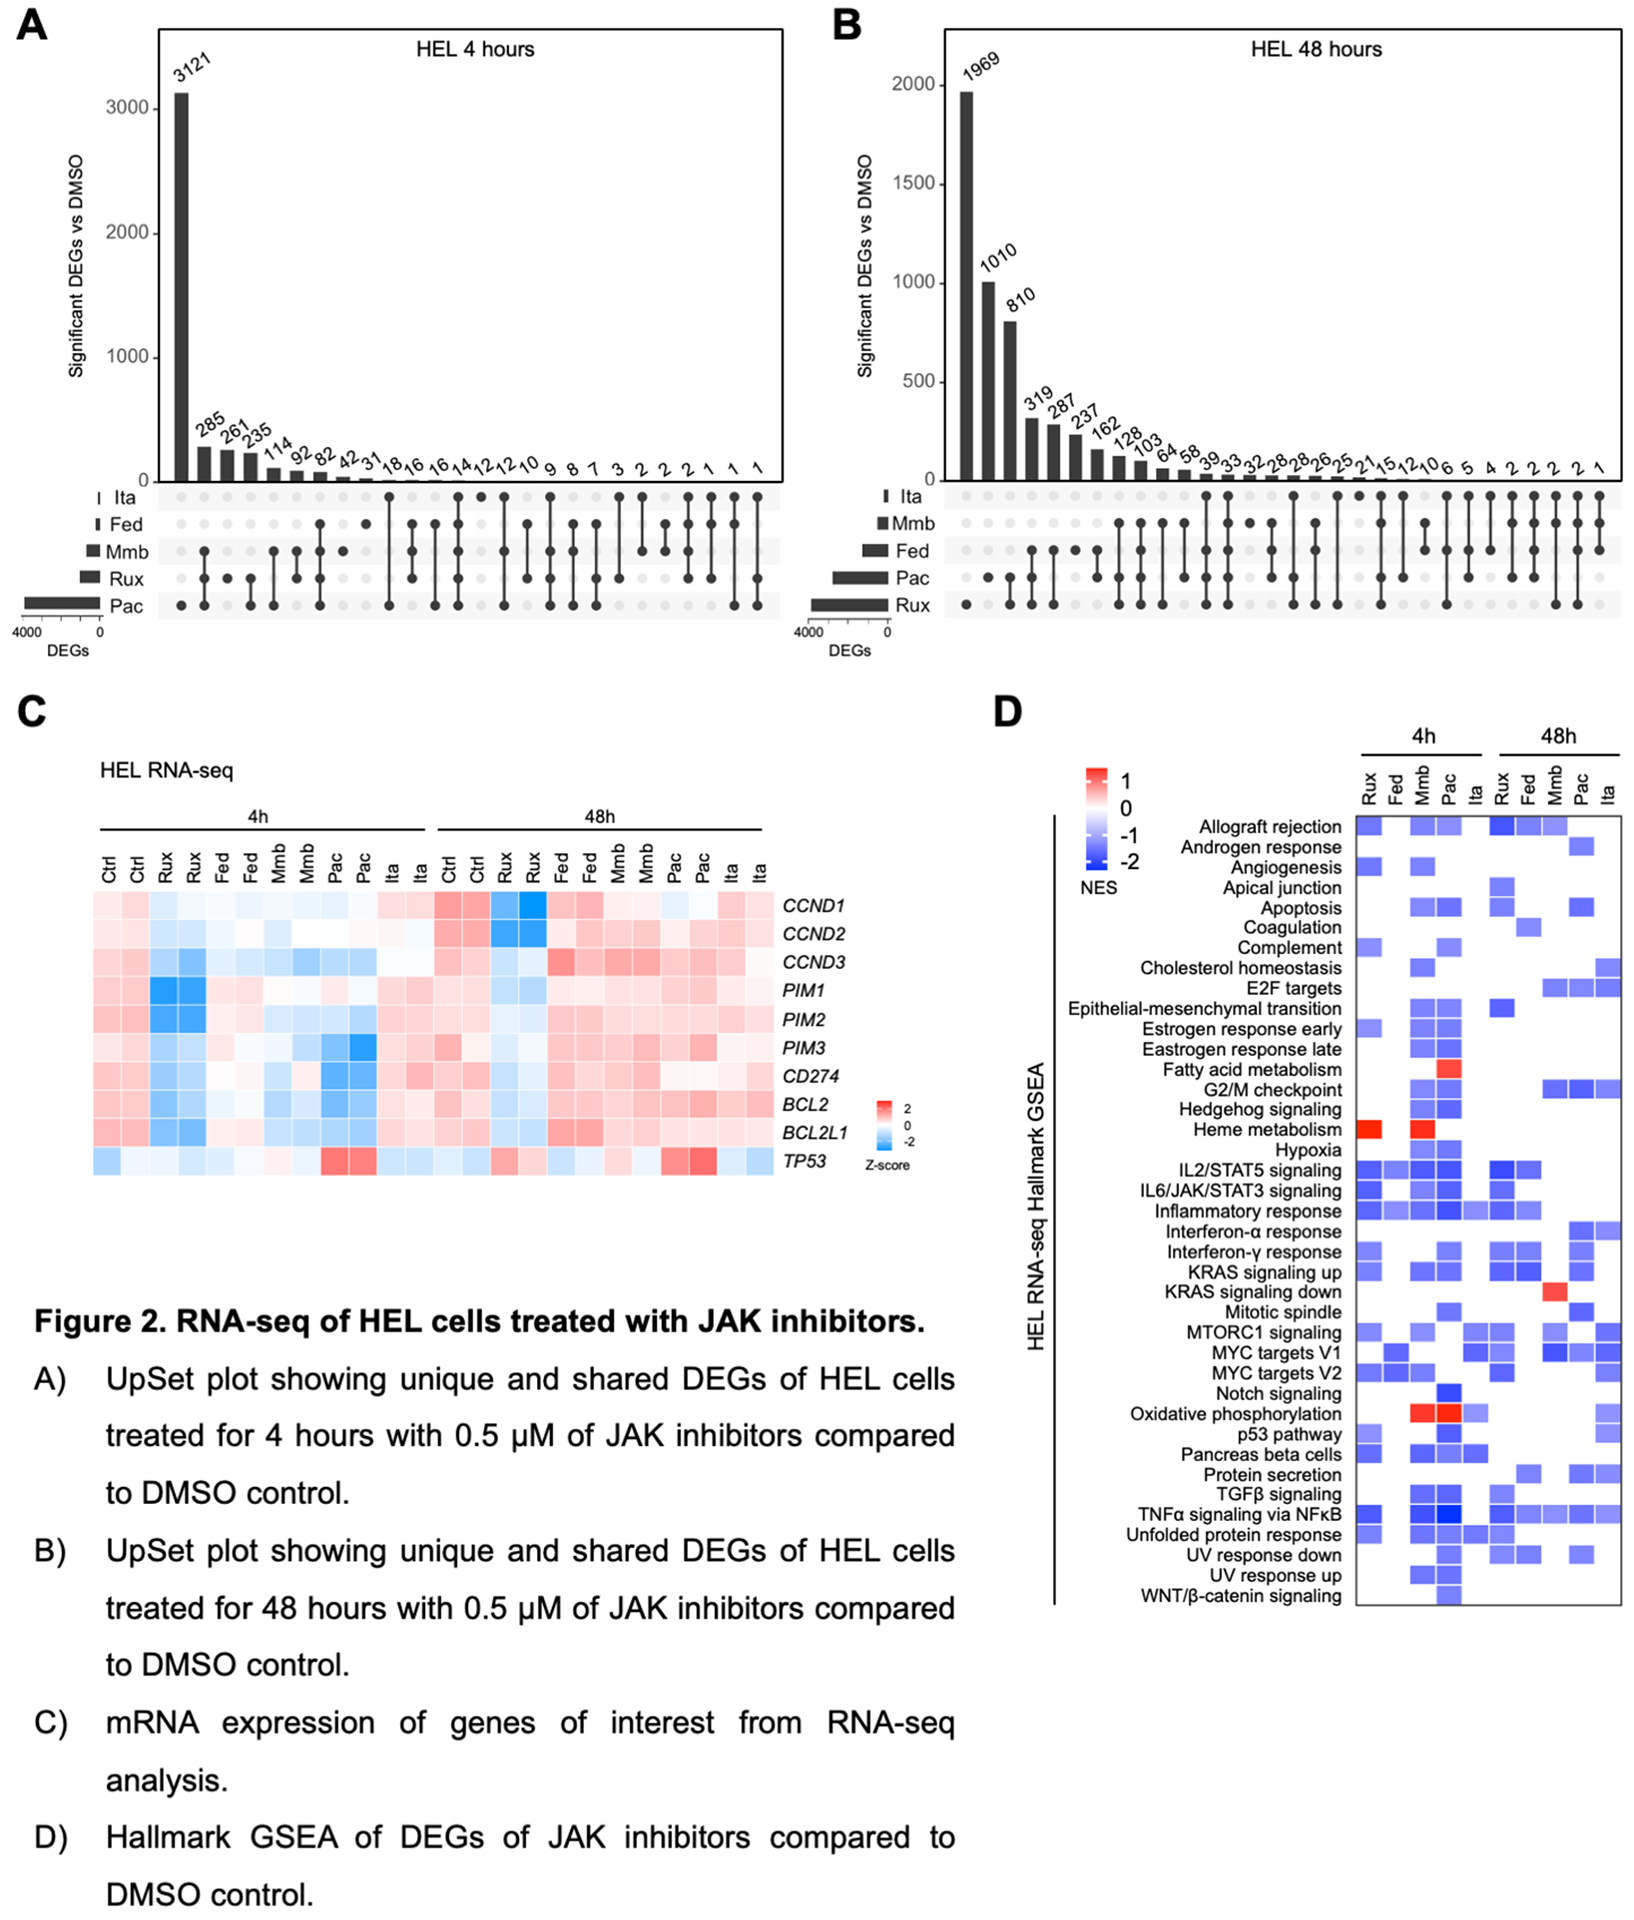
A) UpSet plot showing unique and shared DEGs of HEL cells treated for 4 hours with 0.5 μM of JAK inhibitors compared to DMSO control.
B) UpSet plot showing unique and shared DEGs of HEL cells treated for 48 hours with 0.5 μM of JAK inhibitors compared to DMSO control.
C) mRNA expression of genes of interest from RNA-seq analysis.
D) Hallmark GSEA of DEGs of JAK inhibitors compared to DMSO control.
We then examined additional genes of interest that play pivotal roles in mediating cell survival and immune regulation, that are also candidates currently evaluated for anti-cancer therapy. Ruxolitinib had the strongest effect in suppressing expression of cell cycle regulators CCND1, CCND2, CCND3 and the oncogene kinases PIM1, PIM2, and PIM3 (Fig. 2C). PIM1 is a downstream STAT target and overexpressed in JAK2 mutant patients and PIM inhibitors have been described to be efficacious across pre-clinical MPN models either alone or with ruxolitinib and are undergoing clinical trials in MF19,20. All JAK2 inhibitors resulted in downregulation of BCL2 and BCL2L1 (BCL-xL), with ruxolitinib sustaining inhibition at 48 hours. Similarly, inhibitors augmenting pro-apoptotic pathways through inhibition of BCL2 and BCL-xL have demonstrated efficacy across MPN models and are under evaluation in MF as well as accelerated/blast phase MPNs21–24. We also observed that immune checkpoint protein PD-L1 (CD274) was only suppressed by ruxolitinib at both timepoints, despite its well-established regulation by STAT3.
At a pathway level, gene set enrichment analysis (GSEA) of the DEG using the Hallmark gene set did reveal similarly altered pathways, with at least 3 JAK2 inhibitors having capacity to suppress IL2/STAT5, IL6/JAK/STAT3, and TNFα signaling via NFκB pathways, and all 5 inhibitors inhibiting the inflammatory response with acute 4h treatment (Fig. 2D). Longer 48h treatment notably led to more related cell cycle suppressive phenotypes such as G2/M checkpoint, E2F targets, and MYC targets, and all five inhibitors were observed to suppress NFκB signaling. We also observed upregulation of multiple metabolic pathways, namely heme metabolism by ruxolitinib and momelotinib, oxidative phosphorylation by momelotinib and pacritinib, and fatty acid metabolism by pacritinib (Fig. 2D, Supplemental Fig. 3A). For further functional insight into metabolic alterations mediated by pacritinib (and the other inhibitors), we pre-treated PBMCs from two MPN patients and a healthy donor for 1-hour ex vivo with inhibitors before performing Mito Stress assays to evaluate their impact on mitochondrial function. The strongest suppression of oxygen consumption rate (OCR) was mediated by incubation with pacritinib and fedratinib, with comparable effects observed across both MF and healthy donor cells (Supplemental Fig. 3B), whereas ruxolitinib, momelotinib, and itacitinib induced relatively mild effects. We then pre-treated PBMCs from four more healthy donors and two ET patients with pacritinib and observed consistent reduction in the maximal mitochondrial respiration following stimulation with carbonyl cyanide p-trifluoromethoxyphenylhydrazone (FCCP; Supplemental Fig. 3C). Suppressive effects by pacritinib were also comparable to pre-treatment with etomoxir, an inhibitor of carnitine palmitoyltransferase-1 (CPT-1) important for fatty acid oxidation-mediated ATP production. These observations suggest that the transcriptional increase in mediators of oxidative phosphorylation and fatty acid metabolism may reflect adaptive feedback in response to metabolic strain predominantly induced by pacritinib. Thus, despite all four JAK2 inhibitors having affinity in suppressing the JAK-STAT signaling pathway, their varying degrees on the alteration of transcriptional, proteomic, and metabolic profiles are evidently distinct.
Suspension mass cytometry reveals suppression of dominant signaling and cytokine pathways by JAK inhibitors
To corroborate the anti-proliferative features, we interrogated altered signaling pathways in HEL cells at single cell resolution using suspension mass cytometry (CyTOF) after treatment with JAK inhibitors. 1-hour treatment with 0.2 μM of inhibitors led to suppression of pSTAT1, pSTAT3, and pSTAT5, and pS6 most prominently observed with ruxolitinib (Fig. 3A). Signal suppression was near-saturation at this low dose, whereas more apparent dose-dependent suppression of these pathways was observed with the other inhibitors (Fig. 3A). These results corroborate cell viability observations in HEL cells and reflect sensitivity profiles to ruxolitinib and itacitinib at spectrum ends and the other inhibitors in between.
Figure 3. CyTOF analysis of altered signaling pathways by JAK inhibitors.

A) Dominant STAT and S6 pathway suppression by JAK2 inhibitors at multiple doses in HEL cells. Cells were treated for 1 hour at the indicated drug dosage. Heatmap values reflect median Arcsinh ratio.
B) Representative dimension plot of cell populations from an MF patient.
C) CyTOF analysis of signalling pathways across nine MPN and three NBM samples after ex vivo JAK inhibitor treatment in the presence of TPO stimulation. Primary samples were treated with 1 μM JAK inhibitors and 20ng/mL TPO for 1 hour. Heatmap values reflect column Z-scores.
Using the same signaling CyTOF antibody panel and introducing cell surface markers, we assessed signaling changes across different cell populations in nine unique MPN PB patient samples and three healthy donor BM (NBM) samples treated ex vivo with JAK inhibitors under stimulation with thrombopoietin (TPO, Fig. 3B, C). In lineage negative (lin-) CD34+ cells, the most significant signaling suppression was observed in phosphorylated STAT proteins, with the four JAK2 inhibitors showing similar degrees, while itacitinib was less potent. Inhibition was also similar between MPN and healthy donor samples. In B cells we observed a shift of altered effectors away from JAK-STAT signaling and differential responses by the inhibitors: pacritinib suppressed IκBα, phospho-ERK, and phospho-CREB levels, while momelotinib inhibited pTBK1. Similar observations were noted in T cells, which in addition exhibited suppression of pSTAT1 and pSTAT3. Lastly, these NFκB, CREB, JAK-STAT, and TBK1 signaling pathways were suppressed in erythroid cells by JAK inhibitors. Taken together, these findings indicate heterogeneous suppression responses across unique cell types and further highlight nuances beyond suppression of solely JAK/STAT by these inhibitors.
In addition to elevated oncogenic signaling, inflammation is also a hallmark of MPN that leads to disease progression and transformation. We performed additional CyTOF experiments on five MPN patients to assess whether JAK2 inhibitors had capacity to suppress TPO-induced production of inflammatory cytokines. In these primary samples we observed a large population of CD14+ monocytes, which was also the major source of production of pro-inflammatory cytokines including TNF, IL-6, IL-8, CCL3/ MIP1⍺, and CCL4/MIP1β (Fig. 4A, B). Importantly, we observed these cytokines profiles to be suppressed after JAK2 inhibition: the degree of TNF inhibition was relatively consistent across all four inhibitors, albeit lower than other cytokines. Fedratinib, momelotinib, and pacritinib demonstrated greater efficacy in reducing CCL4, with the latter two more potently reducing IL-6 and CCL3 (Fig. 4C). Relative to other inhibitors, pacritinib was most efficacious in reducing IL-8, whereas acute ex vivo momelotinib treatment resulted in increased IL-8 production, mild response by fedratinib, and heterogeneous response by ruxolitinib. Suppressive effects were also observed of IL-10 and IL-1RA by the inhibitors. Momelotinib and pacritinib demonstrated the greatest ability to suppressed induction of some cytokines even below basal levels, whereas levels remained elevated or at baseline for ruxolitinib (Supplemental Fig. 4). These partial suppressive effects by ruxolitinib are consistent with our previous reports of low potency to directly suppress NFκB mediated signaling25,26. Overall, pacritinib demonstrated a superior inhibitory profile, which may be in part due to additional suppression of IRAK1. As with our transcriptome profiling, these findings reinforce that JAK2 inhibitors have both shared and unique profiles of pro-inflammatory cytokine suppression, which may relate to their clinical activity and potential to impact MPN disease progression.
Figure 4. Differential pro-inflammatory cytokine suppression by JAK2 inhibitors.

A) Representative dimension plot of cell populations from MF patient #2.
B) Heatmaps of pro-inflammatory cytokine induction across various cell populations upon 4 hours of 10ng/mL TPO stimulation. Values represent 90th percentile Arcsinh ratios.
C) Waterfall plot of altered cytokine production in CD14+ monocytes from five MF samples and one NBM sample upon JAK2 inhibitor treatment relative to TPO stimulation alone. Cells were treated for 4 hours with 5 μM JAK2 inhibitors in the presence of 10ng/mL TPO. Values represent 90th percentile Arcsinh ratios.
Pacritinib shares similar suppression of hepcidin as momelotinib
Chronic pro-inflammatory cytokines and bone morphogenetic protein (BMP) molecules in the microenvironment niche induce hepatocytes to upregulate hepcidin production and iron sequestration27 (Fig. 5A). We previously showed that hepcidin levels remain elevated in patients on ruxolitinib treatment28 which together with clinical evidence of dose-dependent anemia with ruxolitinib8 indicate that alternative therapy may be necessary for these patients and that sole JAK1/2 suppression may be insufficient across a subset of patients. As previously discussed, momelotinib in contrast has demonstrated reversal of transfusion dependency and anemia benefit for some MF patients, which has been postulated to be a consequence of hepcidin suppression via inhibition of ACVR112. To better assess the capacity of JAK2 inhibitors to modulate iron dynamics, we utilized the HepG2 liver cell line which expresses high levels of hepcidin (HAMP; Fig. 5B). Stimulation of HepG2 cells with agonist BMP6 led to marked HAMP induction that was at least partially suppressed by all JAK2 inhibitors, with the strongest effect by pacritinib (Fig. 5C). Pacritinib also induced greater suppression of pSMAD1/5/9 in addition to pSTAT3, pSTAT5, and pS6 relative to momelotinib and other JAK inhibitors (Fig. 5D). These data are consistent with recent studies showing that pacritinib demonstrates potent ACVR1 inhibition with greater potency than other JAK2 inhibitors, in conjunction with anemia response based on retrospective analysis of the phase 3 PERSIST-2 trial29. In addition to BMP6 stimulation, we also observed similar potency of pacritinib in reducing hepcidin induction by IL-6 (Fig. 5E, F). These data reveal that dual inhibition of JAK-STAT and ACVR1 pathway signaling may be necessary to improve iron availability and address anemia in MPN patients.
Figure 5. Regulation of hepcidin by JAK inhibitors.

A) Schematic of hepcidin regulation.
B) Hepcidin (HAMP) mRNA expression across multiple cell line lineages from the Cancer Cell Line Encyclopedia.
C) qRT-PCR of HAMP expression upon JAK treatment in the presence of BMP6 stimulation in HepG2 cells. Cells were treated with 0.5 μM JAK inhibitor and/or 10ng/mL BMP6 for 24 hours. N = 3 replicates. HAMP expression normalized to actin (ACTB).
D) Immunoblot of JAK-STAT, SMAD, and S6 signaling pathways upon JAK inhibitor treatment in the presence of BMP6 stimulation. Cells were treated with 1 μM JAK inhibitor and/or 10ng/mL BMP6 for 24 hours.
E) qRT-PCR of HAMP expression upon JAK treatment in the presence of IL-6 stimulation in HepG2 cells. Cells were treated with 1 μM JAK inhibitor and/or 10ng/mL IL-6 for 24 hours. N = 3 replicates. HAMP expression normalized to actin (ACTB).
F) Immunoblot of the JAK-STAT pathway upon JAK inhibitor treatment in the presence of IL-6 stimulation. Cells were treated with 1 μM JAK inhibitor and/or 10ng/mL IL-6 for 24 hours.
Potency of JAK2 inhibitors across MPN and sAML PDX models
Lastly, we sought to compare the in vivo potency of JAK2 inhibitors using patient-derived xenograft (PDX) models in which engrafted cells propagate MPN patient disease features. First, CD34+ cells from PMF patient 298191 were transplanted into NSGS mice and following engraftment were treated twice daily with intraperitoneal injection of JAK2 inhibitors (Fig. 6A). Taking into account the conventional dosage ranges utilized by us and others across other syngeneic and PDX MPN models, we elected to uniformly administer inhibitors at a dose of 50mg/kg to NSGS mice. Across the 4-week treatment regimen in 298191 PDX, we observed significant reduction in human CD45 positive (hCD45+) cells in the PB by pacritinib, and trends by ruxolitinib, fedratinib, and momelotinib (Fig. 6B). Suppression of hCD45+ cells was more prominent in the bone marrow as seen with all four inhibitors and with pacritinib being most pronounced (Fig. 6C). All four inhibitors also reduced spleen weights but only pacritinib significantly reduced liver weights (Fig. 6D, E). We performed a second PDX experiment by engrafting CD34+ cells from PMF patient 663381 (Fig. 6F). Pacritinib was the most potent in suppressing leukemic engraftment in the peripheral blood (Fig. 6G) and bone marrow (Fig. 6H), while ruxolitinib and fedratinib also demonstrated some efficacy in suppressing bone marrow engraftment. Ruxolitinib, fedratinib, and pacritinib all significantly reduced spleen weight while no changes to liver weight were seen with any of the four inhibitors (Fig. 6I, J). Vehicle treated mice were all moribund by week 3 of treatment and survival was significantly prolonged with all JAK2 inhibitor treatment, with all animals surviving in pacritinib treatment group after four weeks of treatment at end point (Fig. 6K). Across these two PDX models, these results demonstrate greatest potency of pacritinib at the indicated treatment dosage in suppressing disease burden.
Figure 6. Efficacy of JAK2 inhibitors in MF PDX models.

A) Schematic of the CD34+ 298191 PMF patient-derived xenograft mouse model. CD34+ cells were isolated and transplanted into NSGS mice and treated with 50mg/kg of JAK2 inhibitor (n= 5 per group) or vehicle (n= 4).
B) Percentage of human CD45 (hCD45+) cells in the peripheral blood (PB) of transplanted mice treated with vehicle or JAK2 inhibitors across four weeks. Statistics were assessed by two-way ANOVA comparing vehicle vs JAK2 inhibitor.
C) Percentage of hCD45+ cells in the bone marrow (BM) of transplanted mice treated with vehicle or JAK2 inhibitors at endpoint. Statistics were assessed by one-way ANOVA comparing vehicle vs each individual treatment group with Dunnett’s multiple comparison test.
D) Normalized spleen weights at endpoint. Statistics were assessed by one-way ANOVA comparing vehicle vs each individual treatment group with Dunnett’s multiple comparison test.
E) Normalized liver weights at endpoint. Statistics were assessed by one-way ANOVA comparing vehicle vs each individual treatment group with Dunnett’s multiple comparison test.
F) Schematic of the CD34+ 663381 PMF PDX mouse model. CD34+ cells were isolated and transplanted into NSGS mice and treated with 50mg/kg of JAK2 inhibitor or vehicle (n= 5 in each group).
G) Percentage of hCD45+ cells in the PB of transplanted mice treated with vehicle or JAK2 inhibitors across four weeks.
H) Percentage of hCD45+ cells in the BM of transplanted mice treated with vehicle or JAK2 inhibitors at endpoint. Statistics were assessed by one-way ANOVA comparing vehicle vs each individual treatment group with Dunnett’s multiple comparison test.
I) Normalized spleen weights at endpoint. Statistics were assessed by one-way ANOVA comparing vehicle vs each individual treatment group with Dunnett’s multiple comparison test.
J) Normalized liver weights at endpoint.
K) Kaplan-Meier survival analysis of transplanted mice treated with vehicle or JAK2 inhibitors were assessed by log-rank test with comparisons as denoted.
Discussion
With an increasing number of JAK inhibitors now approved or undergoing late stage clinical investigation for and beyond MPNs, mechanistic and comprehensive studies become more pivotal to distill insights to maximize and guide use of these targeted therapies. The study described here encompasses head-to-head comparative analyses between current JAK2 inhibitors for MPN patients and is, to the best of our knowledge, the first of its kind to incorporate in vitro, ex vivo, and in vivo models in this setting.
Potent on-target suppression of JAK-STAT signaling was evident with ruxolitinib, fedratinib, momelotinib, and pacritinib across all assays examined. Additionally, both overlapping and distinct effects were identified on ancillary targets, signaling pathways, and influence on the pro-inflammatory microenvironment, which may relate to distinct clinical benefits observed with these agents used therapeutically. Across in vitro JAK2-mutant cell line models, all JAK2 inhibitors demonstrated similar anti-proliferative effects at sub-micromolar doses. However, greater nuance was recognized when utilizing primary CD34+ HSPCs, in which pacritinib eliminated all colony formation while momelotinib preferentially spared those of erythroid lineage. These findings reiterate the importance of direct interrogation of patient samples and consideration of cell heterogeneity between and within samples. The latter was evident across mass cytometry assays evaluating suppressed signaling pathways across primary samples. Although JAK-STAT signaling was suppressed in Lin- CD34+ HSPCs by all JAK2 inhibitors, individual inhibitors demonstrated selective pathway inhibition including NFκB, MAPK, TBK, across other populations including lymphoid, erythroid, and megakaryocyte cells, which could relate to the clinical profile of each drug, as well as their potential to impact MPN disease progression. Our analyses also identified distinct metabolic effects of each inhibitor which may further differentiate each drug and guide how it may be utilized, either alone or combination with other therapies.
Indeed, it has become increasingly evident that monotherapy with JAK2 inhibitors can provide important clinical benefit in ameliorating symptoms and reducing splenomegaly, but they appear to lack the capacity to eradicate the underlying malignant clone. One reason includes the aforementioned parallel pathways that may remain active or are upregulated as compensation in spite of JAK-STAT suppression. Ongoing studies encompassing the combination of JAK2 inhibitors with agents targeting MAPK30,31 (ex. trametinib), PI3K/AKT32 (ex. parsaclisib), and BET33 (ex. pelabresib) effectors are among a handful that have demonstrated encouraging pre-clinical and clinical efficacy. Inflammation is another critical contributor to MPN disease features and driver of disease progression. Here, greater inhibition of pro-inflammatory cytokine production such as TNF, CCL3/MIP1⍺, and CCL4/MIP1β was observed by momelotinib and pacritinib relative to ruxolitinib and fedratinib, which could be a consequence of suppressing IKBKE or IRAK1. Although ruxolitinib has demonstrated partial suppression of some of these biomarkers34, our ex vivo data support that similar or greater benefits may be observed by alternative agents.
Our study also provides relevant insights with regard to erythropoiesis, iron homeostasis, and anemia response observed clinically with specific JAK2 inhibitors, in particular momelotinib and pacritinib. Amelioration of anemia with momelotinib has been attributed to inhibition of ACVR1 leading to suppression of hepcidin, thereby restoring iron availability and promoting erythropoiesis12,16. Here we demonstrated that pacritinib also inhibits ACVR1-mediated activation of hepcidin production. These findings further illustrate important distinctions between specific JAK2 inhibitors and may help guide use of these agents for individual MF patients. Notably, anemia and thrombocytopenia are still the most common grade 3 or 4 treatment-emergent hematologic events of these anti-JAK2 agents15,35 despite potential benefit for a subset of patients, further highlighting the importance of a personalized approach to the use of these inhibitors.
In summary, the findings presented here represent the most comprehensive, comparative analyses of JAK2 inhibitors to date and reveal important differential effects relevant to use of these specific inhibitors clinically, and additionally serve as an important resource for the rational design of combination therapy approaches.
Methods
Cell culture
HEL (ATCC), UKE-1 (Coriell Institute), SET2 (DSMZ), and MOLM-13 (DSMZ) cells were cultured in RPMI-1640 medium (ATCC 30–2001). K562 (ATCC) and MV4–11 (ATCC) cells was cultured in IMEM. HepG2 (ATCC) cells were cultured in DMEM. Ba/F3 (DSMZ) cells transduced with EpoR-JAK2VF were cultured in RPMI 1640 30–2001 supplemented with 1 ng/mL murine IL-3. All media were supplemented with 10% FBS and 1% penicillin-streptomycin antibiotics. All cell lines were maintained at 37°C and 5% CO2 and regularly tested for Mycoplasma.
Compounds and antibodies
Ruxolitinib, fedratinib, pacritinib, itacitinib, midostaurin, and quizartinib were purchased from Selleck Chemicals (Houston, TX). Momelotinib was purchased from ChemieTek (Indiapolis, IN). Etomoxir was purchased from Millipore Sigma (Burlington, MA). Human TPO and murine IL-3 were purchased from Peprotech (Rocky Hill, NJ). Protein Transport Inhibitor Cocktail (500X) was purchased from ThermoFisher.
Immunobloting antibodies were used as follows: pSTAT3 Y705 (#9131), pSTAT5 Y694 (#9351), pSmad1 S463/465/ pSmad5 S463/465/ pSmad9 S465/467 (D5B10, #13820), pS6 S235/236 (D57.2.2E, #4858), β-Actin (8H10D10, #3700), and p44/42 MAPK T202/Y204 (Erk1/2; #9101) from Cell Signaling Technology (Danvers, MA). HSP90 (sc-13119) from Santa Cruz Biotechnology (Dallas, TX).
Cell viability assay
2–8 × 10³ cells were seeded in 96-well plates. 24 hours post seeding, cells were treated with serial dilution of inhibitors for 72 hours. Relative cell viability was determined using AlamarBlue cell viability reagent and results were normalized to the DMSO control condition. Fluorescence was detected using a plate reader. Combination index calculations were performed as previously described36 and utilizing the Chou-Talalay method37.
Annexin V apoptosis assay
Assays were performed using the PE Annexin V Apoptosis Detection Kit I (BD Biosciences). Cells were washed with PBS and resuspended in binding buffer, incubated with PE-Annexin V, and stained with 7-AAD viability staining solution. Cells were then analyzed by flow cytometry using the BD FACSCanto II Cell Analyzer, in which AnnexinV+/7-AAD+ cells were identified as necroptotic, AnnexinV+/7-AAD- as apoptotic, and AnnexinV-/7-AAD- as healthy.
Cell cycle assay
Treated cells were washed with PBS and fixed in 70% ethanol for 24 hours. Cells were then washed with PBS and then treated with RNase, followed by staining with propidium iodide. Cells were then analyzed by flow cytometry using the BD FACSCanto II Cell Analyzer.
Ex vivo colony assays
Cryopreserved peripheral blood mononuclear cells (PBMCs) from MPN patients and bone marrow mononuclear cells (BMMCs) from healthy donors were thawed and sorted using AutoMACS (Miltenyi) with CD34 positive selection beads (Miltenyi). Sorted CD34+ cells were then seeded in duplicate at 1 × 10³ cells/well into MethoCult H4034 (StemCell) in the presence of 1 μM of inhibitor, grown for 10–12 days, and then enumerated.
RNA-sequencing (RNA-seq)
HEL cells were treated with 500nM of JAK inhibitors for 4h and 48h after which RNA was extracted with the RNeasy Mini Kit (Qiagen) with DNase treatment in duplicate. Samples were then indexed, pooled, and sequenced by Illumina NovaSeq 6000. Basecalls and demultiplexing were performed with Illumina’s bcl2fastq software and a custom python demultiplexing program with a maximum of one mismatch in the indexing read. RNA-seq reads were then aligned to the Ensembl release 76 primary assembly with STAR version 2.5.1a38. TMM normalization size factors in EdgeR39 were calculated to adjust for samples for differences in library size. Ribosomal genes and genes not expressed in the smallest group size minus one samples greater than one count-per-million were excluded from further analysis. The TMM size factors and the matrix of counts were then imported into the R/Bioconductor package Limma40. Differential expression analysis was then performed to analyze for differences between conditions and the results were filtered for only those genes with Benjamini-Hochberg false-discovery rate adjusted p-values less than or equal to 0.05. Additional DEG analysis was performed with DESeq241. Gene set enrichment analysis (GSEA) was performed using GSEA42 software with the Hallmark gene set.
Cell Mito Stress assays
PBMCs from MPN patients were seeded and bioenergetic measurements were determined using the Seahorse XFe96 Analyzer (Agilent Technologies) as previously described43. After measurement of basal oxygen consumption rate (OCR), OCR due to proton leak was determined by oligomycin A (1.5 μM) treatment. Maximal uncoupled OCR was measured by carbonyl cyanide p-(trifluoro-methoxy) phenyl-hydrazone (FCCP; 0.5 μM) treatment. Nonmitochondrial OCR was measured in the presence of Rotenone/antimycin A (1 μM).
qRT-PCR
RNA from cell lines were extracted using the RNeasy Mini Kit (Qiagen, Hilden, Germany). cDNA was synthesized using the Maxima First-Strand cDNA Synthesis Kit (ThermoFisher). Relative mRNA levels were measured through qRT-PCR using SYBR Green Master Mix (Roche) and normalized to the expression of β-actin (ACTB). Primer sequences are as follows:
ACTB forward, 5′- GTTGTCGACGACGAGCG -3′
ACTB reverse, 5′- GCACAGAGCCTCGCCTT -3′
HAMP forward, 5’- CACAACAGACGGGACAACTT -3’
HAMP reverse, 5’- CGCAGCAGAAAATGCAGATG -3’
Immunoblotting
Cells were collected and lysed with Laemmli Sample Buffer (BioRad, Hercules, CA) with beta-mercaptoethanol and heated at 95°C. Samples were processed with NuPAGE Novex Gel Electrophoresis Systems (ThermoFisher) followed by standard immunoblotting procedure.
Expression data from the Cancer Cell Line Encyclopedia (CCLE)44
Gene expression of HAMP (Expression Public 21Q1) were accessed from CCLE by the Broad Institute.
Suspension mass cytometry (CyTOF)
Signaling and cytokine CyTOF experiments utilizing HEL cells and patient PBMCs and BMMCs were conducted on a CyTOF2 mass cytometer (Fluidigm) with validated antibody panels following protocol as previously described18,25,26,45. In brief, cells were labelled with cisplatin, washed, and incubated with indicated stimulant or inhibitor for the indicated duration. Cells were then fixed with paraformaldehyde, permeabilized, and barcoded. Following, cells were stained with surface marker antibodies, permeabilized with methanol, stained with intracellular antibodies, and resuspended in DNA IR-intercalator. For cytokine CyTOF experiments, primary cells were incubated with 5 μM JAK2 inhibitors and TPO for 4 hours, and protein transport inhibitor cocktail (eBioscience) was added at the 2-hour treatment mark. For signaling CyTOF experiments, HEL and primary cells were labeled with cisplatin, treated with indicated inhibitors for 1 hour, fixed, barcoded, and permeabilized with methanol. Following, cells were stained with intracellular antibodies resuspended in Ir-intercalator. Cell identities were demultiplexed through debarcoding and data was analyzed in Cytobank (https://wustl.cytobank.org/). Lin- negative CD34+ cells were gated as follows: CD3-, CD19-, CD235-, CD71-, CD61-, CD14-, CD16-, CD38-, CD34+.
Patient-derived xenograft mouse models
PDX models were performed following protocol as previously described46. In brief, PBMCs were isolated by Ficoll gradient extraction and CD34+ cells were isolated using magnetic enrichment (Miltenyi Biotec #130-100-453) and cultured overnight in SFEMII media (StemCell Technologies #09605) supplemented with Pen-Strep (50 Units/mL), human stem cell factor (SCF; 50 ng/mL), human thrombopoietin (TPO; 50 ng/mL), and human FLT3L (50 ng/mL). Human cells were transplanted into sublethally irradiated (200 cGy) 6–9 week-old NOD-scid-Il2rg-null-3/GM/SF (NSGS; The Jackson Laboratory #013062). NSGS mice were transplanted with 1 × 10⁵ cells via intra-tibial injection under anaesthesia with intraperitoneal injection of ketamine/xylazine mixture (2 mg/mouse; KetaVed). Four-to-five weeks after transplant, mice were treated with 5% dimethyl acetamide 0.5% methylcellulose by oral gavage or 50 mg/kg JAK2 inhibitors by oral gavage twice a day Monday through Friday for four weeks or until sacrifice. Peripheral blood was collected weekly and engraftment was evaluated by flow cytometry. Bone marrow, spleens and livers were collected at endpoint and organs weights were normalized to mouse body weight at endpoint.
Data availability
Sequencing data is deposited in the Gene Expression Omnibus (GEO) with accession number GSE229712. Mass cytometry data is available upon request on https://wustl.cytobank.org/. Graphical abstract created with BioRender.com.
Statistical analysis
Statistical analyses were performed using GraphPad Prism (San Diego, CA) and R software. *, p < 0.05; **, p < 0.01; ***, p < 0.001; ****, p < 0.0001. All measurements were taken from distinct samples. All relevant assays were performed independently at least 3 times.
Study approval
All research complies with all relevant ethical regulations. Patient samples were obtained according to a protocol approved by the Washington University Human Studies Committee (WU no. 01–1014) and written informed consent was received prior to participation. All in vivo procedures were conducted in accordance with the Institutional Animal Care and Use Committee of Washington University (no. 20–0463).
Supplementary Material
Supplemental Figure 1. Effect of IL-3 on JAK inhibitor sensitivity. Cell viability assay of Ba/F3 cells treated with JAK inhibitors in the presence or absence of IL-3. Cells were treated for 72 hours at the indicated drug doses. N= 6 replicates per condition.
Supplemental Figure 2. Cell viability assays of HEL cells treated with combinations of JAK2 inhibitors. Cells were treated for 72 hours at the indicated drug doses. N= 6 replicates per condition. Combination indices (CI) was calculated using the Chou-Talalay method, where CI = 1 is additive, CI < 1 is synergistic, and CI > 1 is antagonistic.
Supplemental Figure 3. Metabolic alterations by JAK inhibitors.
A) Enrichment plots from gene set enrichment analyses from RNA-seq data of pacritinib treatment of HEL cells. NES = normalized enrichment score.
B) Oxygen consumption rate (OCR) traces from Seahorse metabolic assays of PBMCs from two MF and one healthy donor treated with 5 μM JAK2 inhibitors for 1 hour before sequential addition of a: oligomycin, b: FCCP, and c: antimycinA/rotenone.
C) Maximum respiration calculations of PBMCs from two MF and one healthy donor from B) in addition to two ET and four additional healthy donors treated with 5 μM pacritinib, 1 μM, or 10 μM etomoxir in Seahorse metabolic assays.
Supplemental Figure 4. Cytokine mass cytometry on primary samples.
Cytokine production in CD14+ monocytes from five MF samples and one NBM sample upon JAK2 inhibitor treatment relative to basal levels. Cells were treated for 4 hours with 5 μM JAK2 inhibitors in the presence of 10ng/mL TPO. Values represent 90th percentile Arcsinh ratios.
Supplemental Table 1. Characteristics of patient samples utilized in this study.
Supplemental Table 2: DEG analysis of HEL cells treated with JAK inhibitors.
Acknowledgements
Technical support was provided by the Alvin J. Siteman Cancer Center Tissue Procurement Core Facility, Barnes-Jewish Hospital, Institute of Clinical and Translational Sciences, and Immunomonitoring Laboratory, which are supported by NCATS Clinical and Translational Sciences Award, #UL1 TR002345 and NCI Cancer Center Support Grant P30CA91842 and by the Andrew M and Jane M Bursky Center for Human Immunology and Immunotherapy Programs. We thank Diane Bender, Roderick Lin, and Kristin Link for assistance with mass cytometry. We thank Mary Fulbright for assistance with mouse colony management.
Funding information
This work was supported by NIH grant R01HL134952 (S.T.O.), a Canadian Institutes of Health Research (CIHR) Doctoral Foreign Study Award (T.K.), MPN Research Foundation (S.T.O.), Leukemia and Lymphoma Society Translational Research Program (S.T.O.), and When Everyone Survives Foundation (S.T.O).
Footnotes
Conflict of interest
S.T.O. has served as a consultant for Kartos Therapeutics, CTI BioPharma, Celgene/Bristol Myers Squibb, Disc Medicine, Blueprint Medicines, PharmaEssentia, Constellation, Geron, Abbvie, Sierra Oncology, and Incyte. All other authors disclose no competing interests.
References
- 1.Fisher DAC, Fowles JS, Zhou A & Oh ST Inflammatory Pathophysiology as a Contributor to Myeloproliferative Neoplasms. Front Immunol 12, 683401, doi: 10.3389/fimmu.2021.683401 (2021). [DOI] [PMC free article] [PubMed] [Google Scholar]
- 2.Klampfl T et al. Somatic mutations of calreticulin in myeloproliferative neoplasms. N Engl J Med 369, 2379–2390, doi: 10.1056/NEJMoa1311347 (2013). [DOI] [PubMed] [Google Scholar]
- 3.Hasselbalch HC & Bjorn ME MPNs as Inflammatory Diseases: The Evidence, Consequences, and Perspectives. Mediators Inflamm 2015, 102476, doi: 10.1155/2015/102476 (2015). [DOI] [PMC free article] [PubMed] [Google Scholar]
- 4.Dunbar AJ, Rampal RK & Levine R Leukemia secondary to myeloproliferative neoplasms. Blood 136, 61–70, doi: 10.1182/blood.2019000943 (2020). [DOI] [PMC free article] [PubMed] [Google Scholar]
- 5.Gerds AT et al. Myeloproliferative Neoplasms, Version 3.2022, NCCN Clinical Practice Guidelines in Oncology. J Natl Compr Canc Netw 20, 1033–1062, doi: 10.6004/jnccn.2022.0046 (2022). [DOI] [PubMed] [Google Scholar]
- 6.Passamonti F, Maffioli M, Caramazza D & Cazzola M Myeloproliferative neoplasms: from JAK2 mutations discovery to JAK2 inhibitor therapies. Oncotarget 2, 485–490, doi: 10.18632/oncotarget.281 (2011). [DOI] [PMC free article] [PubMed] [Google Scholar]
- 7.Harrison C et al. JAK inhibition with ruxolitinib versus best available therapy for myelofibrosis. N Engl J Med 366, 787–798, doi: 10.1056/NEJMoa1110556 (2012). [DOI] [PubMed] [Google Scholar]
- 8.Verstovsek S et al. A double-blind, placebo-controlled trial of ruxolitinib for myelofibrosis. N Engl J Med 366, 799–807, doi: 10.1056/NEJMoa1110557 (2012). [DOI] [PMC free article] [PubMed] [Google Scholar]
- 9.Pardanani A et al. Safety and Efficacy of Fedratinib in Patients With Primary or Secondary Myelofibrosis: A Randomized Clinical Trial. JAMA Oncol 1, 643–651, doi: 10.1001/jamaoncol.2015.1590 (2015). [DOI] [PubMed] [Google Scholar]
- 10.Mesa RA et al. SIMPLIFY-1: A Phase III Randomized Trial of Momelotinib Versus Ruxolitinib in Janus Kinase Inhibitor-Naive Patients With Myelofibrosis. J Clin Oncol 35, 3844–3850, doi: 10.1200/JCO.2017.73.4418 (2017). [DOI] [PMC free article] [PubMed] [Google Scholar]
- 11.Mascarenhas J et al. Pacritinib vs Best Available Therapy, Including Ruxolitinib, in Patients With Myelofibrosis: A Randomized Clinical Trial. JAMA Oncol 4, 652–659, doi: 10.1001/jamaoncol.2017.5818 (2018). [DOI] [PMC free article] [PubMed] [Google Scholar]
- 12.Oh ST et al. ACVR1/JAK1/JAK2 inhibitor momelotinib reverses transfusion dependency and suppresses hepcidin in myelofibrosis phase 2 trial. Blood Adv 4, 4282–4291, doi: 10.1182/bloodadvances.2020002662 (2020). [DOI] [PMC free article] [PubMed] [Google Scholar]
- 13.Tefferi A, Litzow MR & Pardanani A Long-term outcome of treatment with ruxolitinib in myelofibrosis. N Engl J Med 365, 1455–1457, doi: 10.1056/NEJMc1109555 (2011). [DOI] [PubMed] [Google Scholar]
- 14.Passamonti F et al. Anemia in myelofibrosis: Current and emerging treatment options. Crit Rev Oncol Hematol 180, 103862, doi: 10.1016/j.critrevonc.2022.103862 (2022). [DOI] [PubMed] [Google Scholar]
- 15.Verstovsek S et al. Retrospective analysis of pacritinib in patients with myelofibrosis and severe thrombocytopenia. Haematologica 107, 1599–1607, doi: 10.3324/haematol.2021.279415 (2022). [DOI] [PMC free article] [PubMed] [Google Scholar]
- 16.Asshoff M et al. Momelotinib inhibits ACVR1/ALK2, decreases hepcidin production, and ameliorates anemia of chronic disease in rodents. Blood 129, 1823–1830, doi: 10.1182/blood-2016-09-740092 (2017). [DOI] [PMC free article] [PubMed] [Google Scholar]
- 17.Azhar M et al. Momelotinib is a highly potent inhibitor of FLT3-mutant AML. Blood Adv 6, 1186–1192, doi: 10.1182/bloodadvances.2021004611 (2022). [DOI] [PMC free article] [PubMed] [Google Scholar]
- 18.Kong T et al. DUSP6 mediates resistance to JAK2 inhibition and drives leukemic progression. Nat Cancer, doi: 10.1038/s43018-022-00486-8 (2022). [DOI] [PMC free article] [PubMed] [Google Scholar]
- 19.El Chaer F et al. Preliminary Data from the Phase I/II Study of TP-3654, a Selective Oral PIM1 Kinase Inhibitor, in Patients with Myelofibrosis Previously Treated with or Ineligible for JAK Inhibitor Therapy. Blood 140, 594–595, doi: 10.1182/blood-2022-159086 (2022).35580269 [DOI] [Google Scholar]
- 20.Dutta A et al. Genetic ablation of Pim1 or pharmacologic inhibition with TP-3654 ameliorates myelofibrosis in murine models. Leukemia 36, 746–759, doi: 10.1038/s41375-021-01464-2 (2022). [DOI] [PMC free article] [PubMed] [Google Scholar]
- 21.Gangat N et al. Venetoclax with azacitidine or decitabine in blast-phase myeloproliferative neoplasm: A multicenter series of 32 consecutive cases. Am J Hematol 96, 781–789, doi: 10.1002/ajh.26186 (2021). [DOI] [PMC free article] [PubMed] [Google Scholar]
- 22.Masarova L et al. Single-center experience with venetoclax combinations in patients with newly diagnosed and relapsed AML evolving from MPNs. Blood Adv 5, 2156–2164, doi: 10.1182/bloodadvances.2020003934 (2021). [DOI] [PMC free article] [PubMed] [Google Scholar]
- 23.Harrison CN et al. Addition of Navitoclax to Ongoing Ruxolitinib Therapy for Patients With Myelofibrosis With Progression or Suboptimal Response: Phase II Safety and Efficacy. J Clin Oncol 40, 1671–1680, doi: 10.1200/JCO.21.02188 (2022). [DOI] [PMC free article] [PubMed] [Google Scholar]
- 24.Pemmaraju N et al. Addition of navitoclax to ongoing ruxolitinib treatment in patients with myelofibrosis (REFINE): a post-hoc analysis of molecular biomarkers in a phase 2 study. Lancet Haematol 9, e434–e444, doi: 10.1016/S2352-3026(22)00116-8 (2022). [DOI] [PubMed] [Google Scholar]
- 25.Kong T et al. Pevonedistat targets malignant cells in myeloproliferative neoplasms in vitro and in vivo via NFkappaB pathway inhibition. Blood Adv 6, 611–623, doi: 10.1182/bloodadvances.2020002804 (2022). [DOI] [PMC free article] [PubMed] [Google Scholar]
- 26.Fisher DAC et al. Cytokine production in myelofibrosis exhibits differential responsiveness to JAK-STAT, MAP kinase, and NFkappaB signaling. Leukemia 33, 1978–1995, doi: 10.1038/s41375-019-0379-y (2019). [DOI] [PMC free article] [PubMed] [Google Scholar]
- 27.Wang CY & Babitt JL Hepcidin regulation in the anemia of inflammation. Curr Opin Hematol 23, 189–197, doi: 10.1097/MOH.0000000000000236 (2016). [DOI] [PMC free article] [PubMed] [Google Scholar]
- 28.Zhou A et al. Hepcidin is elevated in primary and secondary myelofibrosis and remains elevated in patients treated with ruxolitinib. Br J Haematol 197, e49–e52, doi: 10.1111/bjh.18044 (2022). [DOI] [PMC free article] [PubMed] [Google Scholar]
- 29.Oh S et al. MPN-145 Retrospective Analysis of Anemia Benefit of Pacritinib From the PERSIST-2 Trial. Clin Lymphoma Myeloma Leuk 22 Suppl 2, S327, doi: 10.1016/S2152-2650(22)01439-2 (2022). [DOI] [Google Scholar]
- 30.Jayavelu AK et al. Splicing factor YBX1 mediates persistence of JAK2-mutated neoplasms. Nature 588, 157–163, doi: 10.1038/s41586-020-2968-3 (2020). [DOI] [PubMed] [Google Scholar]
- 31.Stivala S et al. Targeting compensatory MEK/ERK activation increases JAK inhibitor efficacy in myeloproliferative neoplasms. J Clin Invest 129, 1596–1611, doi: 10.1172/JCI98785 (2019). [DOI] [PMC free article] [PubMed] [Google Scholar]
- 32.Yacoub A et al. MPN-075 Efficacy and Safety of Add-on Parsaclisib to Ruxolitinib Therapy in Myelofibrosis Patients With Low Versus Higher Baseline Platelet Counts: A Subgroup Analysis of Data From a Phase 2 Study. Clin Lymphoma Myeloma Leuk 22 Suppl 2, S324, doi: 10.1016/S2152-2650(22)01433-1 (2022). [DOI] [Google Scholar]
- 33.Mascarenhas J et al. MPN-375 BET Inhibitor Pelabresib (CPI-0610) Combined With Ruxolitinib in Patients With Myelofibrosis - JAK Inhibitor-Naie or With Suboptimal Response to Ruxolitinib - Preliminary Data From the MANIFEST Study. Clin Lymphoma Myeloma Leuk 22 Suppl 2, S335–S336, doi: 10.1016/S2152-2650(22)01456-2 (2022).36164005 [DOI] [Google Scholar]
- 34.Verstovsek S et al. Safety and efficacy of INCB018424, a JAK1 and JAK2 inhibitor, in myelofibrosis. N Engl J Med 363, 1117–1127, doi: 10.1056/NEJMoa1002028 (2010). [DOI] [PMC free article] [PubMed] [Google Scholar]
- 35.Mesa R et al. MPN-478 MOMENTUM: Phase 3 Randomized Study of Momelotinib (MMB) versus Danazol (DAN) in Symptomatic and Anemic Myelofibrosis (MF) Patients Previously Treated With a JAK Inhibitor. Clin Lymphoma Myeloma Leuk 22 Suppl 2, S339–S340, doi: 10.1016/S2152-2650(22)01463-X (2022).36164012 [DOI] [Google Scholar]
- 36.Kong T et al. eIF4A Inhibitors Suppress Cell-Cycle Feedback Response and Acquired Resistance to CDK4/6 Inhibition in Cancer. Mol Cancer Ther 18, 2158–2170, doi: 10.1158/1535-7163.MCT-19-0162 (2019). [DOI] [PMC free article] [PubMed] [Google Scholar]
- 37.Chou TC Drug combination studies and their synergy quantification using the Chou-Talalay method. Cancer Res 70, 440–446, doi: 10.1158/0008-5472.CAN-09-1947 (2010). [DOI] [PubMed] [Google Scholar]
- 38.Dobin A et al. STAR: ultrafast universal RNA-seq aligner. Bioinformatics 29, 15–21, doi: 10.1093/bioinformatics/bts635 (2013). [DOI] [PMC free article] [PubMed] [Google Scholar]
- 39.Robinson MD, McCarthy DJ & Smyth GK edgeR: a Bioconductor package for differential expression analysis of digital gene expression data. Bioinformatics 26, 139–140, doi: 10.1093/bioinformatics/btp616 (2010). [DOI] [PMC free article] [PubMed] [Google Scholar]
- 40.Ritchie ME et al. limma powers differential expression analyses for RNA-sequencing and microarray studies. Nucleic Acids Res 43, e47, doi: 10.1093/nar/gkv007 (2015). [DOI] [PMC free article] [PubMed] [Google Scholar]
- 41.Love MI, Huber W & Anders S Moderated estimation of fold change and dispersion for RNA-seq data with DESeq2. Genome Biol 15, 550, doi: 10.1186/s13059-014-0550-8 (2014). [DOI] [PMC free article] [PubMed] [Google Scholar]
- 42.Subramanian A et al. Gene set enrichment analysis: a knowledge-based approach for interpreting genome-wide expression profiles. Proc Natl Acad Sci U S A 102, 15545–15550, doi: 10.1073/pnas.0506580102 (2005). [DOI] [PMC free article] [PubMed] [Google Scholar]
- 43.He F et al. Multiomic Profiling Reveals Metabolic Alterations Mediating Aberrant Platelet Activity and Inflammation in Myeloproliferative Neoplasms. bioRxiv, 2022.2012.2008.519689, doi: 10.1101/2022.12.08.519689 (2022). [DOI] [PMC free article] [PubMed] [Google Scholar]
- 44.Barretina J et al. The Cancer Cell Line Encyclopedia enables predictive modelling of anticancer drug sensitivity. Nature 483, 603–607, doi: 10.1038/nature11003 (2012). [DOI] [PMC free article] [PubMed] [Google Scholar]
- 45.Fisher DAC et al. Mass cytometry analysis reveals hyperactive NF Kappa B signaling in myelofibrosis and secondary acute myeloid leukemia. Leukemia 31, 1962–1974, doi: 10.1038/leu.2016.377 (2017). [DOI] [PMC free article] [PubMed] [Google Scholar]
- 46.Celik H et al. A Humanized Animal Model Predicts Clonal Evolution and Therapeutic Vulnerabilities in Myeloproliferative Neoplasms. Cancer Discov 11, 3126–3141, doi: 10.1158/2159-8290.CD-20-1652 (2021). [DOI] [PMC free article] [PubMed] [Google Scholar]
Associated Data
This section collects any data citations, data availability statements, or supplementary materials included in this article.
Supplementary Materials
Supplemental Figure 1. Effect of IL-3 on JAK inhibitor sensitivity. Cell viability assay of Ba/F3 cells treated with JAK inhibitors in the presence or absence of IL-3. Cells were treated for 72 hours at the indicated drug doses. N= 6 replicates per condition.
Supplemental Figure 2. Cell viability assays of HEL cells treated with combinations of JAK2 inhibitors. Cells were treated for 72 hours at the indicated drug doses. N= 6 replicates per condition. Combination indices (CI) was calculated using the Chou-Talalay method, where CI = 1 is additive, CI < 1 is synergistic, and CI > 1 is antagonistic.
Supplemental Figure 3. Metabolic alterations by JAK inhibitors.
A) Enrichment plots from gene set enrichment analyses from RNA-seq data of pacritinib treatment of HEL cells. NES = normalized enrichment score.
B) Oxygen consumption rate (OCR) traces from Seahorse metabolic assays of PBMCs from two MF and one healthy donor treated with 5 μM JAK2 inhibitors for 1 hour before sequential addition of a: oligomycin, b: FCCP, and c: antimycinA/rotenone.
C) Maximum respiration calculations of PBMCs from two MF and one healthy donor from B) in addition to two ET and four additional healthy donors treated with 5 μM pacritinib, 1 μM, or 10 μM etomoxir in Seahorse metabolic assays.
Supplemental Figure 4. Cytokine mass cytometry on primary samples.
Cytokine production in CD14+ monocytes from five MF samples and one NBM sample upon JAK2 inhibitor treatment relative to basal levels. Cells were treated for 4 hours with 5 μM JAK2 inhibitors in the presence of 10ng/mL TPO. Values represent 90th percentile Arcsinh ratios.
Supplemental Table 1. Characteristics of patient samples utilized in this study.
Supplemental Table 2: DEG analysis of HEL cells treated with JAK inhibitors.
Data Availability Statement
Sequencing data is deposited in the Gene Expression Omnibus (GEO) with accession number GSE229712. Mass cytometry data is available upon request on https://wustl.cytobank.org/. Graphical abstract created with BioRender.com.