

Abstract
Background
Multiple system atrophy (MSA) is a devastating disease characterized by a variable combination of motor and autonomic symptoms. Previous studies identified numerous clinical factors to be associated with shorter survival.
Objective
To enable personalized patient counseling, we aimed at developing a risk model of survival based on baseline clinical symptoms.
Methods
MSA patients referred to the Movement Disorders Unit in Innsbruck, Austria, between 1999 and 2016 were retrospectively analyzed. Kaplan–Meier curves and multivariate Cox regression analysis with least absolute shrinkage and selection operator penalty for variable selection were performed to identify prognostic factors. A nomogram was developed to estimate the 7 years overall survival probability. The performance of the predictive model was validated and calibrated internally using bootstrap resampling and externally using data from the prospective European MSA Study Group Natural History Study.
Results
A total of 210 MSA patients were included in this analysis, of which 124 patients died. The median survival was 7 years. The following clinical variables were found to significantly affect overall survival and were included in the nomogram: age at symptom onset, falls within 3 years of onset, early autonomic failure including orthostatic hypotension and urogenital failure, and lacking levodopa response. The time‐dependent area under curve for internal and external validation was >0.7 within the first 7 years of the disease course. The model was well calibrated showing good overlap between predicted and actual survival probability at 7 years.
Conclusion
The nomogram is a simple tool to predict survival on an individual basis and may help to improve counseling and treatment of MSA patients.
Keywords: multiple system atrophy, nomogram, overall survival, prognosis, prediction model
Multiple system atrophy (MSA) is a devastating, sporadic, and rapidly progressive neurodegenerative disease with adult‐onset featuring a variable combination of parkinsonism, cerebellar symptoms, and dysautonomia. 1 Depending on the clinical presentation, two motor variants can be distinguished: MSA with predominant parkinsonism (MSA‐P) and MSA with predominant cerebellar symptoms (MSA‐C). 2 The course of the disease is characterized by progressive motor and non‐motor symptoms that lead to marked disability over time. Survival analyzes from retrospective, prospective, and postmortem studies reported a highly variable median survival of 6 to 10 years from symptom onset. Older age at onset, severe and early autonomic failure (AF) were frequently reported as predictors of shorter survival. 1 , 3 , 4 In addition, various features, including stridor, 5 , 6 female gender, 7 parkinsonian presentation, 8 , 9 , 10 , 11 early falls, 12 dysphagia, 13 rapid eye movement sleep behavior disorder predating symptom onset,14 and poor levodopa response, 15 have been discussed as predictors of poor outcome. In contrast, despite some discrepancies, a more favorable prognosis has been reported in patients with late‐onset autonomic failure, 16 , 17 cerebellar MSA‐type8, 18 and female gender. 19 , 20 Nevertheless, there is still an urgent need for tools to enable individualized prognostic counseling in MSA patients. In oncology, nomograms based on clinical characteristics have been developed to advance personalized medicine and facilitate treatment decisions. 21 The first nomogram to predict survival in MSA was published in 2018 22 and included a cohort of 220 patients recruited from a single center in southwest China. The aim of the present study was to develop an applicable survival risk model for European MSA patients and evaluate the accuracy of the model in an independent cohort. The nomogram is based on the Innsbruck Multiple System Atrophy Registry (IMSAR) cohort and its predictive performance was evaluated in an independent European MSA cohort. 9
Methods
Study Population
Medical records of MSA patients referred to the Movement Disorders Unit in Innsbruck, Austria, between January 1999 and December 2016, who were examined by movement disorders specialists throughout their disease course, were retrospectively analyzed. Patients who met the consensus diagnostic criteria 2 of probable or possible MSA‐P or MSA‐C at the last examination were included. Patients with inadequate data documentation were excluded. This study was approved by the Institutional Review Board of the Medical University of Innsbruck (AN2015‐0224 353/4.15400/5.3 [4449a]) and was conducted in accordance with the Declaration of Helsinki. Because of the retrospective study design, informed consent was not obtained. A prospective European observational study of 141 MSA patients was used for external validation. Details of the results and methodology of this cohort are presented elsewhere. 9
Clinical Measures
Based on previous literature reports, the following clinical variables were included in our analysis: clinical phenotype, gender, age at symptom onset, manifestation of motor and/or autonomic symptoms at symptom onset, early falls, and subjective response to levodopa. Symptom onset was defined as the time of the first patient‐reported symptom attributable to MSA. The occurrence of either parkinsonism or cerebellar signs was determined as motor onset. Symptoms of orthostatic hypotension (OH), including dizziness, lightheadedness or syncope on standing, and/or urogenital symptoms such as urinary urgency, urinary incontinence, incomplete bladder emptying, or erectile dysfunction in men were defined as autonomic onset. Autonomic failure including symptoms of OH and urogenital dysfunction was classified as “early” if these features occurred before or within 1 year of the onset of motor symptoms. Catheterization was classified as “early” if patients required urinary catheterization within the first 3 years after the onset of initial symptoms because of severe incomplete bladder emptying. 12 Erectile dysfunction was accepted as autonomic failure only if it was followed within 12 months by urinary dysfunction. Good response to levodopa was defined as a patient‐reported subjective improvement in motor function after starting levodopa treatment. Falls that occurred once per month and within 3 years of onset were considered as early frequent falls. 12 , 23
Statistical Analyzes
Patients with more than 1/3 of missing data were excluded from further analyzes. The remaining missing data were imputed using the nearest neighbors’ method. Once the five nearest neighbors were determined, the mode was used to predict nominal variables and the mean was used for numeric data. Descriptive statistics were performed using the t test or the Mann–Whitney U test, depending on the distribution of the data. χ2 or Fisher's exact test were used for analysis of categorical data.
Overall survival was defined as the interval between symptom onset and death. The date of death was determined from death certificates provided by Statistics Austria (www.statistik.at; Guglgasse 13, 1110 Wien) and/or from medical records. Patients with an uncertain vital status (eg, patients from foreign countries and moved patients) who were lost to clinical follow‐up were censored at the last known date alive. Overall survival was estimated using the Kaplan–Meier method and the log‐rank test to compare subgroups.
A penalized Cox's proportional hazard model using least absolute shrinkage and selection operator (LASSO) was used to construct the prognostic model. 24 Validation of the predictive performance of the penalized Cox model was based on a resampling method. For this purpose, bootstrap resampling was used to validate the model internally and an independent data set was exploited for external validation. The dataset for the independent, external validation was derived from a prospective European MSA cohort (EMSA) study. 9 Calibration plots were calculated to evaluate predicted and actual survival probabilities. Analogous to model validation, internal calibration was performed with the bootstrap method using all samples from the IMSAR cohort and for external calibration from the EMSA dataset. According to the estimated risk score, patients were split in tertials into a low, intermediate, and high risk group. The log‐rank statistics was used to determine survival differences in the three risk groups.
SPSS version 24.0 and the hdnom and rms package in R programming software (version 3.3.3) were used to perform the statistical analyzes. P values below 0.05 were considered statistically significant.
Results
Demographic and Clinical Data
A total of 210 MSA patients from the IMSAR registry met the inclusion criteria and were enrolled in this retrospective study. According to the second consensus criteria, 82.9% (n = 174) of the patients were diagnosed with probable MSA and 61.0% (n = 128) presented with predominant parkinsonism. The mean age at symptom onset was 57.8 (standard deviation [SD], 8.1) years. Autonomic failure as the first symptom was reported in 48.5% (n = 100) of the patients and a subjective levodopa effect was present in 91 (64.1%) of the patients. With regard to the latter, a significant difference between the two subtypes (MSA‐P 75.0% vs. MSA‐C 23.3% reporting subjective levodopa response; P < 0.001) has been observed with an overall median duration of levodopa responsiveness of 36 months. Apart from a significantly different distribution of male and female patients between MSA subgroups (P = 0.014) and a higher proportion of levodopa responsiveness in MSA‐P, no other significant differences in demographic data were found between MSA subtypes. The demographic data are summarized in Table 1.
TABLE 1.
Demographic and clinical data
| Variable | Overall | MSA‐P | MSA‐C | P‐value |
|---|---|---|---|---|
| No. (%) | 210 (100) | 128 (61.0) | 82 (39.0) | |
| Gender | ||||
| Men, No. (%) | 111 (52.9) | 59 (46.1) | 52 (63.4) | 0.014 a |
| Women, No. (%) | 99 (47.1) | 69 (53.9) | 30 (36.6) | |
| Diagnostic certainty | ||||
| Probable, No. (%) | 174 (82.9) | 107 (83.6) | 67 (81.7) | 0.723 a |
| Symptom onset and duration | ||||
| Symptom onset, years (mean, SD) | 57.8 (8.1) | 58.2 (8.3) | 57.1 (7.6) | 0.184 d |
| Early autonomic onset, No. (%) | 100 (48.5) | 62 (49.6) | 38 (46.9) | 0.706 a |
| Age at death, years (mean SD) | 66.6 (8.0) | 67.3 (8.2) | 65.2 (7.7) | 0.778 d |
| Disease duration, months (median, IQR) | 84.0 (63.5–108.0) | 77.5 (55.8–103.3) | 84.0 (69.8–109) | 0.931 c |
| l‐dopa treatment | ||||
| l‐dopa treatment, No. (%) | 142 (67.6) | 112 (87.5) | 30 (36.6) | <0.001 a |
| Beneficial l‐dopa response, No. (%) | 91 (64.1) | 84 (75.0) | 7 (23.3) | <0.001 b |
| Duration of l‐dopa benefit, months (median, IQR) | 36.0 (12.0–48.0) | 36.0 (18.0–48.0) | 12.0 (6.0–18.0) | 0.014 c |
Note: Data are No. (%), mean SD, or median (IQR), unless stated otherwise.
Based on χ2‐test (if all cells have 10 or more observations), significance level of 0.05 (two‐tailed).
Based on Fisher's exact test (if any cell has fewer than 10 or more observations), significance level of 0.05 (two‐tailed).
Based on Mann‐Whitney test with significance level of 0.05.
Based on t test with significance level of 0.05.
Abbreviations: MSA‐P, multiple system atrophy (parkinsonism subtype); MSA‐C, multiple system atrophy (cerebellar subtype); SD standard deviation; IQR, interquartile range; l‐dopa, levodopa.
Independent Prognostic Factors in the Innsbruck MSA Cohort
In this cohort, 35 (16.7%) patients were lost to follow‐up, 124 (59.0%) died and 51 (24.3%) were alive at the time of survival analysis. Median overall survival from symptom onset to death was 84 months (IQR 63.5–108.0). Multivariate Cox regression analysis (summarized in Table 2) identified the following variables as independent risk factors for poor survival: older age at onset (P = 0.0001), early falls within ≤3 years (P = 0.0001), lack of levodopa responsiveness (0.037), and early autonomic failure including early orthostatic hypotension symptoms (P = 0.002), early urogenital failure (P = 0.001) as well as early catheterization ≤3 years (P = 0.002). MSA phenotype, gender, and parkinsonism at symptom onset had no significant effect on survival.
TABLE 2.
Multivariate analysis of predictors selected by LASSO regression procedure in the development cohort
| Variable | HR | 95% CI | P‐value |
|---|---|---|---|
| Age at onset | 1.75 | 1.33–2.31 | 0.0001 |
| MSA subtype (MSA‐C) | 0.91 | 0.51–1.65 | 0.759 |
| Gender (female) | 1.02 | 0.67–1.55 | 0.935 |
| Early falls ≤3 y (absent) | 0.409 | 0.26–0.64 | 0.0001 |
| Catheterization ≤3 y (present) | 2.25 | 1.35–3.75 | 0.002 |
| Dopa response (absent) | 1.66 | 1.03–2.67 | 0.037 |
| Early OH (present) | 2.137 | 1.33–3.44 | 0.002 |
| Early urogenital failure (present) | 2.11 | 1.38–3.23 | 0.001 |
| Parkinsonism at onset (absent) | 1.03 | 0.62–1.74 | 0.898 |
Abbreviations: LASSO, least absolute shrinkage and selection operator; HR, hazard ratio; CI, confidence interval; MSA‐C, multiple system atrophy (cerebellar subtype); y, years; OH, orthostatic hypotension.
Prognostic Nomogram
For individualized prediction of 7 year overall survival, the nomogram was calculated based on the results of the multivariate Cox regression analysis. According to their regression coefficients, each identified clinical factor is scored and the cumulative total score is assigned to the individual survival probability (Fig. 1). The predictive performance and applicability of the nomogram was validated internally and externally. The model performs well with an area under curve (AUC) of 0.7 from the first to the fifteenth year in the internal validation (Fig. 2A). The time‐dependent AUC of the external validation, as expected, is slightly worse and demonstrates a clear difference in performance over time. It is high within the first 7 years and drops thereafter. Therefore, the model is most effective in predicting overall survival up to 7 years of the disease (Fig. 2B). Similar to model validation, internal and external calibrations were performed and evaluated by plotting predicted probabilities (x‐axis) against actual (y‐axis) survival probabilities. Although the calibration curve of predicted overall survival deviates slightly from the optimum 45° line, the two calibration curves (Fig 3A,B) showed a good overall agreement. Based on the calibration results, patients were additionally stratified into three risk groups (low vs. intermediate vs. high). The Kaplan–Meier curves show significant differences (P < 0.001) in survival between the three risk groups (Fig 4A,B).
FIG. 1.
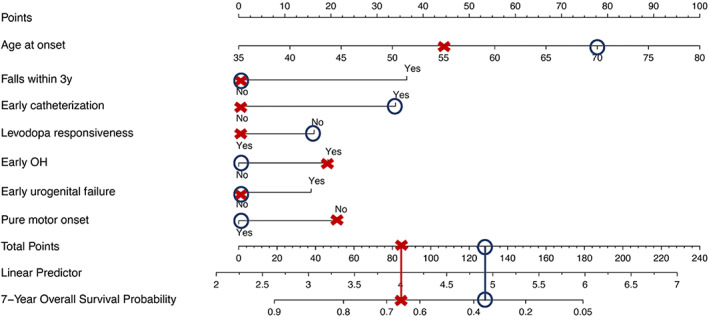
Nomogram of 7 year overall survival. To use the nomogram, points are assigned to each risk factor. The total number of points determines the 7 year survival probability. For example (red cross), according to the present model, a 58‐year‐old patient (age at onset points: 44, pure motor presentation at onset points: 21) with MSA featuring parkinsonism with subjective levodopa responsiveness (levodopa responsiveness points: 0) and symptoms of orthostatic hypotension (OH) (early OH points: 19) since 3 years has a 7 year survival probability of ~65% (total points: 84), warranting advanced care planning. In example 2 (blue circle), the survival probability is worse. A 74‐year‐old women (age at onset points: 78, pure motor presentation at onset points: 0) with MSA featuring cerebellar features since 4 years, experiences now symptoms of parkinsonism with no benefit to levodopa treatment (levodopa responsiveness points: 16). She further reports autonomic failure with recurrent dizziness on standing and symptoms of urogenital failure with incomplete bladder emptying requiring intermittent self‐catheterization since 2 years (early OH points: 0, early urogenital failure points: 0, early catheterization points: 34). The patient has a 7 year survival probability of ~35% (total points: 128).
FIG. 2.
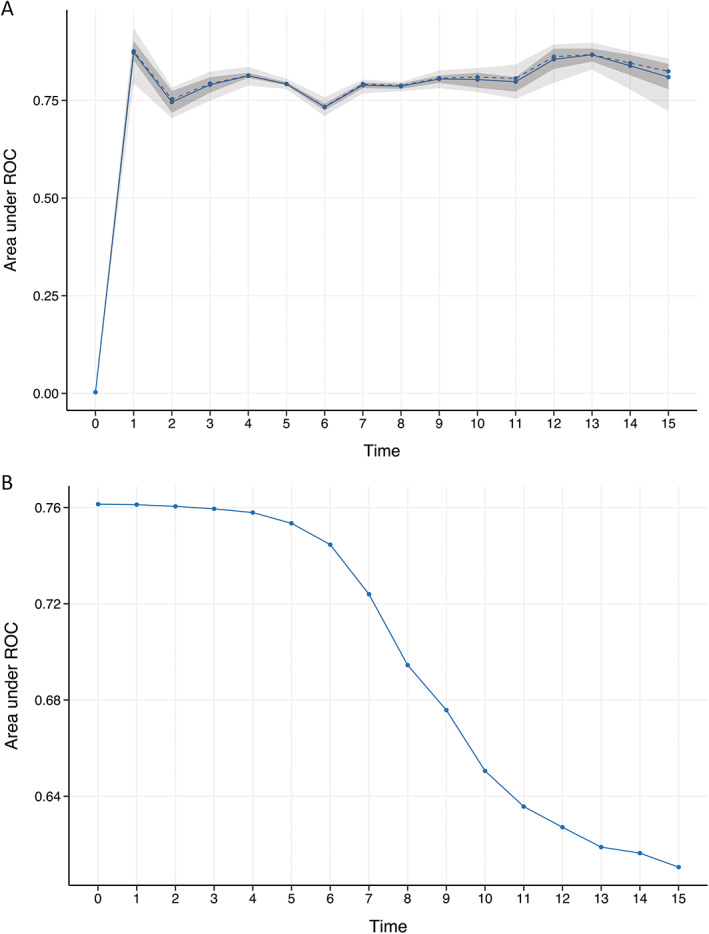
Internal and external validation. Internal and external validation allows us to assess the model performance by time‐dependent area under the curve (AUC). The x‐axis represents the estimated AUC for survival at the time of interest 2 (A) The time‐dependent AUC of the internal validation shows the mean (solid line), the median (dashed line), the 25% and 75% quantiles (dark interval), and the minimum and maximum (light interval) from the first to the fifth year. The bootstrap‐based (boot.time = 10) validation shows stable results. (B) For the external validation, an independent data set was used, which seems to be stable between 1 and 7 years.
FIG. 3.
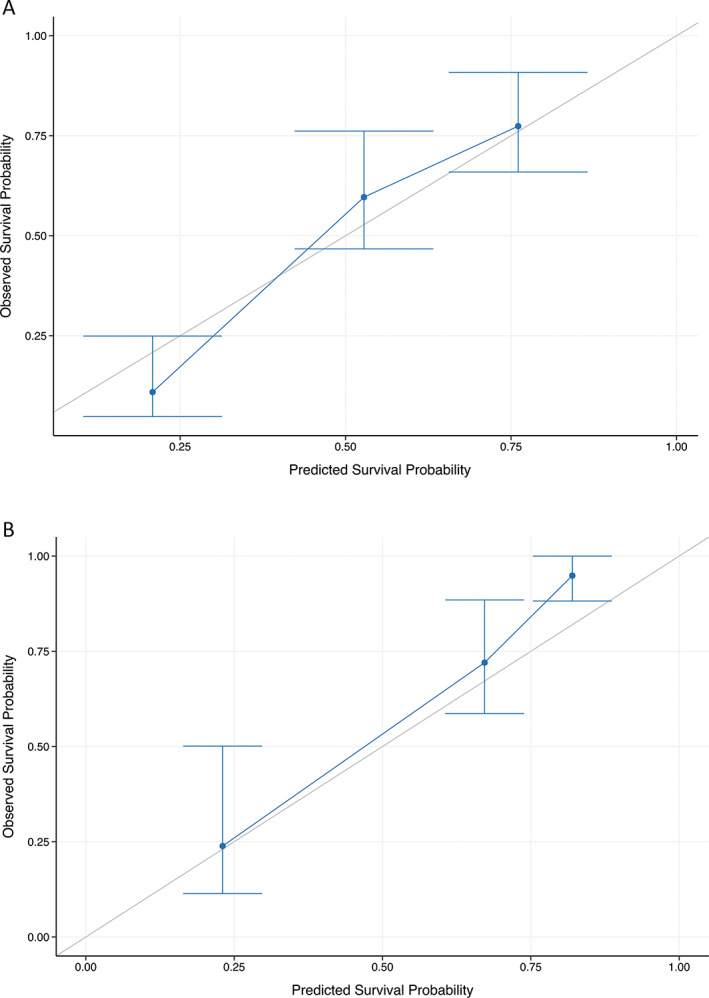
Calibration curve of the nomogram. Calibration plots are shown for the derivation (A) and validation (B) cohort. The x‐ and y‐axes show the probability predicted by the nomogram and the actual overall survival. Both calibration curves show comparable performance as their predicted overall survival probabilities are close to the observed overall survival probability. Blue line = nomogram observed survival, gray line = perfect calibration.
FIG. 4.
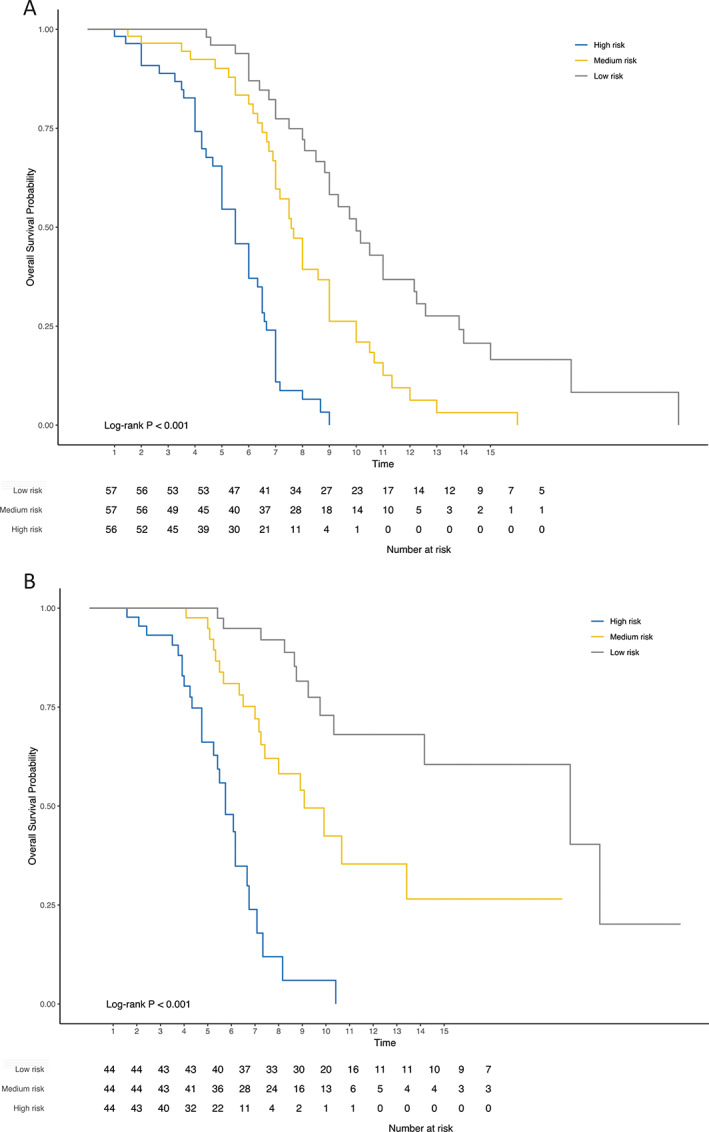
Kaplan–Meier diagrams. The following Kaplan‐Meier diagrams were derived from the internal (A) and external calibration (B) of our model. Based on the predicted probabilities low, medium, and high‐risk groups were calculated that differed significantly in the log‐rank test.
Discussion
In the present study, we developed and validated a risk model for survival in MSA. Older age at onset, early frequent falls, early and severe autonomic involvement, and lacking subjective levodopa response were identified as significant predictors in this model. These findings are consistent with previous reports showing that older age at symptom onset, 7 , 12 , 25 severe 12 , 25 , 26 and early autonomic failure, 7 , 12 , 22 early falls,12 and poor response to levodopa 15 are clinical features predicting poor survival. MSA phenotype and gender were not identified as predictors, which is consistent with other studies. 12 , 22 , 25 , 26 , 27 , 28 Autonomic failure was present at symptom onset in 48.5% of the patients. In 17.4%, urogenital symptoms were severe and patients were dependent on a urinary catheter within the first 3 years of symptom onset. Discrepancies in the frequency of these symptoms have been reported in previous studies, possibly because of methodological and statistical heterogeneity of the studies, the differences in the reporting of examined prognostic factors and heterogeneous definitions of clinical variables. 29
Although a number of positive and negative predictors of survival have been reported in several studies, this is, to the best of our knowledge, the first visual scoring system developed for MSA patients from European ancestry enabling personalized prediction of clinical outcome. Such a survival nomogram may facilitate future patient counseling and personalized treatment approaches. For example, according to the present model, a 58‐year‐old patient with MSA featuring parkinsonism with subjective levodopa responsiveness and symptoms of orthostatic hypotension since 3 years, has a 7 year survival probability of ~65%, warranting advanced care planning. A similar nomogram was developed based on a Chinese MSA population. 22 The derivation cohort was obtained from a single‐center involving 220 patients. The results of this study were similar and demonstrated that autonomic onset, frequent falls, OH, higher UMSARS (The Unified Multiple System Atrophy Rating Scale) scores and a shorter diagnostic delay were associated with poor prognosis. One of the strengths of the present nomogram is the thorough validation of the model using two distinct methods. Our nomogram was validated (1) internally by bootstrap resampling and (2) externally using a data set from the multicenter EMSA Natural History study. 9 For durations longer than 7 years, external validation was worse compared to the performance metrics of the derivation cohort, indicating that the nomogram is appropriate for evaluating survival probability within the first 7 years. Second, the model's performance was evaluated by internal and external calibration, which was convincing from the first to the fifteenth year and showed that the observed and the predicted survival probability approached the optimum line.
Because of its rarity, insidious onset, and heterogeneous clinical presentation, research on the prognosis of MSA is challenging. 29 Therefore, several limitations have to be acknowledged. First, the retrospective nature of the study carries the risk of inaccurate reconstruction of the clinical course and lack of methodological uniformity. Therefore, a reporting bias cannot be excluded. Second, patients were diagnosed according to the second consensus criteria, 2 which have a sensitivity of 92% for possible and 63% for probable MSA at the last visit. 30 The diagnosis was not confirmed neuropathologically, carrying the risk of misdiagnosis. Third, the derivation and independent cohort data were obtained from European centers. Therefore, generalizability to populations of other ethnicities is limited.
In conclusion, based on the Innsbruck MSA cohort, we have developed a reliable tool to predict individual survival in MSA and may support individual decision making in routine clinical practice and clinical trial design. The nomogram is based on a large patient cohort and its applicability and use were assessed by independent, representative, multi‐center MSA cohorts. Large prospective studies are needed to confirm these results.
Author Roles
(1) Research project: A. Conception, B. Organization, C. Execution; (2) Statistical Analysis: A. Design, B. Execution, C. Review and Critique; (3) Manuscript Preparation: A. Writing of the First Draft, B. Review and Critique.
S.E.: 1A, 1C, 2A, 2B, 3A
G.G.: 2A, 2C, 3C
C.E.: 2C, 3B
A.F.: 2C, 3B
C.R.: 2C, 3B
S.B.: 2C, 3B
A.D.: 2C, 3B
B.H.: 2C, 3B
P.M.: 2C, 3B
K.M.: 2C, 3B
W.N.: 2C, 3B
C.S.: 2C, 3B
H.S.: 2C, 3B
W.P.: 2C, 3B
K.S.: 2C, 3B
S.K.: 2C, 3B
G.W: 1A, 1B, 2A, 2C, 3B
F.K.: 1A, 2A, 2B, 2C, 3B
Disclosures
Ethical Compliance Statement: This study was approved by the Institutional Review Board of Medical University of Innsbruck (AN2015‐0224 353/4.15400/5.3 [4449a]) and conducted in accordance with the Declaration of Helsinki. Informed patient consent was not necessary for this retrospective work. We confirm that we have read the Journal's position on issues involved in ethical publication and affirm that this work is consistent with those guidelines.
Funding Sources and Conflicts of Interest: The authors report no conflict of interest related to this work. There was no specific funding for this study.
Financial Disclosures for the Previous 12 Months: The following authors report employment from Medical University Innsbruck: S.E., G.G., C.E., C.R., S.B., A.D., P.M., K.M, W.N., C.S., and H.S. A.F. reports royalties from Springer Verlag; speaker fees and honoraria from Impact Medicom, Theravance Biopharma, AbbVie, the International Parkinson Disease and Movement Disorders Society, the Austrian Neurology Society, and the Austrian Autonomic Society; and research grants from the Parkinson Fond, the United States MSA Coalition, the Dr. Johannes and Hertha Tuba Foundation, and the Austrian Exchange Program, outside of the submitted work. B.H. reports the following Advisory Boards, AbbVie; is employed by Medical University Innsbruck; received honoraria from AbbVie, Novartis; and received grants from FWF Austrian Science Fund. W.P. reports personal fees from AC Immune, Alterity, AbbVie, BIAL, Britannia, Lundbeck, Neuroderm, Roche, Sunovion, Stada, Takeda, UCB, and Zambon (consultancy and lecture fees in relation to clinical drug development programs for Parkinson's disease). K.S. reports personal fees from Ono Pharma United Kingdom, Teva, UCB, Lundbeck, AOP Orphan Pharmaceuticals AG, Roche, Grünenthal, Stada, Licher Pharma, Biogen, BIAL, EverPharma, and AbbVie; received honoraria from the International Parkinson and Movement Disorders Society; received research grants from FWF Austrian Science Fund, The Michael J. Fox Foundation, and AOP Orphan Pharmaceuticals AG. S.K. was supported by the excellence initiative VASCage (Research Centre on Vascular Aging and Stroke, project number 868624) of the Austrian Research Promotion Agency FFG (COMET program–Competence Centers for Excellent Technologies) funded by the Federal Ministry for Climate Protection, Environment, Energy, Transport, Innovation, and Technology; the Federal Ministry for Labor and Economy; and the federal states Tyrol (via Standortagentur), Salzburg, and Vienna (via Vienna Business Agency). G.W. received honoraria from Ono, Inhibikase, and Takeda. F.K. received personal fees for lectures and consultancies from Institut de Recherches Internationales Servier, Clarion Healthcare, Takeda Pharmaceuticals, Sanofi, Teva, Bill, and the Austrian Society of Neurology; received grant support from the MSA Coalition, Austrian Science Fund, and the National Institutes of Health; outside of the submitted work.
Supporting information
Data S1. Appendix.
Acknowledgments
We thank the patients and their relatives for their support in this research.
Contributor Information
Gregor Wenning, Email: gregor.wenning@i-med.ac.at.
Florian Krismer, Email: florian.krismer@i-med.ac.at.
References
- 1. Fanciulli A, Wenning GK. Multiple‐system atrophy. N Engl J Med 2015;372(3):249–263. [DOI] [PubMed] [Google Scholar]
- 2. Gilman S, Wenning G, Low P, et al. Second consensus statement on the diagnosis of multiple system atrophy. Neurology 2008;71(9):670–676. [DOI] [PMC free article] [PubMed] [Google Scholar]
- 3. Poewe W, Stankovic I, Halliday G, et al. Multiple system atrophy. Nat Rev Dis Prim 2022;8(1):56. [DOI] [PubMed] [Google Scholar]
- 4. Krismer F, Wenning G. Multiple system atrophy: insights into a rare and debilitating movement disorder. Nat Rev Neurol 2017;13(4):232–243. [DOI] [PubMed] [Google Scholar]
- 5. Silber M, Levine S. Stridor and death in multiple system atrophy. Mov Disord 2000;15(4):699–704. [DOI] [PubMed] [Google Scholar]
- 6. Giannini G, Calandra‐Buonaura G, Mastrolilli F, et al. Early stridor onset and stridor treatment predict survival in 136 patients with MSA. Neurology 2016;87(13):1375–1383. [DOI] [PubMed] [Google Scholar]
- 7. O'Sullivan SS, Massey LA, Williams DR, et al. Clinical outcomes of progressive supranuclear palsy and multiple system atrophy. Brain 2008;131(5):1362–1372. [DOI] [PubMed] [Google Scholar]
- 8. Schulz JB, Klockgether T, Petersen D, et al. Multiple system atrophy: natural history, MRI morphology, and dopamine receptor imaging with 123IBZM‐SPECT. J Neurol Neurosurg Psychiatry 1994;57(9):1047–1056. [DOI] [PMC free article] [PubMed] [Google Scholar]
- 9. Wenning G, Geser F, Krismer F, et al. The natural history of multiple system atrophy: a prospective European cohort study. Lancet Neurol 2013;12(3):264–274. [DOI] [PMC free article] [PubMed] [Google Scholar]
- 10. Sakushima K, Nishimoto N, Nojima M, et al. Epidemiology of multiple system atrophy in Hokkaido, the Northernmost Island of Japan. Cerebellum 2015;14(6):682–687. [DOI] [PubMed] [Google Scholar]
- 11. Saito Y, Matsuoka Y, Takahashi A, Ohno Y. Survival of patients with multiple system atrophy. Intern Med 1994;33(6):321–325. [DOI] [PubMed] [Google Scholar]
- 12. Coon EA, Sletten DM, Suarez MD, et al. Clinical features and autonomic testing predict survival in multiple system atrophy. Brain 2015;138(12):3623–3631. [DOI] [PMC free article] [PubMed] [Google Scholar]
- 13. Calandra‐Buonaura G, Alfonsi E, Vignatelli L, et al. Dysphagia in multiple system atrophy consensus statement on diagnosis, prognosis and treatment. Park Relat Disord 2021;86:124–132. [DOI] [PubMed] [Google Scholar]
- 14. Giannini G, Mastrangelo V, Provini F, et al. Progression and prognosis in multiple system atrophy presenting with REM behavior disorder. Neurology 2020;94(17):E1828–E1834. [DOI] [PubMed] [Google Scholar]
- 15. Wenning GK, Ben Shlomo Y, Magalhães M, Daniel SE, Quinn NP. Clinical features and natural history of multiple system atrophy. An analysis of 100 cases. Brain 1994;117(Pt 4):835–845. [DOI] [PubMed] [Google Scholar]
- 16. Petrovic I, Ling H, Asi Y, et al. Multiple system atrophy‐parkinsonism with slow progression and prolonged survival: a diagnostic catch. Mov Disord 2012;27(9):1186–1190. [DOI] [PubMed] [Google Scholar]
- 17. Calandra‐Buonaura G, Guaraldi P, Sambati L, et al. Multiple system atrophy with prolonged survival: is late onset of dysautonomia the clue? Neurol Sci 2013;34(10):1875–1878. [DOI] [PubMed] [Google Scholar]
- 18. Ben‐Shlomo Y, Wenning G, Tison F, Quinn N. Survival of patients with pathologically proven multiple system atrophy: a meta‐analysis. Neurology 1997;48(2):384–393. [DOI] [PubMed] [Google Scholar]
- 19. Kim H, Jeon B, Lee J, Yun J. Survival of Korean patients with multiple system atrophy. Mov Disord 2011;26(5):909–912. [DOI] [PubMed] [Google Scholar]
- 20. Coon EA, Nelson RM, Sletten DM, et al. Sex and gender influence symptom manifestation and survival in multiple system atrophy. Auton Neurosci Basic Clin 2019;219:49–52. [DOI] [PMC free article] [PubMed] [Google Scholar]
- 21. Balachandran V, Gonen M, Smith JJ, DeMatteo RP. Nomograms in oncology–more than meets the eye. Lancet Oncol 2015;16(4):e173–e180. [DOI] [PMC free article] [PubMed] [Google Scholar]
- 22. Cao B, Zhang L, Zou Y, Wei Q, Ou R, Chen Y, Shang HF. Survival analysis and prognostic nomogram model for multiple system atrophy. Park Relat Disord 2018;54(4):68–73. [DOI] [PubMed] [Google Scholar]
- 23. Marini K, Mahlknecht P, Schorr O, et al. Associations of gait disorders and recurrent falls in older people: a prospective population‐based study. Gerontology 2022;68(10):1139–1144. [DOI] [PubMed] [Google Scholar]
- 24. Zhang HH, Lu W. Adaptive Lasso for Cox's proportional hazards model. Biometrika 2007;94(3):691–703. [Google Scholar]
- 25. Figueroa JJ, Singer W, Parsaik A, et al. Multiple system atrophy: prognostic indicators of survival. Mov Disord 2014;29(9):1151–1157. [DOI] [PMC free article] [PubMed] [Google Scholar]
- 26. Low P, Reich S, Jankovic J, et al. Natural history of multiple system atrophy in the USA: a prospective cohort study. Lancet Neurol 2015;14(7):710–719. [DOI] [PMC free article] [PubMed] [Google Scholar]
- 27. Tada M, Onodera O, Tada M, et al. Early development of autonomic dysfunction may predict poor prognosis in patients with multiple system atrophy. Arch Neurol 2007;64(2):256–260. [DOI] [PubMed] [Google Scholar]
- 28. Roncevic D, Palma J, Martinez J, Goulding N, Norcliffe‐Kaufmann L, Kaufmann H. Cerebellar and parkinsonian phenotypes in multiple system atrophy: similarities, differences and survival. J Neural Transm (Vienna) 2014;12(5):507–512. [DOI] [PMC free article] [PubMed] [Google Scholar]
- 29. Glasmacher SA, Leigh PN, Saha RA. Predictors of survival in progressive supranuclear palsy and multiple system atrophy: a systematic review and meta‐analysis. J Neurol Neurosurg Psychiatry 2017;88(5):402–411. [DOI] [PubMed] [Google Scholar]
- 30. Osaki Y, Ben‐Shlomo Y, Lees AJ, Wenning GK, Quinn NP. A validation exercise on the new consensus criteria for multiple system atrophy. Mov Disord 2009;24(15):2272–2276. [DOI] [PubMed] [Google Scholar]
Associated Data
This section collects any data citations, data availability statements, or supplementary materials included in this article.
Supplementary Materials
Data S1. Appendix.