Abstract
We report the solution behavior, oligomerization state, and structural details of myotoxin-II purified from the venom of Bothrops asper in the presence and absence of sodium dodecyl sulfate (SDS) and multiple lipids, as examined by analytical ultracentrifugation and nuclear magnetic resonance. Molecular functional and structural details of the myotoxic mechanism of group II Lys-49 phospholipase A2 homologues have been only partially elucidated so far, and conflicting observations have been reported in the literature regarding the monomeric vs. oligomeric state of these toxins in solution. We observed the formation of a stable and discrete, hexameric form of myotoxin-II, but only in the presence of small amounts of SDS. In SDS-free medium, myotoxin-II was insensitive to mass action and remained monomeric at all concentrations examined (up to 3 mg/ml, 218.2 μM). At SDS concentrations above the critical micelle concentration, only dimers and trimers were observed, and at intermediate SDS concentrations, aggregates larger than hexamers were observed. We found that the amount of SDS required to form a stable hexamer varies with protein concentration, suggesting the need for a precise stoichiometry of free SDS molecules. The discovery of a stable hexameric species in the presence of a phospholipid mimetic suggests a possible physiological role for this oligomeric form, and may shed light on the poorly understood membrane-disrupting mechanism of this myotoxic protein class.
Keywords: Myotoxin-II, SDS, Analytical ultracentrifugation, Oligomerization, Lys-49 phospholipase
Introduction
Myotoxin-II (mt-II) found in the venom of the snake Bothrops asper is a 121 amino acid residue protein belonging to the group IIA Lys-49 phospholipase A2-like (PLA2-like) toxins which are present in many viperid species (Francis et al. 1991; Lomonte 2023). In spite of being catalytically inactive, the Lys-49 PLA2-like toxins induce a rapid skeletal muscle necrosis at the site of injection (Lomonte and Rangel 2012), which in severe envenoming cases may lead to permanent tissue damage or even amputations. The crystal structures of B. asper mt-II, alone (1CLP) or in complex with suramin (1Y4L) have been solved as homodimers, although with a different spatial arrangement of the monomers (Arni et al. 1995; Murakami et al. 2005). Its myotoxic effect has been shown to depend on a stretch of amino acids at its C-terminal region, which combines cationic and hydrophobic residues (Lomonte et al. 1994). This cluster of amino acids directly affects the sarcolemma permeability, resulting in increased Ca2+ influx and, ultimately, leading to muscle cell necrosis (Lomonte 2023). However, the molecular details of its mechanism of action are still poorly understood. There have been conflicting observations about the solution behavior of mt-II. The toxin migrates as a sharp 14 kDa band in SDS-PAGE following disulfide bond reduction (consistent with its expected molecular mass), whereas its oxidized form results in a diffuse smear of 22–25 kDa. These data suggest the existence of intermolecular disulfide bonds, which have never been observed in the crystal structures. On the contrary, the amino acid sequence includes 14 cysteines which are all engaged in seven intra-chain disulfide bonds, following a typical pattern of group IIA PLA2s (Lomonte 2023). Taken together, electrophoretic and crystallographic evidences have supported the notion that Lys-49 myotoxins exist in a non-covalent homodimeric state in solution. Furthermore, the dimeric state has been considered a relevant factor in current models to explain their mechanism of myotoxicity. It has been proposed that the entrance of a fatty acid molecule into the hydrophobic channel of these toxins induces an allosteric change leading to the exposure and alignment of molecular sites responsible for docking onto the sarcolemma (MDoS: membrane docking site) and for disruption of bilayer integrity (MDiS: membrane disrupting site) (Fernandes et al. 2014).
The oligomerization properties of a different Lys-49 PLA2 originating from Protobothrops flavoviridis have previously been investigated in the presence and absence of 1% (34.7 mM) sodium dodecyl sulfate (SDS) by native mass spectrometry, analytical ultracentrifugation (AUC), and SDS–polyacrylamide gel electrophoresis (SDS-PAGE), as well as under oxidized and reducing conditions with 2-mercaptoethanol, under denaturing conditions with urea, and before and after 95 °C heat treatment (Matsui et al. 2019). The results showed that the P.fl-Lys-49 PLA2 is monomeric in the absence of SDS, but one or more oligomeric species consistent with dimers and trimers were observed in all cases where SDS was present, although the relative amount of each oligomeric species varied, depending on the presence or absence of urea or reductant. SDS is a strong anionic surfactant that binds to proteins through electrostatic and hydrophobic interactions. It is best known for its ability to induce protein denaturation and disrupt protein oligomers in the millimolar concentration range. Interestingly, though, several examples in the literature have associated SDS with other structural effects in a concentration-dependent manner: micellar SDS concentrations may induce alpha-helix formation in non-helical proteins (Parker and Song 1992); lower amounts of detergent have been shown to modulate aggregation or amyloid fibrillation of several cationic proteins, such as camel antibodies (Ismael et al. 2018), myoglobin (AlResaini et al. 2023), succinylated proteins (Khan et al. 2022) and (hyper)thermophile-derived “ultrastable” proteins (Khan et al. 2016), among others. To shed further light on the structural role of SDS as an inducer of oligomerization of mt-II, we examined the solution behavior of this protein by AUC and nuclear magnetic resonance (NMR) in the presence and absence of SDS and other lipids and detergents, and as a function of the protein and SDS concentration. We also attempted to determine the stoichiometry for the SDS:protein interaction. NMR further informed about the structural details that may be affected in the presence of a denaturant such as SDS. We determined the stoichiometry of SDS binding to mt-II necessary for the oligomerization of myotoxin-II into a hexamer, and measured this dependence on protein concentration.
Methods
Myotoxin preparation
Myotoxin II (UniProt code P24605) (Francis et al. 1991) was isolated from crude Bothrops asper venom by cation exchange chromatography on CM-Sephadex C25, followed by RP-HPLC, as previously described (Lomonte and Gutiérrez 1989; Mora-Obando et al. 2014a). Homogeneity of the protein was confirmed by mass spectrometry using direct infusion in a Q-Exactive Plus instrument (Thermo) (Lomonte and Fernández 2022).
Analytical ultracentrifugation
Oligomerization properties of mt-II were studied by sedimentation velocity (SV) AUC as a function of SDS and protein concentration. Sedimentation experiments were performed on a Beckman Optima AUC instrument at the Canadian Center for Hydrodynamics at the University of Lethbridge. Samples were measured at 20 °C and 55 krpm by UV intensity detection using an An60Ti rotor and standard 2-channel epon-filled centerpieces (Beckman-Coulter, Indianapolis). All data were analyzed with UltraScan 4.0 release 6485 (Demeler and Gorbet 2016; Demeler et al. 2022). All samples were measured in a 10 mM sodium phosphate buffer containing 50 mM NaCl, pH 7.4. Hydrodynamic buffer density (1.0012 g/cm3) and viscosity (1.0065 cp) were estimated with UltraScan (Demeler and Gorbet 2016). Sedimentation velocity (SV) data were analyzed as reported earlier (Demeler 2010). Optimization was performed by two-dimensional spectrum analysis (2DSA) (Brookes et al. 2010a, 2006) with simultaneous removal of time- and radially invariant noise contributions and fitting of boundary conditions. Where appropriate, 2DSA solutions were subjected to parsimonious regularization by genetic algorithm analysis (Brookes and Demeler 2007). Diffusion-corrected integral sedimentation profiles were generated with the enhanced van Holde–Weischet analysis (Demeler and Holde 2004). A further refinement using Monte Carlo analysis (Demeler and Brookes 2008) was also applied to determine confidence limits for the determined parameters. The calculations were carried out on high-performance computing platforms at the Texas Advanced Computing Center and the San Diego Supercomputing Center and on the cluster from the Canadian Center for Hydrodynamics (Brookes and Demeler 2008).
Nuclear magnetic resonance
NMR experiments were performed to provide additional structural and stoichiometry information to support the AUC results for the mt-II and SDS mixture resulting in the 5.5S species. All NMR measurements were carried out on a 700 MHz Bruker Avance III HD spectrometer equipped with a three channel TBO-Z probe with outer and inner coil tuned to the 1H and 13C nuclei, respectively. All NMR measurements used the following acquisition parameters: number of scans (NS) = 5000; recycle delay (d1) = 30 s; number of acquisition points (TD) = 128 k; sweep width (SW) = 20.513 ppm; acquisition time (AQ) = 4.561 s; transmitter offset for 1H (o1p) = 4.711 ppm; 1H 90-degree pulse length (p1) = 17.5 microseconds; 1H 90-degree pulse power (pl1) = 17.2 watts. All spectra were zero-filled to 256 k points, exponentially multiplied with a line broadening of 0.3 Hz, and automatically phase and baseline corrected using TopSpin software version 3.5 patch level 7. All one-dimensional spectra were collected following water suppression that was carried out using excitation sculpted gradient pulses (Hwang and Shaka 1995). This was done using the “zgesgp” pulse sequence from the Bruker pulse sequence library. The longitudinal relaxation time (T1) measurements were carried out using the standard inversion recovery pulse sequence from the Bruker pulse sequence library (t1ir) (Vold et al. 1968). The relaxation delays were set to a variable list of 32 values which started at 1 ms and ended at 30 s and the 180-degree pulse was set to 35 microseconds. The diffusion ordered spectroscopy (DOSY) measurements were carried out using the Stejskal and Tanner stimulated echo sequence with bipolar gradients (“stebpgp” Bruker pulse sequence) (Wu et al. 1995). The diffusion time (Δ) and gradient length (δ) were set to 200 and 4 ms, respectively. The gradient length was calibrated such that the 95% gradient strength resulted in a one-dimensional spectrum that had approximately five percent of the spectra intensity of the spectra acquired when utilizing a 2% gradient strength. DOSY spectra were processed using the Bruker macro “dosy2d” in TopSpin v3.6 pl8. The logarithmic scale, exponential processing method, and 100 iterations were selected to fit the change in intensity of the spectral peaks. The DOSY spectra were analyzed using the Dynamics Center which performs and exponential fit at each selected line position providing intensities and diffusion constants along with errors at 95% confidence level.
Multicomponent analysis of multiexponential relaxation data, due to signal overlap, is a very complex problem. Signal selection is required to untangle all the contributions. Normally labelled proteins allow for such selection via homo- and heteronuclear correlations. Natural abundance samples cannot take advantage of this, leaving relaxation and diffusion filters as the only approach. Even so, the data would be incomplete since only the long-lived components can be selected. This has been a vexing problem in materials sciences, where solid state NMR filtering experiments have been developed based on relaxation, chemical shielding anisotropy and dipolar couplings (Schmidt-Rohr and Spies 1996). Some techniques have been able to obtain selective data for all components (Ando et al. 2005; Hazendonk et al. 2003). In this work, only T1 measurements were attempted, and linewidths are used as a proxy for T2. Furthermore, only the widths of the broad components will be considered as those with those with narrow widths arise from the low molecular weight species. Discussion will be limited to general trends over spectral regions rather than specific signals as no assignment has been made.
Results and discussion
Myotoxin-II mass analysis
Deconvolution of the multicharged ion series of intact mt-II analyzed by high-resolution ESI–MS showed a monoiso-topic mass of 13750.52 Da (see SI 1), in agreement with its amino acid sequence (P24605), as corrected for the Leu124Phe change reported in Lomonte and Fernández (2022). Protein homogeneity above 95% was estimated by fractional abundance analysis.
Analytical ultracentrifugation
To examine the oligomeric configuration of mt-II, we initially measured the sedimentation and diffusion profiles derived from sedimentation velocity experiments of mt-II at four different protein concentrations (2.3 μM, 34.9 μM, 145.5 μM, and 218.2 μM) in a buffer containing 40 mM sodium phosphate and 120 mM NaCl at pH 7.2. The results showed that mt-II’s oligomerization state did not change over this concentration range, even at the highest concentration measured (see Fig. 1). Using a global genetic algorithm-Monte Carlo analysis over all concentrations, we determined the sedimentation (s) and diffusion coefficient (D) of mt-II in the absence of SDS (see Table 1). Together with the sedimentation and diffusion coefficients, and the measured molar mass (M) from the mass spectrometry results of mt-II (Lomonte and Fernández 2022), we derived a partial specific volume () of 0.725 ml/g by re-arranging the Svedberg equation (see Eq. (1)), which compares very well with the sequence-derived partial specific volume of 0.726 ml/g as calculated by UltraScan.
| (1) |
where ρ is the density of solvent, R is the universal gas constant, and T the temperature in Kelvin. We also calculated a frictional ratio of 1.15 for monomeric mt-II, which compares the measured frictional coefficient of the mt-II molecule, f, to the hypothetical minimal frictional coefficient of a sphere (f0) with the same molar mass and partial specific volume. The frictional coefficient is readily obtained from the diffusion coefficient (see Eq. (2)), and the volume of the sphere (V) can be obtained from the partial specific volume and the molar mass of mt-II (see Eq. (3)), where N is Avogadro’s number. Using the Stokes–Einstein relationship, a minimal frictional coefficient, f0, can be derived from the radius, r0, of the minimal sphere, and viscosity η (see Eqs. (4) and (5)).
Fig. 1.
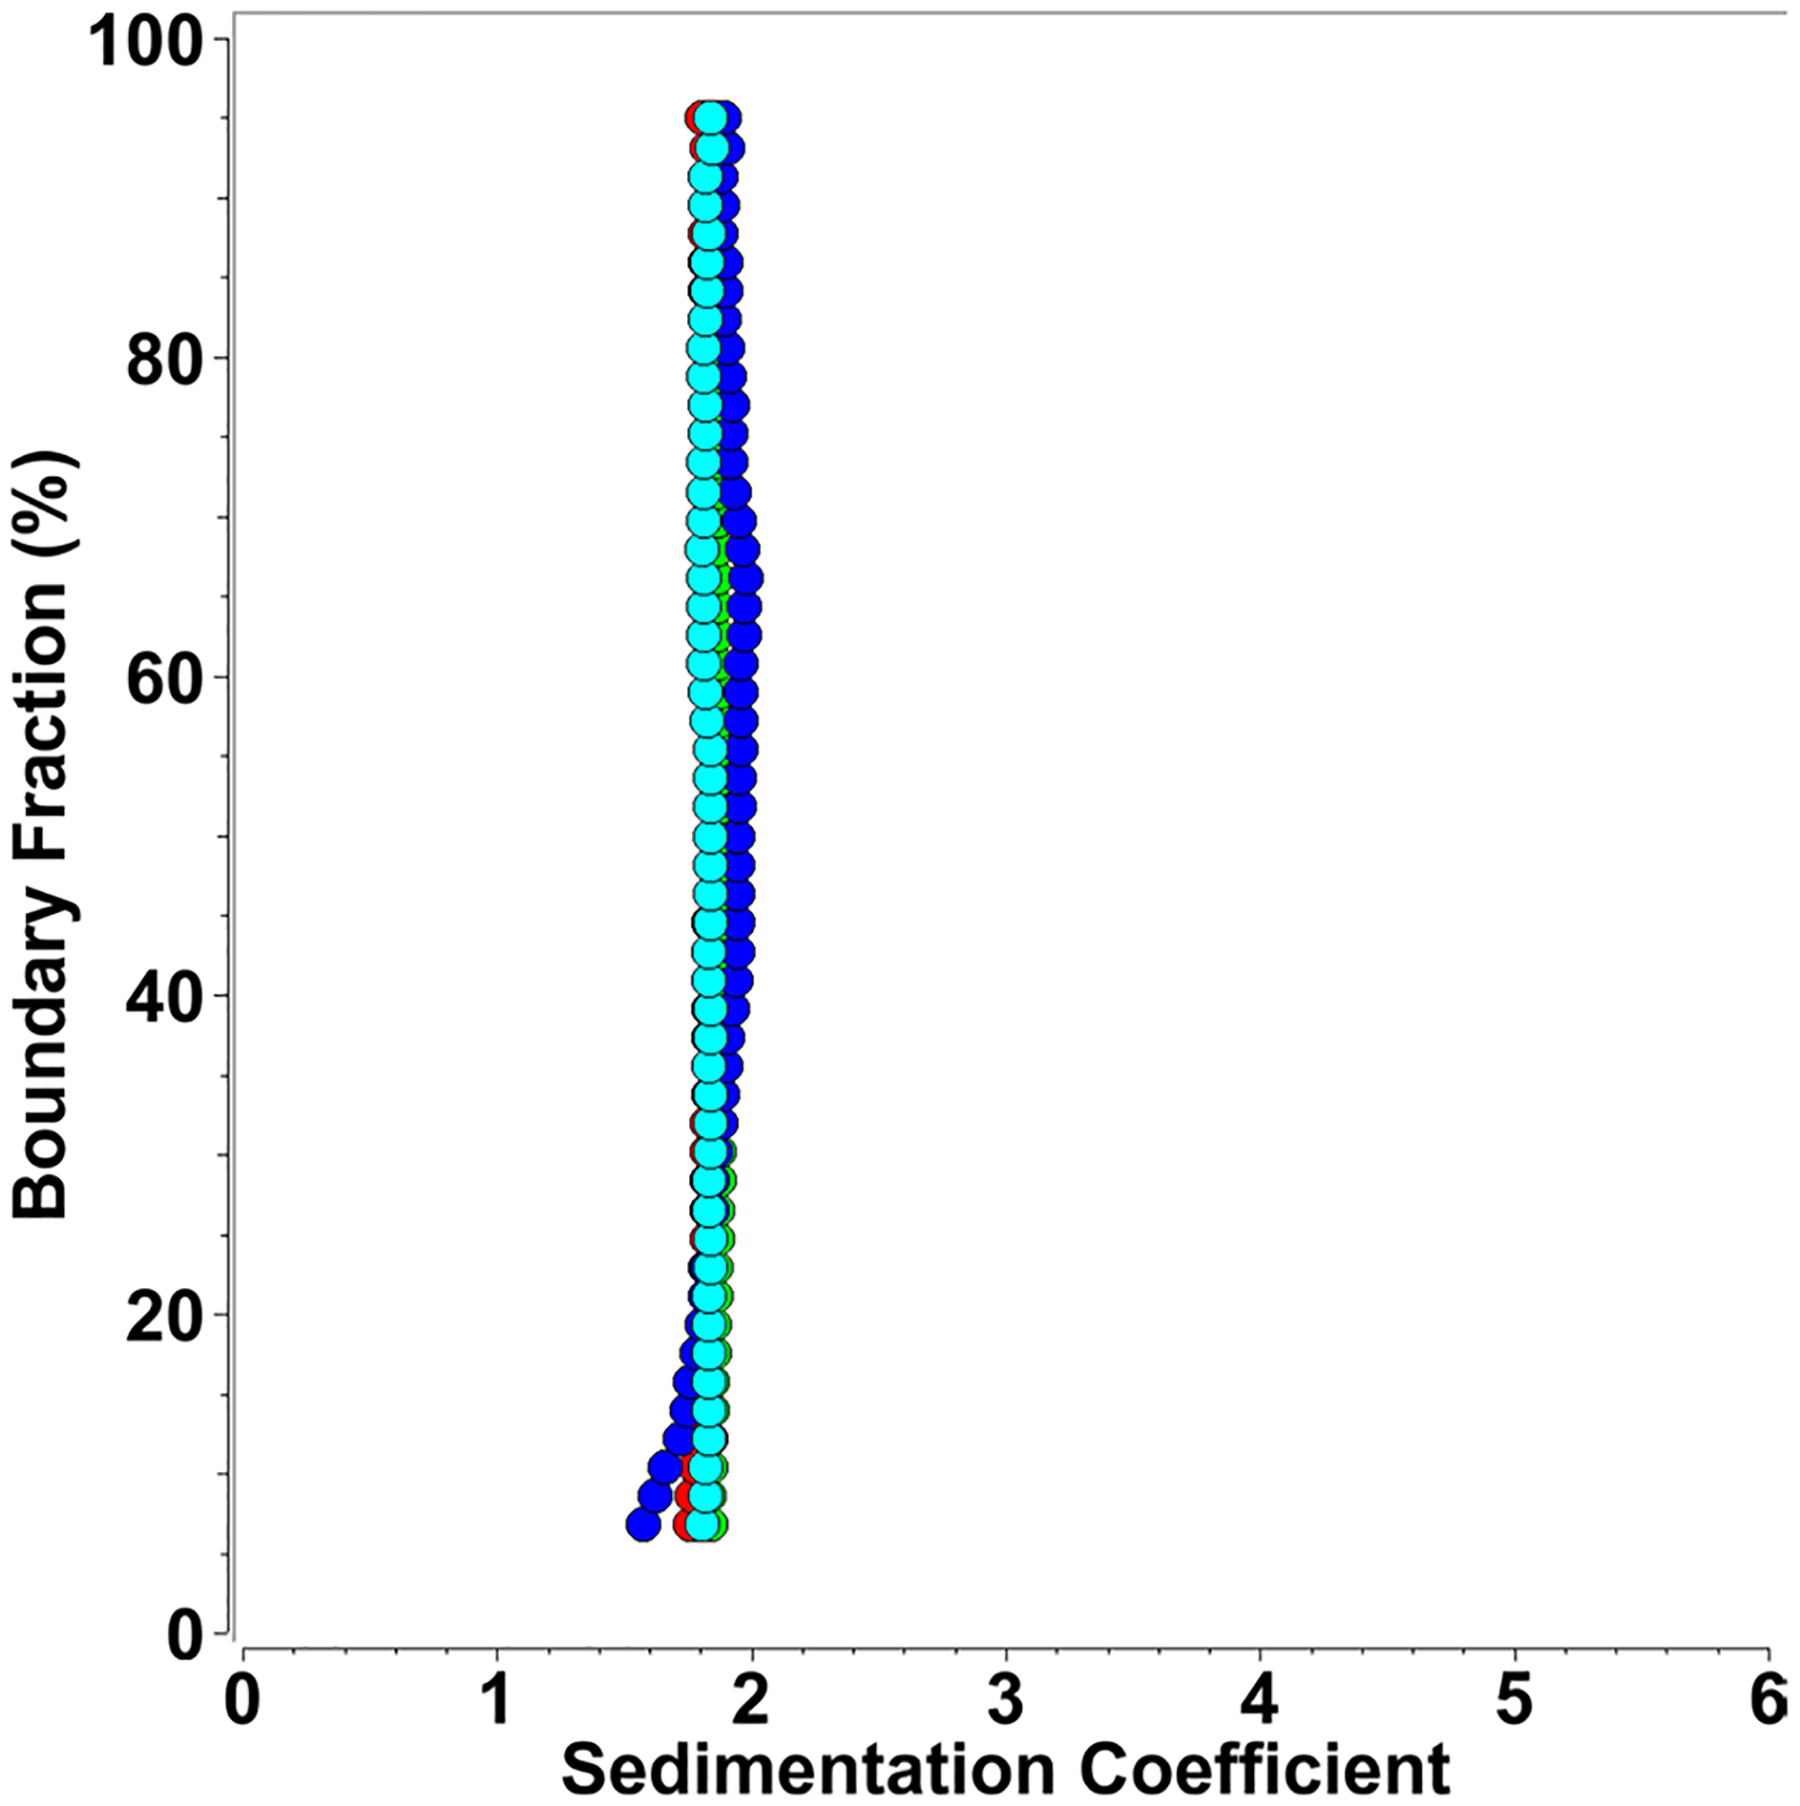
Diffusion-corrected van Holde–Weischet integral sedimentation coefficient distributions of multiple concentrations of mt-II (blue: 2.3 μM, green: 34.9 μM, red: 145.5 μM, cyan: 218.2 μM) generate homogeneous, identical sedimentation coefficient distributions, demonstrating the absence of mass action, reflecting a pure monomeric species
Table 1.
Hydrodynamic measurements of myotoxin-II monomer derived from a global genetic algorithm-Monte Carlo analysis in the absence of SDS
| Hydrodynamic parameter | Mean value (from GA-MC) | 95% confidence interval | US-SOMO |
|---|---|---|---|
| Sedimentation coefficient (s20,w, sec) | 1.83e-13 | (1.79e-13, 1.88e-13) | 1.81e-13 |
| Diffusion coefficient (D20,w, cm2/sec) | 1.18e-06 | (1.07e-06, 1.28e-06) | 1.12e-06 |
| Frictional ratio | 1.15e + 00 | (1.08, 1.22) | 1.22 |
| Molar mass (Da, from mass spec) | 13750.52 | See: (Lomonte and Fernández 2022) | |
| Partial specific volume (ml/g) | 0.725 | (0.726 from sequence) |
| (2) |
| (3) |
| (4) |
| (5) |
Finally, we used the Zeno simulation routine in UltraS-can-SOMO (Brookes et al. 2010b; Brookes and Rocco 2018) to predict sedimentation and diffusion coefficients for the monomer unit in the protein structure database pdb entry [Accession Code: 1CLP] for B.a-Lys49-PLA2 (Arni and Gutiérrez 1993), which are in excellent agreement with the measured values, confirming that mt-II is monomeric over a large concentration range. The results are summarized in Table 1.
Next, we investigated the oligomerization state of mt-II in the presence of SDS. As reported earlier in Matsui et al. (2019) for a related snake toxin, our results also demonstrate that SDS induces oligomerization of mt-II. Interestingly, the oligomerization behavior is highly sensitive to the protein–SDS ratio; the same protein–SDS ratio produces different results when the protein concentrations are changed, suggesting a specific stoichiometry of association has to be satisfied for each assembly state. Nevertheless, a consistent pattern of self-association was observed that was independent of total protein concentration. We started at a protein concentration of 24 μM, monitored at 280 nm by SV, and titrated SDS from 0.001% (0.035 mM) to 0.5% (17.35 mM) (see Fig. 2). The addition of SDS at very small concentrations leads to the formation of a well-defined, discrete ~ 5.5 s species. The amount of this oligomer formed appears to be proportional to the (limiting) amount of SDS added to the protein. At approximately 0.008% (0.28 mM) SDS, all monomeric mt-II is complexed by SDS, forming the ~ 5.5 s species. If the SDS concentration is lowered, an increasing portion of the mt-II signal remains monomeric. The transition is highly cooperative, demonstrating a sedimentation coefficient transition pattern that suggests a strong self-association with a low Kd. If the SDS concentration is increased further, the ~ 5.5 s species is disrupted, and larger aggregates form, reaching up to 8.5 s. The precise composition in this range is very sensitive to small changes in SDS concentration.
Fig. 2.
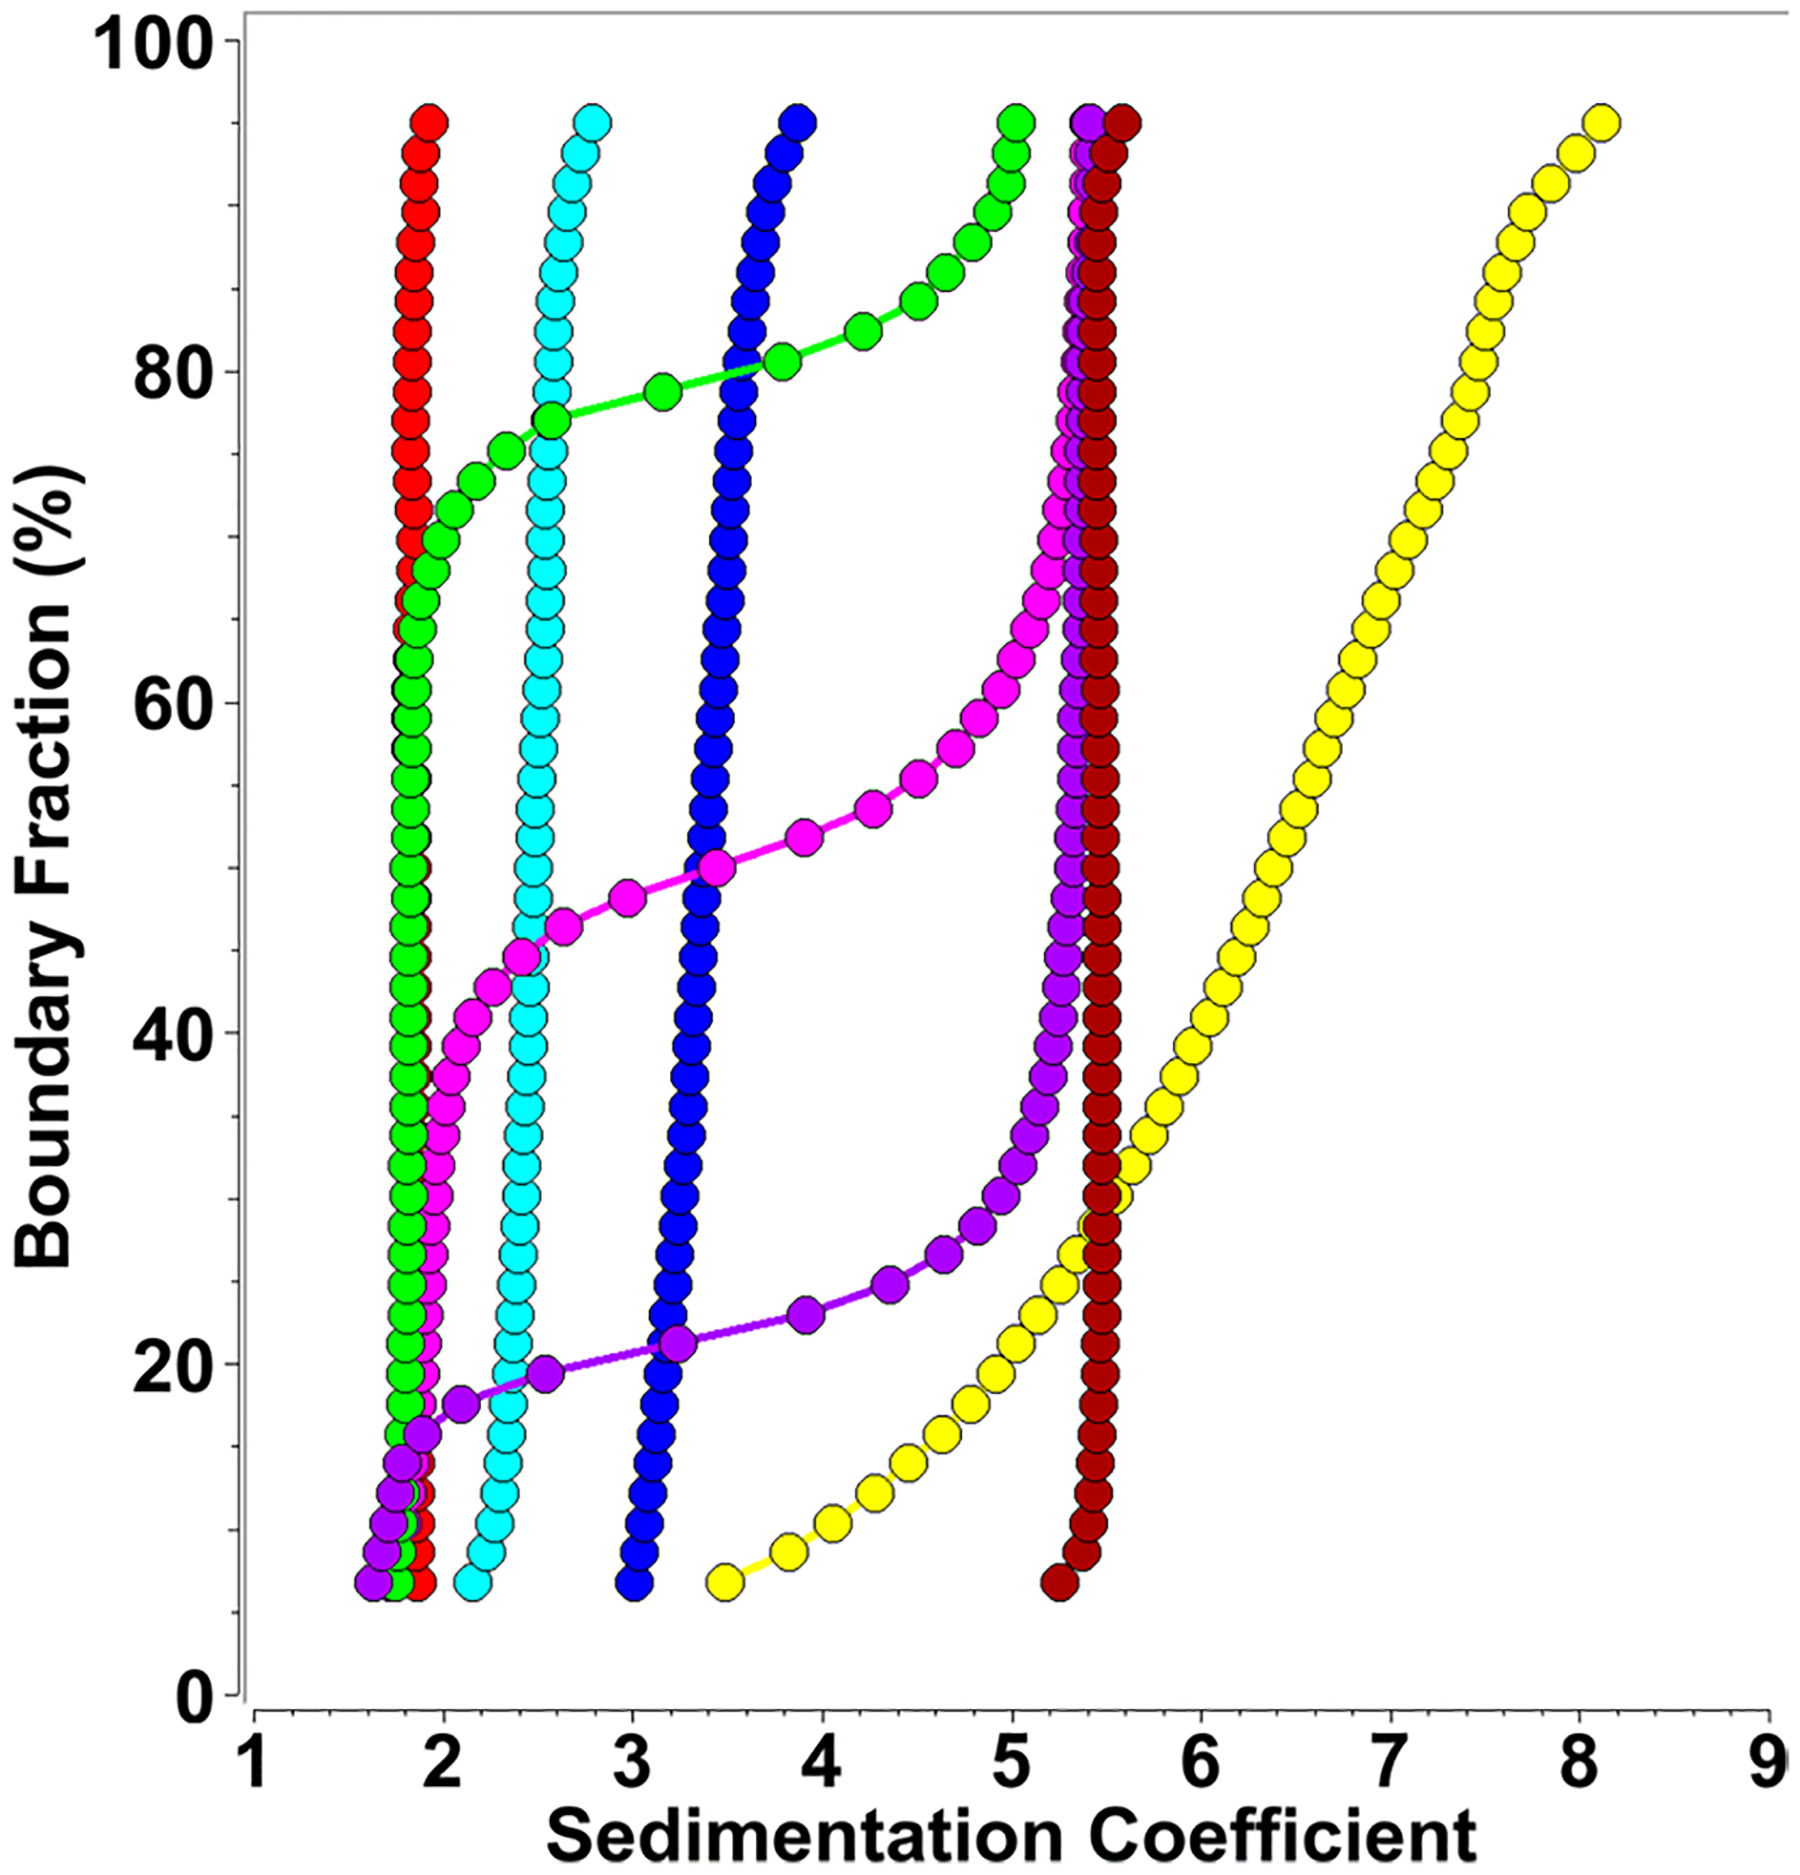
Diffusion corrected integral sedimentation coefficient distributions from SDS-mt-II titrations at 24 μM mt-II concentration (measured at 280 nm) and SDS concentrations variable between 0.001 and 0.5% (0.03–17.35 mM). Red: 0.001% (0.03 mM), green: 0.002% (0.07 mM), magenta: 0.003% (0.10 mM), purple: 0.004% (0.14 mM), dark red: 0.008% (0.28 mM), yellow 0.05% (1.73 mM), blue: 0.1% (3.47 mM), cyan: 0.5% (17.35 mM)
When the concentration is further increased to 0.1% (3.47 mM) SDS, these aggregates are broken up into smaller species that range between 3 and 4 s. At 0.5% (17.34 mM) SDS concentration, only mt-II dimers and trimers appear with s values between 2.2 and 2.8 s, which matches the observations reported in Matsui et al. (2019) for P.fl-Lys-49 PLA2 in 1% (34.69 mM) SDS. It should be noted that the critical micelle concentration (CMC) of SDS is approximately 8.3 mM SDS (0.24%) (Cifuentes et al. 1997). The transition from monomeric mt-II to the stable ~ 5.5 s species appears to be highly coordinated and dependent on the exact SDS concentration. Given the 24 μM mt-II concentration, this ratio of protein:SDS appears to be in the range of 20 SDS molecules per protein molecule. To examine if this protein:SDS ratio can be replicated at different protein concentrations, we performed additional protein:SDS titrations at different mt-II concentrations. In the AUC, it is trivial to change the detection wavelength in order to exploit significant differences in the protein’s molar extinction coefficient. This extends the concentration range where a protein can be monitored. In our approach, we monitored mt-II sedimentation at 220 nm (using a 1.1 μM loading concentration) and 225 nm (using a 3.2 μM loading concentration), in each case performing titrations with SDS that replicated the observed pattern. The observed results for 220 nm are shown in Fig. 3, and the results for 225 nm are shown in Fig. 4. At 220 nm, we observed s values below 1.0 s, which were attributed to SDS micelles, as a 220 nm experiment of a 1.0% (34.69 mM) SDS solution showed (see Fig. 3). A transition to a ~ 5.5 s species was apparent at SDS concentrations as low as 0.001% (34.7 μM). Over 80% of mt-II sedimented as the ~ 5.5 s species with an SDS concentration of 0.0016% (55.5 μM).
Fig. 3.
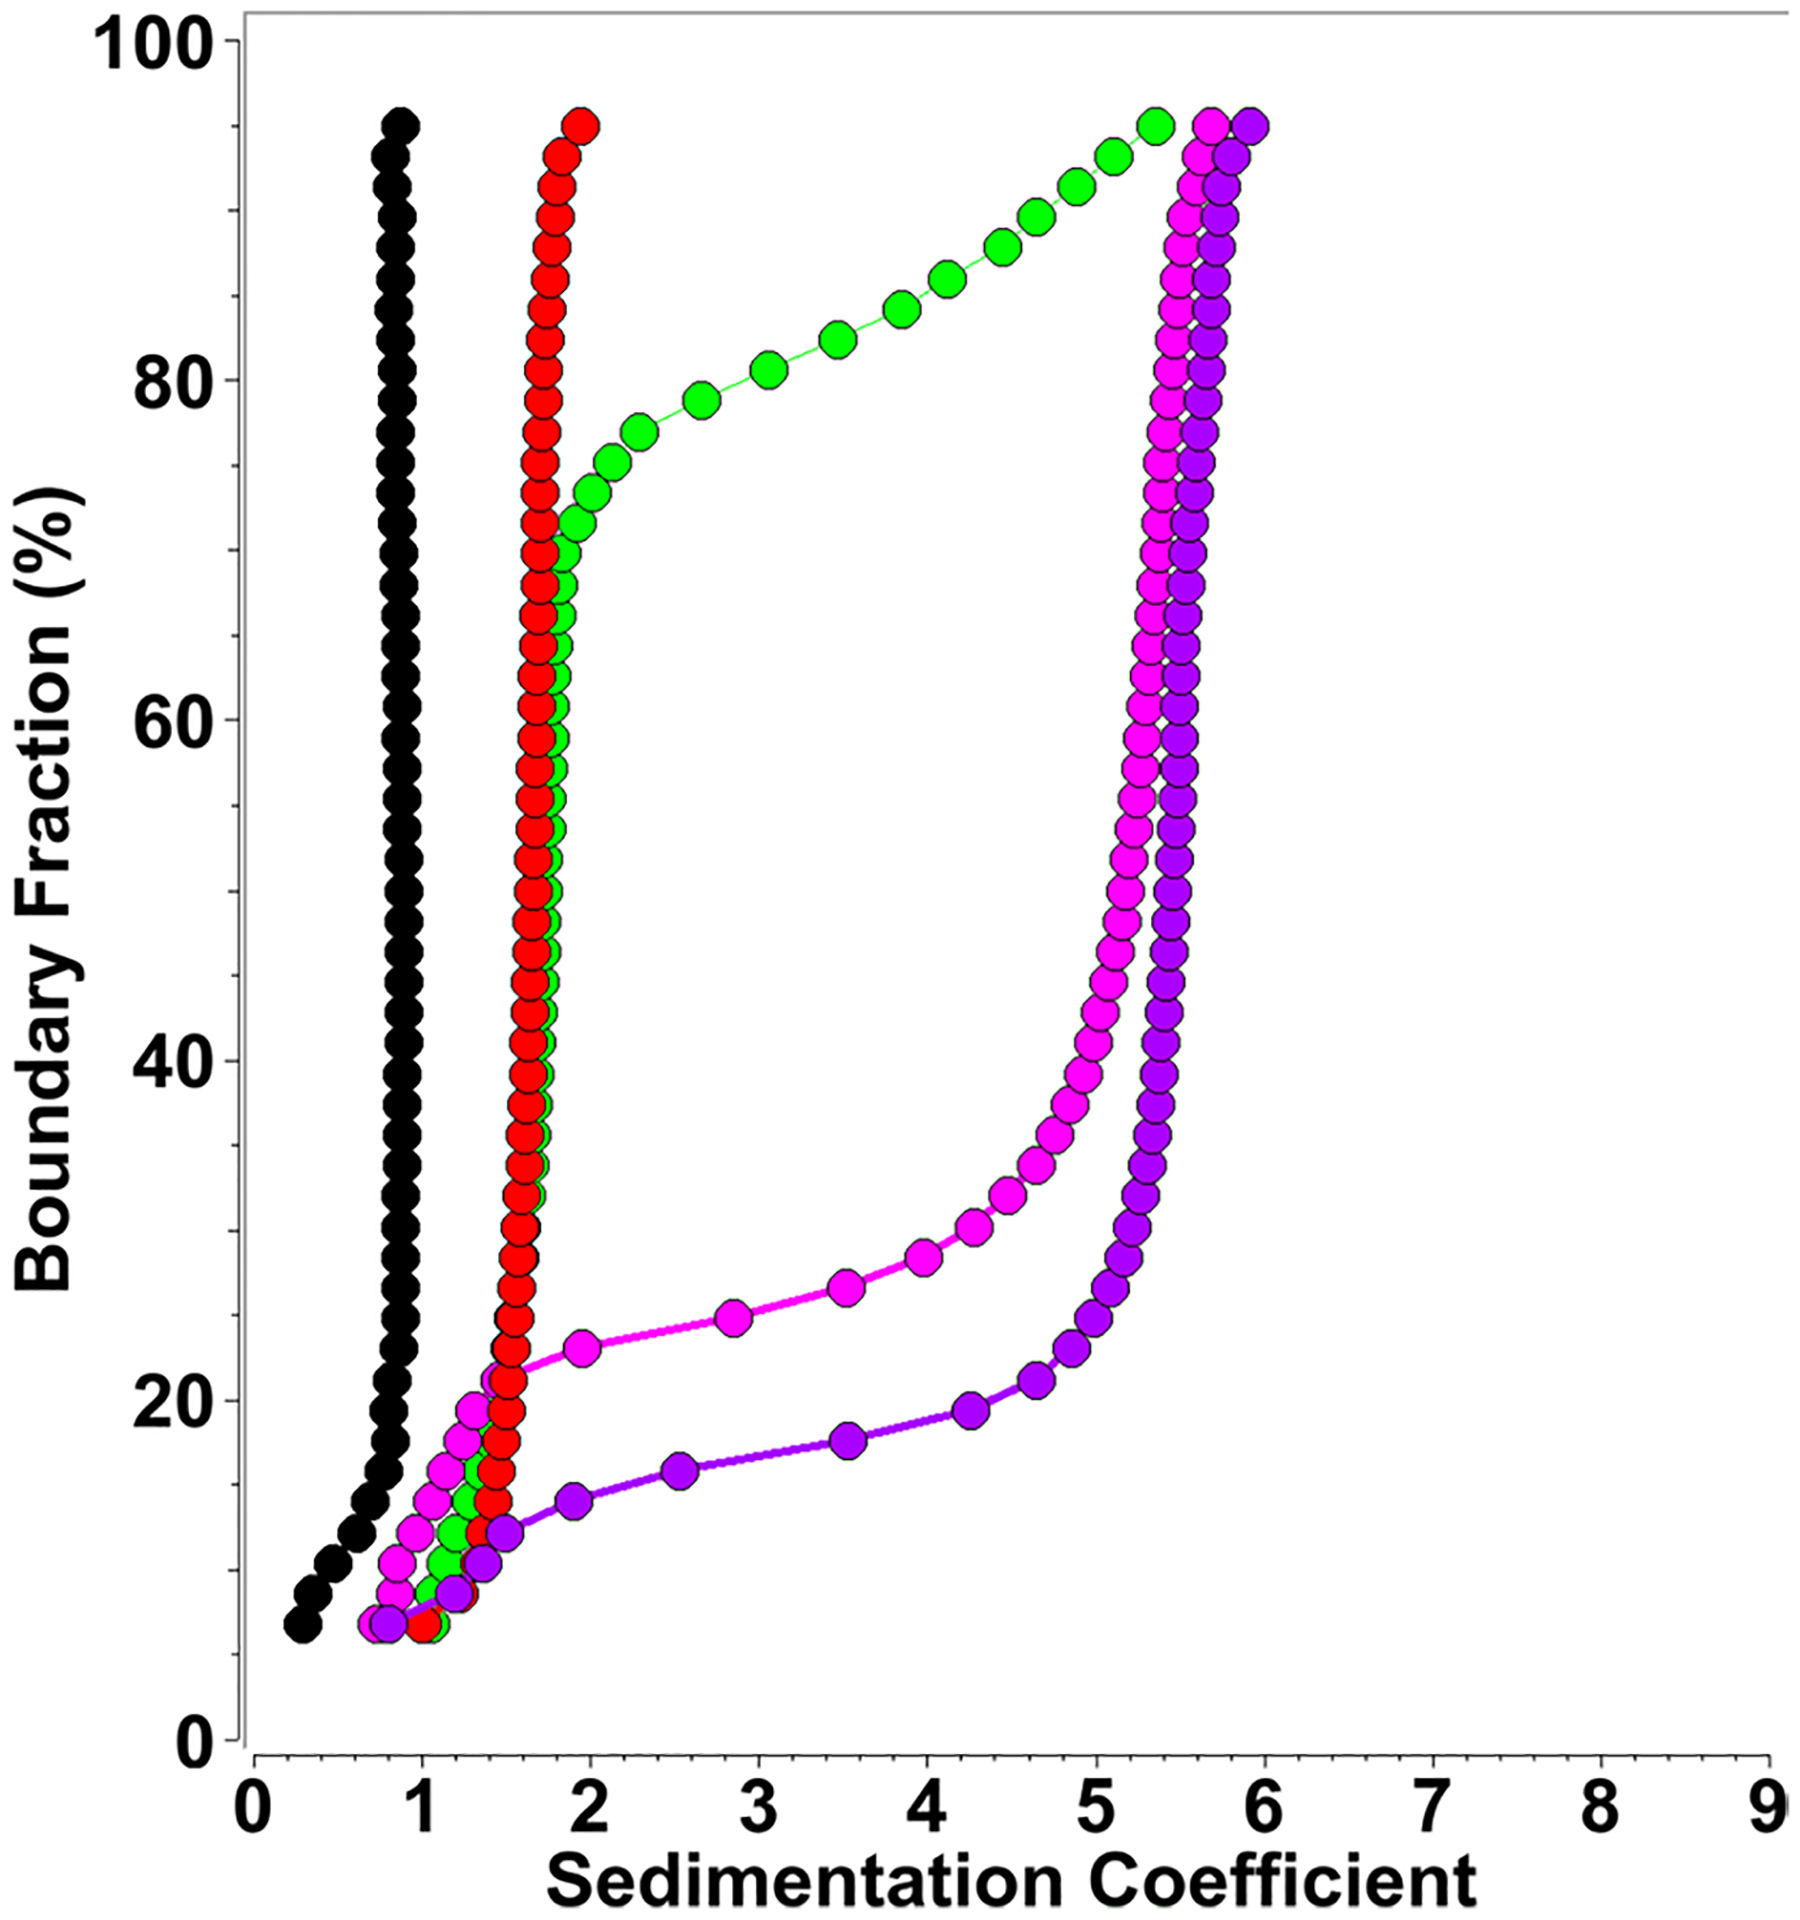
Diffusion corrected integral sedimentation coefficient distributions from SDS-mt-II titrations at 1.1 μM protein concentration (measured at 220 nm) and SDS concentrations variable between 0.0 and 0.0016%. Red: 0.0% (0 mM), green: 0.001% (0.03 mM), magenta: 0.0015% (0.05 mM), purple: 0.0016% (0.06 mM), black: 1% (34.69 mM) SDS control, showing 0.9 s micelle sedimentation at 220 nm, explaining s values below 1.0 s in samples with SDS
Fig. 4.
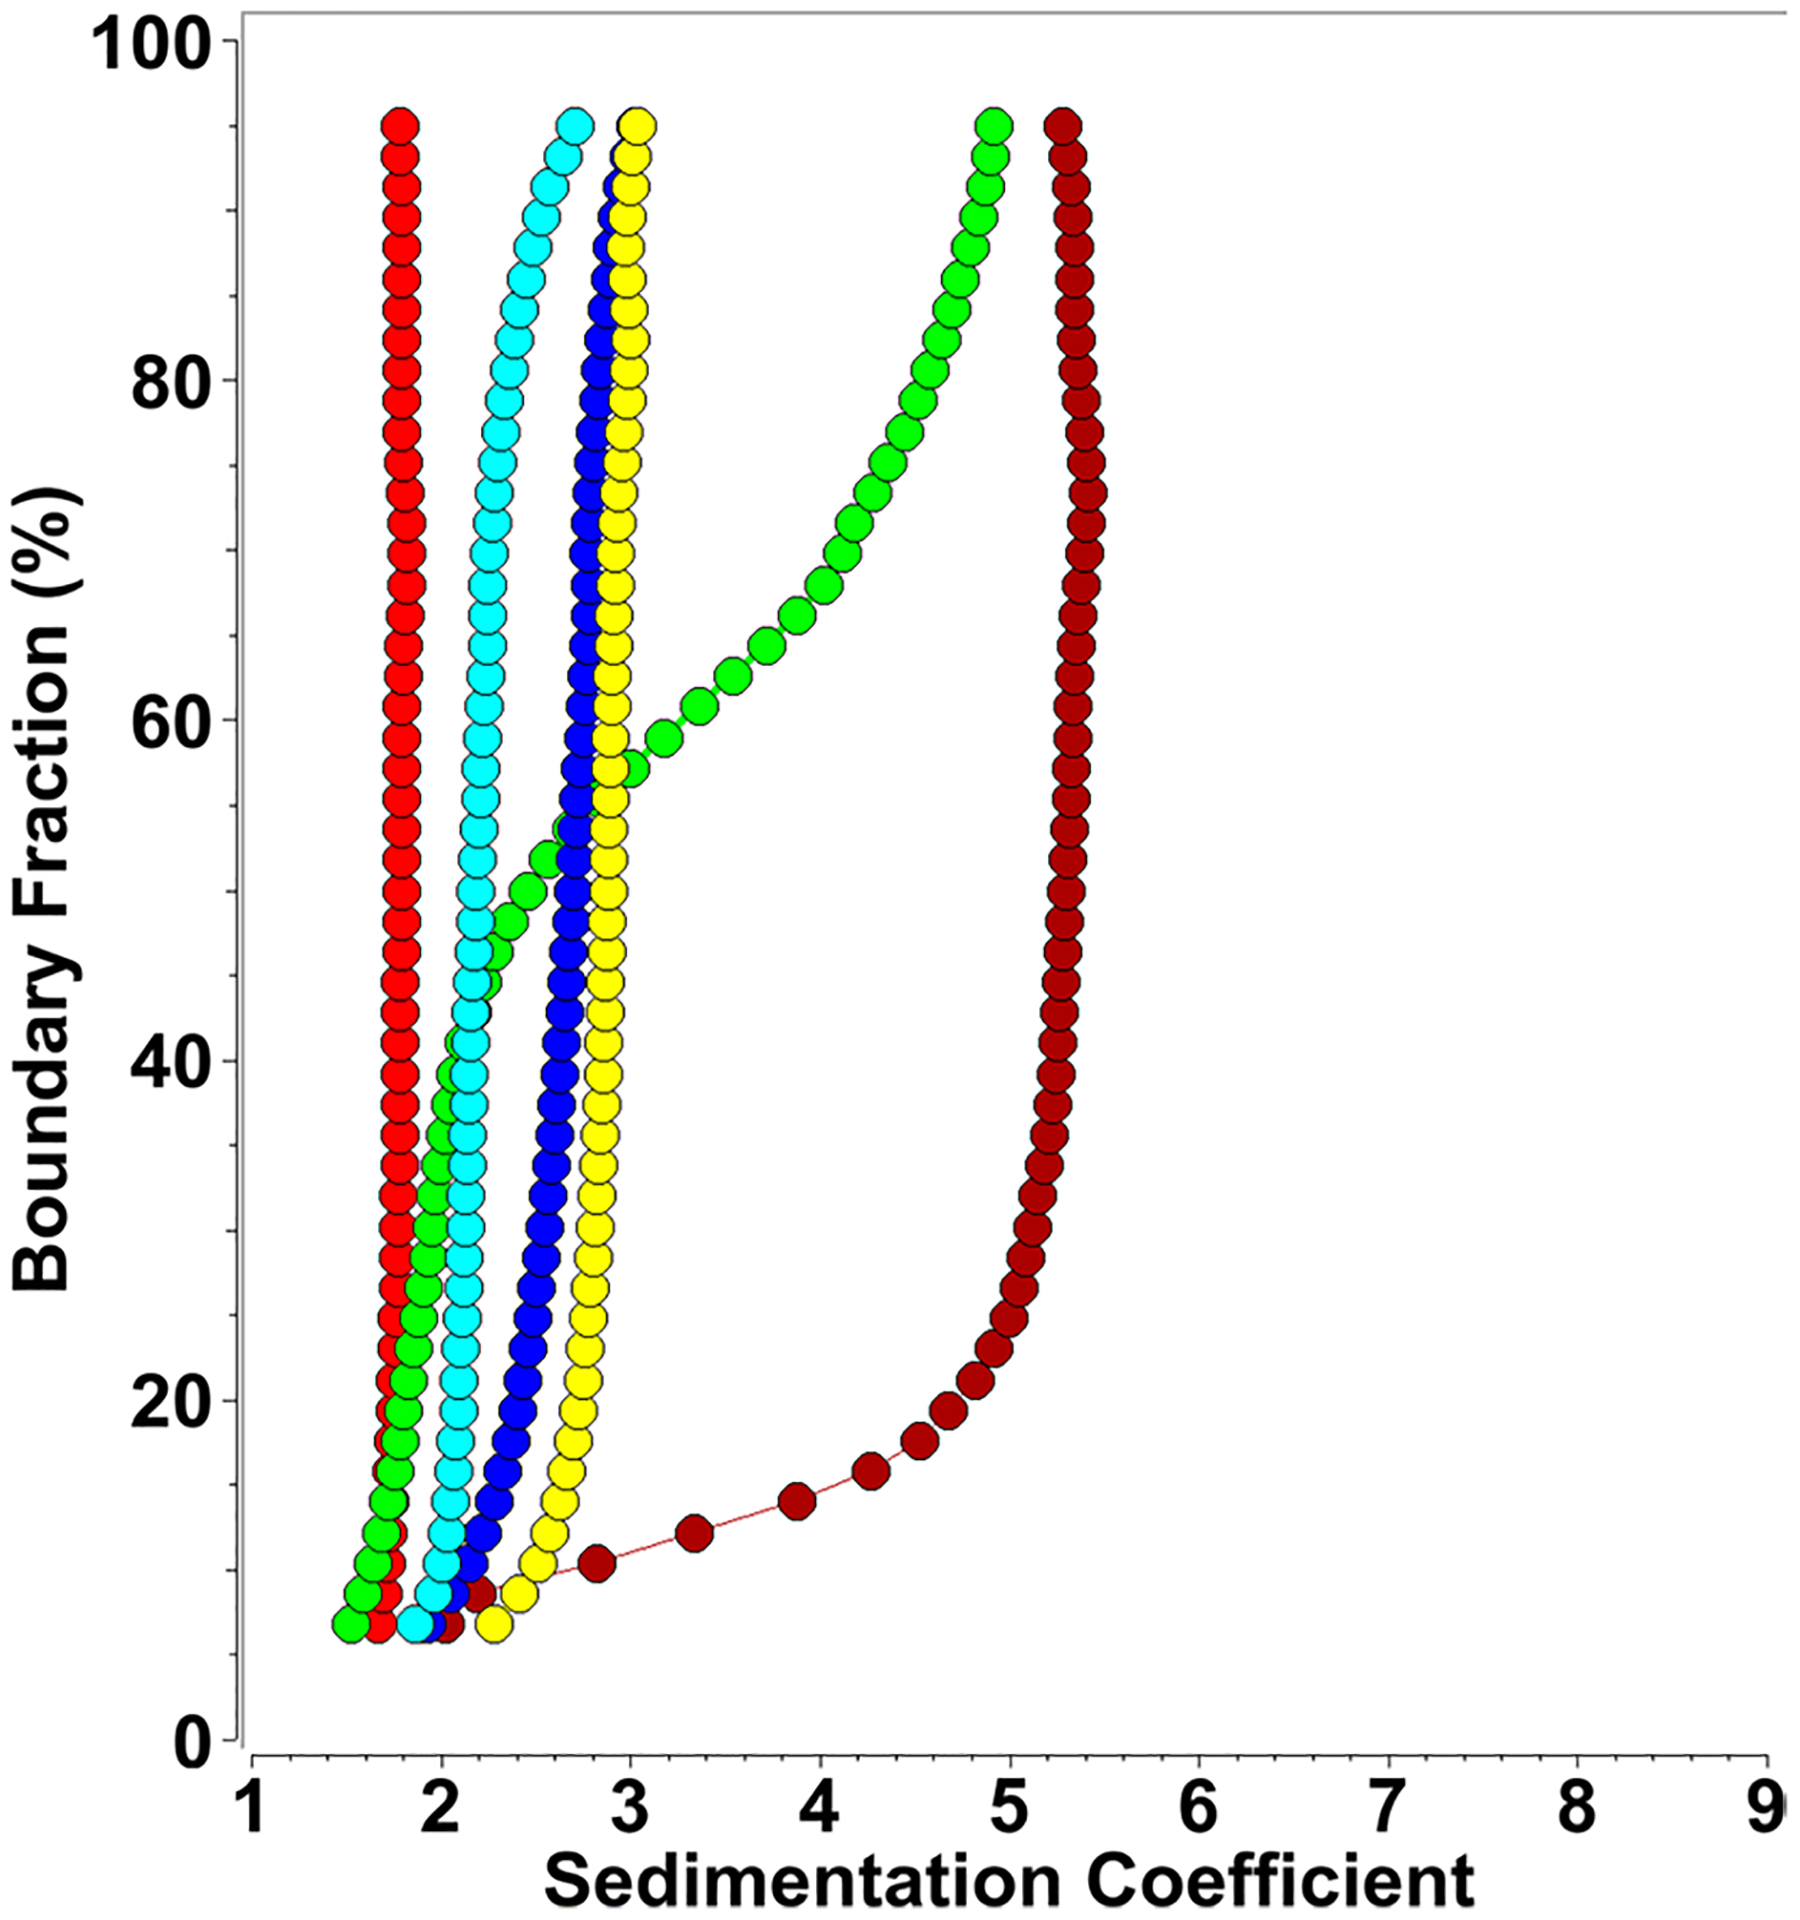
Diffusion corrected integral sedimentation coefficient distributions from SDS-mt-II titrations at 3.2 μM protein concentration (measured at 225 nm) and SDS concentrations variable between 0.0008 and 0.5%. Red: 0.0% (0 mM), green: 0.0008% (0.03 mM), dark red: 0.0013% (0.05 mM), yellow 0.05% (1.73 mM), blue: 0.1% (3.47 mM), cyan: 0.5% (17.35 mM)
Measurements at 225 nm at 3.2 μM mt-II produced a very similar picture. A small amount of mt-II was converted to the ~ 5.5 s species at 0.0008% (0.28 μM) SDS, while an 80% conversion to the ~ 5.5 s species was observed at 0.0016% (55.5 μM) SDS. Increasing the SDS concentration to 0.05% (1.73 mM) produced primarily a 2.9 s species, while a 0.1% (3.47 mM) SDS concentration resulted in a mixture sedimenting between 2.0 and 2.9 s, and a 0.5% (17.35 mM) SDS concentration produced the previously observed mixture of dimers and trimers. Averaging over all conditions that produced the ~ 5.5 s species, we were able to obtain a weight-average hydrodynamic profile for this higher oligomeric species, resulting in a weight-average sedimentation coefficient of 5.46 × 10⁻¹³ s and a diffusion coefficient of 5.73 × 10⁻⁷ cm2/s. To identify the molar mass of the oligomeric state consistent with these measurements (solving Eq. (1) for the molar mass), the partial specific volume of the complex must be known. In a first approximation, a partial specific volume can be estimated from the stoichiometry of the protein:SDS assembly, and knowledge of the individual partial specific volumes. The partial specific volume for mt-II was determined here (Table 1), and values for SDS reported in the literature vary from 0.86 ml/g (Mukerjee 1962) to 0.87 ml/g. The partial specific volume of the complex equals the sum of the mass fractions of the partial specific volume contributions from each species. Based on the stoichiometry determined in the NMR experiments, we can assume ratios between 0.75 and 1.5 SDS molecules to one protein molecule, resulting in partial specific volumes between 0.727 and 0.729 ml/g for the complex. As Fig. 5 shows, these measured parameters are in excellent agreement only with a hexameric complex, and possible minor variations in stoichiometry and partial specific volume are not changing this conclusion.
Fig. 5.
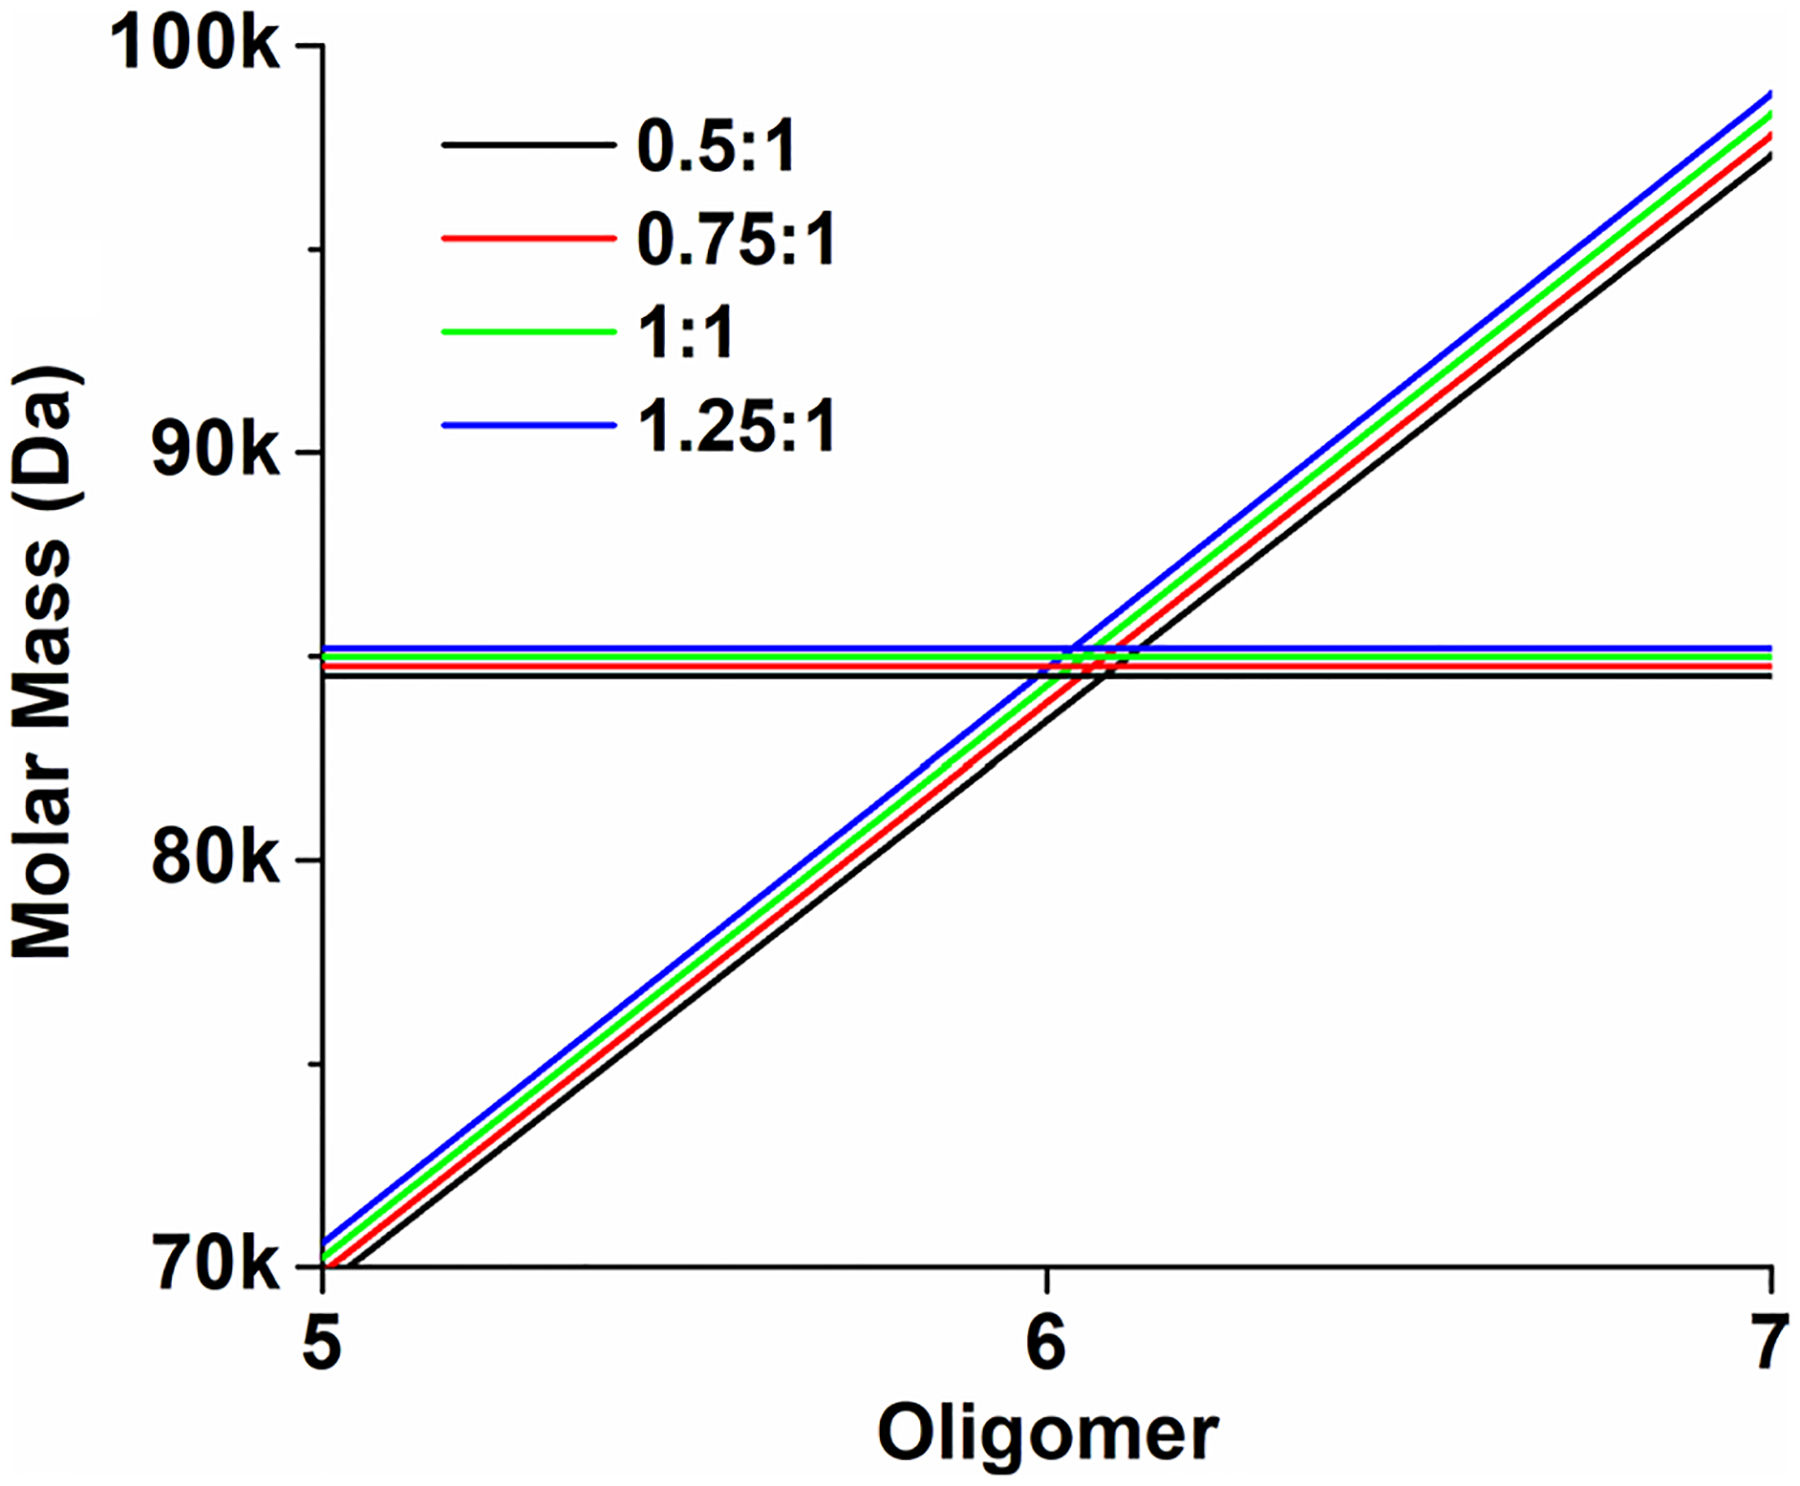
Molar mass as a function of oligomeric size and SDS:protein ratio in the complex. Diagonal lines: The stoichiometry (black: 0.5:1, red: 0.75:1, green: 1:1 and blue: 1.25:1) has very little influence on the molar mass. Calculated molar masses based on the hydrodynamic measurements of the complex as a function of partial specific volume and stoichiometry (black: 0.7265 ml/g, red: 0.7272 ml/g, green: 0.7280 ml/g, blue: 0.7287 ml/g). These lines intersect very close to the hexameric configuration, proving that the complex is hexameric
To test if other lipids or detergents produce similar discrete oligomerization behavior, we repeated titration measurements of mt-II in the presence of the following lipids and detergents: 1-myristoyl-2-hydroxy-sn-glycero-3-phospho-(1’-rac-glycerol) (LMPG), 1-palmitoyl-2-hydroxysn-glycero-3-phospho-(1’rac-glycerol) (LPPG), 1-myristoyl-2-hydroxy-sn-glycero-3-phosphocholine (LMPC), 1-palmitoyl-2-hydroxy-sn-glycero-3-phosphocholine (LPPC), 1-(10Z-heptadecenoyl)-sn-glycerol-3-phospho-(1’-rac-glycerol) (LSPG), CYMAL-5, n-Undecyl-β-D-Maltoside (U300LA), sodium dodecanoyl sarcosine (Sarcosyl), ω-undecylenyl-β-D-maltopyranoside (U310), and n-dodecyl-β-D-maltopyranoside (D310LA). Each lipid was measured at two or three concentrations below the CMC. Unlike SDS, none of these lipids measured in the presence of mt-II induced any oligomerization. These results are shown in SI 2–SI 10, where for each lipid or detergent the integral sedimentation coefficient distributions are overlaid for all concentrations measured.
Nuclear magnetic resonance spectroscopy
While a full assignment of the spectra in buffer and with SDS (0.2%) was not attempted, we present an analysis focused on the 1D 1H spectra of mt-II in buffer and SDS along with corresponding T1 and DOSY experiments. The 1H spectra of mt-II (see Figs. 6 and 8) were acquired at 283, 295, and 310 K with water suppression using samples at 78.23 μM in phosphate buffer with TSP added as an internal reference. At first glance the methyl (< 1.5 ppm), Hα (3.3 to 5.5 ppm), side chain (β, γ, δ) (1.5 to 3.3 ppm), aromatic (6.0 to 7.5 ppm) and side chain NH (6.8 to 8.0 ppm) main-chain NH (6.8 to 10.0 ppm) signals were readily identified (Rule and Hitchens 2006). It was clear from the onset that the majority of the main-chain NH signals were lost to exchange. The Hα signals were distributed in two well-defined regions with the larger proportion of the signal being attributed to the α-helical and random coil environments (3.3 to 4.5 ppm), as to be expected for a protein with three α–helix domains and two β-strand domains.
Fig. 6.
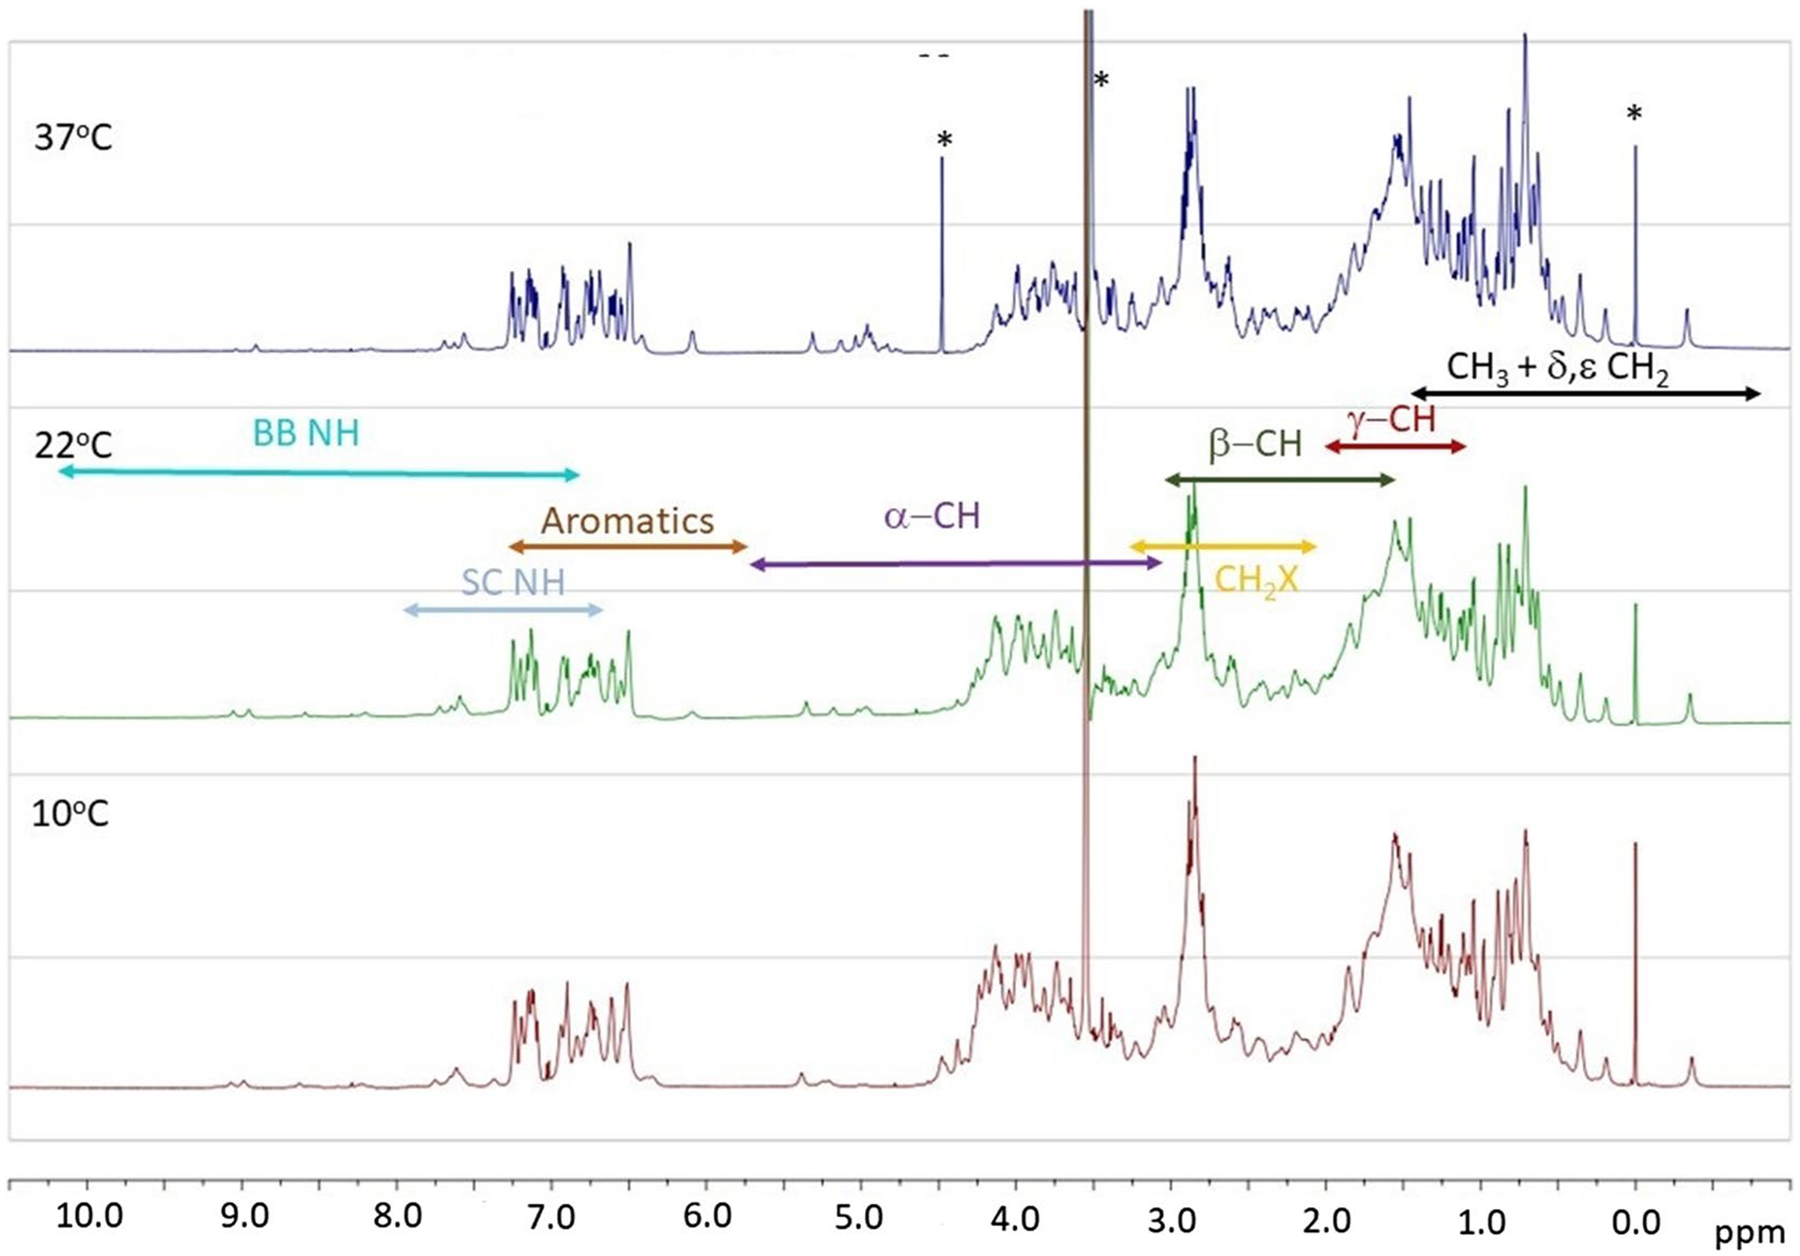
700 MHz 1H NMR spectra with water suppression of mt-II in phosphate buffer at 37, 22, and 10 °C and pH 7.9
Fig. 8.
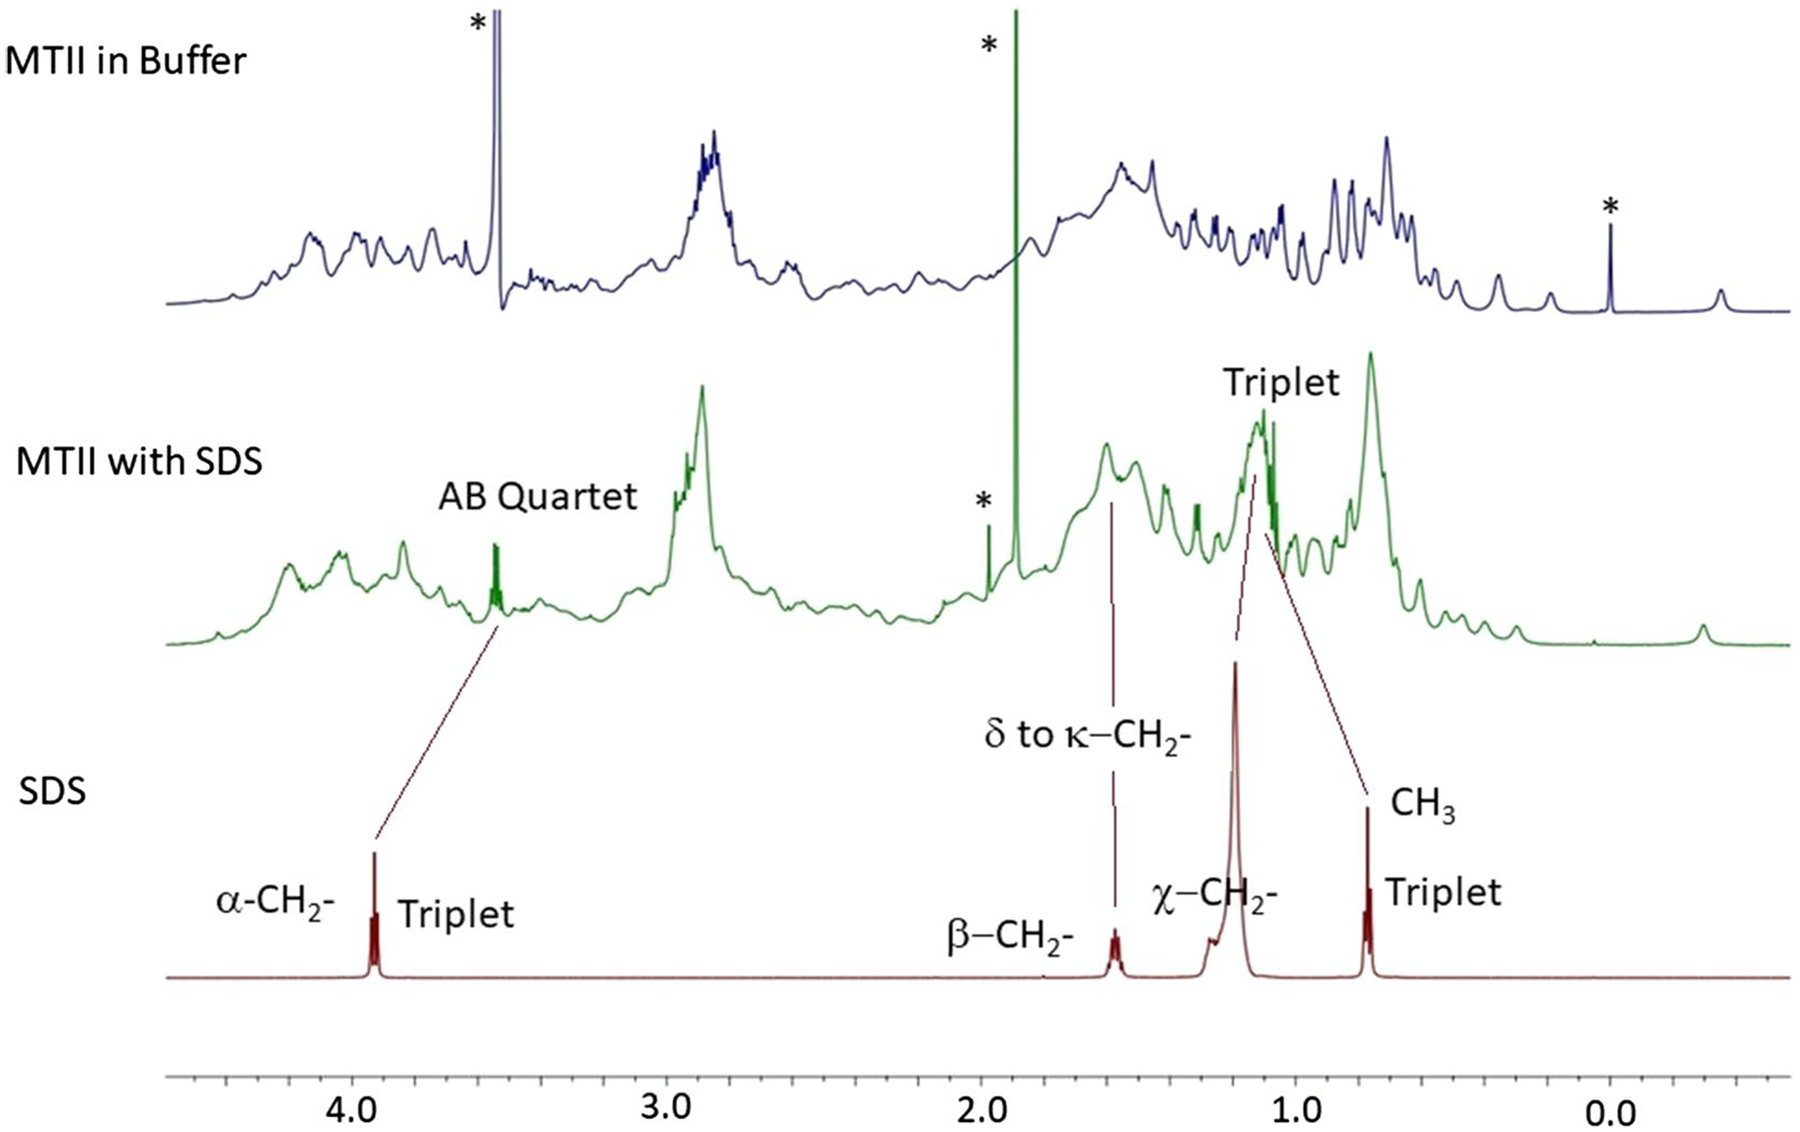
Comparison between the 700 1H NMR spectra of mt-II in buffer (top), mt-II with 0.2% (wt) SDS in buffer (middle) and SDS in buffer (bottom) at 22 °C and pH 7.9 over the region containing the SDS signals
To start, deconvolution analysis was performed on the 1H spectrum of mt-II in buffer at 283 K using the Mestre NOVA line fitting tool. Fitting was carried out over 3 separate regions with Lorentzian line shapes using a sampling linewidth based on the narrowest line in each subregion. The relative error, ε, to the total fitted area, A, is computed from the residual error (RE) as follows:
where , and N is the number of data points.
The deconvolution results are summarized in Table 2. The low chemical shift portion, − 0.4 to 0.6 ppm (Fig. 11 SI) of the methyl region gave consistent signal areas from which one H-equivalent (Heq) area had to be determined. For example, when taking the two signals at − 0.4 and 0.2 ppm to correspond to 3 Heqs, or alternatively that at 0.35 ppm as 3 Heqs, all the singlet and doublet signals from − 0.4 to 1.15 ppm come to a total of 146.5 Heqs, giving 49 methyls, which is exactly what is known to be present. Note also that 10 methyls were significantly deshielded which comports with three Leu (100, 111, 114) and one Ile (94) residues residing in a hydrophobic pocket (structure 1CLP, (Arni et al. 1995)) with nearby aromatic residues (Tyr-107, Tyr-109 and Tyr-110). The side chain region exclusive of methyl signals (1.15 to 2.3 ppm) gave a total of 220.7 Heqs for the γ-, δ- and ε-Hs, a bit short of the 268 predicted. The region including XCH2 and Hα signals came to 271 in line with 269 predicted. The subregion containing the NCH2 signals of Lys and Arg came to 63 Heqs, which overestimates the 48 known. Those of OCH2 came to 34 Heqs, not far from 27 expected. This leaves 160 Heqs for Hα exceeding the 112 total for both α-helix and β-strand. The remaining region indicated 66.8 Heqs aromatic, 11.7 Heqs side chain-NH, and 12.7 Heqs β-Hα signals. Altogether 718.3 Heqs signal was observed, excluding NH contributions, out of a total of 710 Heqs, which represents a 1.2% excess. Most disparity in signal distribution within each region was likely due to misassignment, saturation in the Hα region, and the presence of large background signals. These results were consistent enough with the stoichiometry of the 1H environments within mt-II to proceed with the analysis of the spectra of mt-II with SDS.
Table 2.
Parameters for deconvolution of the six regions of the 700 MHz 1H NMR spectrum in Buffer at 295 K and pH 7.9
| Region | Methyl/alkyl | X-alkyl and α-Hα | Aromatic + NH + β-Hα |
|---|---|---|---|
| Range (ppm) | − 0.5–2.35 | 2.36–4.73 | 4.73–9.96 |
| N | 9131 | 7580 | 16,746 |
| RE | 80,400 | 18,750,000 (581,0002) | 7344 |
| ε (%) | 0.94 | 16 (2.80) | 2.1 |
| Area (*106)1 | 275 | 204 | 68 |
| Lines | 193 | 280 | 104 |
| Heq | 367 | 271 | 91 |
| Sampling width (Hz) | 9, 12, 20 and 40 | 9 | 9, 15 and 30 |
Areas are in arbitrary units. The total fit area does not directly correspond to Heqs as it includes contributions from the solvent and buffer signals
The RE is a best estimate based on a subregion below 3.50 ppm as the value covering the whole region is contaminated by the contribution from a large background signal at 3.55 ppm
Stoichiometry of mt-II with SDS
The spectrum of mt-II in the presence of 0.2% SDS (Figs. 7 and 8) was deconvolved into 6 regions, which are summarized in Table 3. For the methyl end-chain alkyl region a total of 255.5 Heqs were determined, which are broken down to 156.1 Heqs for CH3 and 80.5 Heqs for CH2. The alkyl region including the γ, δ and ε signals showed an additional 201.1 Heq of side chain CH2 and CH along with 2.22 and 16.67 Heqs from the CH3 and main chain signals of SDS. The alkyl-X region gave a total of 143.8 Heqs of CH2O and CH2N along with 1.99 Heqs corresponding with SDS α-CH2 signal. The Hα in α-helix and random coil (RC) environments totaled to 107.8 Heqs, and the β-strand Hα region had 7.6 Heq Hα signals. Lastly, the aromatic and NH region came to a total of 52.2 Heqs for the aromatic and 56.5 Heqs for the NH’s.
Fig. 7.
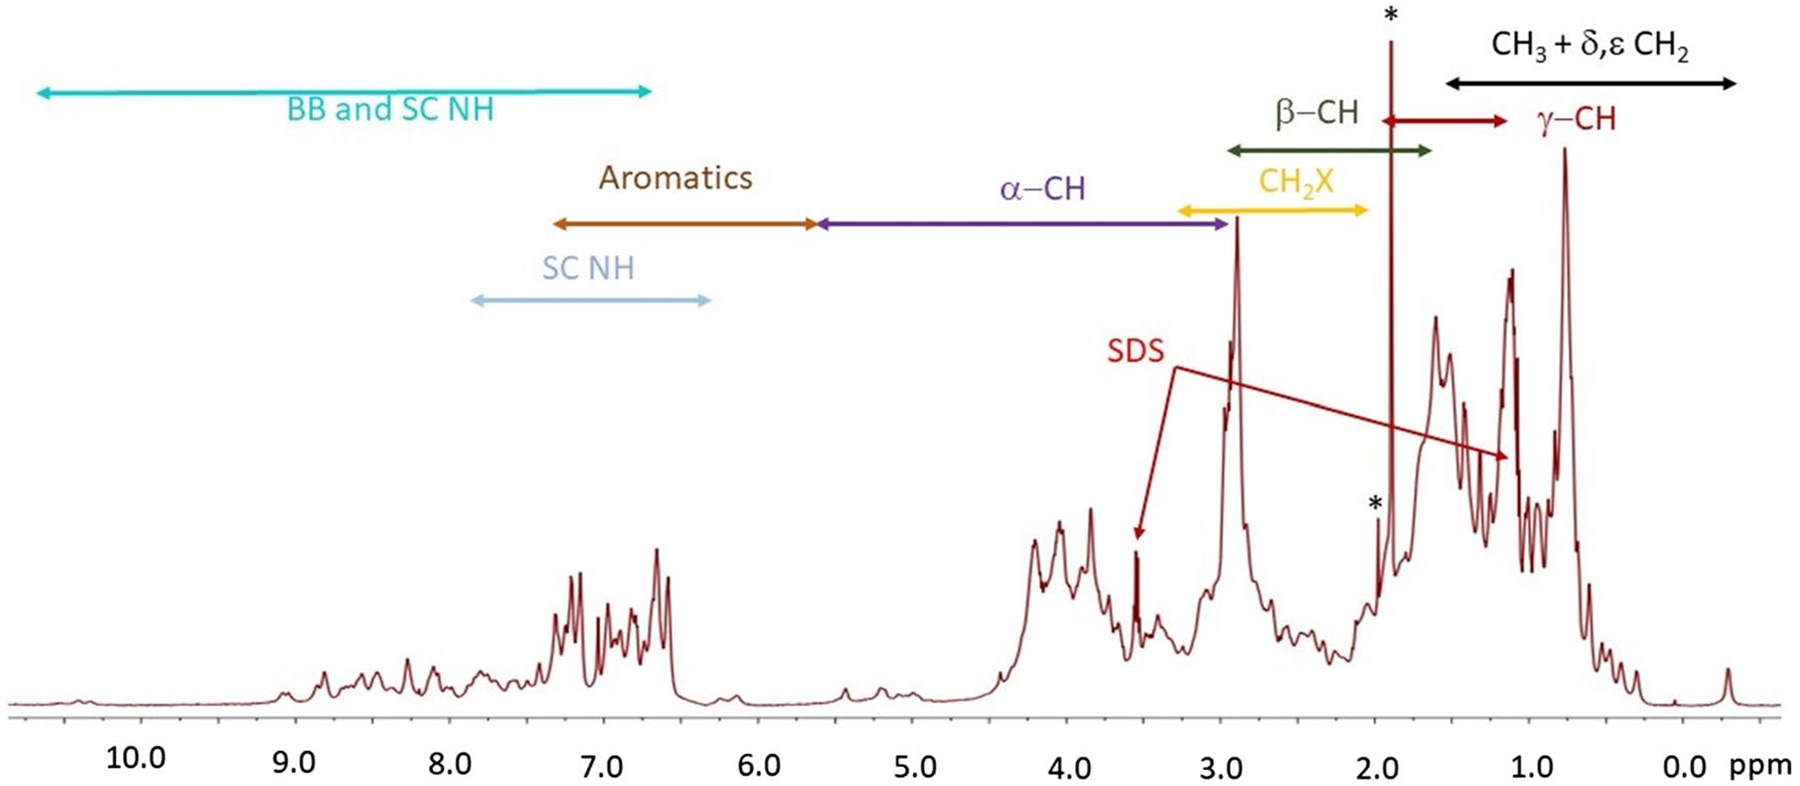
700 MHz 1H NMR spectra with water suppression of mt-II with 0.2% (wt) SDS in phosphate buffer at 22 °C and pH 7.9
Table 3.
Parameters for deconvolution of the six regions of the 700 MHz 1H NMR spectrum in buffer and SDS at 295 K and pH 7.9
| Region | Methyl | Alkyl | Alkyl-X | α-Helix Hα | β-Strand Hα | Aromatic |
|---|---|---|---|---|---|---|
| Range (ppm) | − 0.39–1.44 | 1.45–2.63 | 2.63–3.61 | 3.61–4.65 | 4.65–5.75 | 5.76–10.93 |
| N | 5875 | 3784 | 3134 | 3317 | 3518 | 16,539 |
| RE | 514 | 14,600 | 214 | 430 | 14.0 | 90.2 |
| ε (%) | 0.70 | 3.0 | 0.43 | 0.87 | 2.4 | 1.95 |
| Area (*106) | 18.9 | 14.8 | 10.8 | 7.9 | 0.56 | 8.0 |
| Lines | 102 | 135 | 102 | 106 | 94 | 99 |
| Heq | 255.5 | 202.9 | 145.6 | 107.4 | 7.6 | 108.7 |
| Sampling width (Hz) | 9, 11 and 17 | 11 | 9 and 11 | 11 | 11 | 9, 15 and 30 |
In aggregate, all observed mt-II signals came to 805.0 Heqs with an additional 22.7 from SDS. If all NH signals are excluded it becomes 748.5 Heqs, which compares to 710 Heqs computed from the sequence. The spectrum clearly indicates that the 116 backbone NH are missing due to exchange and 56 of 102 side-chain NH signals were observed. Thus, if 25 are not exchangeable, 31 NH remain. In total 38.5 Heq excess signal was seen for mt-II reflecting 5% of the signal.
The analysis of the mt-II spectrum with SDS was consistent with respect to the stoichiometry of the peptide H environments, matching those predicted by the sequence. These results imply that for every 1.000 Heq of protein (σ = 0.007) there are 20.88 Heq (σ = 0.51) of SDS signal, which in turn represent the 25 hydrogens, giving a ratio of 0.84 (σ = 0.02) to 1. When considering only the α-CH2 signal (AB-quartet), then a ratio of 1 to 0.997 (σ = 0.008) is obtained. Alternatively, the methyl signal (triplet) gives a ratio of 1 to 0.74 (σ = 0.02) and the main chain signal gives 1 to 0.83 (σ = 0.03). The analysis based on the α-CH2 supports the 6:6 ratio proposed for the hexamer. The underestimates maybe the result of not being able to identify all the methyl and main chain environments for SDS, suggesting the possibility of several binding geometries.
Protein mobility and evidence for SDS binding modes
The T1 values of mt-II in phosphate buffer at 295 K (Fig. 9A for the methyl and the δ–, γ– and ε–resonances were short, ranging between 0.8 and 1.7 s, which is consistent with the higher mobility expected at the end of side chains. As the T1 of the CH3 are shorter than those in the α-helix, the correlation time of the whole protein must be well beyond than 1/ωo, where the T1 minimum is seen (it occurs at 0.2 ns for 700 MHz). The β, CH2O and CH2N T1 values were longer (1.7 to 2.1 s), suggesting that they exhibit less additional mobility than the CH3 (Cavanagh et al. 2007); however, those of Lysine were shorter ranging from 1.2 to 1.6 s in line with methyl mobility, which is to be expected as these are at the end of a long side chain in contrast to the others being closer to the side chain α-position. The Hα cover a wide range from 1.7 to 3.1 s, where those at lower chemical shifts, from 3.65 to 4.50 ppm, are representative of the α-helix (Avhelj et al. 2004) giving 1.75 to 2.25 s. The middle chemical shift region, from 4.25 to 4.75 ppm, contains the random coil signals and have longer values from 1.75 to 2.75 s. The higher shift region, from 4.65 to 5.55 ppm, represents the β-strand with values from 2.8 to 3.1 s. The aromatic T1 values range from 2.0 to 3.2 s, and sidechain NH signals range from 1.8 to 2.2 s.
Fig. 9.
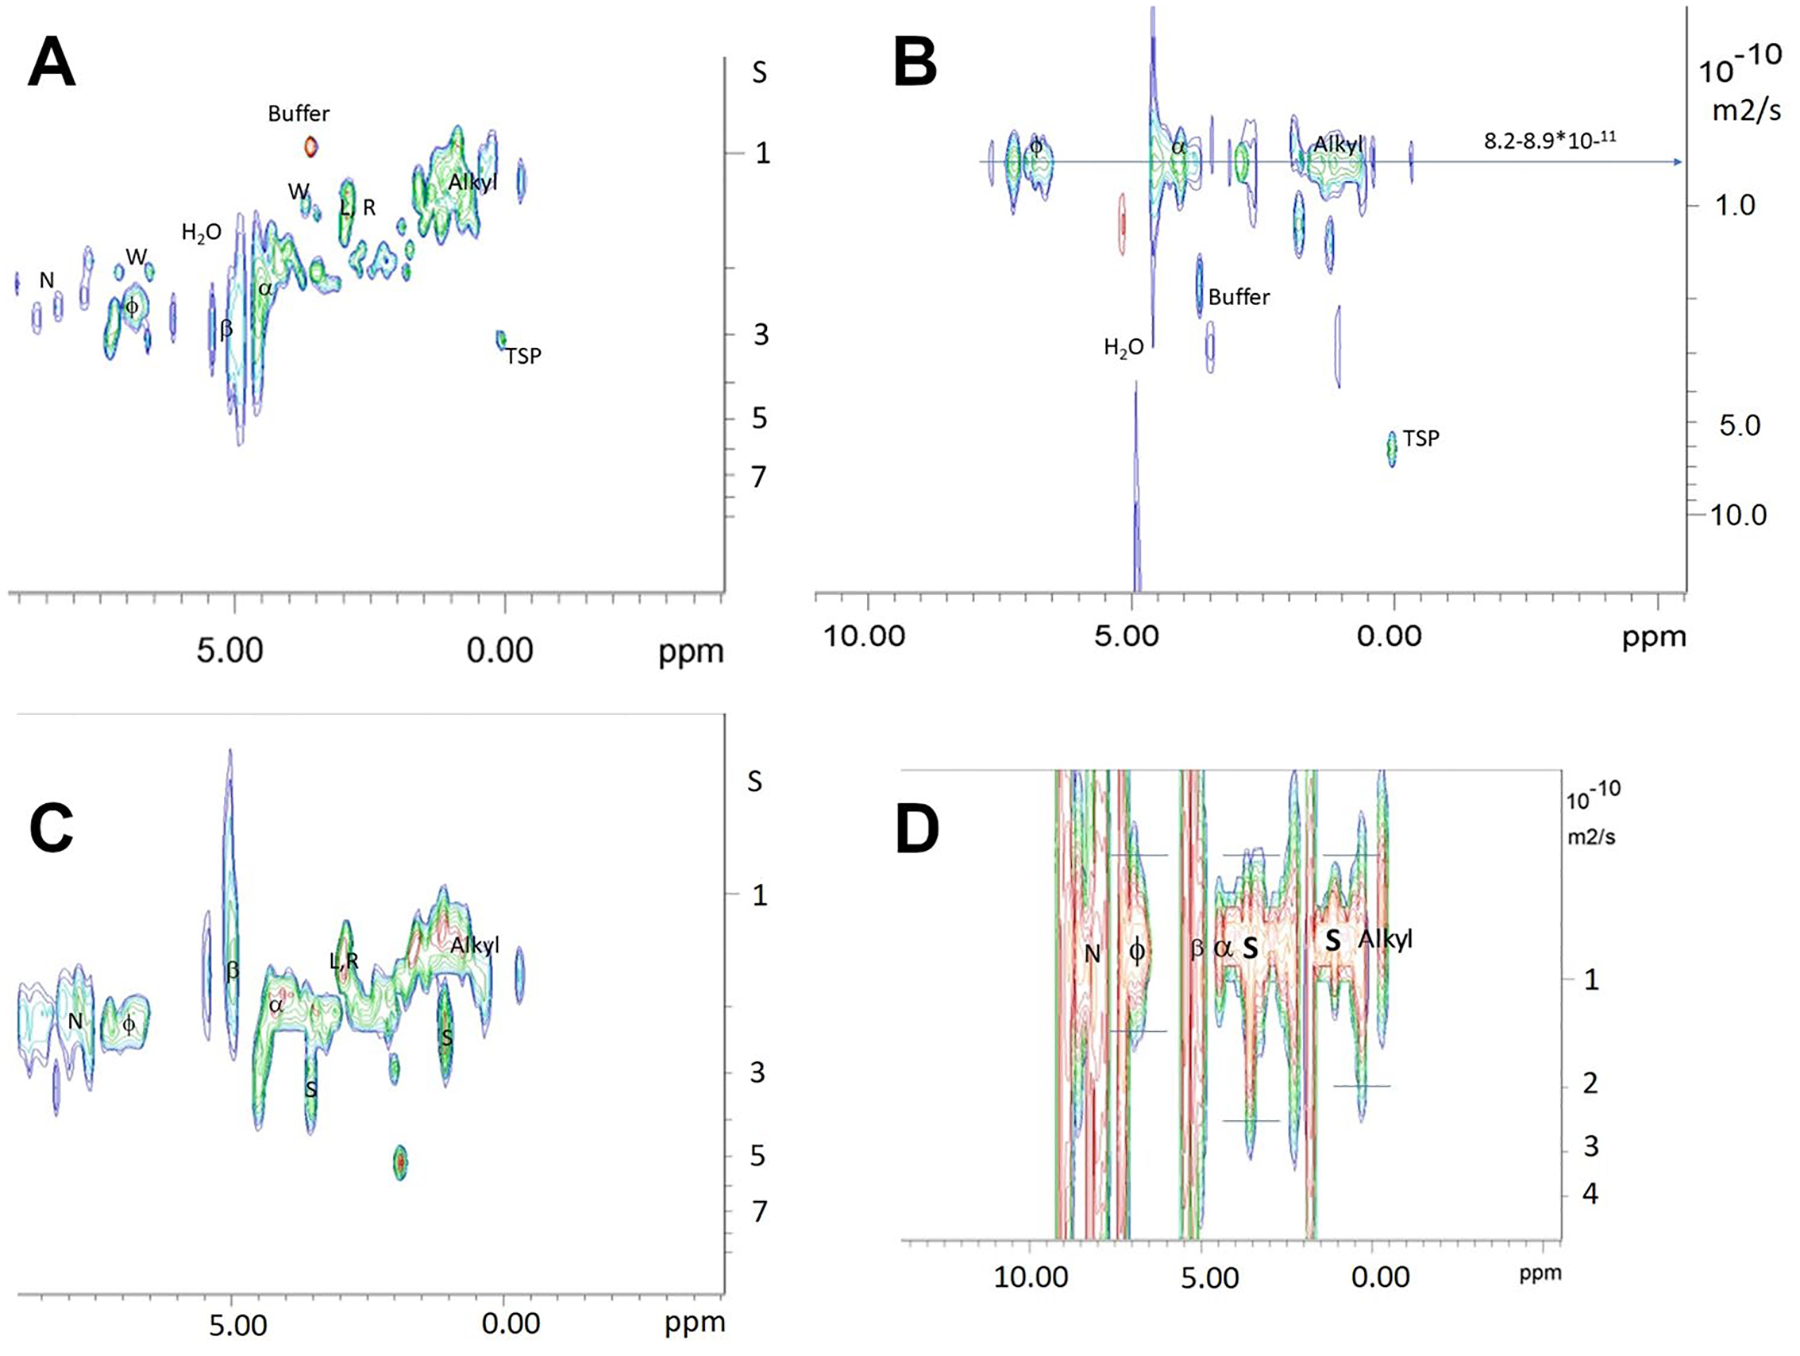
NMR analysis of mt-II in the presence of 0.2% (wt) SDS at pH 7.9. A The T1 values of mt-II in buffer at 22 °C; B The 2D 1H DOSY spectra of mt-II in Buffer at 22 °C; C The T1 values of mt-II with SDS in buffer at 22 °C; D The 2D 1H DOSY spectra of mt-II with SDS in Buffer at 22 °C
Upon addition of 0.2% SDS to mt-II, we generally observe an increase of the alkyl T1 values to 1.2 to 2.7 s, which is 0.2–0.3 s longer than expected, indicating a significant increase in their τc’s resulting from reduced mobility. This is particular apparent for the lowest frequency CH3 in hydrophobic environments. Hence the presence of SDS seems to lead to spatial constraints on alkyl sidechain motion, which would be expected upon formation of mt-II complexes.
Other sidechain positions such as the β–CH see very little change in T1 when SDS is introduced. Those of Lys and Arg are slightly increased, which stands in stark contrast to the large increase (1.3 to 1.8 s) seen for the sole Trp. The latter could be interpreted as being strongly constrained in the presence of SDS which may implicate it in the binding process. The lack of such an effect on the Lys and Arg T1 seems to counter-indicate direct binding with the sulfonate of SDS.
The CHα environments show a diverse response, where those in α-helices remain essentially the same, and those in random coils increase slightly to 1.90 to 3.30 s. The values for the β-strand signals drop dramatically to 0.9 to 1.7 s (see Figure SI 12). This surprising β-strand result indicates a significant increase in mobility, pointing towards a conformational change. More detailed study would require a complete assignment. The aromatic T1 values ranged from 2.1 to 3.1 s and the NH T1 values ranged from 2.1 to 2.3 s, where the former are essentially unchanged while the latter increase slightly by 0.1 to 0.3 s. The NH values correspond to those of the helix Hα.
The SDS methyl and main chain signals exhibit T1 values that are longer than the alkyl signals of mt-II, and cover a very large range from 2 to 3 s. A study by J Zhao et al. found that the SDS signals below the cmc had T1/T2 ratios between 1.8 and 4 at 300 MHz (Zhao and Fung 1993) suggesting that the correlation times were near or just past the T1 minimum at 0.5 ns which is well past the minimum at 700 MHz. The alkyl T1’s of SDS therefore indicate binding takes place to mt-II; however, a wide range of mobility is suggested for the methyl end. The α-CH2 T1 occurs in two distinct distributions centered at 2 and 4 s, suggesting two types of binding via the sulfonate moiety, where the larger value suggest a high degree of motional constraint.
The DOSY (Fig. 9B, Figure s3A) experiments at 295 K indicate an average effective diffusion constant over all H signals of 7.92*10–7 cm2/s (σ = 2.27*10–7 cm2/s) ranging from 3.46 to 12.37*10–7 cm2/s at the 95% confidence interval. Similarly, the DOSY results for mt-II in the presence of 0.2% SDS (Fig. 9C, Figure SI 13B) over all signals gives 7.95*10–7 cm2/s (σ = 2.13*10–7 cm2/s) ranging from 3.77–12.12*10–7 cm2/s at 95% confidence level. Consider the change in diffusion constants between mt-II in buffer and with SDS for the individual regions: 8.00(0.76)–7.86(0.59)*10–7 cm2/s for the aromatic signals, 8.20(0.80)–7.75(0.42)*10–7 cm2/s for the Hα’s, and 8.10(0.52)—7.50(0.41)*10–7 cm2/s for the alkyls. This trend in diffusion constants reflects a dynamic equilibrium between the monomeric and the hexameric form where the average diffusion constant is skewed to a higher value reflecting a larger contribution from the hexamer.
The diffusion constants for SDS taken from the α-CH2 signal is 12.00*10–7 cm2/s (σ = 2.53*10–7 cm2/s) ranging from 7.30–16.70*10–7 cm2/s, and from the CH3 signal is 6.72*10–7 cm2/s (2.19*10–8 cm2/s) ranging from 6.30 to7.16*10–7 cm2/s. When the concentration of SDS in buffer is above the critical micelle concentration (cmc), the diffusion constants range from 1.4*10–5 to 7*10–6 cm2/s. The diffusion constant of SDS would be much larger below the cmc. As the SDS diffusions constants are much smaller for both signals, there should be no significant amount of free SDS in solution; hence, the vast majority will be in some bound state.
The Hα regions for mt-II in buffer with and without SDS were deconvolved a second time allowing for non-uniform linewidths. The linewidths for the heavier components for each region are given below in Table 4. The T *2 were computed from the linewidths and used as a proxy for T2 to calculate a rough estimate for T1/T2.
Table 4.
Estimations of the relaxation dispersion in the α-helical, β-strand and random coil environments for mt-II in buffer and in the presence of SDS
| mt-II | α-helix | α-strand | Random coil | ||||||
|---|---|---|---|---|---|---|---|---|---|
| Δν1/2 (Hz) | T1 (s) | T 1 /T 2 | Δν1/2 (Hz) | T1 (s) | T 1 /T 2 | Δν1/2 (Hz) | T1 (s) | T 1 /T 2 | |
| Buffer | |||||||||
| Upper | 40 | 2.25 | 282 | 30 | 3.1 | 292 | 35 | 2.75 | 302 |
| Lower | 30 | 1.75 | 165 | 20 | 2.8 | 176 | 25 | 1.75 | 137 |
| SDS | |||||||||
| Upper | 65 | 2.25 | 459 | 30 | 1.7 | 160 | 35 | 3.30 | 363 |
| Lower | 45 | 1.75 | 247 | 20 | 0.9 | 57 | 25 | 1.90 | 149 |
The hydrodynamic radii determined by AUC are 1.82 nm for the monomer and 3.75 nm for the hexamer which give correlation times of 5.5 and 48.3 ns, respectively, at 295 K with a dynamic viscosity of 0.00089 Pa/s. At 700.44 MHz, the rigid body relaxation dispersion values, T1/T2 would be 440 for the monomer and 33,800 for the hexamer. The estimates of the T1/T2 ratios for the α-helix Hα signals upon addition of SDS support the presence of the monomer, but do not reach the higher values required for the hexamer. This does not preclude the formation of the hexamer, but rather illustrates that significant rotational degrees of freedom are retained within the larger complex. Upon addition of SDS the α-helix values increase on the order of 50% reflecting a larger average size, which would correspond to an average over a dynamic equilibrium between the monomer and the hexamer.
Note that without SDS the T1/T2 values for the β-strand and α-helix are relatively close; however, upon addition of SDS the entire range of β-strand values drops significantly, suggesting the possibility of a conformational change taking place involving a β-strand region when forming the larger complexes.
When comparing the NMR spectra of SDS in buffer with that of mt-II in buffer in the presence of 0.2% SDS (see Fig. 8), some notable differences are seen. The terminal methyl group of SDS is a triplet at 0.78 ppm and remains a triplet when increasing to 1.1 ppm. The main chain and β-CH2 signals of free SDS occur at 1.2 and 1.6 ppm, respectively, which become broadened and difficult to discern when bound to mt-II; however, increased signal intensity is seen near 1.1 and 1.5 ppm. In contrast, the α-CH2 signal of free SDS, is a triplet at 3.95 ppm which decreases to 3.65 ppm and appears as a quartet. The chemical shifts of all the free SDS signal correspond to those previously reported below the cmc (Zhao and Fung 1993). The changes seen in the presence of mt-II in the methyl and α-CH2 greatly exceed those experienced for SDS above and below the cmc. These shifts are consistent with binding, especially for α-CH2 whose shielding results from a diminished the diamagnetic shielding anisotropy (Silverstein and RM, Webster FX, Kiemle DJ. 2005) due to the loss of some of the delocalized π electrons from SO3− upon binding.
The quartet splitting pattern for α-CH2 is more difficult to explain. One could conceive a highly strained binding geometry causing the Cα to take on a more planar geometry leading to the CH2 resonances to become inequivalent and causing the 2JHH coupling to increase from a typical value of − 13 Hz tending towards 0 (Silverstein and RM, Webster FX, Kiemle DJ. 2005). In this case a classic AB quartet splitting pattern would result as seen in epoxy rings (Shank et al. 2011; Chaudhary et al. 2011). It is more likely the superposition of two triplets in equal parts differing in chemical shift coincident with the 3JHH. Consider SDS binding 1:1 to mt-II monomer and the SDS-bound monomer being in dynamic equilibrium with an SDS-bound hexamer, then there would be two triplets close in chemical shift. In conclusion, the quartet structure suggests such an equilibrium takes place with an equilibrium constant close to 1, which is further supported by the observed bimodal T1 distribution arising from mobility differences in the two binding modes.
Summary
Non-covalent, reversible oligomerization is a common protein behavior, and any response to mass action needs to be considered whenever oligomerization is observed. Oligomerization as a response to mass action or a change in solution conditions, such as pH, ionic strength, reduction potential, or presence of chaotropes, denaturants, and other molecules present in the buffer, can be readily measured by AUC. AUC reports the sedimentation and diffusion coefficients, as well as the partial concentration of all molecules in the solution. If the partial specific volume is known, the sedimentation and diffusion coefficients can be transformed to molar mass and the degree of globularity. In this study, conditions were found where the presence of SDS causes the formation of a discrete higher oligomeric structure with a hexameric arrangement. This hexamer only forms for a narrow range of protein–SDS molar ratio in the mixture, which is dependent on the total protein concentration. At higher concentrations of SDS we see first very large oligomers form, when the SDS concentration is further increased to values close to, or above the SDS critical micelle concentration, the higher aggregation states disintegrate again into assemblies consistent mostly with dimers and trimers, which was also reported earlier by others (Matsui et al. 2019). Using nuclear magnetic resonance measurement of the hexamer-forming protein-SDS ratios we found that the hexameric protein complexes with SDS with an approximately 1:1 molar ratio. In this range, the predicted partial specific volume and molar mass derived from the hydrodynamic measurements performed with AUC agreed precisely with a hexameric assembly. This oligomeric conformation of mt-II in the presence of a lipid environment suggests the possibility of a membrane pore formation, leading to damage of the cellular integrity, and potentially explain the pathogenic action of mt-II toxicity. Future structural and biophysical work will need to confirm these observations.
Supplementary Material
Acknowledgements
We thank Dr. Sebastien Poget (City University of New York) and Dr. Bruce Bowler (University of Montana) for providing lipids and detergents used in the analytical ultracentrifugation experiments. This work was supported by the Canada 150 Research Chairs program (C150-2017-00015, BD), the Canada Foundation for Innovation (CFI-37589, BD), the National Institutes of Health (1R01GM120600, BD) and the Canadian Natural Science and Engineering Research Council (DG-RGPIN-2019-05637, BD). UltraScan supercomputer calculations were supported through NSF/XSEDE grant TG-MCB070039N (BD), and University of Texas grant TG457201 (BD). The Canadian Natural Science and Engineering Research Council supports AH through a scholarship grant.
Footnotes
Supplementary Information The online version contains supplementary material available at https://doi.org/10.1007/s00249-023-01658-9.
Data availability
The UltraScan software used to analyze the AUC data is open source and freely available from the Github repository (https://github.com/ehb54/ultrascan3). The AUC data are available in openAUC format upon request from the authors, and is stored in the UltraScan LIMS server at the Canadian Center for Hydrodynamics.
References
- AlResaini S, Malik A, Alonazi M, Alhomida A, Khan JM (2023) SDS induces amorphous, amyloid-fibril, and alpha-helical structures in the myoglobin in a concentration-dependent manner. Int J Biol Macromol 231:123237. 10.1016/j.ijbiomac.2023.123237 [DOI] [PubMed] [Google Scholar]
- Ando S, Harris RK, Hazendonk P, Wormald PW (2005) Selective NMR pulse sequences for the study of solid H-containing fluoro-polymers. Macromol Rapid Commun 26:345–356 [Google Scholar]
- Arni RK, Gutiérrez JM (1993) Crystallization and preliminary diffraction data of two myotoxins isolated from the venoms of Bothrops asper (Terciopelo) and Bothrops nummifer (jumping viper). Toxicon 31(8):1061–1064. 10.1016/0041-0101(93)90264-j. [DOI] [PubMed] [Google Scholar]
- Arni RK, Ward RJ, Gutiérrez JM, Tulinsky A (1995) Structure of a calcium-independent phospholipase-like myotoxic protein from Bothrops asper venom. Acta Cryst D 51:311–317 [DOI] [PubMed] [Google Scholar]
- Avhelj F, Kocjan D, Baldwin RL (2004) Protein chemical shifts from α-helices and β-sheets depends on solvent exposure. PNAS 101:17394–17397 [DOI] [PMC free article] [PubMed] [Google Scholar]
- Brookes E, Demeler B (2008) Parallel computational techniques for the analysis of sedimentation velocity experiments in UltraScan. Colloid Polym Sci 286:138–148 [Google Scholar]
- Brookes E, Rocco M (2018) Recent advances in the UltraScan SOlution MOdeller (US-SOMO) hydrodynamic and small-angle scattering data analysis and simulation suite. Eur Biophys J 47:855–864. 10.1007/s00249-018-1296-0 [DOI] [PubMed] [Google Scholar]
- Brookes EH, Cao W, Demeler B (2010a) A two-dimensional spectrum analysis for sedimentation velocity experiments of mixtures with heterogeneity in molecular weight and shape. Eur Biophys J 39:405–414 [DOI] [PubMed] [Google Scholar]
- Brookes E, Demeler B, Rocco M (2010b) Developments in the US-SOMO bead modeling suite: new features in the direct residue-to-bead method, improved grid routines, and influence of accessible surface area screening. Macromol Biosci 10(7):746–753. 10.1002/mabi.200900474. [DOI] [PubMed] [Google Scholar]
- Brookes EH and Demeler B (2007) Parsimonious regularization using genetic algorithms applied to the analysis of analytical ultracentrifugation experiments. GECCO Proceedings ACM. 978-1-59593-697-4/07/0007 [Google Scholar]
- Brookes EH, Boppana RV, Demeler B. 2006. Computing large sparse multivariate optimization problems with an application in biophysics. Supercomputing ‘06 ACM. 0-7695-2700-0/06 [Google Scholar]
- Cavanagh J, Fairbrother WF, Palmer AG III, Rance M, Skelton NS (2007) Protein NMR spectroscopy, 2nd edn. Academic Press, Amsterdam, NL [Google Scholar]
- Chaudhary P, Shank RA, Montina TA, Goettel JT, Foroud NA, Hazendonk P, Eudes F (2011) Hydrogen-bonding interactions in T-2 toxin studied using solution and solid-state NMR. Toxins 3:1310. [DOI] [PMC free article] [PubMed] [Google Scholar]
- Cifuentes A, Bernal JL, Diez-Masa JC (1997) Determination of critical micelle concentration values using capillary electrophoresis instrumentation. Anal Chem 69:4271–4274 [Google Scholar]
- Demeler B (2010) Methods for the design and analysis of sedimentation velocity and sedimentation equilibrium experiments with proteins. Curr Protoc Prot Sci. 10.1002/0471140864.ps0713s60 [DOI] [PMC free article] [PubMed] [Google Scholar]
- Demeler B, Brookes EH (2008) Monte Carlo analysis of sedimentation experiments. Colloid Polym Sci 286:129–137 [Google Scholar]
- Demeler B, Gorbet G (2016) Analytical ultracentrifugation data analysis with ultraScan-III. In: Uchiyama S, Stafford WF, Laue T (eds) Analytical ultracentrifugation: instrumentation, software, and applications. Springer, Berlin, pp 119–143 [Google Scholar]
- Demeler B, van Holde KE (2004) Sedimentation velocity analysis of highly heterogeneous systems. Anal Biochem 335(2):279–288 [DOI] [PubMed] [Google Scholar]
- Demeler B, Brookes EH, Gorbet GE, Savelyev A, Zollars D, Dubbs B. 2022. UltraScan data analysis software for analytical ultracentrifugation experiments and hydrodynamic modelling. https://github.com/ehb54/ultrascan3
- Fernandes CA, Borges RJ, Lomonte B, Fontes MR (2014) A structure-based proposal for a comprehensive myotoxic mechanism of phospholipase A 2-like proteins from viperid snake venoms. Biochim Biophys Acta 1844:2265–2276 [DOI] [PubMed] [Google Scholar]
- Francis B, Gutierrez JM, Lomonte B, Kaiser II (1991) myotoxin II from Bothrops asper (Terciopelo) venom is a lysine-49 phospholipase A2. Arch Biochem Biophys 284(2):352–359. 10.1016/0003-9861(91)90307-5. [DOI] [PubMed] [Google Scholar]
- Hazendonk P, Harris RK, Ando S, Avalle P (2003) The DIVAM sequence: selective excitation of signals from rigid domains in a fluoropolymer. J Magn Reson 162:206–216 [DOI] [PubMed] [Google Scholar]
- Hwang TL, Shaka AJ (1995) Water suppression that works excitation sculpting using arbitrary wave-forms and pulsed-field gradients. J Magn Reson Series A 112:275–279 [Google Scholar]
- Ismael MA, Khan JM, Malik A, Alsenaidy MA, Hidayathulla S, Khan RH, Sen P, Irfan M, Alsenaidy AM (2018) Unraveling the molecular mechanism of the effects of sodium dodecyl sulfate, salts, and sugars on amyloid fibril formation in camel IgG. Colloids Surf B Biointerfaces 1(170):430–437. 10.1016/j.colsurfb.2018.06.035 [DOI] [PubMed] [Google Scholar]
- Khan JM, Sharma P, Arora K, Kishor N, Kaila P, Guptasarma P (2016) The Achilles’ heel of “ultrastable” hyperthermophile proteins: submillimolar concentrations of SDS stimulate rapid conformational change, aggregation, and amyloid formation in proteins carrying overall positive charge. Biochemistry 55(28):3920–3936. 10.1021/acs.biochem.5b01343. (Epub 2016 Jul 6) [DOI] [PubMed] [Google Scholar]
- Khan JM, Malik A, Ahmed MZ, Ahmed A (2022) SDS modulates amyloid fibril formation and conformational change in succinyl-ConA at low pH. Spectrochim Acta A Mol Biomol Spectrosc 267(Pt 1):120494. 10.1016/j.saa.2021.120494. (Epub 2021 Oct 13) [DOI] [PubMed] [Google Scholar]
- Lomonte B (2023) Lys49 myotoxins, secreted phospholipase A2-like proteins of viperid venoms: A comprehensive review. Toxicon 224:107024. 10.1016/j.toxicon.2023.107024 [DOI] [PubMed] [Google Scholar]
- Lomonte B, Fernández J (2022) Solving the microheterogeneity of Bothrops asper myotoxin-II by high-resolution mass spectrometry: Insights into C-terminal region variability in Lys49-phospholipase A2 homologs. Toxicon 210:123–131. 10.1016/j.toxicon.2022.02.024. (Epub 2022) [DOI] [PubMed] [Google Scholar]
- Lomonte B, Gutiérrez JM (1989) A new muscle damaging toxin, myotoxin II, from the venom of the snake Bothrops asper (terciopelo). Toxicon 27:725–733 [DOI] [PubMed] [Google Scholar]
- Lomonte B, Rangel J (2012) Snake venom Lys49 myotoxins: from phospholipases A2 to non-enzymatic membrane disruptors. Toxicon 60:520–530. 10.1016/j.toxicon.2012.02.007 [DOI] [PubMed] [Google Scholar]
- Lomonte B, Moreno E, Tarkowski A, Hanson LÅ, Maccarana M (1994) Neutralizing interaction between heparins and myotoxin II, a Lys-49 phospholipase A2 from Bothrops asper snake venom. Identification of a heparin-binding and cytolytic toxin region by the use of synthetic peptides and molecular modeling. J Biol Chem 269:29867–29873 [PubMed] [Google Scholar]
- Matsui T, Kamata S, Ishii K, Maruno T, Ghanem N, Uchiyama S, Kato K, Suzuki A, Oda-Ueda N, Ogawa T, Tanaka Y (2019) SDS-induced oligomerization of Lys49-phospholipase A2 from snake venom. Sci Rep 9(1):2330. 10.1038/s41598-019-38861-8. [DOI] [PMC free article] [PubMed] [Google Scholar]
- Mora-Obando D, Díaz C, Angulo Y, Gutiérrez JM, Lomonte B (2014a) Role of enzymatic activity in muscle damage and cytotoxicity induced by Bothrops asper Asp49 phospholipase A2 myotoxins: are there additional effector mechanisms involved? Peer J 2:e569. 10.7717/peerj.569 [DOI] [PMC free article] [PubMed] [Google Scholar]
- Mukerjee P (1962) The partial specific volume and the density of micelles of association colloidal electrolytes. J Phys Chem 66(9):1733–1735 [Google Scholar]
- Murakami MT, Arruda EZ, Melo PA, Martinez AB, Calil-Elias S, Tomaz MA, Lomonte B, Gutiérrez JM, Arni RK (2005) Inhibition of myotoxic activity of Bothrops asper myotoxin II by the anti-trypanosomal drug surarnin. J Mol Biol 350:416–426 [DOI] [PubMed] [Google Scholar]
- Parker W, Song PS (1992) Protein structures in SDS micelle-protein complexes. Biophys J 61(5):1435–1439. 10.1016/S0006-3495(92)81949-5 [DOI] [PMC free article] [PubMed] [Google Scholar]
- Rule GS, Hitchens TK (2006) Fundamentals of protein NMR spectroscopy. Springer, Dordrecht, NL [Google Scholar]
- Schmidt-Rohr K, Spies HW (1996) Multinuclear solid-state NMR and polymers. Academic Press, London [Google Scholar]
- Shank RA, Foroud NA, Hazendonk P, Eudes F, Blackwell BA (2011) Current and future experimental strategies for structural analysis of trichothecene mycotoxins—A prospectus. Toxins 3:1518. [DOI] [PMC free article] [PubMed] [Google Scholar]
- Silverstein RM, Webster FX, Kiemle DJ (2005) Spectrometric identification of organic compounds, 7th edn. Wiley, Hoboken NJ [Google Scholar]
- Vold RL, Waugh JS, Klein MP, Phelps DE (1968) Measurement of spin relaxation in complex systems. J Chem Phys 48:3831–3832 [Google Scholar]
- Wu D, Chen A, Johnson CS Jr (1995) Flow imaging by means of 1D pulsed-field-gradient NMR with application to electroosmotic flow. J Magn Reson A 115:123 [Google Scholar]
- Zhao J, Fung BM (1993) NMR study of the transformation of sodium dodecyl sulfate micelles. Langmuir 9:1228–1231 [Google Scholar]
Associated Data
This section collects any data citations, data availability statements, or supplementary materials included in this article.
Supplementary Materials
Data Availability Statement
The UltraScan software used to analyze the AUC data is open source and freely available from the Github repository (https://github.com/ehb54/ultrascan3). The AUC data are available in openAUC format upon request from the authors, and is stored in the UltraScan LIMS server at the Canadian Center for Hydrodynamics.


