Abstract
Field-of-view (FOV) tissue truncation beyond the lungs is common in routine lung screening computed tomography (CT). This poses limitations for opportunistic CT-based body composition (BC) assessment as key anatomical structures are missing. Traditionally, extending the FOV of CT is considered as a CT reconstruction problem using limited data. However, this approach relies on the projection domain data which might not be available in application. In this work, we formulate the problem from the semantic image extension perspective which only requires image data as inputs. The proposed two-stage method identifies a new FOV border based on the estimated extent of the complete body and imputes missing tissues in the truncated region. The training samples are simulated using CT slices with complete body in FOV, making the model development self-supervised. We evaluate the validity of the proposed method in automatic BC assessment using lung screening CT with limited FOV. The proposed method effectively restores the missing tissues and reduces BC assessment error introduced by FOV tissue truncation. In the BC assessment for large-scale lung screening CT datasets, this correction improves both the intra-subject consistency and the correlation with anthropometric approximations. The developed method is available at https://github.com/MASILab/S-EFOV.
Keywords: Field-of-view truncation, Computed tomography, Image extension, Body composition
1. Introduction
Computed tomography (CT) assessment of body composition (BC) has the advantage of clear separation of adipose tissue, muscle, and organs (Thibault et al., 2012). CT-based approaches are particularly beneficial as CT examinations are often already available as a common imaging study conducted for various clinical indications, allowing for “opportunistic” assessment of BC which requires no additional examination procedure (Pickhardt et al., 2021; Pishgar et al., 2021; Pickhardt, 2022). Chest low dose computed tomography (LDCT) is the standardized routine practice in lung cancer screening due to its high sensitivity for nodule detection and malignancy risk evaluation despite the lowered radiation exposure, making it an attractive modality for opportunistic BC analysis for the lung cancer screening population (Krist et al., 2021). Prior studies have demonstrated the feasibility of using cross-sectional areas measured on single or multiple cross-sectional slides in abdominal or thoracic CT as surrogate markers for whole body compositions (Shen et al., 2004; Mathur et al., 2020; Troschel et al., 2020; Best et al., 2022; Bridge et al., 2022). However, the labor-intensive nature of manual (or semi-automatic) annotation is a major roadblock for both population scale evaluation and routine clinical reporting. For this reason, artificial intelligence-based approaches have been introduced for fully automatic BC assessment in several recent studies (Bridge et al., 2018; Lenchik et al., 2021; Magudia et al., 2021; Weston et al., 2019; Xu et al., 2022).
As BC assessment is not among the primary clinical indications for routine lung cancer screening CT examinations, certain imaging limitations may exist. For instance, tissue truncation caused by limited field-of-view (FOV) is a well-known issue for BC assessment using thoracic CT (Troschel et al., 2020). In lung cancer screening, the imaging acquisition protocol may even intentionally limit the FOV to increase the imaging quality in the lung region (Gierada et al., 2009; Kazerooni et al., 2014; American College of Radiology, 2022). In a prior study (Xu et al., 2022), the authors introduced a morphology based cross-sectional FOV truncation severity evaluation index and revealed that up to 96.1% of scans in the CT arm of National Lung Screening Trial (NLST) were associated with significant tissue truncation caused by FOV limitation. Even though we observed a lower rate (69.4%) of severe FOV limitation in a recently acquired in-house lung screening program, the issue was still frequent enough to preclude consistent automatic BC assessment application. Fig 1 shows typical FOV limitation-caused tissue truncation in lung screening LDCT and the introduced shifts in BC assessment. Several studies have opted for selective assessment of regions fully visible in FOV, e.g., using pectoralis muscle or paraspinous muscle as surrogate for muscle measurement (Bak et al., 2019; Gazourian et al., 2020; Lenchik et al., 2021; Pishgar et al., 2021). However, evidence suggests that the regional evaluation can insufficiently represent whole-body assessment (Kim et al., 2016; Troschel et al., 2020). In additional, significant portions of available BC information in the CT images could be ignored following this approach.
Fig. 1.
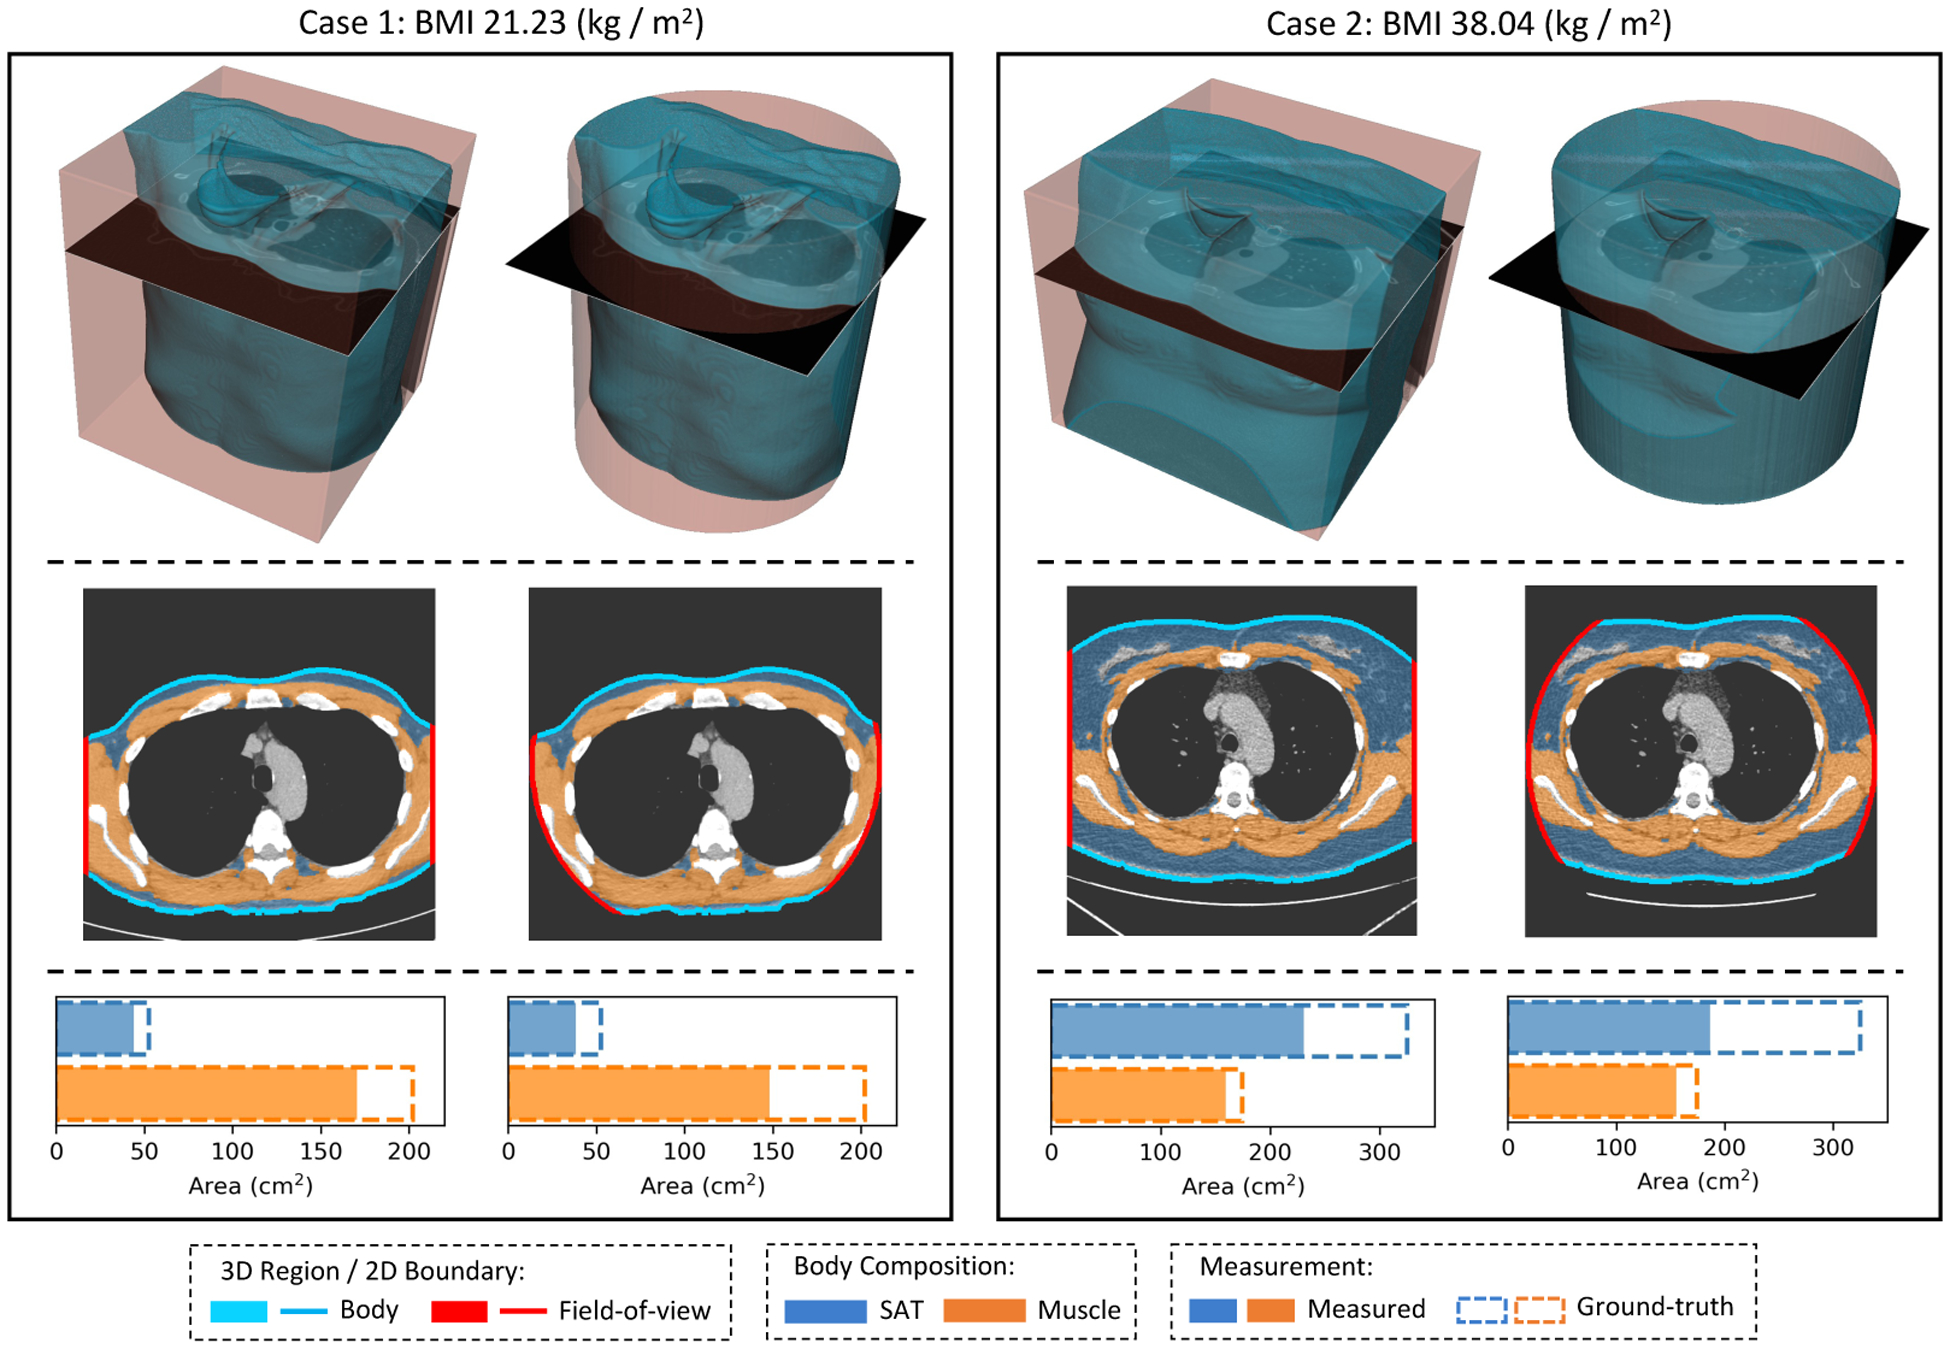
Typical FOV truncation in lung screening CT and its impact on body composition assessment. The presented examples are simulated using two lung screening CT scans with complete body at least at the level of the fifth thoracic vertebral body. As the same truncation pattern replicates across all cross-sectional slices for the same scan, the cubic or tube-like shape of the field-of-view region and the resulting artificial body surface can be clearly identified in 3D view (top row). The cross-sectional truncation effect is detailed by the blue segments and red segments indicating the true boundary of the human body and the artificial boundary of FOV respectively (second row). The resulting segmentation masks for SAT and muscle are overlaid with highlighted cross-sectional slices (second row). The offsets between assessment results based on truncated slices and complete slices are presented in the bar plots (third row). BMI=Body Mass Index. SAT=Subcutaneous Adipose Tissue.
Extending the FOV to recover the missing tissues provides an alternative solution for BC assessment with limited FOV CT. Traditionally, the FOV extension of CT image was considered as an image reconstruction problem with incomplete projection data (Ogawa et al., 1984). When the object exceeds the effective data collection region, also known as the scan FOV (SFOV), of the CT scanner, the object will be truncated in the reconstructed CT image, and significant increase in image intensity near the FOV borders will appear at the truncated locations, which is commonly referred as the “cupping” artifact (Ruchala et al., 2002). Several earlier works employed heuristic extrapolation methods to extend the data in projection domain (Ohnesorge et al., 2000; Hsieh et al., 2004; Sourbelle et al., 2005). Recently, deep learning-based approaches have been proposed to further improve the truncation correction, operating on either the projection domain (Ketola et al., 2021), or a combination of image and projection domains (Fournié et al., 2019; Huang et al., 2021). However, the projection data that are required by these methods might not be available in many application scenarios. Typically, in retrospective studies where the data acquisition is already completed, only the reconstructed data in the image domain are stored and transferred. In addition, the FOV truncation in lung screening LDCT is mainly caused by the reconstruction FOV (RFOV) and display FOV (DFOV), or a combination of both, where the image intensity near the FOV borders can still be faithfully reconstructed from the projection data collected in SFOV. This is mainly a result of the intended restriction of the output CT FOV where the adopted SFOVs in practice are usually the same as those used in conventional full-sized chest CT, e.g., 500 mm in diameter (Gierada et al., 2009; Troschel et al., 2020). As a result, the cupping artifacts are rare in lung screening LDCT. This simplifies the FOV extension for these CT images as such it can be solved as an image completion problem.
Image completion refers to the process of filling-in target regions with contextual plausible contents based on the semantic information provided by the remaining of the image (Iizuka et al., 2017). Convolutional Neural Network (CNN) architectures are widely used in modern image completion models with potential to generate realistic imaging contents (Iizuka et al., 2017; Isola et al., 2017; Li et al., 2020; Liu et al., 2018; Nazeri et al., 2019; Pathak et al., 2016; Yu et al., 2019). The models are typically developed in a self-supervised manner, where the input and ground-truth data pairs are generated by applying centrally located square (Isola et al., 2017; Pathak et al., 2016), or randomly generated (Isola et al., 2017; Li et al., 2020; Liu et al., 2018) corruption patterns on raw images. In the medical imaging domain, the technique has shown its capability of generating anatomically consistent structures, and has been used, for example, to remove lesions or unwanted markers to enhance downstream analysis including registration, segmentation, or classification (Armanious et al., 2020; Kang et al., 2021; Shen et al., 2021). Compared to the inpainting tasks, the extension of the original image boundary, or outpainting, poses additional challenges as less information are provided as boundary conditions. Though several studies have demonstrated promising results in extending the image boundary of natural images (Krishnan et al., 2019; Wang et al., 2019), it is still an under-explored task to achieve anatomically consistent FOV extension for medical images.
In this work, we sought to solve the CT FOV extension problem in the image domain and formulated it as a semantic image extension task. A two-stage procedure was designed to achieve fully automatic slice-wise FOV extension of lung screening LDCT. In the first stage, the bounding box covering the entire body region was predicted, which provided an estimation for the appropriate extension ratio of the raw FOV. In the second stage, the truncated anatomical structures in the region outside of initial FOV region were automatically generated. To provide training samples, we generated synthetic FOV truncation cases using CT slices without tissue truncation. Unlike the randomly generated corruption patterns commonly used in current literature, this simulation was based on domain knowledge of FOV determination during the CT acquisition procedure. To evaluate the validity of the developed method in real application, we employed a prior developed automatic BC assessment pipeline for lung cancer screening LDCT (Xu et al., 2022). We evaluated the proposed semantic FOV extension method on both synthetic cases and real-world lung cancer screening LDCT with FOV truncation. The evaluation was based on human perceptual studies conducted with trained clinical experts and assessments of the methods’ capability in correcting the BC measurement shifts caused by FOV truncation. We evaluated the effectiveness of three different general-purpose image completion methods under the proposed framework. In addition, we characterized the generalizability and limitations of the proposed method on chest CT scans acquired with a broader spectrum of clinical indications beyond lung cancer screening.
2. Method
To extend the FOV of an image, there are two questions need to be answered: (1) how to determine the new image border; and (2) how to determine the new contents in the extended region. As opposed to the border extension task for natural images, where the expected extension space may be arbitrary and usually need to be specified manually (Wang et al., 2019), the actual anatomical boundary of the human body can be roughly estimated even with partially visible anatomy. With this consideration, we designed a two-stage framework for semantic FOV extension by (1) extending the FOV border based on the estimated extent of the complete body; then (2) imputing missing tissue in the truncated region of the boundary extended images. Fig 2 shows a combined overview of the method, including the workflow of each stage and its integration with the BC assessment pipeline.
Fig. 2.
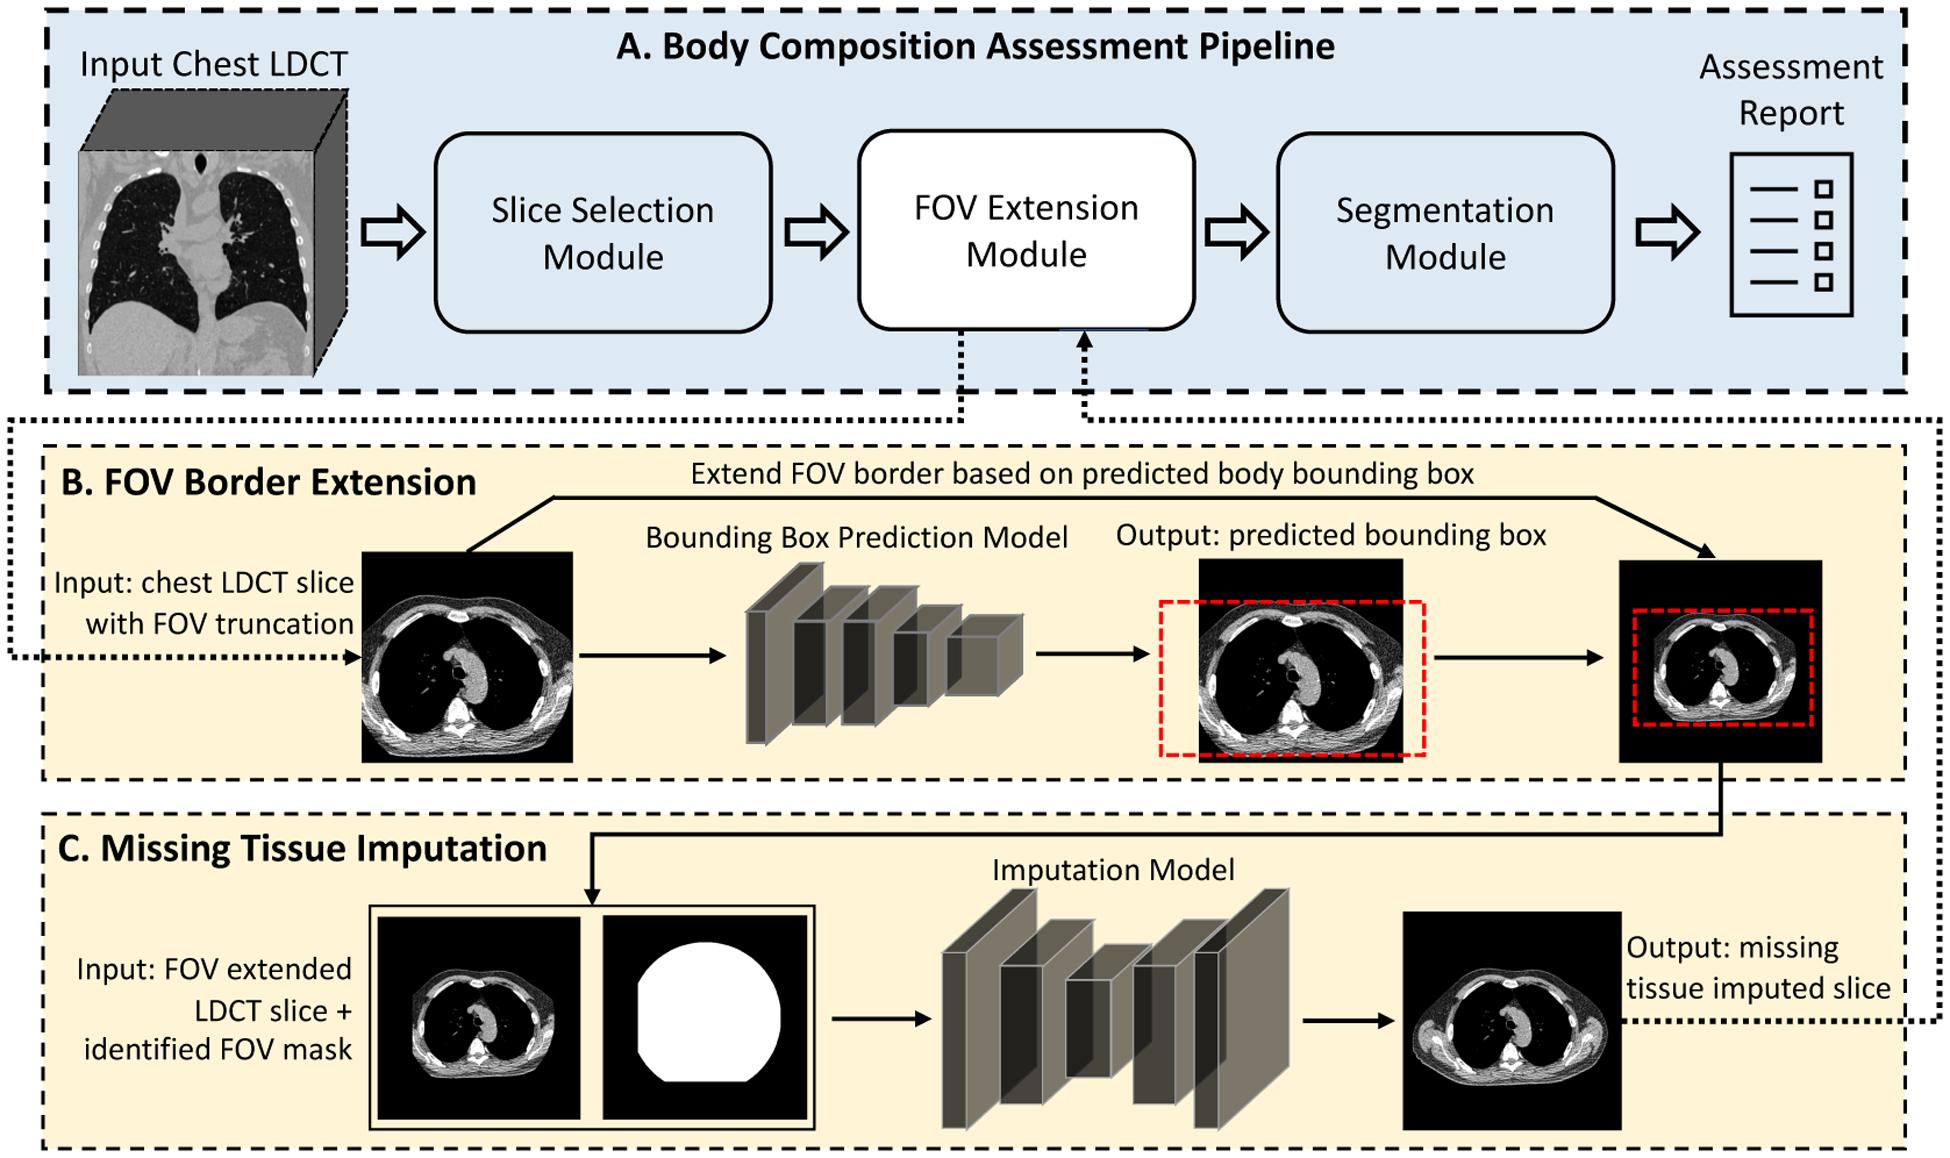
The scheme of the proposed two-stage FOV extension method and its integration with body composition assessment pipeline. (A) The body composition assessment pipeline with the FOV extension module integrated as a preprocessing step. (B) Given a CT slice with FOV truncation as input, the stage-1 model extends the display FOV based on the predicted bounding box of the complete body. (C) The stage-2 model imputes missing tissues in the truncated region. LDCT=Low-dose CT. FOV=Field-of-view.
2.1. Two-stage Framework for Semantic FOV Extension
2.1.1. FOV Border Extension
We formulated the task to identify the extent of the complete body as a regression problem to estimate the axis-aligned minimum bounding box (denoted “bounding box”) of the untruncated body region. The model took a slice with limited FOV-caused body tissue truncation as input and outputted an estimation for bounding box coordinates of the complete body. For the training data, we used the FOV truncation slice and ground-truth body bounding box data pairs simulated using the slices with the complete body in FOV (detailed in Section 2.2). To guide the model training, we employed the generalized intersection over union (GIoU) loss introduced in Rezatofighi et al. (2019). The GIoU between two arbitrary convex shape and is defined as
| (1) |
where is the smallest enclosing convex object of . represent the number of elements in a set. The first term, which follows the definition of conventional intersection over union (IoU), assesses the degree of overlapping, and the second term evaluates the normalized empty space between the two regions.
This combined representation provides an approximation for IoU, while overcoming the difficulties of IoU as an objective for model training. With demoting the data pair of input CT slice and ground-truth body bounding box coordinates, we defined our GIoU objective as
| (2) |
where represented the region defined by predicted or ground-truth bounding-box coordinates. To further accelerate and stabilize the training process, we also included the conventional mean squared error (MSE) between the predicted and ground-truth bounding box coordinates as the second objective:
| (3) |
The final loss function was given by a combination of the MSE term and the GIoU term, which was in the form of
| (4) |
Fig 3 (B) shows an overview of training of this module, and Fig 2 (B) shows the integration of the developed module with the overall workflow.
Fig. 3.
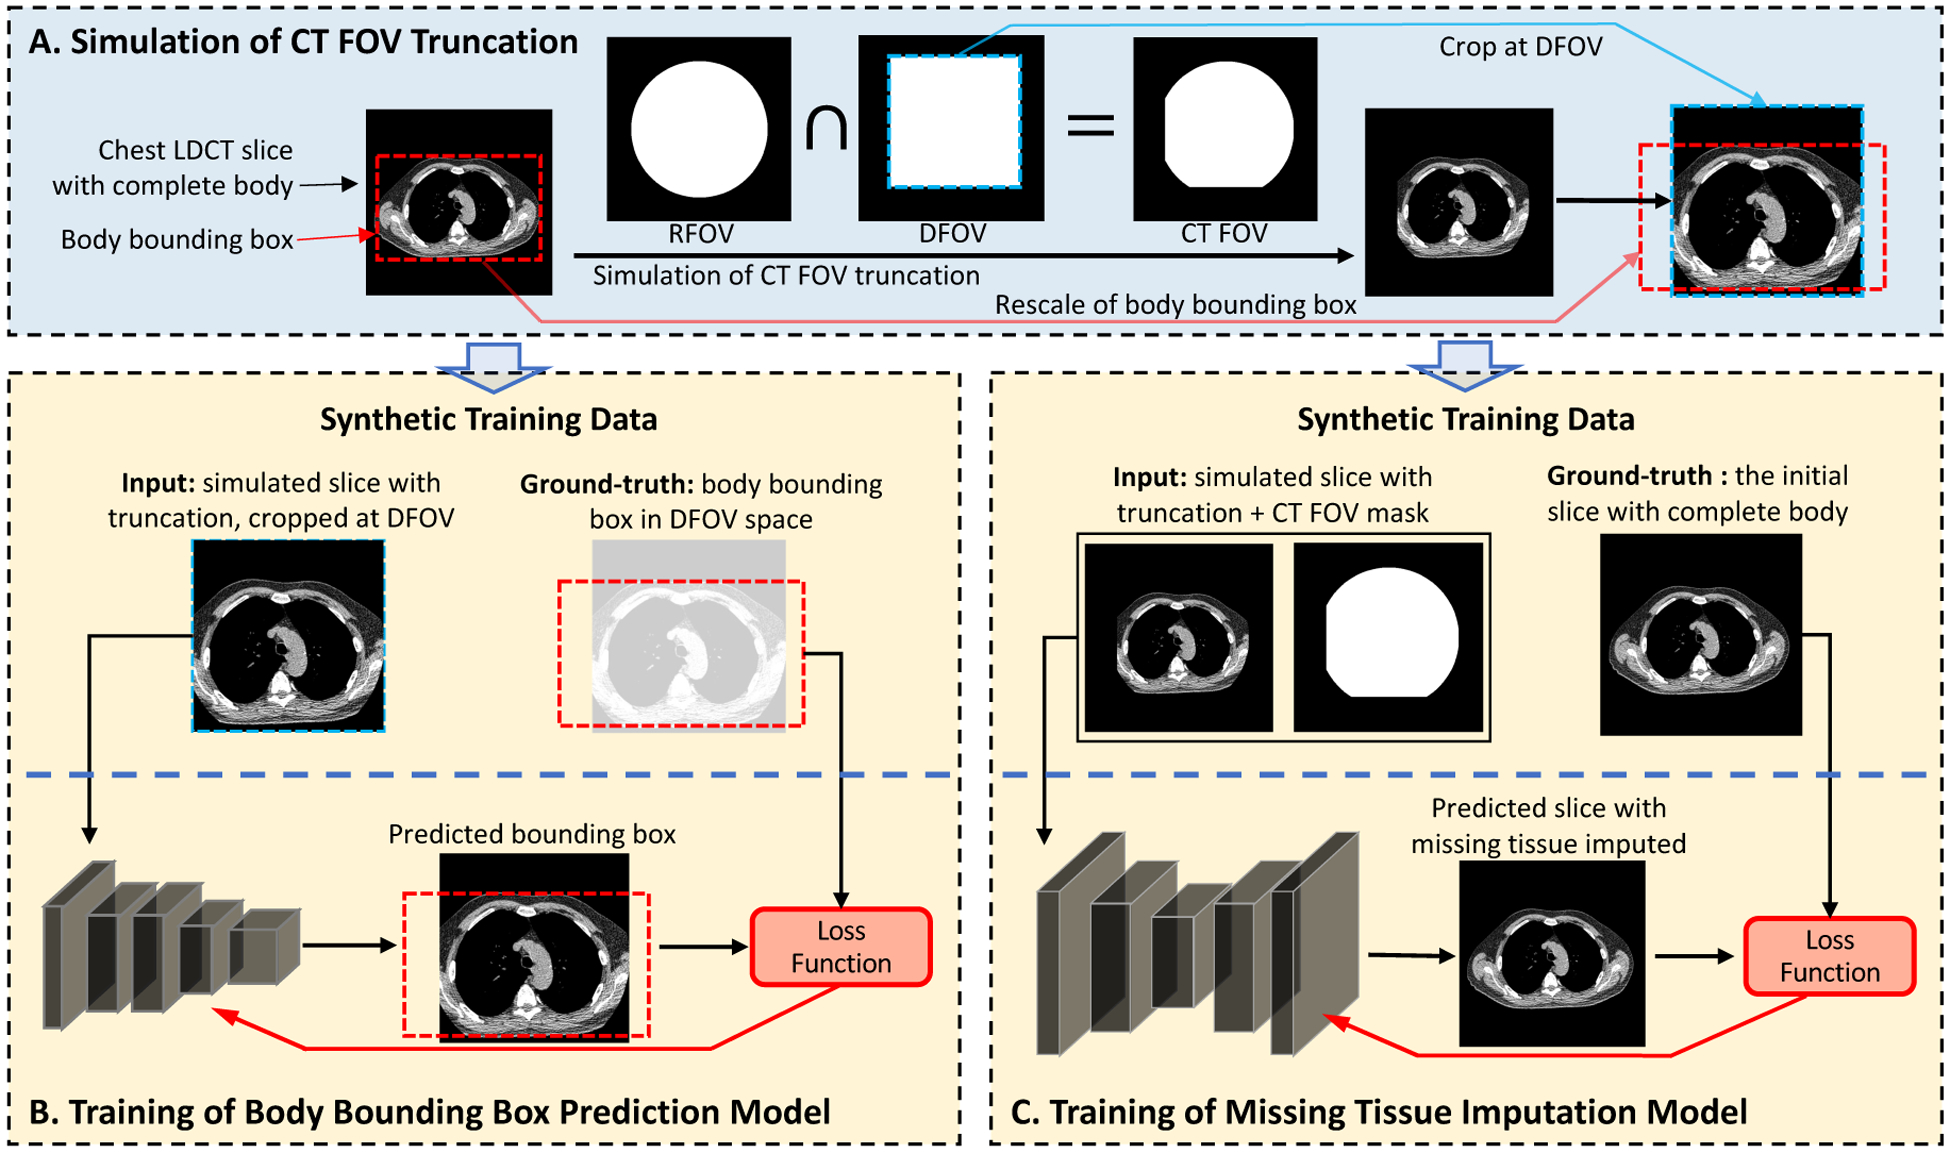
The simulation of synthetic training data and the self-supervised model training of the two proposed stages. (A) The training samples are generated using cross-sectional slices with complete body, by applying synthetic FOV as the intersection of RFOV and DFOV simulating the FOV determination procedure during CT acquisition. (B) The input data for the stage-1 model are the simulated slices with tissue truncation which are cropped at the DFOV. The bounding box of the complete body is pre-determined, shifted, and rescaled in corresponding with the cropping operation to serve as the ground-truth for stage-1 model development. The model is developed using ResNet-18 as the backbone, and a loss function consisting of a MSE term and a Generalized IoU term. (C) The input data for the stage-2 model are the simulated slices and FOV patterns in the original image space. The initial slices with complete body in FOV are used as the ground-truth. We evaluate three published general-purpose image completion methods detailed in Appendix A. FOV mask input may or may not be required depending on the image completion method. LDCT=Low-dose CT. FOV=Field-of-view. DFOV=Display FOV. RFOV=Reconstruction FOV.
With the predicted bounding box of the complete body, the FOV border of the raw image was extended to fully cover the estimated extent of the complete body. Since in most application cases the body region locates approximately at the center of FOV, we simplified the FOV border extension to symmetric padding which was controlled by an estimated extension ratio
| (5) |
where was the extension ratio using which the extended FOV can exactly cover the predicted bounding box. As prediction errors for the body extent bounding box always exist, alone may fail to cover the complete actual body extent for a significant proportion of cases in application. For this reason, we introduced the empirically determined multiplier such that the extended FOV can successfully cover the body extent for most cases. Based on the estimated extension ratio , the input image was symmetric padded, then resized to the dimension of input image. The physical dimensions of image pixels were scaled by factor correspondingly.
2.1.2. Image Completion
The target of the second-stage model was to reconstruct the missing tissues outside of FOV region. The model took the CT slice with extended image border and optionally the FOV region mask as inputs, and outputted a predicted image with missing tissue imputed. In the training phase, the FOV region, input corrupted slice, and ground-truth uncorrupted version were simulated using CT slice with complete body in FOV (detailed in Section 2.2). During the inference phase, the output image generated by the first stage was directly forwarded to the second-stage model. The FOV region can be given by the initial FOV mask in the original image space with symmetric padding and resizing based on the same extension ratio defined in Eq (5). Fig 3 (C) shows an overview of the training of this module. Fig 2 (C) demonstrated the integration of this module with the overall workflow.
In our study, we evaluated three general-purpose solutions for the image completion task: pix2pix (Isola et al., 2017), PConv-UNet (Liu et al., 2018), and RFR-Net (Li et al., 2020). The detailed evaluations of these methods are given in Appendix A. As RFR-Net outperformed the other two methods, we used RFR-Net as the default method for the second stage in the rest of this study.
2.2. Synthetic Data Generation
In image completion model development, it is a common practice to synthesize the corrupted image using uncorrupted raw images by applying a randomly generated free-form mask. The models are trained to predict the corresponding uncorrupted version given the corrupted version as input (Li et al., 2020; Liu et al., 2018). This makes the model development self-supervised and easy to scale on a large dataset. Inspired by this observation, we designed a synthetic data generation procedure for the development and evaluation of the proposed two-stage approach for FOV extension, which consisted of the following steps: (1) identification of slices with the complete body in FOV; (2) simulation of FOV truncation patterns; and (3) paired data generation. Herein, we assume the regions representing body and FOV in the CT images are readily known. The solutions we adopted in this study to automatically generate required regional masks are detailed in Appendix B. An overview of the synthetic data generation and data workflow for model development is demonstrated in Fig 3.
2.2.1. FOV Truncation Severity Quantification
To identify the FOV limitation-caused tissue truncation and assess the truncation severity, we adopt the Tissue Cropping Index (TCI) which was initially introduced in Xu et al. (2022) TCI evaluated the truncation severity for the given CT slice by the proportion of artificial body boundary caused by FOV truncation in all detected body boundaries. Given the body region mask and FOV region mask , TCI was defined as
| (6) |
where represented the set of boundary pixels of a 2D binary mask. The TCI value ranged from zero to one, with a non-zero value indicating the existence of body tissue truncation and a larger value indicating more severe tissue truncation. In our synthetic data generation, we used a TCI value of zero to filter out slices with a complete body in FOV. At the scan level, we defined the scan TCI as the averaged slice-wise TCI across T5, T8, and T10 levels. The TCI value can give an approximated stratification for both slice-wise and scan-wise truncation severity. We empirically setup a four-level system: (1) trace level, (2) mild level, ; (3) moderate level, ; and (4) severe level, TCI > 0.5.
2.2.2. FOV Truncation Pattern Simulation
The following three spatial region concepts are closely relevant to the determination of CT FOV:
Scan Field-of-view (SFOV). The SFOV is the region from which the projection data are collected during CT acquisition (Seeram, 2015). The size of SFOV is determined by the scanner limitation and can be adjusted based on specific application. In lung cancer screening, this parameter is usually set to 500 mm. The SFOV determines the maximum spatial region that the image can be reconstructed.
Reconstruction Field-of-view (RFOV). The RFOV, or reconstruction circle, is the circular region in which the image data is reconstructed from the projection domain. RFOV can be equal or smaller than SFOV. In general, reducing RFOV can improve the quality of the reconstructed image (Salimova et al., 2022), and is a commonly used strategy in lung cancer screening to improve the image quality in the lung regions (Gierada et al., 2009; Kazerooni et al., 2014; American College of Radiology, 2022). The role of RFOV in the determination of CT FOV is visually demonstrated in Fig 4 and Fig 5 (A, the yellow region).
Display Field-of-view (DFOV). After the reconstruction, a squared region needs to be specified, to which the data will be cropped or padded to form the final output image. We follow the same notation as in Chapter 3 of Seeram (2015), and term this squared region as display field-of-view (DFOV). The DFOV is selected to partially or entirely cover the RFOV, which provides a way to further adjust the anatomical region to be displayed. The role of DFOV in the determination of CT FOV is visually demonstrated in Fig 4 and Fig 5 (A, the blue region).
Fig. 4.
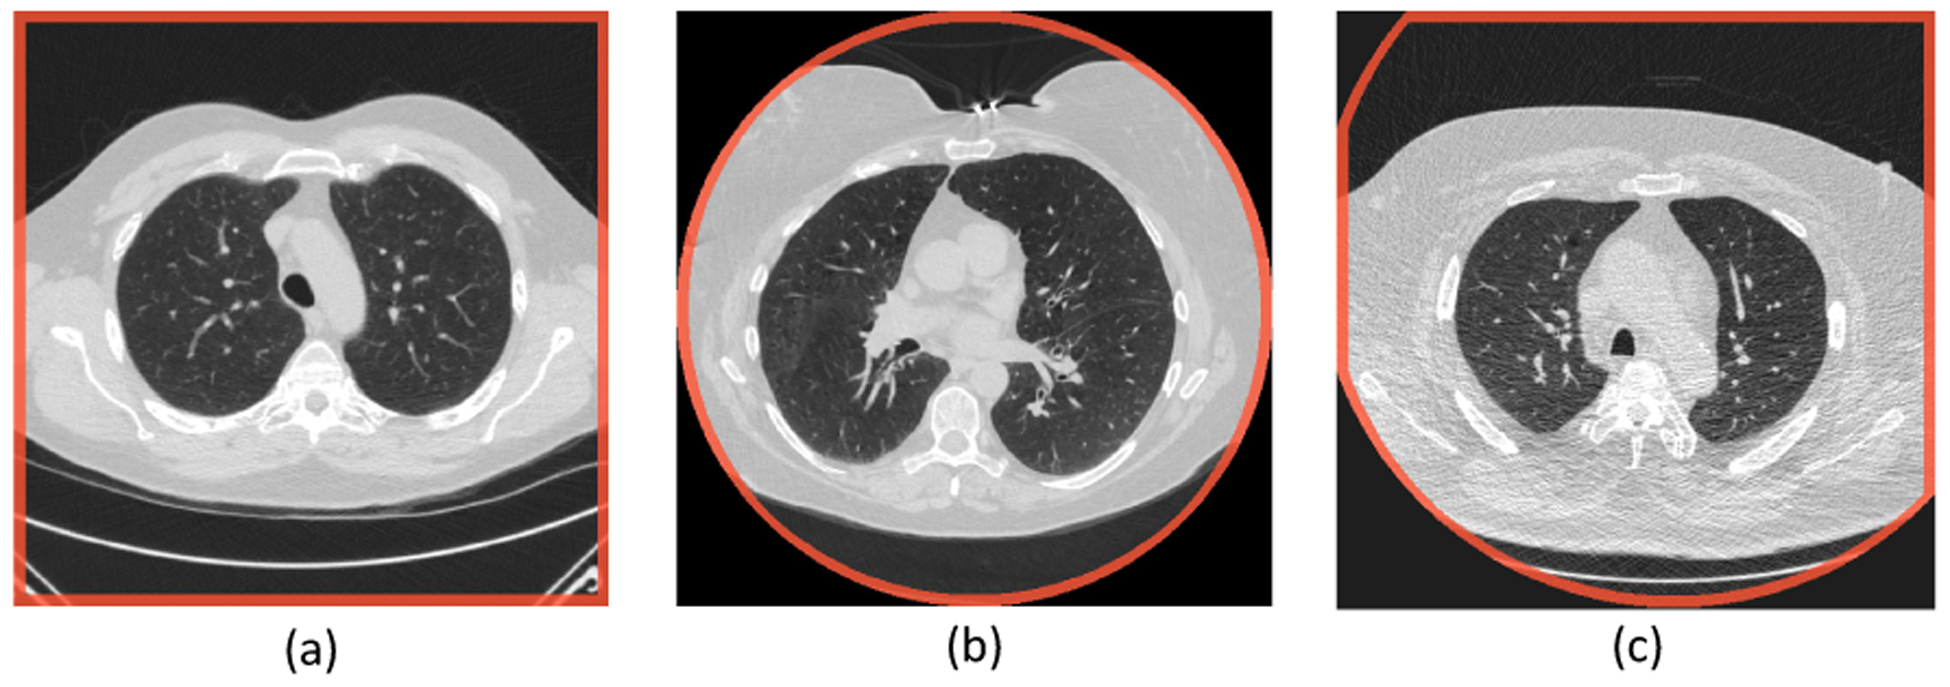
Typical FOV patterns in lung screening CT. The images are shown using HU window [−1200, 300]. The FOV borders are highlighted in red. The FOV patterns are the results of the intersection between a circular reconstruction fieldof-view and a square display field-of-view. HU=Hounsfield Unit. FOV=Field-of-view.
Fig. 5.
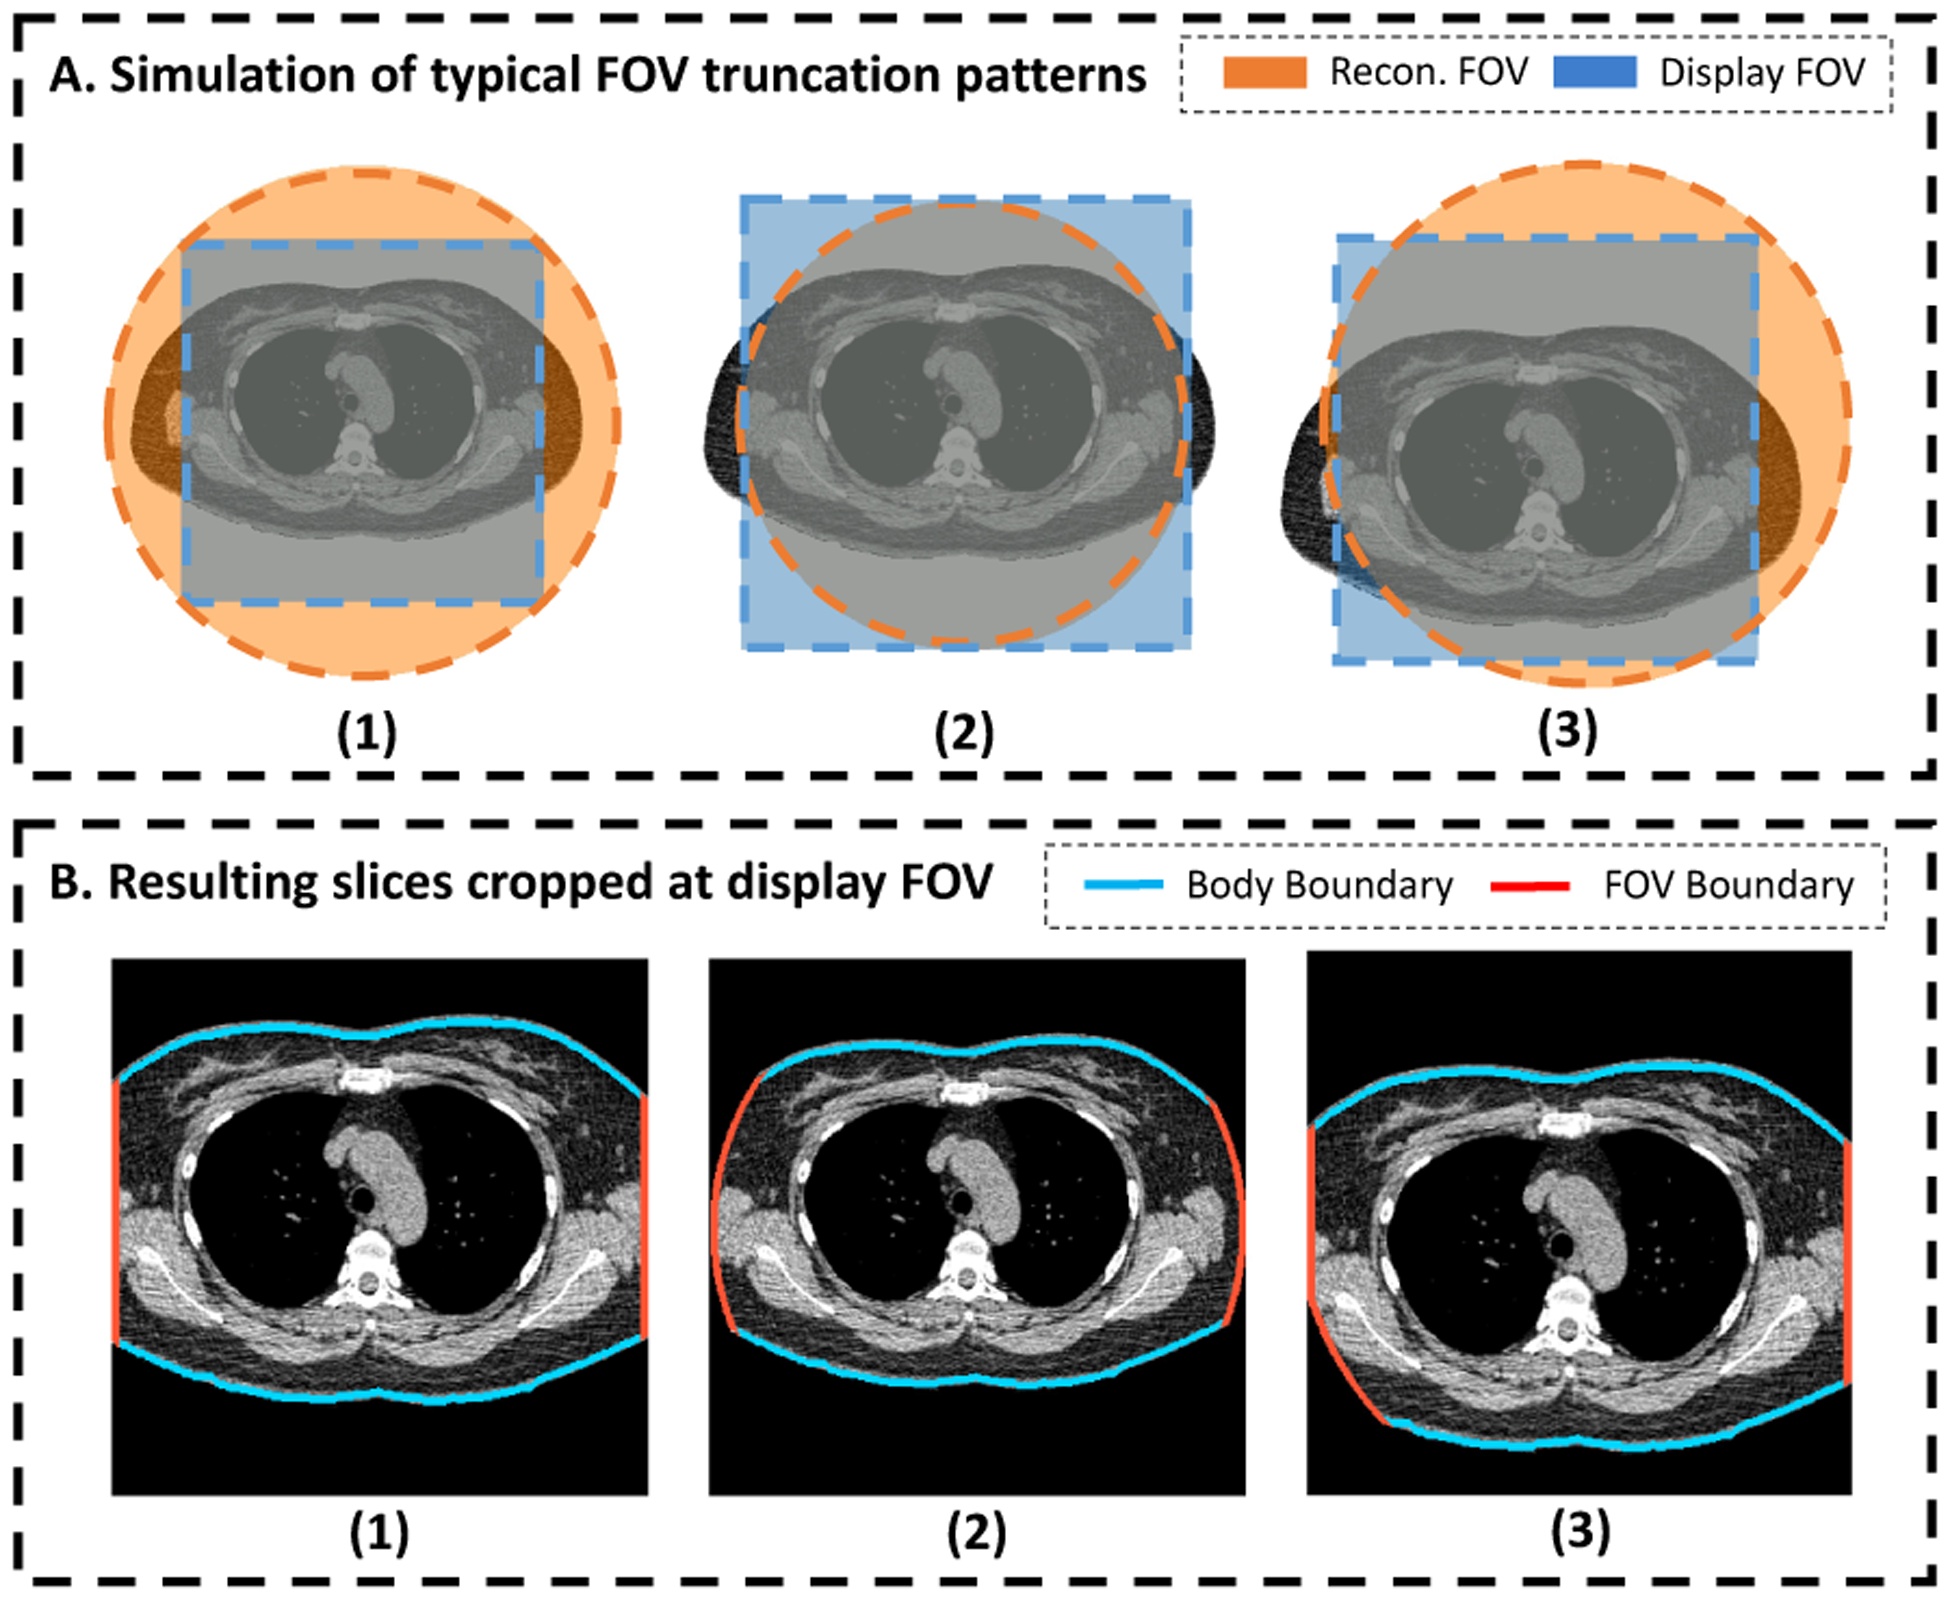
Simulation of typical FOV truncation patterns using a CT slice with complete body in FOV. The patterns are determined by a circular RFOV and a squared DFOV (A.1, A.2, and A.3). Artificial tissue truncation is generated by imputing the pixels outside of CT FOV with background intensity. The slices are further cropped at the DFOV, simulating the DFOV selection during CT acquisition procedure (B.1, B.2, and B.3). FOV=Field-of-view. RFOV=Reconstruction Field-of-view. DFOV=Display Field-of-view.
The final CT FOV is determined by the intersection of RFOV and DFOV (Fig 4 and Fig 5). However, when the object exceeds the SFOV, cupping artifacts can appear near those CT FOV borders that are overlapping or close to the borders of SFOV where the truncation exist. In our study, we only considered the FOV truncation without the cupping artifacts, in consideration of its extremely low occurrence observed in the application in lung screening LDCT. A detailed discussion in relevant limitations in terms of generalizability are given in Section 4. Two chest CT scans with cupping artifacts identified from a conventional chest CT dataset are given in Table C.7.
It is common that parts of the squared DFOV extrude the boundary of the circular RFOV, resulting in output image regions without available reconstructed data (Fig 4). In the reconstructed images, these “invalid” regions are imputed with a pre-defined value, which is controlled by the “Pixel Padding Value (0028, 0120)” under DICOM standard (DICOM PS3.3 2016c: Information Object Definitions).
Depending on the relative size and location between RFOV and DFOV, the FOV truncation can present in three distinguishable patterns. Fig 4 shows the typical examples of the three major truncation patterns in lung screening CT. In Fig 4 (a), the selected DFOV is fully inside the region of RFOV. This generates a slice where all pixels are with valid reconstruction value. The artificial body boundaries are located at the edge of the image. In Fig 4 (b), the DFOV is selected to exactly match the extent of the RFOV, which leads to a slice with all valid pixels located inside the centered reconstruction circular. The artificial body boundaries are at the edge of the circular region and inside the image region. Fig 4 (c) represents a middle status between Fig 4 (a) and Fig 4 (b), with DFOV selected smaller than the extent of the RFOV, but not fully covered in RFOV. This gives a truncation pattern where artificial body boundaries exist on both the image borders and the internal region as arc segments of the reconstruction circular.
We designed a random procedure to generate synthetic FOV truncation patterns simulating the FOV truncation in CT acquisition described above (Fig 3, A). First, we specified the probabilities of generating each of the three truncation patterns, with , , and corresponding to the probability to generate pattern represented by Fig 4 (a), Fig 4 (b), and Fig 4 (c), respectively. A pseudo circular RFOV was generated at the center of input image space, with diameter determined by a ratio relative to the full image dimension. For type Fig 4 (a), the DFOV was automatically determined as the largest square region fit into the RFOV, with location centered at the image center and side length as of the diameter of the RFOV. For Fig 4 (b), the DFOV was the bounding box of RFOV, with location centered at the image center and side length same as the diameter of RFOV. For type Fig 4 (c), a squared DFOV region was selected inside the extent of the RFOV with side length specified by a ratio relative to the RFOV diameter, and with center location defined by displacement relative to the image center. , and were randomly generated inside a pre-defined range, with specific constraints to confine with geometric limitations.
2.2.3. Synthetic Data Pairs
Combining the simulated FOV truncation pattern and CT slice with complete body in FOV, we generated the paired synthetic data used in model development and evaluation (Fig 3, B and C). To further increase the generalizability of the trained model, we applied random scaling, rotation, and translation on the CT slice. Corresponding operations were applied on associated binary masks simultaneous. The following two groups of data were derived based on this process.
Corrupted-uncorrupted pairs and FOV masks.
The FOV region was defined as the intersection of the simulated RFOV and DFOV. The artificial truncation was generated by imputing the regions outside this FOV by a predefined value as indication for invalid pixels. This truncated slice and the corresponding untruncated version formed the corrupted-uncorrupted image pair. Combining with the FOV region mask, these data were designed for the image complete model development (Fig 3, C).
Ground-truth body bounding box for cropped slice.
The processed CT slices with artificial truncation were further cropped at the DFOV, simulating the same process during CT acquisition. The bounding box of the body region was defined as pixel coordinates in image space and first identified in the complete image space before the DFOV cropping operation. After the cropping, these coordinates were shifted and rescaled to the cropped image space, usually resulting in a bounding box extrudes the image border. The cropped slice and ground-truth body bounding box in its space formed the training data pair for the bounding box prediction model (Fig 3, B).
2.3. Evaluation
The evaluation of synthetic image results is challenging as the commonly used intensity-based similarity metrics, e.g., , PSNR, and SSIM, can lead to a significant preference for blurry images (Liu et al., 2018). For this reason, the human perceptual study is commonly used as the gold standard to evaluate the output image quality of image generative models (Chuquicusma et al., 2018; Isola et al., 2017; Liu et al., 2018; Schlegl et al., 2019; Tang et al., 2021b). In addition, anatomical consistency of the synthetic contents is critical for medical imaging applications. We proposed to evaluate the anatomical consistency of FOV extension results using a previously developed BC assessment tool (Xu et al., 2022), with the assumption that a biologically consistent image completion algorithm should generate CT slices that can be properly processed by the pre-trained segmentation model and reduce the measurement offsets caused by FOV truncation. We further integrated the developed FOV extension module into this BC assessment tool and evaluated the application validity for CT-based BC assessment under the context of routine lung screening.
2.3.1. Body Composition Assessment
Multi-level BC assessment using thorax CT.
Using the cross-sectional BC areas measured on axial slices selected at certain landmark as surrogate for whole-body BC evaluation is a well-established approach for CT-based BC assessment (Fintelmann et al., 2018; Troschel et al., 2019; Mathur et al., 2020). In this study, we followed the multi-level approach for thoracic CT introduced in Best et al. (2022), where axial slices at the level of the fifth, eighth, and 10th thoracic vertebral bodies (T5, T8, and T10) were selected for evaluation. The primary outputs included the accumulated subcutaneous adipose tissue (SAT) and muscle areas (cm2) measured at three levels. The measurements can be further divided by the height squared to form the muscle and SAT indexes (cm2/m2) for a normalized description of the body composition profile regardless of the size of the patient.
Implementation of fully automatic pipeline.
A deep learning pipeline was introduced in Bridge et al. (2022) to achieve fully automation of the above method. However, the pipeline was developed on chest CT scans of lung cancer patients prior to lobectomy, the protocol of which could be significantly different from routine lung screening CT. In Xu et al. (2022), we implemented a fully automatic multi-level BC assessment pipeline specifically for lung cancer screening LDCT scans with a similar two-stage framework. The pipeline consisted of a slice selection module based on a 3D regression model, which identified the levels of T5, T8, and T10 vertebral bodies from a CT volume, and a BC segmentation module implemented using 2D Nested U-Net (Zhou et al., 2018), which delineated the cross-sectional areas corresponding to each BC component. Once the two-stage semantic FOV extension pipeline is developed, it can be integrated as an additional processing module after the slice selection module and before the BC segmentation module of the original BC assessment pipeline (Fig 2, A). Thus, the final evaluation outputs are the BC indexes evaluated on FOV extended slices, providing a correction for measurement offsets caused by FOV tissue truncation.
2.3.2. Evaluation on Synthetic Paired Data
We evaluated the performance of the developed model on the synthetic paired data generated using untruncated CT slices of subjects withheld from the training phase. Only cases generated by T5, T8, or T10 slices and with complete lung region in FOV were included to best represent the application scenario. In additional to a direct evaluation of pixel-wise difference in Hounsfield Unit (HU) based on Root Mean Square Error (RMSE), the following two evaluations were adopted:
Visual Turing test.
To evaluate the quality of synthetic contents, we designed a visual Truing test inspired by Chuquicusma et al. (2018) and Schlegl et al. (2019). For a random subsample of synthetic cases with moderate or severe truncation (TCI > 0.3), half of the cases were generated by the trained pipeline, while the other half were corresponding untruncated images of the selected samples. The order of the samples was randomly shuffled before presented to two clinical experts to independently classify each case into real or synthetic category. We also provided the readers with synthetic FOV pattern used in each sample. The mean accuracy and inter-rater consistency were recorded.
Correction of BC measurement shift.
The pretrained BC segmentation model was applied to untruncated, synthetic truncated, and reconstructed slices, with the segmentations on untruncated slices as ground-truth. We quantitatively evaluated the model’s capability to correct the BC assessment shifts caused by FOV truncation. First, the Dice Similarity Coefficients (DSC) were used to assess the improvements in agreement with the ground-truth segmentations. Then, the performance was assessed by the reduction in the shift of BC measurements. In addition to measured area (cm2) of SAT and muscle, we included the mean attenuation (HU) of each of the considered body composition in the evaluation, in consideration of their potential implementation in applications (Pickhardt, 2022).
2.3.3. Evaluation on Lung Screening CT Volumes with Limited FOV
We evaluated the effectiveness of the FOV extension method on real lung screening CT data with systematic FOV truncation. The evaluation was conducted using the automatic multi-level BC assessment pipeline with FOV extension module integrated (Section 2.3.1). In application, the FOV extension module was only applied for slices with detected FOV tissue truncation (TCI > 0). As the ground-truth BC data were not available due to FOV truncation, the evaluation was based on human perceptual study and two indirect quantitative assessments: (1) intra-subject consistency; and (2) correlation with anthropometric approximations.
Expert review for application validity.
We designed a human perceptual study to evaluate the application validity of the pipeline output in BC assessment. The evaluation was based on a combined review for the quality of reconstructed images and BC segmentations. We formulated a quality score system with nine digital numbers from 1 (exceptional) to 9 (poor). This quality score was further stratified into (1) Succeed – quality score ≤ 3, for cases only with trivial defect or without any noticeable defect; (2) Acceptable – quality score between 4 and 6, for cases with certain defects but still can be included for downstream analysis; and (3) Failed – quality score ≥ 7, for cases that should be excluded from downstream analysis due major defects Two trained clinical experts were asked to independently review each case in a selected cohort. The quality scores were recorded together with comments for the identified primary quality issue in each case.
Intra-subject consistency.
Multiple screens (e.g., annually) for the same subject are usually conducted in lung cancer screening. Even though the BC profiles for the same individual may change over time, the overall correlation between measurements on the same subject should be stronger than the correlation between measurements on different individuals. However, this intra-subject consistency can be significantly reduced by the FOV limitation-caused tissue truncation. Under this assumption, the benefit of the proposed FOV extension method can be assessed by the improved overall correlation in BC measurements between longitudinal screens.
Correlation with anthropometric approximations.
An anthropometric approximation for whole-body fat mass (FM) and fat-free mass (FFM) computed from weight and height was given in Kuch et al. (2001). The method was developed by fitting a non-linear relationship with Bioelectrical Impedance Analyses results as ground-truth. FFM was expressed as
| (7) |
with and representing the height (m) and weight (kg) of the subject, respectively. FM was computed by subtracting FFM from the overall mass, i.e., FM (kg) = weight (kg) − FFM (kg). FM and FFM indexes (kg/m2) were defined by the estimated FM and FFM normalized by height (m) square. The correlation between measured BC indexes and anthropometric approximations were usually used to evaluate the validity of CT-based BC assessment (McDonald et al., 2014; Pishgar et al., 2021) (muscle index vs. FFM index, and SAT index vs. FM index). In our evaluation, we reported the improvement in these correlations as evidence in support of the effectiveness of the proposed method.
3. Experiments and Results
In this section, we introduce the data preparation, model development, and evaluation of the proposed semantic FOV extension method. Experiments and analyses were conducted in Python™ 3.7.4, PyTorch™ 1.9.0, CUDA™ 11.3, and R 4.1.2. The pretrained pipeline is available in the form of docker container and can be accessed by following the instructions at https://github.com/MASILab/S-EFOV.
3.1. Lung Screening CT Dataset
In this study, we included two lung cancer screening CT datasets.
CT arm of National Lung Screening Trial (NLST).
NLST (Schaapveld et al., 2011) is the largest randomized controlled trial to evaluate the effectiveness of LDCT in lung cancer screening. 53,454 eligible participants were enrolled in the program from August 2002 through April 2004. 26,722 were randomly assigned to the CT arm. Longitudinal data are available, with up to three annual screens for those who continuously enrolled and have not been diagnosed with lung cancer during previous screens. The anthropometric measurements, including height and weight, were self-reported at the time of enrollment right before the first screen. In this study, we randomly sampled 1,280 subjects from the CT arm of NLST, with 3,586 available LDCT scans in total.
Vanderbilt Lung Screening Program (VLSP).
VLSP (https://www.vumc.org/radiology/lung) is an on-going LDCT-based lung cancer screening program conducted at Vanderbilt University Medical Center. In this study, we used the VLSP data to develop our two-stage pipeline as more untruncated cases are available. This included 1,490 CT scans of 887 subjects enrolled since 2013. All data were de-identified and acquired under internal review board supervision (IRB#181279).
The demographic and imaging protocol statistics of these two study cohorts are summarized in Table 1. The smaller DFOV in NLST could be explained by the strict requirement on the FOV size in the NLST imaging protocol, where including unnecessary amount of additional body tissue beyond the lung was even considered as a type of imaging quality issue (Gierada et al., 2009; Schaapveld et al., 2011). Although this restriction might not be strictly enforced by later lung screening programs equipped with more advanced scanner platforms than NLST (e.g., minimum requirement for 16-slice MDCT), optimization of the FOV to the lung field for each patient is still recommended (Kazerooni et al., 2014; American College of Radiology, 2022).
Table 1.
Characteristics of study cohorts. SD=Standard Deviation.
| Characteristics | VLSP | NLST |
|---|---|---|
| Demographic | ||
| No. of subject | 887 | 1280 |
| No. of female (%) | 399 (45.0) | 527 (41.2) |
| Age at baseline (y) ± SD | 64.0 ± 5.6 | 61.4 ± 4.9 |
| BMI at baseline (kg / m2) ± SD | 28.3 ± 6.0 | 27.7 ± 4.8 |
| Imaging | ||
| No. of scans | 1490 | 3586 |
| Effective mAs ± SD | 45.6 ± 30.3 | 36.9 ± 7.9 |
| kVp ± SD | 119.0 ± 4.3 | 121.0 ± 4.4 |
| Display FOV (cm) ± SD | 36.9 ± 3.6 | 33.4 ± 3.4 |
3.2. Data Preparation
3.2.1. Image Quality Review
We reviewed all selected lung screening LDCT scans and excluded cases with severe imaging artifacts. The type of imaging artifacts included: incomplete imaging data, imaging data corruption, beam hardening, cupping artifact, severe imaging noise, and non-standard body positioning. For all qualified images, the FOV mask, lung mask, and body mask were identified using the procedures described in Appendix B. We further reviewed the generated region masks and excluded those cases with significant defects. This combined review process filtered out 5 (0.3%) scans of the VLSP cohort and 74 (2.1%) scans of the NLST cohort in total. We identified one VLSP scan and two NLST scans that are associated with cupping artifacts. This accounted for 0.06% in all included LDCT scans. For all included scans, the levels of T5, T8, and T10 were estimated using the vertebral level identification module developed in Xu et al. (2022). The per-slice TCI values were calculated based on Eq (6).
3.2.2. Candidate Slice Identification
We used the untruncated slices in the VLSP dataset to generate the synthetic data. As the intended application was focused on the BC assessment using the T5, T8, and T10 axial slices, we first defined an inclusion range to cover those slices with anatomy close to these locations. Briefly, we defined a linear body part regression (BPR) score for each slice based on the relative location to T5 and T10 levels, with T10 level of BPR score 0 and T5 level of BPR score 1. Then, all slices with BPR scores between −0.2 and 1.2 were marked as in-range slices. Among the in-range slices, we further filtered out those with zero TCI value, which indicated no tissue truncation in these slices. This process filtered out 89,992 slices from 1,018 CT volumes across 669 unique subjects. Among these subjects, we random sampled 549 subjects to form a training cohort, with 71,319 candidate slices in total. Within the remaining subjects, we identified those with at least one T5, T8, or T10 slice in the candidate slice set, and split them into a 60 subject validation cohort, and a 60 subject testing cohort. For the validation and testing cohort, we only considered the T5, T8, and T10 slices, which led to 148 slices for validation and 145 slices for testing.
3.2.3. Synthetic Data Pairs
For preprocessing of the CT slices, the extraneous information outside the identified body mask (Section 3.2.1 and Appendix B), e.g., the scan tables and clothes, were removed by replacing the intensity of pixels with HU intensity of air. Then, the intensity window [−150, 150] (HU) was applied to highlight relevant tissues. The resulting slices, together with pre-identified body region masks, were further resized to 256 × 256 before the synthetic data generation procedure. We adopt the following configuration for the synthetic data generation procedure introduced in Section 2.2. The probability to generate three types of truncation patterns , and , were set to 0.5, 0.3, and 0.2, respectively, with emphasis on the first two types of truncation patterns. was uniformly sampled in range [0.6, 0.9], which determined the size of RFOV. For the first two types of truncation patterns, the DFOV was automatically identified once RFOV was given. For the third type pattern generation, the was uniformly sampled in range [0.7, 1.0], which determined the size of DFOV. The offsets on two dimensions relative to the image center, and , were sampled in , where was the dimension difference between the RFOV diameter and DFOV side length. This guarantees the generated DFOV contained inside the extent of RFOV. On the CT slice augmentation, the random scale ratio was sampled between 0.7 and 1.0. The maximum rotation degree was set as 15°. The maximum translation in ratio of the image dimension was 0.1 in the anterior-posterior direction and 0.2 in the transverse direction. As a result of this random augmentation of raw CT slice, the body region may extrude the original image border in some cases, resulting in inaccurate body bounding box assessment. We excluded these cases for the training of the body bounding box estimation model, while keeping them for the image completion model development.
In our implementation, the randomized synthetic sample generation procedure was integrated into the model training process and applied to each training CT slice when it was loaded. In contrast, the paired data used in validation and testing are pre-generated and specifically configured. Briefly, we generated 1,000 samples for each slice using the same randomized synthetic data generation procedure for training data. Cases with body regions that extruded the image boundary were excluded. To best represent the application situation in lung cancer screening, we excluded cases with incomplete lung regions. To balance the data regarding different truncation severity, we set the limit of maximum five cases for each severity levels defined in Section 2.2 for each slice. This resulted in 2,600 samples for validation and 2,657 samples for testing.
3.3. Pipeline Development
The development of the models in the proposed two-stage pipeline was based on the same sets of training and validation data. The models were first trained on the training set, and the best epoch was selected as the one with the best performance on the validation set. For all models, the input slices were normalized from [−150, 150] to range [−1, 1], with non-FOV region imputed with value 0.
FOV border extension.
We implemented the body bounding box prediction model using ResNet-18 pre-trained on ImageNet as backbone, with the last layer replaced with a fully connected layer with four output channels representing the pixel-space coordinates of the bounding box. We empirically set the weight to 1500 to balance the MSE term and GIoU term in loss function (Eq 4). The model was trained with batch-size of 20, optimized using Adam optimizer with weight decay 1 × 10⁻⁴. The learning rate was set as 2 × 10⁻³. The model was trained for 200 epochs in total. The trained model achieved the performance of 0.976 ± 0.015 in IoU on testing samples. With the predicted bounding box, the extension ratio defined as in Eq (5) was determined to extend the image border symmetrically to cover the estimated body region. Using the estimated alone (set in Eq 5) generated extended FOV covering complete body region only for 78.3% of cases in the test set, indicating the necessity of the extra extension . In our evaluation, a 5% extra extension was able to consistently produce extended FOV border that covers the complete body region, with 98.4% success rate on the test set.
Image completion.
For image completion stage, we evaluated the three published methods mentioned in Section 2.1.2. The detailed training configurations are given in Appendix A.
3.4. Evaluations and Results
3.4.1. Evaluation on Synthetic Paired Data
We evaluated the developed FOV extension models on pre-generated synthetic paired data following the methods described in Section 2.3.2.
Visual Turing test.
We randomly sampled 100 synthetic samples with TCI > 0.3 from the withheld testing dataset (Section 3.2). We prepared the data following the practice of visual Turing test (Section 2.3.2). Two trained clinical experts independently classified each case into fake or real category. The mean accuracy of the two raters was 0.71, and inter-rater consensus was 0.68. On 35 out of 50 synthetic cases, at least one rater identified the case properly. These cases were associated with slightly higher TCI value (indicating more severe truncation) comparing to the rest of the cases (0.47 ± 0.11 vs. 0.42 ± 0.08). Fig 8 demostrate the results of three example cases selected from the synthetic group.
Fig. 8.
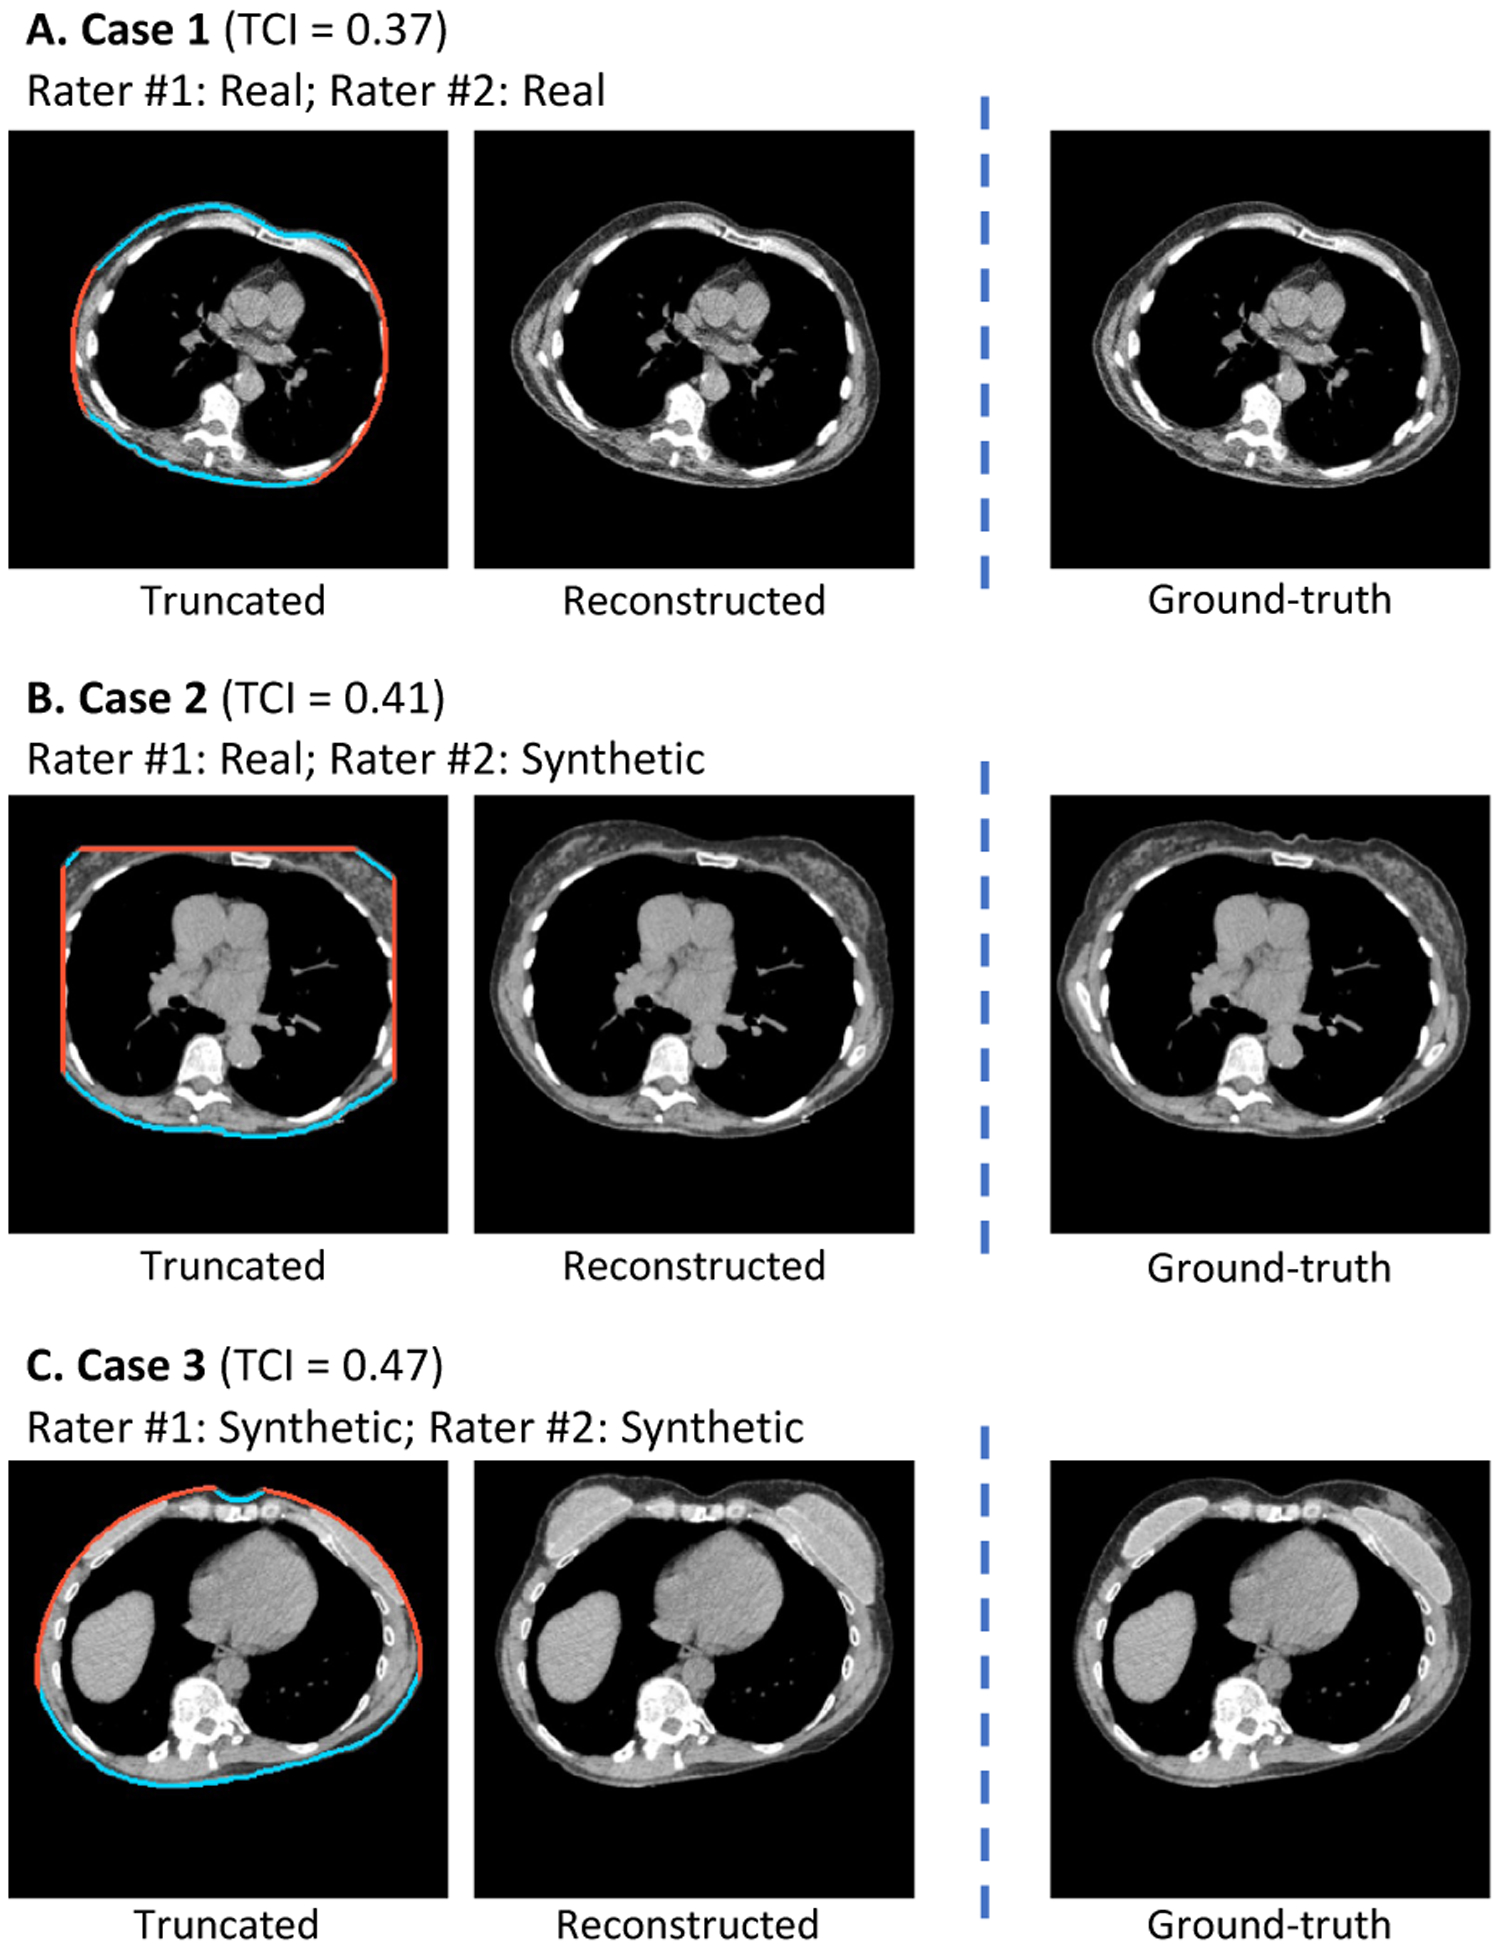
Example cases in visual Turing test to assess the effectiveness of the image completion stage (Section 3.4.1). Two clinical experts were asked to identify synthetic cases independently from a mixed set of equally numbered synthetic and real cases. All three demonstrated cases are selected from the synthetic group, where the reconstructed (synthetic) slices were provided along with the truncation patterns to the raters instead of the real slices. For Case 1, both raters misclassified it as real. For Case 2, one rater classified it as real while the other rater classified it as synthetic. For Case 3, both raters successfully identified the case as synthetic. TCI=Tissue Truncation Index.
Correction of BC measurement shift.
Fig 6 shows the results on two samples for qualitative evaluation. Both samples were generated using slices without tissue truncation (zero TCI value). The BC assessment results on untruncated slice were considered as the ground-truth measurements. The measurements on truncated slice and FOV extended slice were compared against the ground-truth to evaluate the effectiveness of the correction. In Fig 7, we use Bland-Altman plot to evaluate the capability of the method to systematically correct the underestimation of area (cm2) in the BC assessment caused by FOV truncation. Table 2 shows the effectiveness of the image completion method in restoring missing body tissues in the truncated regions, which was assessed by pixel-wise RMSE, DSC, and BC measurements including area (cm2) and attenuation (HU) of SAT and muscle. The metrics to characterize the difference between the ground-truth assessment and assessment without correction are included to provide a reference.
Fig. 6.
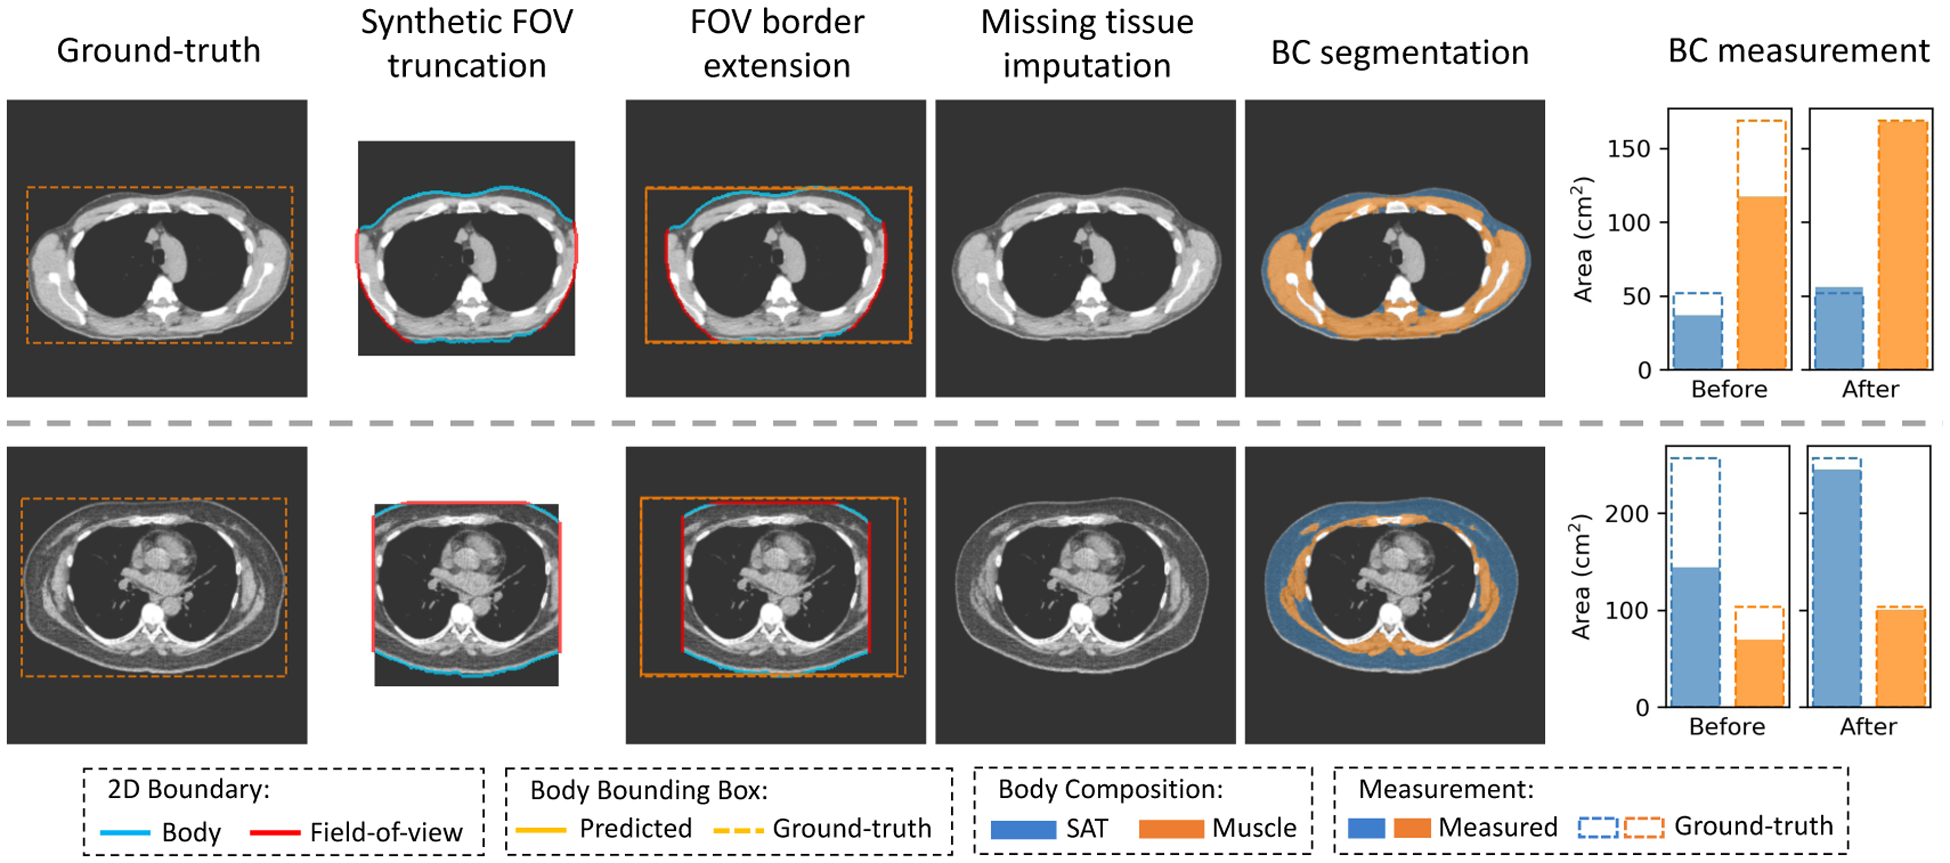
Typical results of the developed FOV extension method on synthetic FOV truncation samples. The two ground-truth slices are selected at the fifth and eighth thoracic vertebral body levels from two patients with dramatically different body composition profiles. Synthetic FOV masks are applied to the raw slices, generating slices with tissue truncation. The predicted complete body bounding box is compared against the ground-truth bounding box. The anatomical consistency of the generated structures is evaluated by a prior developed BC assessment tool. The correction for BC assessment offset is demonstrated using the bar plots that compare the measurements on truncated or reconstructed slices against measurements on paired untruncated slices. FOV=Field-of-view. BC=Body Composition. SAT=Subcutaneous Adipose Tissue.
Fig. 7.
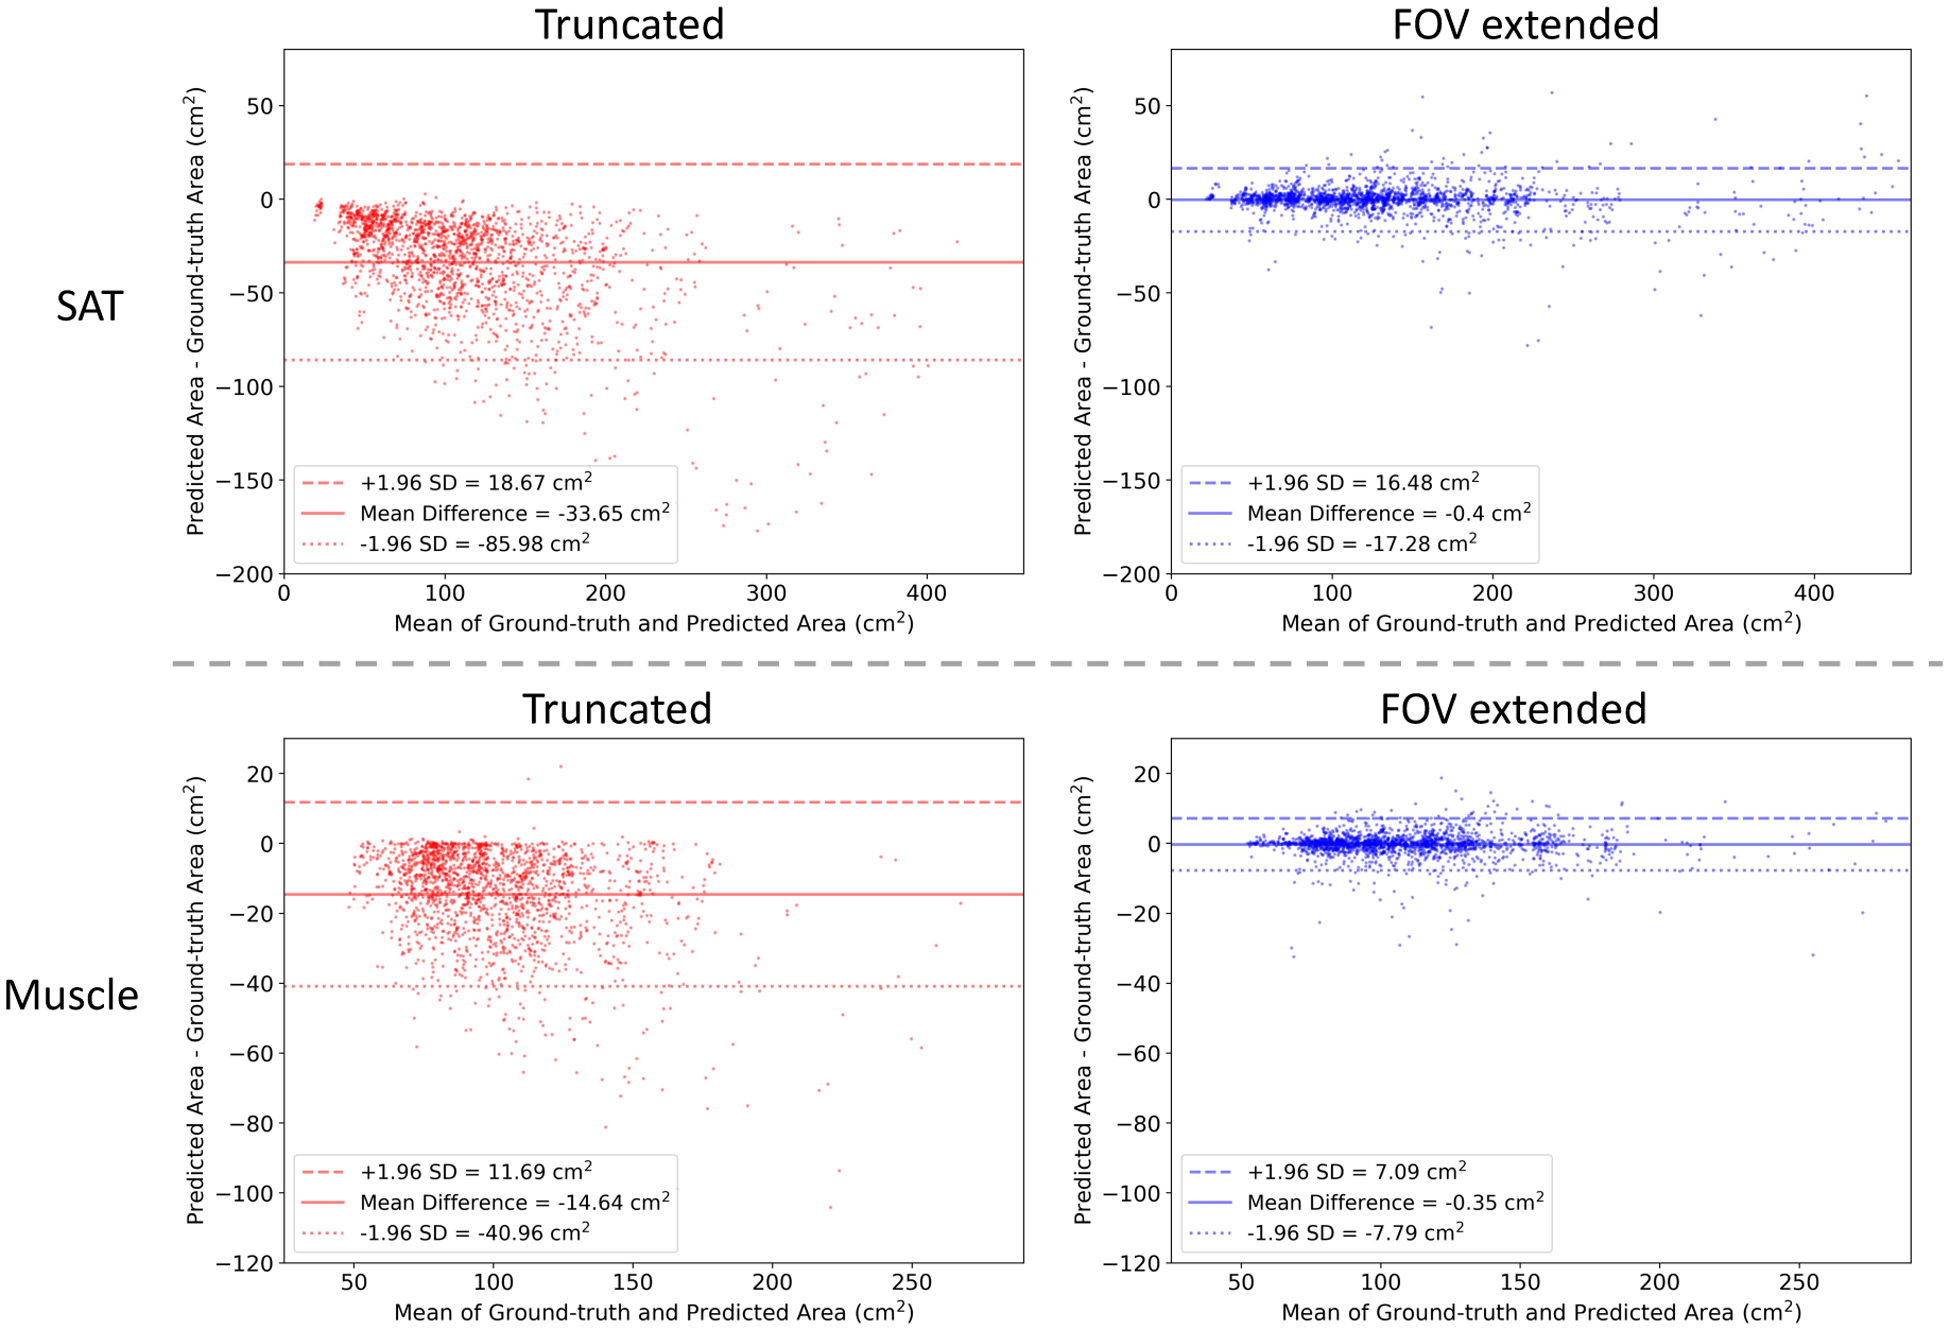
Correction of FOV truncation caused BC assessment offset by the proposed FOV extension method. The Bland-Altman plots compare the slice-wise body BC assessment performed on truncated or reconstructed slices with measurement performed on paired untruncated slices. The data are collected on 1,940 synthetic FOV truncation slices with mild to severe truncation severity level. SD=Standard Deviation. FOV=Field-of-view. BC=Body Composition.
Table 2.
Evaluation of the effectiveness of the image completion method in restoring missing body tissues in the truncated regions. The experiments were conducted on synthetic truncation pairs generated by the procedure described in Section 2.2, by evaluating the improvement comparing reconstructed slices to truncated slices in the agreement with untruncated slices. The evaluation was based on pixel-wise RMSE and DSC, as well as the BC measurements including area (cm2) and attenuation (HU) of SAT and muscle, using the untruncated slice and the segmentation and measurements on it as ground-truth. The evaluation was stratified by truncation severity levels as defined in Section 2.2. The results are displayed in mean and SD for pixel-wise RMSE and DSC, and in RMSE and 95% CI for BC measurements. Statistical significance in difference was assessed by Mann Whitney U Test for pixel-wise RMSE and DSC, and Wilcoxon Signed-rank Test on bootstrap samples for BC measurements. for all comparisons between truncated and reconstructed. RMSE=Root Mean Square Error. DSC=Dice Similarity Coefficients. BC=Body Composition. SAT=Subcutaneous Adipose Tissue. HU=Hounsfield Unit. SD=Standard Deviation. CI=Confidence Interval.
| Truncation Severity Level | |||||
|---|---|---|---|---|---|
| Metric | Trace () | Mild () | Moderate () | Severe () | Overall () |
| Pixel-wise RMSE (HU), Mean ± SD | |||||
| Truncated | 5.33 ± 3.22 | 11.54 ± 5.23 | 17.18 ± 5.73 | 24.11 ± 7.83 | 13.81 ± 8.66 |
| Reconstructed | 2.18 ± 1.20 | 4.80 ± 2.09 | 7.55 ± 2.77 | 11.49 ± 3.52 | 6.12 ± 4.09 |
| Dice Similarity Coefficient, Mean ± SD | |||||
| Truncated | 0.98 ± 0.02 | 0.94 ± 0.03 | 0.88 ± 0.05 | 0.79 ± 0.07 | 0.90 ± 0.08 |
| Reconstructed | 0.99 ± 0.01 | 0.98 ± 0.02 | 0.96 ± 0.03 | 0.93 ± 0.04 | 0.97 ± 0.03 |
| SAT Area (cm 2 ), RMSE (95% CI) | |||||
| Truncated | 7.88 (7.36, 8.57) | 20.48 (19.26, 22.34) | 39.09 (36.88, 42.09) | 65.41 (62.31, 68.82) | 36.95 (35.46, 38.45) |
| Reconstructed | 1.69 (1.45, 2.10) | 3.85 (3.37, 4.51) | 8.23 (6.91, 10.32) | 12.91 (11.59, 14.70) | 7.42 (6.79, 8.26) |
| SAT Attenuation (HU), RMSE (95% CI) | |||||
| Truncated | 0.57 (0.53, 0.63) | 1.37 (1.28, 1.50) | 2.71 (2.49, 3.09) | 4.33 (4.06, 4.66) | 2.49 (2.36, 2.64) |
| Reconstructed | 0.34 (0.31, 0.40) | 0.80 (0.72, 0.92) | 1.26 (1.15, 1.45) | 2.04 (1.86, 2.27) | 1.20 (1.13, 1.29) |
| Muscle Area (cm2), RMSE (95% CI) | |||||
| Truncated | 3.59 (3.25, 3.96) | 10.81 (10.08, 11.77) | 18.35 (17.46, 19.42) | 29.39 (27.72, 31.41) | 17.08 (16.38, 17.87) |
| Reconstructed | 0.69 (0.61, 0.77) | 2.18 (1.86, 2.73) | 3.54 (3.14, 4.25) | 5.56 (4.89, 6.50) | 3.28 (2.99, 3.63) |
| Muscle Attenuation (HU), RMSE (95% CI) | |||||
| Truncated | 0.39 (0.33, 0.50) | 1.26 (1.12, 1.45) | 2.41 (2.24, 2.62) | 3.10 (2.87, 3.38) | 1.97 (1.87, 2.08) |
| Reconstructed | 0.20 (0.19, 0.23) | 0.61 (0.55, 0.67) | 1.00 (0.91, 1.14) | 1.48 (1.34, 1.67) | 0.89 (0.84, 0.97) |
3.4.2. Evaluation on Real FOV Truncation Scans
In addition to the evaluation of synthetic FOV truncatic samples, we evaluated our pipeline on real lung cancer screening LDCT scans following the methods described in Section 2.3.3. Table 3 shows the statistics of the scan-wise truncation severity levels and the anthropometric characteristics of each level in the two included the lung screening LDCT datasets. NLST scans were associated with more severe truncation compared to VLSP scans, which consistent with the even restricted DFOV size in NLST compared to VLSP (Table 1). Scans with more severe truncation were associated with higher weight, BMI, and FM index in both of the datasets. For LDCT scans in both VLSP and NLST, we obtained the BC assessment results using both the original version of BC assessment pipeline developed in Xu et al. (2022) and the enhanced version with the FOV extension module integrated to correct the measurement offsets caused by FOV truncation.
Table 3.
Anthropometric characteristics of scan truncation severity levels. The included scans are those filtered out by image quality review and with complete height and weight data. BMI=Body Mass Index. FM=Fat Mass. FFM=Fat-free Mass.
| Cohort | Severity Level | No. of Scans (%) | Height (m) | Weight (kg) | BMI (kg/m2) | FM Index (kg/m2) | FFM Index (kg/m2) |
|---|---|---|---|---|---|---|---|
| VLSP | None | 78 (6.3%) | 1.70 ± 0.10 | 70.3 ± 15.7 | 24.1 ± 4.3 | 6.8 ± 3.2 | 17.4 ± 1.7 |
| Trace | 690 (55.4%) | 1.72 ± 0.10 | 79.4 ± 16.8 | 26.6 ± 4.6 | 8.4 ± 3.5 | 18.2 ± 1.7 | |
| Mild | 355 (28.5%) | 1.72 ± 0.11 | 90.1 ± 17.9 | 30.5 ± 5.1 | 11.6 ± 4.1 | 18.9 ± 1.8 | |
| Moderate | 107 (8.6%) | 1.69 ± 0.10 | 98.5 ± 25.2 | 34.4 ± 7.5 | 15.1 ± 5.9 | 19.2 ± 2.3 | |
| Severe | 16 (1.3%) | 1.67 ± 0.07 | 104.2 ± 20.6 | 37.2 ± 5.9 | 18.1 ± 5.0 | 19.1 ± 1.5 | |
| Overall | 1,246 | 1.72 ± 0.10 | 83.8 ± 19.5 | 28.3 ± 5.8 | 9.9 ± 4.6 | 18.4 ± 1.9 | |
| NLST | None | 18 (0.5%) | 1.70 ± 0.09 | 66.1 ± 17.9 | 22.6 ± 4.1 | 5.65 ± 2.5 | 17.0 ± 1.9 |
| Trace | 638 (18.2%) | 1.75 ± 0.10 | 79.4 ± 17.2 | 25.7 ± 4.3 | 7.4 ± 3.1 | 18.3 ± 1.6 | |
| Mild | 1,190 (34.0%) | 1.75 ± 0.09 | 82.9 ± 16.4 | 27.0 ± 4.1 | 8.4 ± 3.1 | 18.6 ± 1.6 | |
| Moderate | 1,214 (34.7%) | 1.71 ± 0.10 | 83.1 ± 18.3 | 28.4 ± 4.7 | 10.1 ± 3.5 | 18.3 ± 1.9 | |
| Severe | 442 (12.6%) | 1.68 ± 0.10 | 89.0 ± 20.4 | 31.2 ± 5.5 | 12.7 ± 4.2 | 18.6 ± 1.9 | |
| Overall | 3,502 | 1.73 ± 0.10 | 83.0 ± 18.0 | 27.8 ± 4.8 | 9.3 ± 3.7 | 18.4 ± 1.8 |
Expert review for application validity.
We randomly sampled 100 NLST scans with moderate to severe tissue truncation (TCI > 0.3) and presented the FOV extended images and final segmentation masks to two trained clinical experts who independently reviewed and rated the quality of the results for downstream application. None of the cases were rated as Failed (quality score ≥ 7). 39 cases were labeled as Acceptable, with quality score between 4 and 6, by at least one rater and with at least one clear description for identified issue. Even with identifiable defects, these results were considered as valid for downstream analysis by both raters. Those labeled as Acceptable were associated with slightly higher TCI value (more severe truncation) comparing to those considered Succeed (0.46 vs. 0.43 ± 0.10). BMI distributions were similar between those labeled as Acceptable (28.7 ± 5.8) and those labeled as Succeed (28.6 ± 4.7). The identified defect include: (1) unrealistic scapula shape, 24 cases; (2) unrealistic intensity in subcutaneous region, 4 cases; (3) body extrude the image border, 2 cases; and (4) unrealistic breast implant shape in female, 1 case. However, the inter-rater consistency was poor, with Intraclass Correlation Coefficient between the two raters being 0.15. By categorizing the ratings into Failed (score ≤ 3) and Acceptable (score > 3), the Cohen’s Kappa Coefficient was 0.09 (none to slight agreement) between the two raters. The distribution of rating scores given by the two raters is presented in Fig 9. Fig 10 shows the pipeline results, quality scores, and review comments on four cases included for this quality review.
Fig. 9.
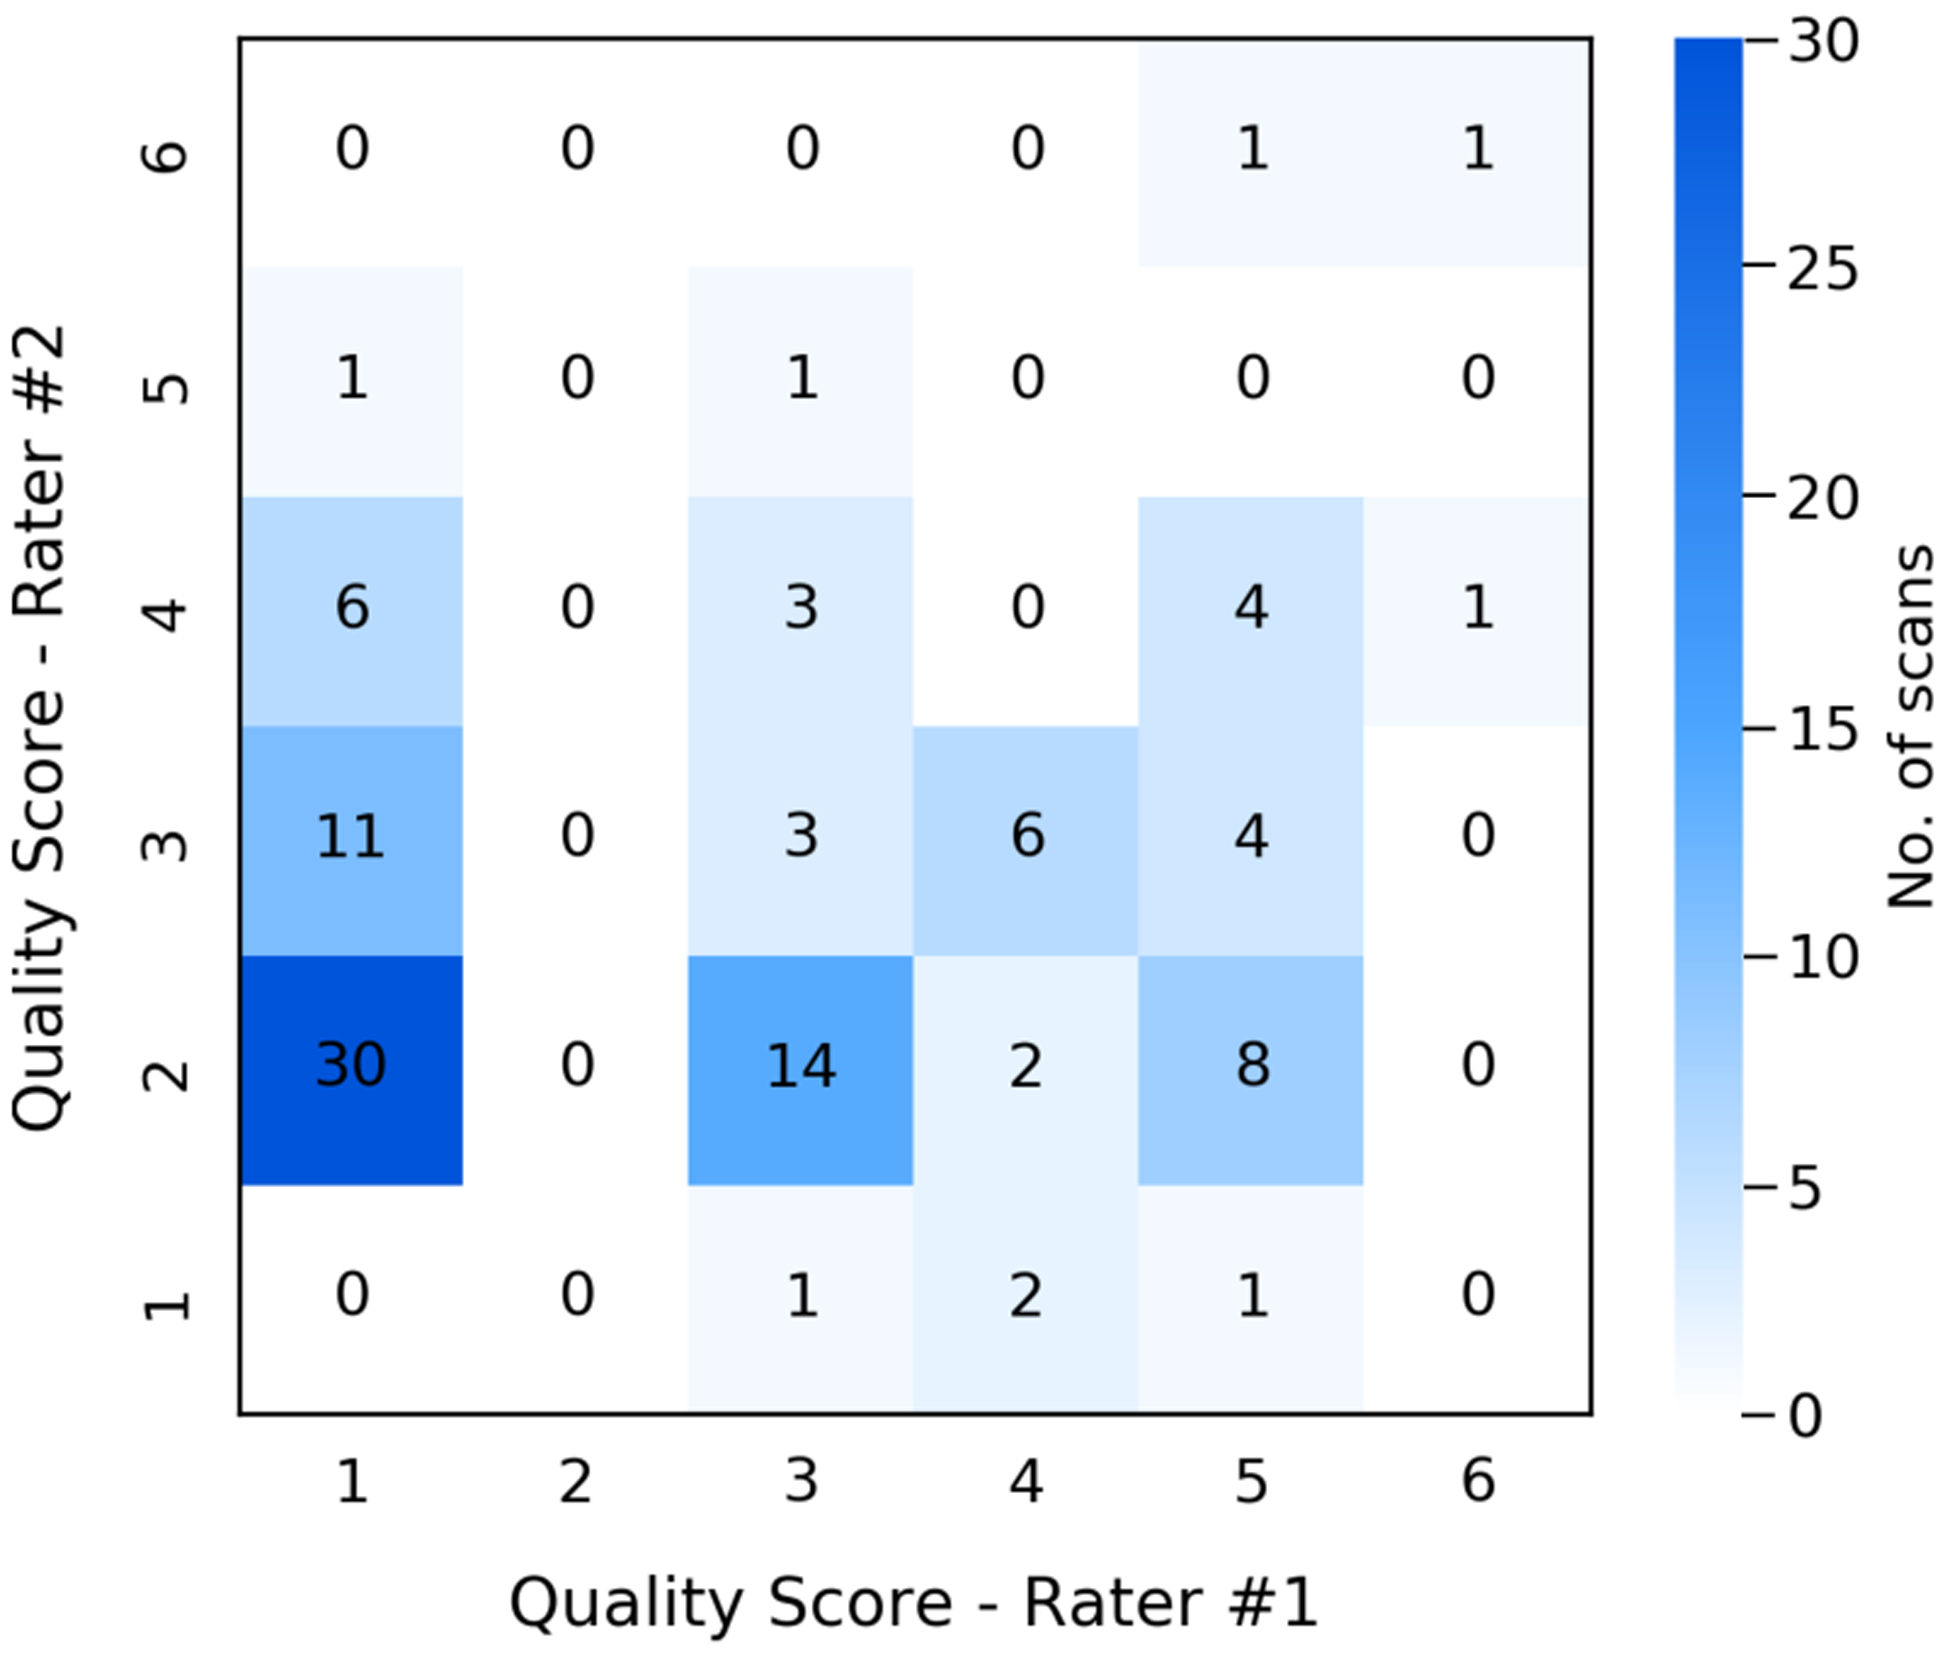
Distribution of quality scores given by two expert raters on the FOV extension quality of 100 random NLST scans with moderate to severe tissue truncation. The quality score system was defined from 1 (exceptional) to 9 (poor). As none of the sampled scans was assigned with score higher than 6 (Failed), we reduce the range as from 1 to 6 in the confusion matrix plot.
Fig. 10.
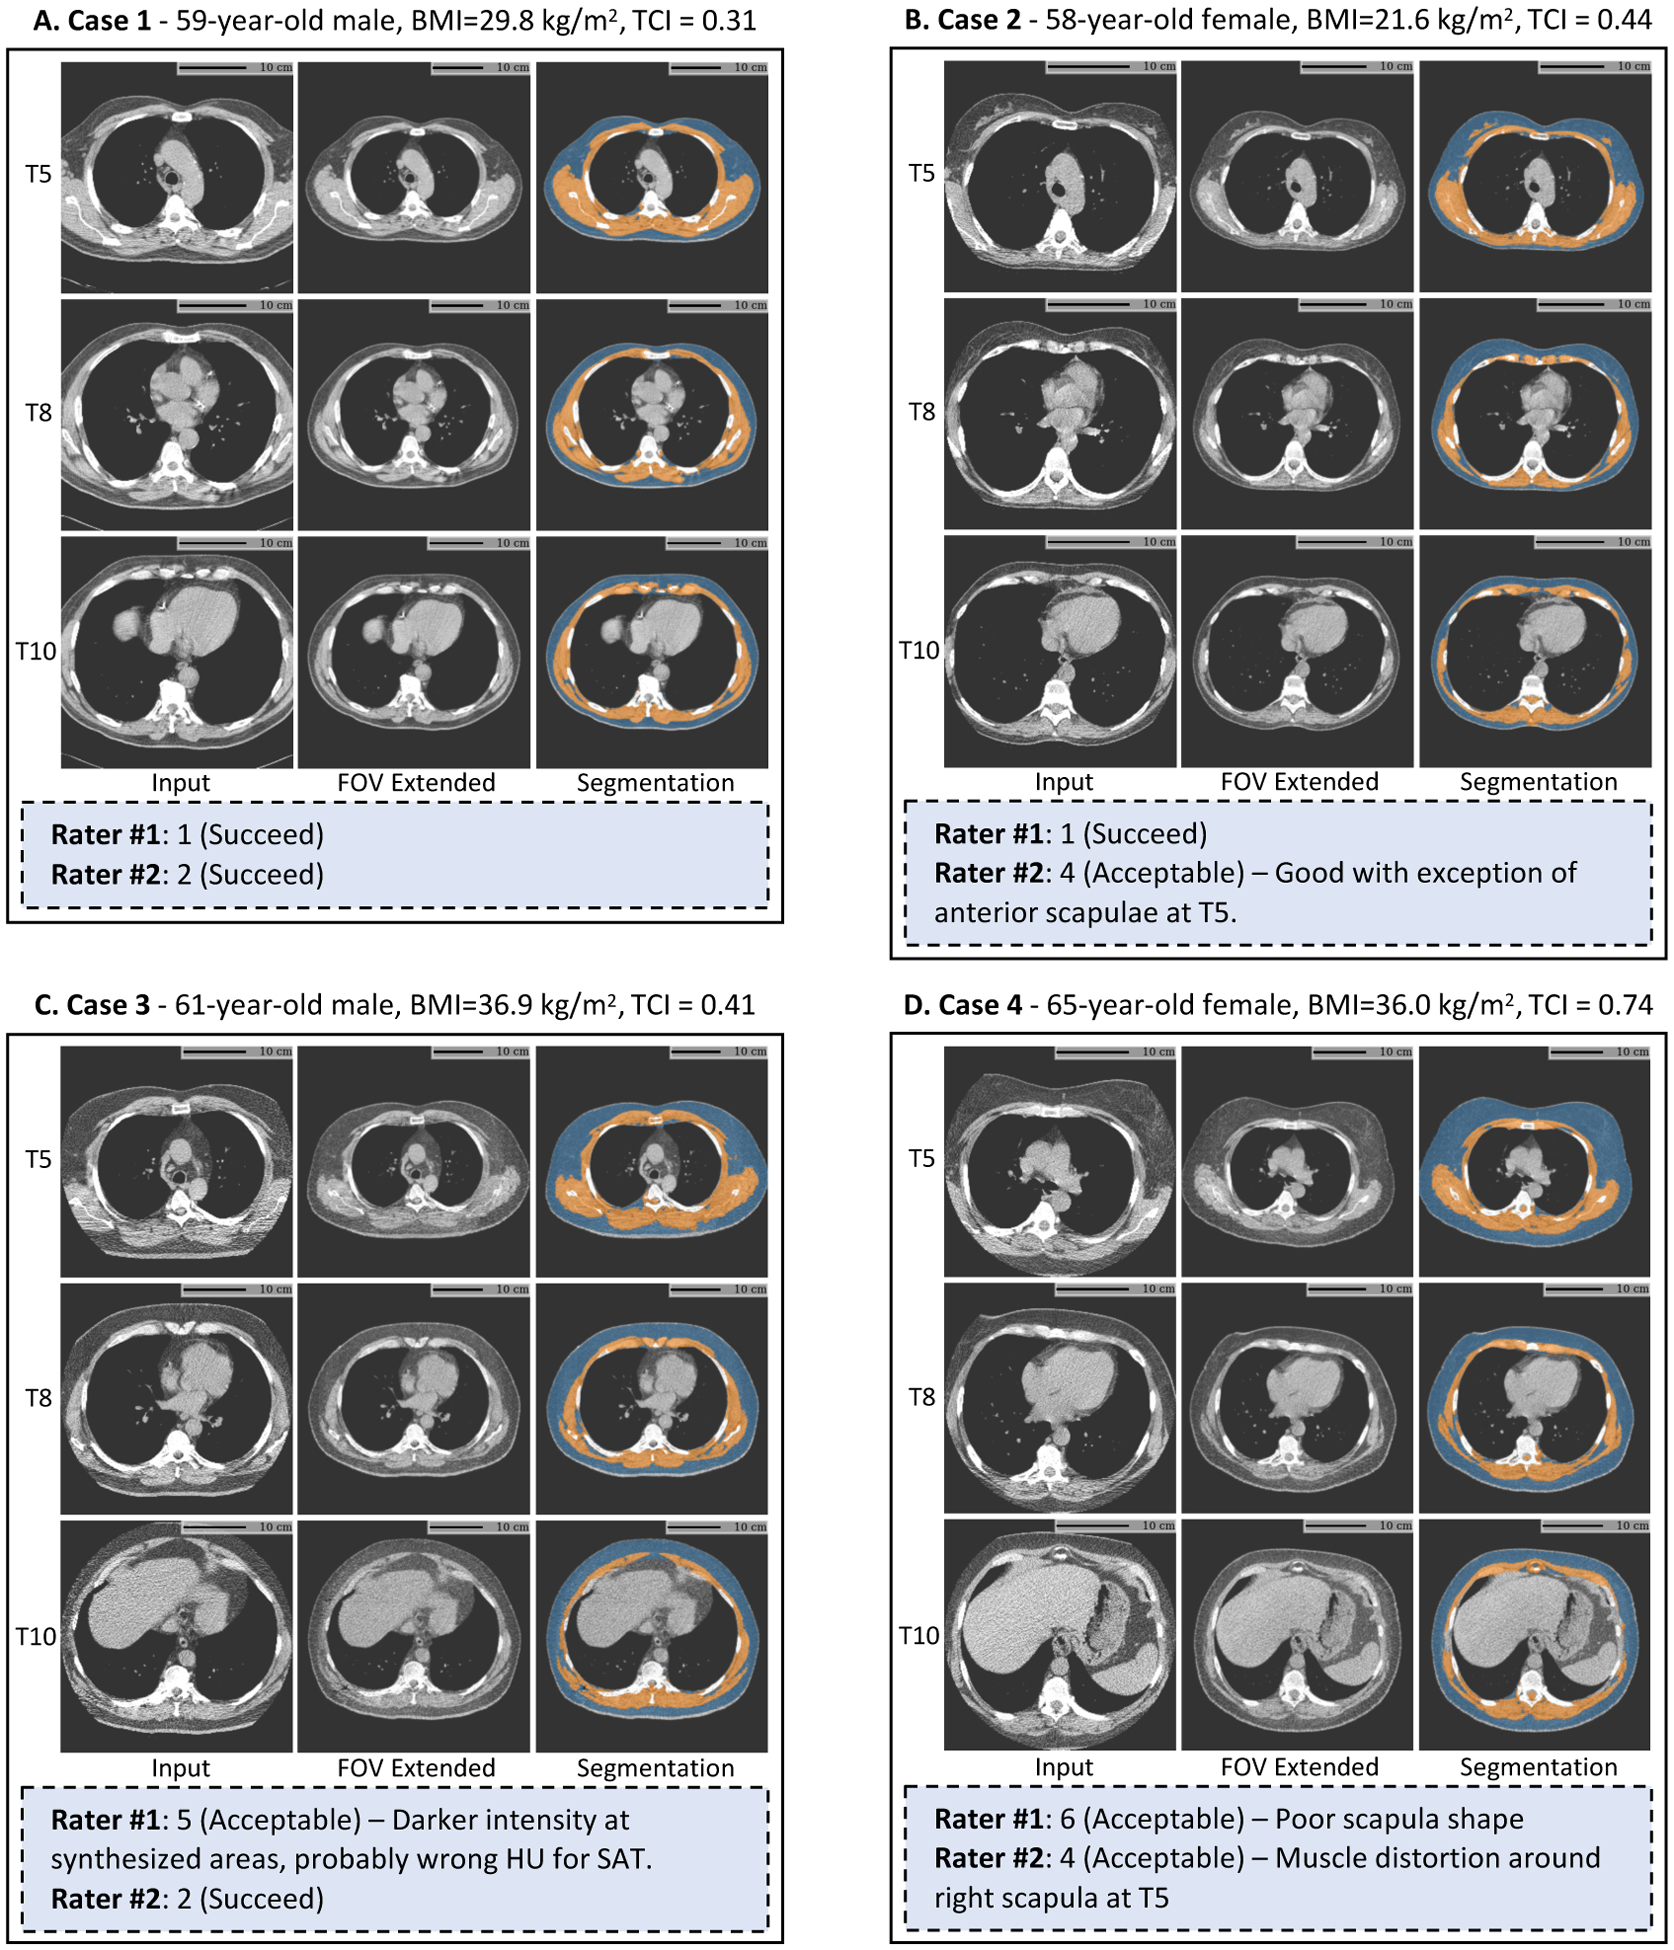
Results of BC assessment with FOV extension (image grid) and expert reviews (blue box) on lung screening LDCT with limited FOV. The pipeline identifies the axial slices corresponding to the T5, T8, and T10 vertebral bodies from 3D chest CT volume (first column). The FOV of each slice is extended with missing body tissue imputed (second column). The measurements of BC are based on the segmentation masks predicted on the FOV extended images (third column). The four selected cases are among the 100 NLST scans with moderate to severe truncation (TCI > 0.3) included for the expert quality review conducted with two trained experts (Section 3.4.2). All CT slices are displayed using window [−150, 150] HU. BC=Body Composition. FOV=Field-of-view. BMI=Body Mass Index. TCI=Tissue Truncation Index.
Intra-subject consistency.
For NLST, we identified all longitudinal pairs, e.g., the baseline screen and second follow-up screen of the same subject, which resulted in 3,110 pairs. As the time distance between two consecutive screens for the same subject was approximately fixed at one year based on NLST protocol, we put the identified pairs into two categories: 1-year-pair (2,081 pairs) and 2-year-pair (1,029 pairs). In consistency with NLST, we identified those longitudinal pairs in VLSP with time distance between 0.5 and 1.5 years and categorized these pairs as 1-year-pair (505 pairs), while longitudinal pairs with time distance between 1.5 and 2.5 years were identified and categorized as 2-year-pair (191 pairs). The longitudinal pairs were further stratified into different truncation severity level, where the pair-wise severity level was defined as the maximum severity level of the two paired scans. The correlations between the measurement results on two longitudinal scans were assessed using Spearman’s rank correlation coefficients with and with FOV extension. Statistical significance in difference between the correlations with and with FOV extension were assessed by the method of Silver et al. (2004), which compared two dependent correlations with non-overlapping variables. The results are summarized in Table 4.
Table 4.
The comparisons of intra-subject consistency between BC measurements on longitudinal scan pairs with and without FOV extension. The scan-wise BC measurements were defined as the summation of BC areas measured on the cross-sectional slices at T5, T8, and T10. For NLST, the intra-subject pairs were formed by the possible combinations of two screens for each subject, categorized into 1-year-pair and 2-year-pair based on the years of trial the two scans were conducted. For VLSP, pairs with time distance between 0.5 and 1.5 years were categorized as 1-year-pair, while pairs with time distance between 1.5 and 2.5 years were categorized as 2-year-pair in consistency with NLST. The pairs are further categorized into different truncation severity levels defined as the maximum of scan-wise truncation severity levels of the two paired scans. Spearman’s rank correlation coefficients with 95% confidence interval are reported. Results on groups with too few cases (e.g., less than six pairs) are not included. As FOV extension is not needed for pairs without truncation, only results on raw images are displayed when it is possible. Statistical significance are evaluated by method of (Silver et al., 2004) for comparison between two non-overlapping dependent correlations. The tests are two-sided, with p-values reported. BC=Body Composition. FOV=Field-of-view. SAT=Subcutaneous Adipose Tissue.
| SAT Area (cm2) | Muscle Area (cm2) | ||||||
|---|---|---|---|---|---|---|---|
| Cohort | Group (no. of pairs) | Without Correction | FOV Extended | p-value | Without Correction | FOV Extended | p-value |
| VLSP | No Truncation | ||||||
| 1-year-pair (N=13) | 0.967 (0.845,1.000) | - | - | 0.918 (0.659,0.994) | - | - | |
| 2-year-pair (N=6) | 0.886 (0.200, 1.000) | - | - | 0.771 (0.000, 1.000) | - | - | |
| Trace Truncation | |||||||
| 1-year-pair (N=233) | 0.946 (0.923, 0.961) | 0.941 (0.915, 0.958) | <.001 | 0.940 (0.914, 0.958) | 0.946 (0.923, 0.961) | <.001 | |
| 2-year-pair (N=79) | 0.894 (0.809, 0.947) | 0.893 (0.803, 0.951) | .89 | 0.955 (0.921,0.971) | 0.943 (0.895, 0.965) | .69 | |
| Mild Truncation | |||||||
| 1-year-pair (N=181) | 0.929 (0.896, 0.949) | 0.933 (0.899, 0.954) | .64 | 0.936 (0.908, 0.956) | 0.946 (0.922, 0.963) | .001 | |
| 2-year-pair (N=72) | 0.886 (0.797, 0.941) | 0.890 (0.805,0.944) | .69 | 0.911 (0.814, 0.962) | 0.925 (0.860, 0.961) | .49 | |
| Moderate Truncation | |||||||
| 1-year-pair (N=69) | 0.810 (0.701,0.881) | 0.908 (0.840, 0.947) | <.001 | 0.865 (0.751,0.931) | 0.944 (0.901,0.964) | <.001 | |
| 2-year-pair (N=31) | 0.762 (0.502, 0.898) | 0.906 (0.749, 0.967) | <.001 | 0.849 (0.663, 0.945) | 0.904 (0.806, 0.944) | .50 | |
| Severe Truncation | |||||||
| 1-year-pair (N=9) | 0.400 (−0.381,0.890) | 0.617 (−0.242,1.000) | .02 | 0.850 (0.352,1.000) | 0.983 (0.817, 1.000) | .16 | |
| 2-year-pair (N=3) | - | - | - | - | - | - | |
| Overall | |||||||
| 1-year-pair (N=505) | 0.950 (0.937, 0.959) | 0.961 (0.949, 0.969) | <.001 | 0.930 (0.910, 0.946) | 0.952 (0.940, 0.961) | <.001 | |
| 2-year-pair (N=191) | 0.927 (0.895, 0.947) | 0.941 (0.915, 0.959) | <.001 | 0.927 (0.889, 0.953) | 0.938 (0.912, 0.957) | .42 | |
| NLST | No Truncation | ||||||
| 1-year-pair (N=4) | - | - | - | - | - | - | |
| 2-year-pair (N=1) | - | - | - | - | - | - | |
| Trace Truncation | |||||||
| 1-year-pair (N=207) | 0.952 (0.932, 0.965) | 0.946 (0.923, 0.960) | <.001 | 0.934 (0.897, 0.959) | 0.927 (0.880, 0.955) | .028 | |
| 2-year-pair (N=105) | 0.955 (0.920, 0.972) | 0.951 (0.914, 0.970) | <.001 | 0.934 (0.886, 0.962) | 0.937 (0.898, 0.958) | .84 | |
| Mild Truncation | |||||||
| 1-year-pair (N=645) | 0.936 (0.922, 0.949) | 0.936 (0.921,0.948) | .96 | 0.942 (0.930, 0.952) | 0.936 (0.922, 0.947) | .21 | |
| 2-year-pair (N=329) | 0.885 (0.849, 0.911) | 0.886 (0.852, 0.915) | .50 | 0.912 (0.885,0.933) | 0.909 (0.880, 0.932) | .76 | |
| Moderate Truncation | |||||||
| 1-year-pair (N=853) | 0.901 (0.877, 0.918) | 0.926 (0.903, 0.942) | <.001 | 0.943 (0.935, 0.950) | 0.952 (0.943, 0.959) | <.001 | |
| 2-year-pair (N=388) | 0.875 (0.836, 0.904) | 0.898 (0.859, 0.927) | .026 | 0.941 (0.928, 0.950) | 0.953 (0.942, 0.960) | <.001 | |
| Severe Truncation | |||||||
| 1-year-pair (N=372) | 0.797 (0.751,0.837) | 0.916 (0.892, 0.934) | <.001 | 0.861 (0.818, 0.891) | 0.919 (0.893,0.939) | <.001 | |
| 2-year-pair (N=206) | 0.782 (0.707, 0.841) | 0.894 (0.854, 0.921) | <.001 | 0.833 (0.775, 0.875) | 0.917 (0.877,0.942) | <.001 | |
| Overall | |||||||
| 1-year-pair (N=2,081) | 0.912 (0.901,0.922) | 0.950 (0.942, 0.957) | <.001 | 0.944 (0.938, 0.949) | 0.951 (0.946, 0.956) | <.001 | |
| 2-year-pair (N=1,029) | 0.880 (0.859, 0.898) | 0.925 (0.909, 0.938) | <.001 | 0.933 (0.924, 0.940) | 0.948 (0.940, 0.955) | <.001 | |
Correlation with anthropometric approximation.
We obtained the anthropometric approximations of FFM, and FM indexes (kg/m2) based on the formulas described in Section 2.3.3. For VLSP, the required height and weight data were obtained before each of LDCT screen, with 1,246 scans with available corresponding anthropometric metrics. For NLST, the anthropometric data were obtained at enrollment right before the baseline screens. For this reason, the effectiveness of the approximation in NLST was expected to be strongest for the baseline screens and decreased for the follow-up screens. Thus, we categorized the NLST scans based on screen years: 1) Screen-0 (1,232 scans); Screen-1 (1,158 scans); and Screen-2 (1,112 scans). Screen-(0, 1, 2) represent the baseline screen, first follow-up screen, and second follow-up screen, respectively. We further categorized the scans by truncation severity levels. We assessed the correlation between measured SAT index and FM index and the correlation between muscle index and FFM index using Spearman’s rank correlation coefficients with and with FOV extension. Statistical significance in difference between the correlations with and with FOV extension were assessed by the method of Hittner et al. (2003), which compared two dependent correlations with overlapping variables. The results are summarized in Table 5.
Table 5.
The comparisons of correlation between the height-square normalized BC area indexes and anthropometric approximated BC indexes with and without FOV extension. SAT index (cm2/m2) was compared against FM index (kg/m2), and Muscle index (cm2/m2) was compared against FFM index (kg/m2). For VLSP, the anthropometric approximations were derived using weight and height obtained before each of the scan. For NLST, the approximations were derived from the height and weight information obtained at the baseline. Thus, we further stratified the NLST scans into years of the screen in addition to the truncation severity level. Spearman’s rank correlation coefficients with 95% confidence interval are reported. Statistical significance are evaluated by the method of (Hittner et al., 2003) for comparison between two overlapping dependent correlations. The tests are two-sided, with p-values reported. BC=Body Composition. FOV=Field-of-view. SAT=Subcutaneous Adipose Tissue. FM=Fat Mass. FFM=Fat-free Mass.
| SAT Index (cm2/m2) vs. FM Index (kg/m2) | Muscle Index (cm2/m2) vs. FFM Index (kg/m2) | ||||||
|---|---|---|---|---|---|---|---|
| Cohort | Severity Level (no. of scans) | Without Correction | FOV Extended | p-value | Without Correction | FOV Extended | p-value |
| VLSP | None (N=78) | 0.780 (0.657, 0.862) | - | - | 0.692 (0.545, 0.801) | - | - |
| Trace (N=690) | 0.798 (0.765, 0.826) | 0.801 (0.769, 0.829) | .27 | 0.658 (0.612, 0.703) | 0.681 (0.638, 0.721) | <.001 | |
| Mild (N=355) | 0.782 (0.734, 0.822) | 0.789 (0.743, 0.828) | .02 | 0.605 (0.532, 0.671) | 0.659 (0.596, 0.717) | <.001 | |
| Moderate to Severe (N=123) | 0.653 (0.535, 0.750) | 0.673 (0.556, 0.767) | .36 | 0.362 (0.172, 0.528) | 0.579 (0.415, 0.709) | <.001 | |
| Overall (N=1,246) | 0.837 (0.815, 0.855) | 0.845 (0.823,0.862) | <.001 | 0.606 (0.567, 0.646) | 0.668 (0.634, 0.699) | <.001 | |
| NLST | None | ||||||
| Screen-0 (N=9) | 0.762 (−0.078, 1.000) | - | - | 0.905 (0.315, 1.000) | - | - | |
| Screen-1 (N=5) | - | - | - | - | - | - | |
| Screen-2 (N=4) | - | - | - | - | - | - | |
| Trace | |||||||
| Screen-0 (N=226) | 0.737 (0.653, 0.806) | 0.735 (0.649, 0.805) | .08 | 0.698 (0.611,0.768) | 0.713 (0.632, 0.778) | .004 | |
| Screen-1 (N=211) | 0.712 (0.611,0.792) | 0.717 (0.618,0.795) | .15 | 0.708 (0.613, 0.785) | 0.725 (0.635, 0.796) | .01 | |
| Screen-2 (N=201) | 0.702 (0.616, 0.776) | 0.700 (0.615,0.773) | .41 | 0.704 (0.612, 0.780) | 0.724 (0.633, 0.794) | .19 | |
| Mild | |||||||
| Screen-0 (N=421) | 0.760 (0.707, 0.812) | 0.762 (0.708,0.811) | .48 | 0.705 (0.645, 0.754) | 0.714 (0.655, 0.766) | .65 | |
| Screen-1 (N=379) | 0.727 (0.663, 0.778) | 0.730 (0.670, 0.781) | .84 | 0.716 (0.656, 0.766) | 0.721 (0.661, 0.772) | .49 | |
| Screen-2 (N=390) | 0.711 (0.648, 0.764) | 0.710 (0.647, 0.767) | .34 | 0.707 (0.645, 0.761) | 0.698 (0.634, 0.754) | .98 | |
| Moderate to Severe | |||||||
| Screen-0 (N=577) | 0.762 (0.723, 0.795) | 0.818 (0.785,0.845) | <.001 | 0.709 (0.662, 0.748) | 0.746 (0.705, 0.779) | <.001 | |
| Screen-1 (N=562) | 0.711 (0.665, 0.750) | 0.758 (0.718, 0.791) | <.001 | 0.705 (0.656, 0.748) | 0.741 (0.696, 0.780) | <.001 | |
| Screen-2 (N=517) | 0.718 (0.668, 0.764) | 0.745 (0.696, 0.786) | <.001 | 0.668 (0.617, 0.715) | 0.712 (0.669, 0.752) | <.001 | |
| Overall | |||||||
| Screen-0 (N=1,232) | 0.778 (0.750, 0.803) | 0.818 (0.795,0.839) | <.001 | 0.714 (0.687,0.741) | 0.752 (0.727, 0.776) | <.001 | |
| Screen-1 (N=1,158) | 0.759 (0.729, 0.786) | 0.802 (0.777,0.825) | <.001 | 0.699 (0.667, 0.729) | 0.745 (0.718, 0.770) | <.001 | |
| Screen-2 (N=1,112) | 0.744 (0.712, 0.773) | 0.782 (0.753, 0.807) | <.001 | 0.694 (0.659, 0.726) | 0.731 (0.700, 0.757) | <.001 | |
4. Discussion
Effectiveness of semantic FOV extension.
In this work, we proposed a two-stage framework for semantic FOV extension of lung screening LDCT scans with limited FOV. For the first stage, our results indicated the trained model can successfully identify the bounding box of the complete body region given CT slice with limited FOV (third column of Fig 6). With an empirical extension ratio multiplier , the model can reliably extend the FOV border as such it can cover the complete body region (Section 3.3). For the second stage, the proposed training strategy produced models that could effectively predict the missing tissues in truncated regions (Fig 6, Fig 10, and Fig A.11). The proposed training strategy was effective for all three considered general-purpose image completion methods. A detailed comparison of the performance of these methods is given in Appendix A.
In the visual Turing test, the mean accuracy of the two experts to discriminate synthetic image from the real image was only 0.71, even on the most difficult cases (TCI > 0.3) and with hints of the potential synthetic region of the image. The effectiveness of the image completion was confirmed by the reduction in pixel-wise RMSE (Table 2). The anatomical consistency of the predicted contents was further confirmed by the BC assessment result, including the improved agreement in BC segmentation with original slice (Fig 6,Table 2 and Fig 10) and the correction for the BC assessment offset caused by FOV truncation (Table 2 and Fig 7).
Combining these observations, the proposed method successfully extended the FOV border and generated anatomical consistent contents in truncated regions.
Application validity for CT-based BC assessment in lung cancer screening.
To evaluate the application validity of the proposed method, we integrated the trained semantic FOV extension pipeline into a previously developed BC assessment pipeline as one additional processing module. The expert review of the application validity indicated that the results were reliable even on scans with relative severe FOV tissue truncation (TCI > 0.3). In certain cases that were associated with partially or entirely missing scapula, the reconstructed scapula bone structures could be distorted, which accounted for the primary cause of defect identified in expert review (Section 3.4.2, Fig 10 Case-2 and Fig 10 Case-4). However, the BC analysis results on these cases were still considered acceptable as most missing anatomical structures of BC components were recovered anatomically consistently (Fig 10).
The FOV extension correction significantly improved the overall intra-subject correlation for both SAT and muscle measurements in both of the two included datasets (Table 4). The improvement was consistent in both 1-year-pairs and 2-year-pairs. Lowered consistency were observed in 2-year-pairs, which could be explained by the longitudinal change in BC. The evaluation stratified by truncation severity level revealed that the overall improvement was mainly contributed by the significant improvement for those pairs with one or two scans with moderate to severe truncation. Among the pairs that consisted of scans with only trace truncation severity, slight decreases in longitudinal consistency of certain comparisons were observed after the FOV extension. This might be caused by the potential measurement error introduced by the decreased resolution due to the extension.
The overall correlations of SAT and muscle indexes with anthropometric approximated FFM and FM indexes were also improved significantly in both of the included datasets (Table 5). The stratified evaluation indicated the improvement was more significant for those scans with moderate to severe truncation. In NLST, the overall improvement was consistent for all three screen years. The correlation decreased with the increase in time distance between the scan year and baseline. This could be explained by the longitudinal change in BC, while the anthropometric approximations in NLST were obtained at baseline. In both NLST and VLSP, it is common for each of the severity groups alone to have lowered correlations compared to the overall dataset, even for those with none and trace truncation. This could be explained by the narrowed body composition distribution in each strata compared to the overall dataset (Table 3), where the variations in measurements themself could obscure the overall trend between the two measurements. Differences between VLSP and NLST were observed, where VLSP was associated with higher correlation between SAT index and FM index and lower correlation between Muscle index and FFM index. This can possibly be explained by the demographic difference between the two datasets (Table 1). Nevertheless, with the FOV correction, we find stronger correlations with anthropometric approximations in both VLSP (SAT index vs. FM index: 0.85; Muscle index vs. FFM index: 0.67) and NLST (Screen-0. SAT index vs. FM index: 0.82; Muscle index vs. FFM index: 0.75) comparing to the same correlations recently reported in (Pishgar et al., 2021) (SAT index vs. FM index: 0.80; Muscle index vs. FFM index: 0.62) on a subset of Multi-Ethnic Study of Atherosclerosis, where the BC measurements were derived by a semi-automatic regional assessment approach using routine chest CT. However, the effectiveness of this comparison may subject to the potential demographic difference between the cohorts included in these two studies.
These results indicated that the developed semantic FOV extension method improved the overall BC measurement quality and demonstrated the application validity of the method in opportunistic BC assessment using lung screening LDCT.
Limitations
Generalizability to limited FOV CT scans acquired with other clinical indications.
The semantic FOV extension method presented in this study was developed and tested on lung screening LDCT. These chest CT scans were acquired with specific imaging protocols, e.g., non-contrast, low dose, and optimized FOV, for a specific target population - older asymptomatic current and former heavy smokers, and for a specific clinical indication - early detection of lung cancer. Thus, the proposed method may not be well generalizable to CT scans acquired with different imaging protocols, target population, or clinical indications. Most noticeably, the cupping artifact, which is considered as common in CT scans with limited FOV (Ohnesorge et al., 2000; Hsieh et al., 2004; Sourbelle et al., 2005; Ketola et al., 2021; Huang et al., 2021), was not addressed in this study. Although this decision was intentional based on the extremely low occurrence of this issue observed in both of the two included lung screening LDCT datasets (Section 3.2), we recognize this as a limitation in terms of generalizability of the presented method. Specifically, the developed method is only applicable when the FOV truncations are caused by RFOV and DFOV, or a combination of both, and the truncations in projection data caused by SFOV do not have significant impact on the reconstructed image intensity inside the CT FOV. In addition, the inability of the developed pipeline to process scans with common imaging artifacts, e.g., beam hardening artifact, severe imaging noise, and non-standard body positioning (Section 3.2), may pose challenges for the application of the method in a more heterogeneous scenario. As the primary focus of this present study was on the application in lung screening LDCT, we left the development for a thorough solution to address these issues for future studies.
To further characterize the generalizability and potential limitations when applying to conventional chest CT scans, we evaluated our developed method on a third dataset, which consisted of chest CT scans acquired with a broader spectrum of clinical indications in daily clinical practice. The details of this evaluation are presented in Appendix C.
Reference measurements for application validity assessments.
In the application validity assessments on real lung screening LDCT data (Section 2.3.3), we employed the anthropometric approximations for FM and FFM indexes initially developed in Kuch et al. (2001) as references to assess the FOV extension method’s effectiveness in correcting the BC measurement error introduced by FOV tissue truncation. Though the same method has been used in later study Pishgar et al. (2021) to provide references in assessing the validity of CT-based SAT and muscle measurements, the anthropometric assessments of BC are known to subject to lowered sensitivity (Thibault et al., 2012). Other validated whole body BC measurements, e.g., those obtained by Bioelectrical Impedance Analysis or Dual-energy X-ray Absorptiometry, can provide validated references to assess the improvement in BC measurement accuracy (Thibault et al., 2012). In addition, using the raw projection data of the scans truncated by limited RFOV and DFOV to recover the missing tissues would provide the ultimate references to assess the effectiveness of the FOV extension method in real application (Section 2.2.2). However, due to limitations of the data source we were unable to perform these analyses.
5. Conclusion and Future Work
In this paper, we proposed a two-stage framework for slice-wise semantic FOV extension for lung screening LDCT scans with body tissue truncation caused by limited FOV. In the first stage, given a CT slice with incomplete body region, we predicted the extent of the complete body in the form of axis-aligned minimum bounding box. Based on this estimation, the original FOV border was extended to cover the estimated complete body region. The second stage was formulated as an image completion problem, where the model was trained to impute the missing body tissues in extended space. To generate paired data for both model development and evaluation, we designed a synthetic sample generation procedure simulating the FOV determination mechanism during CT acquisition. To evaluate the anatomical consistency of the generated body tissues, we utilized the pre-trained models in a previously developed deep learning BC assessment pipeline for lung cancer screening LDCT. In addition, we integrated the developed semantic FOV extension method into the BC assessment pipeline and evaluated the effectiveness of the method to correct BC assessment shift in the real application.
We developed the semantic FOV extension pipeline on a large lung cancer screening cohort. Evaluation results on synthetic samples indicated the developed pipeline can effectively identify the extent of the complete body and generate anatomically consistent tissues in the truncated regions. The pipeline also consistently corrected the BC measurement shifts caused by FOV truncation for CT slices with various truncation severity. To evaluate the validity on real FOV truncated data, we applied the BC assessment pipeline with semantic FOV extension module on the FOV truncation scans in VLSP and a subsample of the CT arm of NLST. We observed improvements in overall intra-subject consistency and overall correlation with anthropometric approximations for FFM and FM in both datasets.
The proposed method demonstrates the possibility for extending the FOV of CT image from the semantic image extension perspective. Instead of utilizing the CT projection data as mainly focused by current literature, our method seeks to solve the problem by learning a deep representation for complete body structures from a large dataset with complete body structures in FOV. For this reason, the developed method only requires data in the image domain as input, making it possible to extend the limited FOV in applications where the CT projection data are not available. However, the methodology is only applicable to certain types of limited FOV where the truncations are caused by RFOV and DFOV, or a combination of both, and the cupping artifacts that are associated with truncations caused by SFOV do not manifest.
From the clinical point-of-view, our work provides a solution for the prevalent issue of limited FOV in opportunistic CT-based BC assessment. Compared to the currently widely adopted solution of regional assessment, our method allows for the whole axial slice evaluation which is better correlated with full body evaluation and makes use of all visible anatomical information in the FOV. As such, BC assessment with our method has the potential to be more realistically correlated with clinical outcomes. A rigorous clinical comparison of the two approaches may be a valuable future study direction. In addition, the fully automatic BC assessment for lung screening LDCT has the potential to extend the value of the LDCT-based lung cancer screening, especially with the semantic FOV extension correction proposed in this work.
A two-stage framework for anatomically consistent field-of-view extension of CT
Operating in image domain without requirement for CT projection data
Demonstrated application validity in opportunistic body composition assessment using lung screening CT
Acknowledgments
This research is supported or partly supported by the following awards: NSF CAREER 1452485; R01 EB017230; R01 CA253923; U01 CA196405 to Massion; Grant UL1 RR024975-01 of the National Center for Research Resources and now Grant 2 UL1 TR000445-06 at the National Center for Advancing Translational Sciences; Martineau Innovation Fund Grant through the Vanderbilt-Ingram Cancer Center Thoracic Working Group; NCI Early Detection Research Network 2U01CA152662 to PPM; and IBM PhD Fellowship.
The authors thank the National Cancer Institute for access to the data collected by the National Lung Screening Trial.
Appendix A. Comparison of General-purpose Image Completion Methods for Stage-2
Following the strategy described in Section 2.1.2, we evaluated the following three general-purpose methods for image completion:
pix2pix (Isola et al., 2017). The method employed a conditional generative adversarial network (cGAN) to provide a solution for general-purpose image-to-image translation problems where image completion was among the example applications. The cGAN model learned a transformation from observed image space to target image space. The objective was to optimize the generator to produce predictions that cannot be distinguished by an adversarially trained discriminator, which is known as the adversarial loss. In addition to the adversarial loss, a traditional loss was also included to encourage the generator to produce a fake image that is near to the ground-truth. The final objective function was a combination of these two terms. The FOV region mask was not required for either the training or inference phase for pix2pix.
PConv-UNet (Liu et al., 2018). The method was based on the concept of partial convolution (PConv) which was a replacement for the normal convolution to handle the existence of invalid region in input images. In partial convolution operation, a mechanism was designed such that the outputs were only conditioned on valid pixels specified by a binary mask. The mask was updated through each layer in the forward pass, leading to a gradually shrinking invalid region. After passing through a sufficient number of stacked layers, the invalid region would eventually vanish. The method used a UNet-like structure similar to pix2pix as the generator, replacing all normal convolutional layers with partial convolution layers. The loss function contained multiple terms targeting both per-pixel reconstruction accuracy and semantic composition. This included (1) loss; (2) perceptual loss and style loss based on features extracted by a pretrained VGG-16 model; and (3) total variation loss. A valid region mask was required during both the training and inference phase.
RFR-Net (Li et al., 2020). Instead of imputing all missing regions in a single pass, the Recurrent Feature Reasoning (RFR) network took a recurrent strategy to first infer the contents near the valid region and then use the information as clues for further inference iteratively. In each iteration, the newly updated area was identified as the difference between the initial mask and the updated mask after several partial convolution layers. The missing features in this area were filled with a feature reasoning module with a UNet-like structure. The features generated in each iteration were merged to form a final feature map to generate the reconstructed image. In addition, an attention mechanism was introduced to improve the semantic consistency of the generated contents, especially with image contents at a far distance. The loss function was similar to PConv-UNet, including (1) loss; and (2) perceptual loss and style loss based on features extracted by a pretrained VGG-16 model. A valid region mask was also required for both training and inference stages.
In training, we set the batch-size to 20 and total training epoch to 80 for all three methods. For PConv-UNet and RFR-Net, we set the first 40 epoch in initial training mode and the last 40 epochs in finetune mode. For the convenience of reproducing and comparison, we followed the original literatures (Isola et al., 2017; Li et al., 2020; Liu et al., 2018) for the configuration of other training settings, which included the number of layers in models, the balancing weights of loss function terms, the optimization configurations, and learning rates.
We characterized the difference between three image completion solutions. Fig A.11 shows the results on the same synthetic sample by the three methods, where the generated reconstruction images are compared with the ground-truth image. The residue maps are shown as the heatmaps. The quantitative comparison of the three image completion methods is given in Table A.6. As shown in Fig A.11 and Table A.6, all three models were able to impute anatomically plausible contents in the truncated regions and correct the BC measurement offset. However, there was a size change in the reconstructed image generated by the pix 2 pix model (Fig A.11). This could be caused by the emphasis of the loss function toward the semantic consistency by the adversarial term instead of the reconstruction accuracy. The pix2pix model was originally optimized for image-to-image translation of natural images in which size change is irrelevant (Isola et al., 2017). However, this property was undesired for medical image applications like BC assessment. This caveat was further confirmed by the inferior performance in BC measurement correction comparing to two other methods (Table A.6). For PConv-UNet and RFR-Net, both methods maintained the size of the subject. On qualitative evaluation, RFR-Net generated anatomical structures closer to the ground-truth, which was a possible advantage of its recurrent inference strategy (Fig A.11). This observation was further confirmed by the quantitative results in Table A.6 as RFR-Net outperformed the other two methods consistently for all considered metrics.
Fig. A.11.
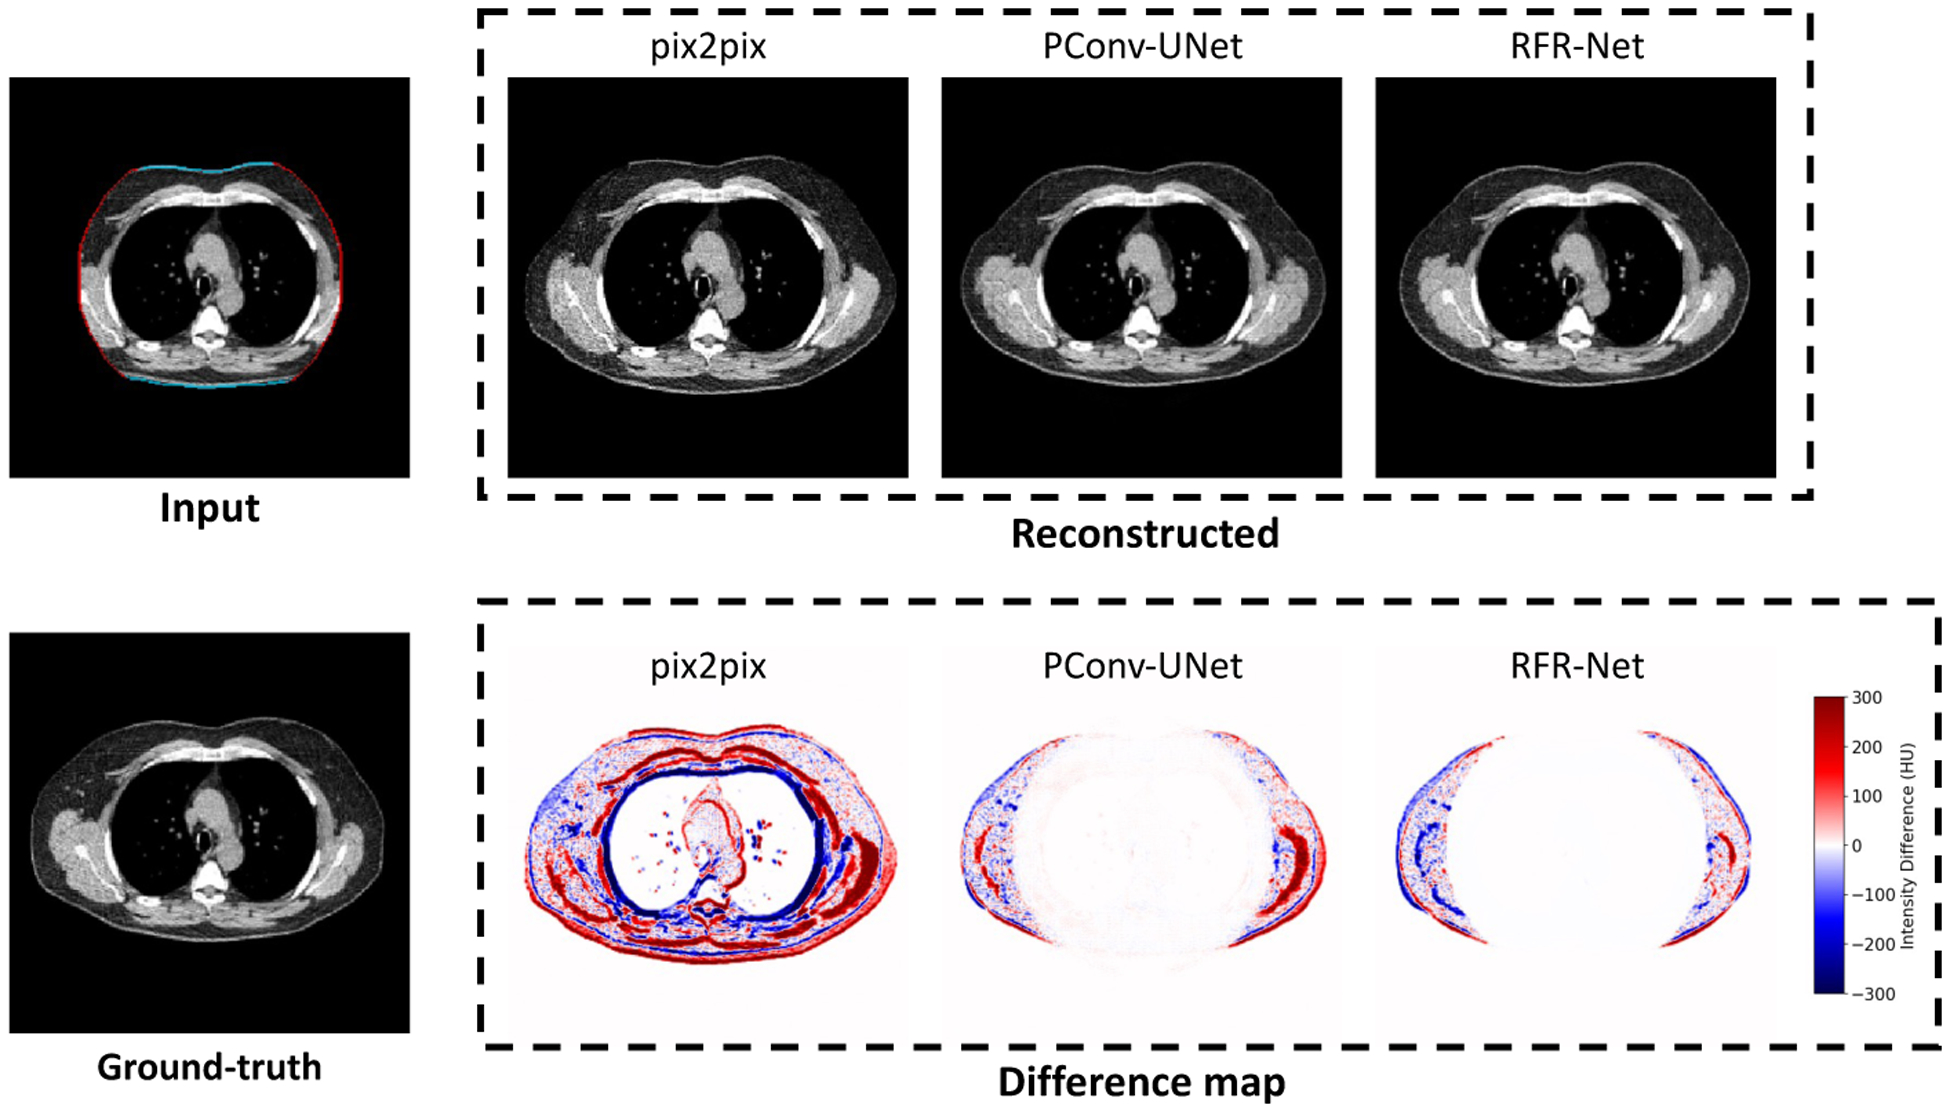
Comparison between three image completion methods for the missing tissue imputation in truncated region. The reconstructed slices show the direct outputs of each method. The difference maps are generated by subtracting the reconstructed slices with ground-truth slice.
Table A.6.
Quantitative comparison of the three general-purpose image completion models. The evaluation was based on pixel-wise RMSE and DSC, as well as the BC measurements including area (cm2) and attenuation (HU) of SAT and muscle, using the untruncated slice and the segmentation and measurements on it as ground-truth. RMSE=Root Mean Square Error. DSC=Dice Similarity Coefficients. BC=Body Composition. SAT=Subcutaneous Adipose Tissue. HU=Hounsfield Unit. SD=Standard Deviation. CI=Confidence Interval.
| Image Completion Method | |||
|---|---|---|---|
| Metric | pix2pix | PConv-UNet | RFR-Net |
| Pixel-wise RMSE (HU), Mean ± SD | 7.48 ± 4.48 | 6.52 ± 4.05 | 6.12 ± 4.09 |
| Dice Similarity Coefficient, Mean ± SD | 0.96 ± 0.04 | 0.96 ± 0.04 | 0.97 ± 0.03 |
| SAT Area (cm2), RMSE (95% CI) | 9.83 (9.11, 10.70) | 8.79 (8.14, 9.66) | 7.42 (6.79, 8.26) |
| SAT Attenuation (HU), RMSE (95% CI) | 1.91 (1.80, 2.04) | 1.48 (1.40, 1.60) | 1.20 (1.13, 1.29) |
| Muscle Area (cm2), RMSE (95% CI) | 3.95 (3.67, 4.29) | 3.58 (3.32, 3.91) | 3.28 (2.99, 3.63) |
| Muscle Attenuation (HU), RMSE (95% CI) | 1.16 (1.10, 1.24) | 1.02 (0.96, 1.09) | 0.89 (0.84, 0.97) |
Appendix B. Identification of Body, Field-of-view, and Lung Masks
The development and evaluation of the proposed method replied on multiple binary masks specifying certain regions in thoracic CT volume. This included the FOV mask, lung mask, and body mask. Here, we describe the solutions we employed in our study to automatically generated these masks.
FOV mask.
As introduced in Section 2.2.2, once the cross-sectional FOV pattern is determined, it is replicated through all cross-sectional slices in a CT volume. The pixels inside this 3D FOV region are considered valid, with intensity value representing the HU of the physical material at the represented spatial location, while the pixels in the non-FOV region are without any physical correspondence and need to be imputed with a predefined value to form the final square shape image. In the DICOM standard, this value is termed Pixel Padding Value, which, by its design, should be outside of the range of normal HU for the ease of identification of the non-FOV regions in application. However, in real application, depending on the scanner manufactures, the value may fall in the normal range of HU or without specification in the header data structure. For this reason, we designed the following algorithm to retrieve the FOV mask following a data-driven approach.
With the assumption that the imputation value is constant across all axial slices of the same CT scan, the intensity variation along the vertical direction of the axial plane is zero in the non-FOV cross-sectional region. On the contrary, this variation is non-zero for the FOV cross-sectional region due to the intensity difference of different materials and intrinsic noise during data acquisition. Based on this observation, we obtained the FOV masks by identifying the cross-sectional region with non-zero vertical intensity variations. This trick reliably retrieved the FOV masks for most of the lung screening CT scans in our study cohort. In a small amount of CT scans, mainly in the NLST, the lower bound of intensity window was set as −1000 (HU of air), which lead to zero vertical intensity variation regions even inside the FOV region. We mitigated the problem by retrieving the convex hull of the identified non-zero vertical intensity variation region.
When padding and resizing the CT slices with FOV truncation and corresponding FOV masks as described in Section 2.1, care must be taken to avoid the interpolation between the FOV and non-FOV regions, as the operators may lead to unrealistic pixel values near the FOV borders. If such interpolation is unavoidable, a certain amount of recession of FOV regions and corresponding intensity correction are necessary to eliminate the artificial pixel values. The amount of this recession can be estimated by applying the same operator on the floating-point binary FOV masks, and identifying the pixels with value between zero and one.
Lung mask.
The lung masks were generated using the segmentation model developed in (Hofmanninger et al., 2020), with pretrained model available at (https://github.com/JoHof/lungmask). The model was based on 2D UNet and performed prediction of lung region on individual slices. The model was developed on a large and diverse cohort with wide range of variation in FOV.
Body mask.
We used the morphology-based 3D body mask identification tool initially developed in (Tang et al., 2021a) for body region identification in abdominal and whole-body CT. The method converted the input image into a binary mask using HU threshold of −500. Then, the largest connected region was identified, which was followed by slice-wise hole filling operation to impute the lung regions.
Appendix C. Generalizability on Conventional Chest CT beyond Lung Cancer Screening
The primary target of this present study was to develop a solution for the systematic FOV truncation problem for lung screening LDCT, which was a prohibitive factor for the application of opportunistic BC assessment (Section 1). In Section 3, we demonstrated the effectiveness and application validity of the developed FOV extension method. However, it is unknown if the developed method can be generalized to clinically acquired chest CT beyond lung cancer screening. In this additional evaluation, we sought to characterize the generalizability and potential limitations of the developed FOV extension method, as well as the enhanced BC assessment pipeline, for opportunistic BC assessment using routine diagnostic chest CT images. As the primary interest was to characterize on how many and on which types of cases the method would fail, the evaluation was mainly based on qualitative visual assessment.
The Longitudinal ImageVU (LiVU) cohort was a retrospective chest CT study cohort initially designed for longitudinal evaluation of incidental lung nodule, which was sampled from the ImageVU system (https://victr.vumc.org/our-programs/), a large medical imaging databank that collects the routine diagnostic imaging studies conducted at Vanderbilt University Medical Center (VUMC). The inclusion criteria of LiVU selected those ImageVU subjects with three consecutive chest CT studies in five years, without any additional selection criteria. As such, the associated chest CT scans were acquired with a broad spectrum of clinical indications. We randomly sampled 953 subjects from the LiVU cohort, and selected one scan per subject to form an evaluation dataset. All data were de-identified under internal review board supervision (IRB#181279). Particularly, the scan dates were randomly shifted with up to one year. The the de-identified scan dates located between 2000 and 2019, with most (94.1%) of them after 2014. 57 scans with keyword “DERIVED” or “SECONDARY” included in the DICOM tag “Image Type Attribute (0008, 0009)” were excluded, as these scans were not acquired directly from the CT scanners and were processed, e.g., affine transformed, before saving as DICOM data. We identified 15 intravenous (IV) contrast cases with significantly lowered intensity in SAT and skeletal muscle comparing to the standard HU scale. These 15 CT scans were acquired from a same dualsource CT scanner (Siemens ® SOMATOM Force ™) with ultra low-dose technique implementation. We excluded these scans as the technique is known to impact quantitative imaging analyses (Wang et al., 2015) and lack of generalizability (Vonder et al., 2021). This led to a dataset consists of 881 scans acquired from 12 model types of 5 scanner manufacturers. Table C.8 shows the characterization of the imaging protocol of this dataset.
The developed multi-level BC assessment pipeline with FOV extension correction was applied on this dataset. We reviewed the quality of generated results which include both the FOV extended images, and the BC segmentation masks at the three levels. 151 (17.1%) cases were identified with certain types of defects. The failure rate was higher in the contrasted cases, with 19.5% (115 out of 591) compared to 12.4% (36 out of 290) in non-contrast cases. We identified 19 (2.2%) FOV truncation cases associated with cupping artifacts, where the developed pipeline failed to process. The segmentation module failed on 64 (7.3%) pleural effusion cases, as the module failed to distinguish the high intensity region in the lung from the muscle tissue. We identified 52 (5.9%) cases with non-standard body positioning. In addition, 20 (2.3%) cases were failed due to severe image noise or beam hardening artifact caused by metal implant. Typical examples of each failure mode are given in Table C.7.
In conclusion, we observed a significant higher failure rate in the LiVU dataset. This could be explained by the deviations in both of the scan protocols and patient characteristics comparing to the lung screening LDCT datasets. For instance, the occurrence of cupping artifact in scans with FOV truncation was significantly more frequent in the LiVU dataset than in the two included lung screening LDCT datasets (Section 3.2). In addition, a significant portion of the scans in LiVU dataset were with IV contrast, while IV contrast is usually not included in the lung cancer screening protocols (Gierada et al., 2009; Kazerooni et al., 2014). Pleural effusion was more prevalent in the routine clinical scenarios that requiring a chest CT study comparing to the asymptomatic screening context. The standard body positioning for lung screening LDCT, with both arms above head, may not be required or difficult to implement in certain clinical indications. All these factors contribute to the challenges for the generalization of the developed method on routine clinical chest CT scans.
Table C.7.
Representative cases for identified failure mode in LiVU dataset. All images are displayed using window [−150, 150] HU. FOV=Field-of-view. BC=Body Composition. SAT=Subcutaneous Adipose Tissue.
| Failure Mode | Explanation | Input | FOV Extended | BC Segmentation |
|---|---|---|---|---|
| Body Positioning | Non-standard body positioning with arms in FOV, resulting in addition area measured comparing to normal positioning. |
|
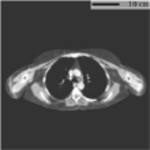
|
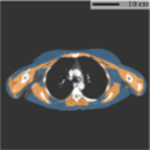
|
| Cupping Artifact | The increased intensity at the FOV border causing shift from standard HU. The method cannot mitigate this artifact, resulting in inaccurate BC segmentation. |
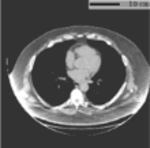
|
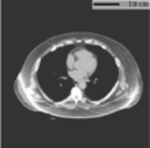
|
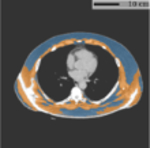
|
| Intravenous Contrast | Typical observed failure pattern associated with contrasted scans. Parts of muscle and SAT are missing in the segmentation mask. |
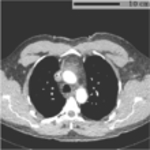
|
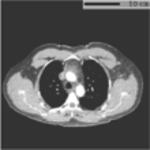
|
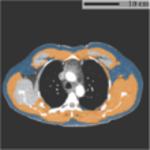
|
| Pleural Effusion | The segmentation module failed to distinguish the high intensity region in the lung (pleural effusion) from the muscle tissue. |
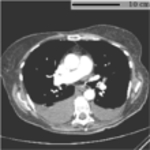
|
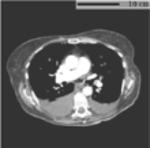
|
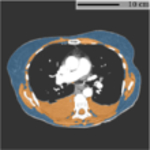
|
| Beam Hardening Artifact | Severe imaging noise and beam hardening artifact associated with metal implant, resulting in inaccurate BC segmentation. |
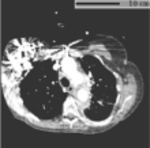
|
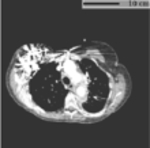
|
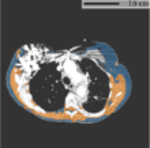
|
Table C.8.
Image protocol information of sampled LiVU dataset. SD=Standard Deviation.
| Parameter | Value |
|---|---|
| Effective mAs ± SD | 131.9 ± 81.1 |
| kVp ± SD | 108.6 ± 16.9 |
| Display FOV (cm) ± SD | 37.7 ± 4.9 |
| No. case with IV contrast (%) | 591 (63.8) |
Footnotes
Publisher's Disclaimer: This is a PDF file of an unedited manuscript that has been accepted for publication. As a service to our customers we are providing this early version of the manuscript. The manuscript will undergo copyediting, typesetting, and review of the resulting proof before it is published in its final form. Please note that during the production process errors may be discovered which could affect the content, and all legal disclaimers that apply to the journal pertain.
Declaration of interests
The authors declare that they have no known competing financial interests or personal relationships that could have appeared to influence the work reported in this paper.
References
- American College of Radiology, 2022. Lung cancer screening center designation (revised 11-9-2022). Available online: https://accreditationsupport.acr.org/support/solutions/11000003422. Accessed: 2023-01-20. [Google Scholar]
- Armanious K, Kumar V, Abdulatif S, Hepp T, Gatidis S, Yang B, 2020. ipA-MedGAN: Inpainting of Arbitrary Regions in Medical Imaging, in: 2020 IEEE International Conference on Image Processing (ICIP), IEEE. pp. 3005–3009. doi: 10.1109/ICIP40778.2020.9191207. [DOI] [Google Scholar]
- Bak SH, Kwon SO, Han SS, Kim WJ, 2019. Computed tomography-derived area and density of pectoralis muscle associated disease severity and longitudinal changes in chronic obstructive pulmonary disease: a case control study. Respiratory Research 20, 226. doi: 10.1186/s12931-019-1191-y. [DOI] [PMC free article] [PubMed] [Google Scholar]
- Best TD, Mercaldo SF, Bryan DS, Marquardt JP, Wrobel MM, Bridge CP, Troschel FM, Javidan C, Chung JH, Muniappan A, Bhalla S, Meyers BF, Ferguson MK, Gaissert HA, Fintelmann FJ, 2022. Multilevel Body Composition Analysis on Chest Computed Tomography Predicts Hospital Length of Stay and Complications After Lobectomy for Lung Cancer. Annals of Surgery 275, e708–e715. doi: 10.1097/SLA.0000000000004040. [DOI] [PubMed] [Google Scholar]
- Bridge CP, Best TD, Wrobel MM, Marquardt JP, Magudia K, Javidan C, Chung JH, Kalpathy-Cramer J, Andriole KP, Fintelmann FJ, 2022. A Fully Automated Deep Learning Pipeline for Multi-Vertebral Level Quantification and Characterization of Muscle and Adipose Tissue on Chest CT Scans. Radiology: Artificial Intelligence 4. doi: 10.1148/ryai.210080. [DOI] [PMC free article] [PubMed] [Google Scholar]
- Bridge CP, Rosenthal M, Wright B, Kotecha G, Fintelmann F, Troschel F, Miskin N, Desai K, Wrobel W, Babic A, Khalaf N, Brais L, Welch M, Zellers C, Tenenholtz N, Michalski M, Wolpin B, Andriole K, 2018. Fully-Automated Analysis of Body Composition from CT in Cancer Patients Using Convolutional Neural Networks BT - OR 2.0 Context-Aware Operating Theaters, Computer Assisted Robotic Endoscopy, Clinical Image-Based Procedures, and Skin Image Analysis, in: Context-Aware Operating Theaters, Computer Assisted Robotic Endoscopy, Clinical Image-Based Procedures, and Skin Image Analysis. CARE CLIP OR 2.0 ISIC 2018, Springer International Publishing, Cham. pp. 204–213. [Google Scholar]
- Chuquicusma MJM, Hussein S, Burt J, Bagci U, 2018. How to fool radiologists with generative adversarial networks? A visual turing test for lung cancer diagnosis, in: 2018 IEEE 15th International Symposium on Biomedical Imaging (ISBI 2018), IEEE. pp. 240–244. doi: 10.1109/ISBI2018.8363564. [DOI] [Google Scholar]
- Fintelmann FJ, Troschel FM, Mario J, Chretien YR, Knoll SJ, Muniappan A, Gaissert HA, 2018. Thoracic Skeletal Muscle Is Associated With Adverse Outcomes After Lobectomy for Lung Cancer. The Annals of Thoracic Surgery 105, 1507–1515. doi: 10.1016/j.athoracsur.2018.01.013. [DOI] [PubMed] [Google Scholar]
- Fournié É, Baer-Beck M, Stierstorfer K, 2019. CT Field of View Extension Using Combined Channels Extension and Deep Learning Methods, in: Medical Imaging with Deep Learning (MIDL), pp. 1–4. [Google Scholar]
- Gazourian L, Durgana CS, Huntley D, Rizzo GS, Thedinger WB, Regis SM, Price LL, Pagura EJ, Lamb C, Rieger-Christ K, Thomson CC, Stefanescu CF, Sanayei A, Long WP, McKee AB, Washko GR, Estépar RSJ, Wald C, Liesching TN, McKee BJ, 2020. Quantitative Pectoralis Muscle Area is Associated with the Development of Lung Cancer in a Large Lung Cancer Screening Cohort. Lung 198, 847–853. doi: 10.1007/s00408-020-00388-5. [DOI] [PMC free article] [PubMed] [Google Scholar]
- Gierada DS, Garg K, Nath H, Strollo DC, Fagerstrom RM, Ford MB, 2009. CT Quality Assurance in the Lung Screening Study Component of the National Lung Screening Trial: Implications for Multicenter Imaging Trials. American Journal of Roentgenology 193, 419–424. doi: 10.2214/AJR.08.1995. [DOI] [PMC free article] [PubMed] [Google Scholar]
- Hittner JB, May K, Silver NC, 2003. A monte carlo evaluation of tests for comparing dependent correlations. The Journal of general psychology 130, 149–168. [DOI] [PubMed] [Google Scholar]
- Hofmanninger J, Prayer F, Pan J, Röhrich S, Prosch H, Langs G, 2020. Automatic lung segmentation in routine imaging is primarily a data diversity problem, not a methodology problem. European Radiology Experimental 4, 50. doi: 10.1186/s41747-020-00173-2. [DOI] [PMC free article] [PubMed] [Google Scholar]
- Hsieh J, Chao E, Thibault J, Grekowicz B, Horst A, McOlash S, Myers TJ, 2004. A novel reconstruction algorithm to extend the CT scan field-ofview. Medical Physics 31, 2385–2391. doi: 10.1118/1.1776673. [DOI] [PubMed] [Google Scholar]
- Huang Y, Preuhs A, Manhart M, Lauritsch G, Maier A, 2021. Data Extrapolation From Learned Prior Images for Truncation Correction in Computed Tomography. IEEE Transactions on Medical Imaging 40, 3042–3053. doi: 10.1109/TMI.2021.3072568. [DOI] [PubMed] [Google Scholar]
- Iizuka S, Simo-Serra E, Ishikawa H, 2017. Globally and locally consistent image completion. ACM Transactions on Graphics 36, 1–14. doi: 10.1145/3072959.3073659. [DOI] [Google Scholar]
- Isola P, Zhu JY, Zhou T, Efros AA, 2017. Image-to-Image Translation with Conditional Adversarial Networks, in: 2017 IEEE Conference on Computer Vision and Pattern Recognition (CVPR), IEEE. pp. 5967–5976. doi: 10.1109/CVPR.2017.632 [DOI] [Google Scholar]
- Kang SK, Shin SA, Seo S, Byun MS, Lee DY, Kim YK, Lee DS, Lee JS, 2021. Deep learning-Based 3D inpainting of brain MR images. Scientific Reports 11, 1673. doi: 10.1038/s41598-020-80930-w. [DOI] [PMC free article] [PubMed] [Google Scholar]
- Kazerooni EA, Austin JH, Black WC, Dyer DS, Hazelton TR, Leung AN, McNitt-Gray MF, Munden RF, Pipavath S, 2014. Acr-str practice parameter for the performance and reporting of lung cancer screening thoracic computed tomography (ct). Journal of Thoracic Imaging 29, 310–316. URL: https://journals.lww.com/00005382-201409000-00012, doi: 10.1097/RTI.0000000000000097. [DOI] [PubMed] [Google Scholar]
- Ketola JH, Heino H, Juntunen MAK, Nieminen MT, Inkinen SI, 2021. Deep learning-based sinogram extension method for interior computed tomography, in: Bosmans H, Zhao W, Yu L (Eds.), Medical Imaging 2021: Physics of Medical Imaging, SPIE. p. 123. doi: 10.1117/12.2580886. [DOI] [Google Scholar]
- Kim EY, Kim YS, Park I, Ahn HK, Cho EK, Jeong YM, Kim JH, 2016. Evaluation of sarcopenia in small-cell lung cancer patients by routine chest CT. Supportive Care in Cancer 24, 4721–4726. doi: 10.1007/s00520-016-3321-0. [DOI] [PubMed] [Google Scholar]
- Krishnan D, Teterwak P, Sarna A, Maschinot A, Liu C, Belanger D, Freeman W, 2019. Boundless: Generative Adversarial Networks for Image Extension, in: 2019 IEEE/CVF International Conference on Computer Vision (ICCV), IEEE. pp. 10520–10529. doi: 10.1109/ICCV.2019.01062. [DOI] [Google Scholar]
- Krist AH, Davidson KW, Mangione CM, Barry MJ, Cabana M, Caughey AB, Davis EM, Donahue KE, Doubeni CA, Kubik M, Landefeld CS, Li L, Ogedegbe G, Owens DK, Pbert L, Silverstein M, Stevermer J, Tseng CW, Wong JB, 2021. Screening for Lung Cancer. JAMA 325, 962. doi: 10.1001/jama.2021.1117. [DOI] [PubMed] [Google Scholar]
- Kuch B, Gneiting B, Döring A, Muscholl M, Bröckel U, Schunkert H, Hense HW, 2001. Indexation of left ventricular mass in adults with a novel approximation for fat-free mass. Journal of Hypertension 19, 135–142. doi: 10.1097/00004872-200101000-00018. [DOI] [PubMed] [Google Scholar]
- Lenchik L, Barnard R, Boutin RD, Kritchevsky SB, Chen H, Tan J, Cawthon PM, Weaver AA, Hsu FC, 2021. Automated Muscle Measurement on Chest CT Predicts All-Cause Mortality in Older Adults From the National Lung Screening Trial. The Journals of Gerontology: Series A 76, 277–285. doi: 10.1093/gerona/glaa141. [DOI] [PMC free article] [PubMed] [Google Scholar]
- Li J, Wang N, Zhang L, Du B, Tao D, 2020. Recurrent Feature Reasoning for Image Inpainting, in: 2020 IEEE/CVF Conference on Computer Vision and Pattern Recognition (CVPR), IEEE. pp. 7757–7765. doi: 10.1109/CVPR42600.2020.00778. [DOI] [Google Scholar]
- Liu G, Reda FA, Shih KJ, Wang TC, Tao A, Catanzaro B, 2018. Image Inpainting for Irregular Holes Using Partial Convolutions BT - Computer Vision – ECCV 2018, in: Ferrari V, Hebert M, Sminchisescu C, Weiss Y (Eds.), Computer Vision - ECCV 2018, Springer International Publishing, Cham. pp. 89–105. [Google Scholar]
- Magudia K, Bridge CP, Bay CP, Babic A, Fintelmann FJ, Troschel FM, Miskin N, Wrobel WC, Brais LK, Andriole KP, Wolpin BM, Rosenthal MH, 2021. Population-Scale CT-based Body Composition Analysis of a Large Outpatient Population Using Deep Learning to Derive Age-, Sex-, and Race-specific Reference Curves. Radiology 298, 319–329. doi: 10.1148/radiol.2020201640. [DOI] [PMC free article] [PubMed] [Google Scholar]
- Mathur S, Rozenberg D, Verweel L, Orsso CE, Singer LG, 2020. Chest computed tomography is a valid measure of body composition in individuals with advanced lung disease. Clinical Physiology and Functional Imaging 40, 360–368. doi: 10.1111/cpf.12652 [DOI] [PubMed] [Google Scholar]
- McDonald MLN, Diaz AA, Ross JC, San Jose Estepar R, Zhou L, Regan EA, Eckbo E, Muralidhar N, Come CE, Cho MH, Hersh CP, Lange C, Wouters E, Casaburi RH, Coxson HO, MacNee W, Rennard SI, Lomas DA, Agusti A, Celli BR, Black-Shinn JL, Kinney GL, Lutz SM, Hokanson JE, Silverman EK, Washko GR, 2014. Quantitative Computed Tomography Measures of Pectoralis Muscle Area and Disease Severity in Chronic Obstructive Pulmonary Disease. A CrossSectional Study. Annals of the American Thoracic Society 11, 326–334. doi: 10.1513/AnnalsATS.201307-2290C. [DOI] [PMC free article] [PubMed] [Google Scholar]
- Nazeri K, Ng E, Joseph T, Qureshi F, Ebrahimi M, 2019. EdgeConnect: Structure Guided Image Inpainting using Edge Prediction, in: 2019 IEEE/CVF International Conference on Computer Vision Workshop (ICCVW), IEEE. pp. 3265–3274. doi: 10.1109/ICCVW.2019.00408. [DOI] [Google Scholar]
- Ogawa K, Nakajima M, Yuta S, 1984. A reconstruction algorithm from truncated projections. IEEE Transactions on Medical Imaging 3, 34–40. doi: 10.1109/TMI.1984.4307648. [DOI] [PubMed] [Google Scholar]
- Ohnesorge B, Flohr T, Schwarz K, Heiken JP, Bae KT, 2000. Efficient correction for CT image artifacts caused by objects extending outside the scan field of view. Medical Physics 27, 39–46. doi: 10.1118/1.598855. [DOI] [PubMed] [Google Scholar]
- Pathak D, Krahenbuhl P, Donahue J, Darrell T, Efros AA, 2016. Context Encoders: Feature Learning by Inpainting, in: 2016 IEEE Conference on Computer Vision and Pattern Recognition (CVPR), IEEE. pp. 2536–2544. doi: 10.1109/CVPR.2016.278. [DOI] [Google Scholar]
- Pickhardt PJ, 2022. Value-added Opportunistic CT Screening: State of the Art. Radiology 303, 241–254. doi: 10.1148/radiol.211561. [DOI] [PMC free article] [PubMed] [Google Scholar]
- Pickhardt PJ, Summers RM, Garrett JW, 2021. Automated CT-Based Body Composition Analysis: A Golden Opportunity. Korean Journal of Radiology 22, 1934. doi: 10.3348/kjr.2021.0775. [DOI] [PMC free article] [PubMed] [Google Scholar]
- Pishgar F, Shabani M, Quinaglia AC Silva T, Bluemke DA, Budoff M, Barr RG, Allison MA, Post WS, Lima JAC, Demehri S, 2021. Quantitative Analysis of Adipose Depots by Using Chest CT and Associations with All-Cause Mortality in Chronic Obstructive Pulmonary Disease: Longitudinal Analysis from MESArthritis Ancillary Study. Radiology 299, 703–711. doi: 10.1148/radiol.2021203959. [DOI] [PMC free article] [PubMed] [Google Scholar]
- Rezatofighi H, Tsoi N, Gwak J, Sadeghian A, Reid I, Savarese S, 2019. Generalized Intersection Over Union: A Metric and a Loss for Bounding Box Regression, in: 2019 IEEE/CVF Conference on Computer Vision and Pattern Recognition (CVPR), IEEE. pp. 658–666. doi: 10.1109/CVPR.2019.00075 [DOI] [Google Scholar]
- Ruchala KJ, Olivera GH, Kapatoes JM, Reckwerdt PJ, Mackie TR, 2002. Methods for improving limited field-of-view radiotherapy reconstructions using imperfect a priori images. Medical Physics 29, 2590–2605. doi: 10.1118/1.1513163. [DOI] [PubMed] [Google Scholar]
- Salimova N, Hinrichs JB, Gutberlet M, Meyer BC, Wacker FK, von Falck C, 2022. The impact of the field of view (FOV) on image quality in MDCT angiography of the lower extremities. European Radiology 32, 2875–2882. doi: 10.1007/s00330-021-08391-x. [DOI] [PMC free article] [PubMed] [Google Scholar]
- Schaapveld M, Aleman BM, van Eggermond AM, Janus CP, Krol AD, van der Maazen RW, Roesink J, Raemaekers JM, de Boer JP, Zijlstra JM, van Imhoff GW, Petersen EJ, Poortmans PM, Beijert M, Lybeert ML, Mulder I, Visser O, Louwman MW, Krul IM, Lugtenburg PJ, van Leeuwen FE, 2011. Reduced lung-cancer mortality with low-dose computed tomographic screening. New England Journal of Medicine 365, 395–409. URL: http://www.nejm.org/doi/10.1056/NEJMoa1505949http://www.nejm.org/doi/10.1056/NEJMoa1102873, doi: 10.1056/NEJMoa1102873. [DOI] [PMC free article] [PubMed] [Google Scholar]
- Schlegl T, Seeböck P, Waldstein SM, Langs G, Schmidt-Erfurth U, 2019. f-AnoGAN: Fast unsupervised anomaly detection with generative adversarial networks. Medical Image Analysis 54, 30–44. doi: 10.1016/j.media.2019.01.010 [DOI] [PubMed] [Google Scholar]
- Seeram E, 2015. Computed Tomography-E-Book: Physical Principles, Clinical Applications, and Quality Control. 4th editio ed., Elsevier Health Sciences. [Google Scholar]
- Shen L, Zhu W, Wang X, Xing L, Pauly JM, Turkbey B, Harmon SA, Sanford TH, Mehralivand S, Choyke PL, Wood BJ, Xu D 2021. Multi-Domain Image Completion for Random Missing Input Data. IEEE Transactions on Medical Imaging 40, 1113–1122. doi: 10.1109/TMI.2020.3046444 [DOI] [PMC free article] [PubMed] [Google Scholar]
- Shen W, Punyanitya M, Wang Z, Gallagher D, St.-Onge MP, Albu J, Heymsfield SB, Heshka, 2004. Total body skeletal muscle and adipose tissue volumes: estimation from a single abdominal cross-sectional image. Journal of Applied Physiology 97, 2333–2338. doi: 10.1152/japplphysiol.00744.2004. [DOI] [PubMed] [Google Scholar]
- Silver NC, Hittner JB, May K, 2004. Testing dependent correlations with nonoverlapping variables: A monte carlo simulation. The Journal of Experimental Education 73, 53–69. [Google Scholar]
- Sourbelle K, Kachelriess M, Kalender WA, 2005. Reconstruction from truncated projections in CT using adaptive detruncation. European Radiology 15, 1008–1014. doi: 10.1007/s00330-004-2621-9. [DOI] [PubMed] [Google Scholar]
- Tang Y, Gao R, Han S, Chen Y, Gao D, Nath V, Bermudez C, Savona MR, Bao S, Lyu I, Huo Y, Landman BA, 2021a. Body Part Regression With Self-Supervision. IEEE Transactions on Medical Imaging 40, 1499–1507. doi: 10.1109/TMI.2021.3058281 [DOI] [PMC free article] [PubMed] [Google Scholar]
- Tang Y, Tang Y, Zhu Y, Xiao J, Summers RM, 2021b. A disentangled generative model for disease decomposition in chest X-rays via normal image synthesis. Medical Image Analysis 67, 101839. doi: 10.1016/j.media.2020.101839. [DOI] [PubMed] [Google Scholar]
- Thibault R, Genton L, Pichard C, 2012. Body composition: Why, when and for who? Clinical Nutrition 31, 435–447. doi: 10.1016/j.clnu.2011.12.011. [DOI] [PubMed] [Google Scholar]
- Troschel AS, Troschel FM, Best TD, Gaissert HA, Torriani M, Muniappan A, Van Seventer EE, Nipp RD, Roeland EJ, Temel JS Fintelmann FJ, 2020. Computed Tomography-based Body Composition Analysis and Its Role in Lung Cancer Care. Journal of Thoracic Imaging 35, 91–100. doi: 10.1097/RTI.0000000000000428. [DOI] [PubMed] [Google Scholar]
- Troschel AS, Troschel FM, Muniappan A, Gaissert HA, Fintelmann FJ, 2019. Role of skeletal muscle on chest computed tomography for risk stratification of lung cancer patients. Journal of Thoracic Disease 11, S483–S484. doi: 10.21037/jtd.2019.01.73 [DOI] [PMC free article] [PubMed] [Google Scholar]
- Vonder M, Dorrius MD, Vliegenthart R, 2021. Latest ct technologies in lung cancer screening: Protocols and radiation dose reduction. Translational Lung Cancer Research 10, 1154–1164. doi: 10.21037/tlcr-20-808. [DOI] [PMC free article] [PubMed] [Google Scholar]
- Wang R, Sui X, Schoepf UJ, Song W, Xue H, Jin Z, Schmidt B, Flohr TG, Canstein C, Spearman JV, Chen J, Meinel FG, 2015. Ultralow-radiation-dose chest ct: Accuracy for lung densitometry and emphysema detection. American Journal of Roentgenology 204, 743–749. doi: 10.2214/AJR.14.13101 [DOI] [PubMed] [Google Scholar]
- Wang Y, Tao X, Shen X, Jia J, 2019. Wide-Context Semantic Image Extrapolation, in: 2019 IEEE/CVF Conference on Computer Vision and Pattern Recognition (CVPR), IEEE. pp. 1399–1408. doi: 10.1109/CVPR.2019.00149 [DOI] [Google Scholar]
- Weston AD, Korfiatis P, Kline TL, Philbrick KA, Kostandy P, Sakinis T, Sugimoto M, Takahashi N, Erickson BJ, 2019. Automated Abdominal Segmentation of CT Scans for Body Composition Analysis Using Deep Learning. Radiology 290, 669–679. doi: 10.1148/radiol.2018181432. [DOI] [PubMed] [Google Scholar]
- Xu K, Gao R, Tang Y, Deppen S, Sandler K, Kammer M, Antic S, Maldonado F, Huo Y, Khan M, Landman BA, 2022. Extending the value of routine lung screening CT with quantitative body composition assessment, in: Išgum I, Colliot O (Eds.), Medical Imaging 2022: Image Processing, SPIE. p. 54. doi: 10.1117/12.2611784. [DOI] [PMC free article] [PubMed] [Google Scholar]
- Yu J, Lin Z, Yang J, Shen X, Lu X, Huang T, 2019. Free-Form Image Inpainting With Gated Convolution, in: 2019 IEEE/CVF Internationa Conference on Computer Vision (ICCV), IEEE. pp. 4470–4479. doi: 10.1109/ICCV.2019.00457. [DOI] [Google Scholar]
- Zhou Z, Rahman Siddiquee MM, Tajbakhsh N, Liang J, 2018. UNet++ A Nested U-Net Architecture for Medical Image Segmentation BT - Deep Learning in Medical Image Analysis and Multimodal Learning for Clinical Decision Support, in: Stoyanov D, Taylor Z, Carneiro G, Syeda-Mahmood T, Martel A, Maier-Hein L, Tavares JMRS, Bradley A, Papa JP, Belagiannis V, Nascimento JC, Lu Z, Conjeti S, Moradi M, Greenspan H, Madabhushi A (Eds.), Deep Learning in Medical Image Analysis and Multimodal Learning for Clinical Decision Support. DLMIA ML-CDS 2018, Springer International Publishing, Cham. pp. 3–11. [DOI] [PMC free article] [PubMed] [Google Scholar]


