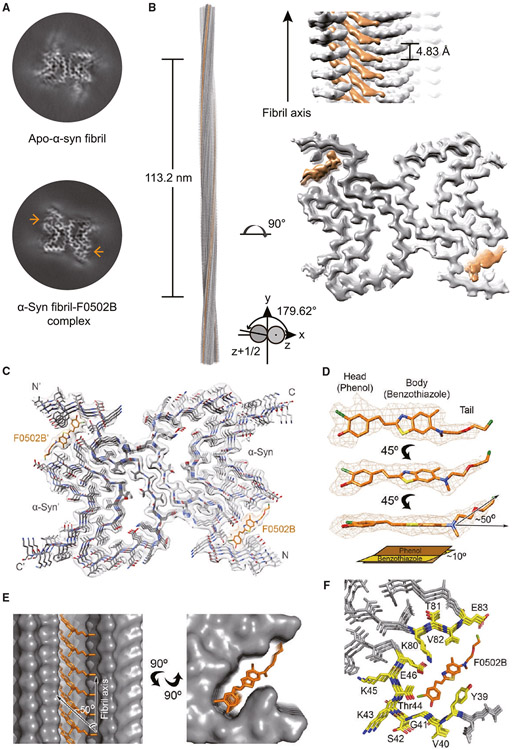
Figure 5. Cryo-EM structure of the α-Syn fibril-F0502B complex.
(A) Central slices of the 3D maps of the apo-α-Syn fibril (top) and α-Syn fibril-F0502B complex (bottom). The additional densities are indicated by arrows.
(B) Cryo-EM 3D reconstruction density map of the α-Syn fibril-F0502B complex. Fibril parameters including the length of half pitch (180° helical turn), twist angle, and helical rise are indicated. Extra densities are colored in orange.
(C) Cross-section view of the structural model of the α-Syn fibril-F0502B complex fitted in the density map. α-Syn is colored in gray. Ligand F0502B is colored in orange.
(D) Enlarged view of the F0502B structural model superimposed with the ligand density (mesh). The dihedral angle between the phenol and benzothiazole-ethenyl planes is ~10°. The angle between the fluoro tail and the benzothiazole-ethenyl plane is ~50°.
(E) Views of F0502B molecules stacking in the ligand-binding tunnel along the fibril axis (side view, left; top view, right). The surface of α-Syn fibril is shown and colored in gray. F0502B is shown in sticks and colored in orange. The angle between the F0502B body plane and fibril axis is ~50°.
(F) Enlarged top view of the F0502B binding cavity with the surrounding residues shown in sticks and highlighted in yellow.
See also Figure S5.

