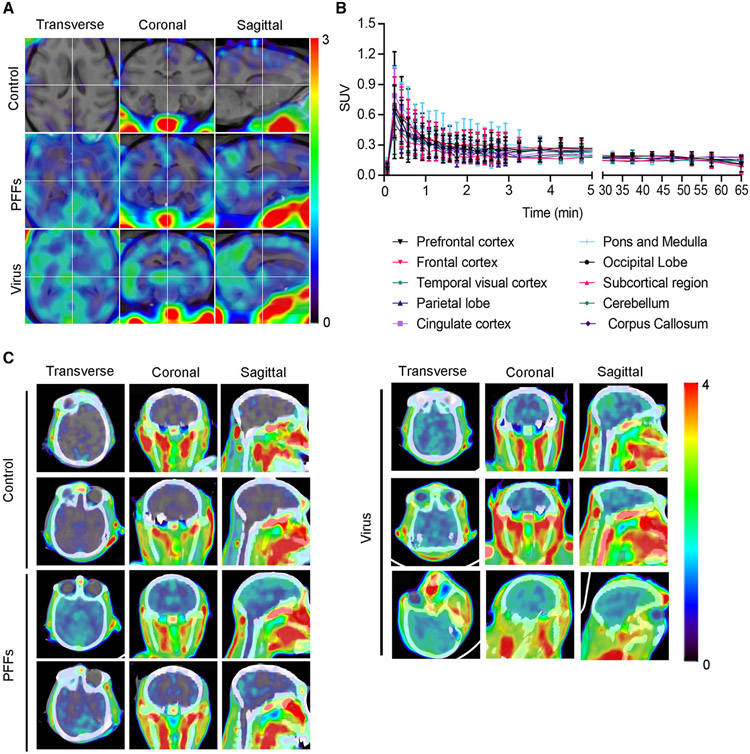
Figure 7. PET imaging of non-human primate PD models with [18F]-F0502B.
(A) [18F]-F0502B detects signals in the brains of macaques injected with α-Syn PFFs and AAV-α-Syn A53T, but not in the brains of control macaques. PET images in each row represent the standardized uptake value (percentage of injected dose per cubic centimeter [%ID/cc] × body weight) averaged over a 30 min period at 60 min post injection, co-registered to an MRI imaging template, from left to right showing axial, coronal and sagittal views.
(B) Time course of the standardized uptake value (SUV) in control macaque brain regions after injection of [18F]-F0502B. Each point represents the average of the three subjects. Error bars represent the mean ± SEM. Data are representative of 3 independent experiments.
(C) PET-CT images of α-Syn aggregates in the brains of control, α-Syn PFFs-, and AAV-α-Syn A53T-injected macaques.

