

Abstract
Background –
Impairments in carbohydrate, lipid, and amino acid metabolism drive features of plaque instability. However, where these impairments occur within the atheroma remains largely unknown. Therefore, we sought to characterize the spatial distribution of metabolites within stable and unstable atherosclerosis in both the fibrous cap and necrotic core.
Methods –
Atherosclerotic tissue specimens from nine unmatched individuals were scored based on the Stary classification scale and subdivided into stable and unstable atheromas. After performing mass spectrometry imaging (MSI) on these samples, we identified over 850 metabolite-related peaks. Using MetaboScape, METASPACE, and HMDB, we confidently annotated 170 of these metabolites and found over 60 of these were different between stable and unstable atheromas. We then integrated these results with an RNA-sequencing dataset comparing stable and unstable human atherosclerosis.
Results –
Upon integrating our MSI results with the RNAseq dataset, we discovered that pathways related to lipid metabolism and long-chain fatty acids were enriched in stable plaques, whereas reactive oxygen species, aromatic amino acid, and tryptophan metabolism were increased in unstable plaques. In addition, acylcarnitines and acylglycines were increased in stable plaques whereas tryptophan metabolites were enriched in unstable plaques. Evaluating spatial differences in stable plaques revealed lactic acid in the necrotic core, whereas pyruvic acid was elevated in the fibrous cap. In unstable plaques, 5-hydroxyindoleacetic acid was enriched in the fibrous cap.
Conclusions –
Our work herein represents the first step to defining an atlas of metabolic pathways involved in plaque destabilization in human atherosclerosis. We anticipate this will be a valuable resource and open new avenues of research in cardiovascular disease.
Keywords: Mass Spectrometry Imaging, Atherosclerosis, Metabolites
Keywords: Inflammation, Pathophysiology
Keywords: Arteriosclerosis, Thrombosis, Vascular Biology
Graphical Abstract
INTRODUCTION
Despite the considerable advancements in diagnostic techniques and therapeutic strategies, atherosclerotic cardiovascular disease (ASCVD) remains the leading cause of morbidity and mortality worldwide1. Acute thrombogenic events that lead to myocardial infarction and stroke are frequently caused by the rupture of unstable plaques, characterized by the presence of a large necrotic core covered by a thin fibrous cap2,3. In contrast, stable plaques show thicker, collagen-rich fibrous caps with smaller necrotic cores. Understanding these features of plaque stability has provided a framework for much of the work regarding the complexity of mechanisms that eventually lead to ASCVD-related events.
There is a growing interest in elucidating the mechanisms that govern plaque instability, which has so far highlighted dysregulations in lipid, carbohydrate, and amino acid metabolism4–9. Impaired metabolism plays a critical role in all stages of atherosclerosis, from its inception as a benign fatty streak to the precipitation of acute clinical events. However, where these impairments occur in the atherosclerotic plaque has yet to be revealed. This is critically important because lipid deposition, cell composition, and extracellular matrix remodeling are heterogeneous throughout human atheromas, particularly in regions of the fibrous cap and near the necrotic core. Furthermore, lesional cells are constantly bombarded with various intrinsic and extrinsic metabolic insults that influence cell phenotype4,5. While our understandings of metabolism in atherosclerosis are being elucidated, technical limitations have prevented investigators from determining where these dysregulations in metabolism occur within the plaque.
Mass spectrometry imaging (MSI) is a powerful technology for visualizing the spatial localization and relative abundance of hundreds to thousands of analytes in thin tissue sections without a priori knowledge of analytes present in the samples10. Imaging is performed using matrix-assisted laser desorption/ionization (MALDI) to interrogate small areas, or pixels, from a tissue surface after adding a chemical matrix to the section, which serves to extract, co-crystallize, and ionize molecules from the sample11. With the capability to image hundreds-to-thousands of molecules without labeling, the information gained from mass spectrometry and the visualization of its spatial distributions makes this platform uniquely suited to characterize the spatial distribution of metabolites within an atherosclerotic plaque. In the present study, we performed MALDI-MSI of late-stage, stable and unstable human atherosclerotic plaques to visualize the distribution of metabolites in the fibrous cap and necrotic core.
MATERIALS AND METHODS
The data not provided in this manuscript that support the findings of this study are available from the corresponding authors upon reasonable request. An expanded materials and methods section can be found in the online supplemental file.
Human atheroma specimen collection and scoring
Human tissue was deemed non-human research by the local IRB due to the exclusive use of post-mortem samples. Human tissue was excised postmortem during autopsy and fixed in 4% formaldehyde, embedded in paraffin, then cut into 5 μm sections. Based on stains described in Figure 1, sections were scored into type I (lesions with macrophage foam cells), type II (fatty streaks with intracellular lipid accumulation), type III (increased presence of extracellular lipid pools), type IV (presence of necrotic core and fibrous cap), or type V (similar to type IV except with the presence of spotty calcific nodules or calcific sheets)12.
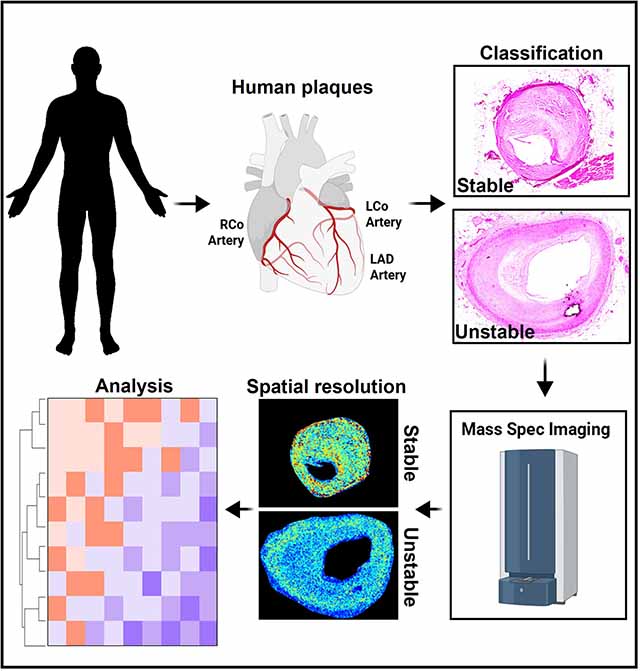
Figure 1. Mass Spectrometry Imaging of Human Atheromas.
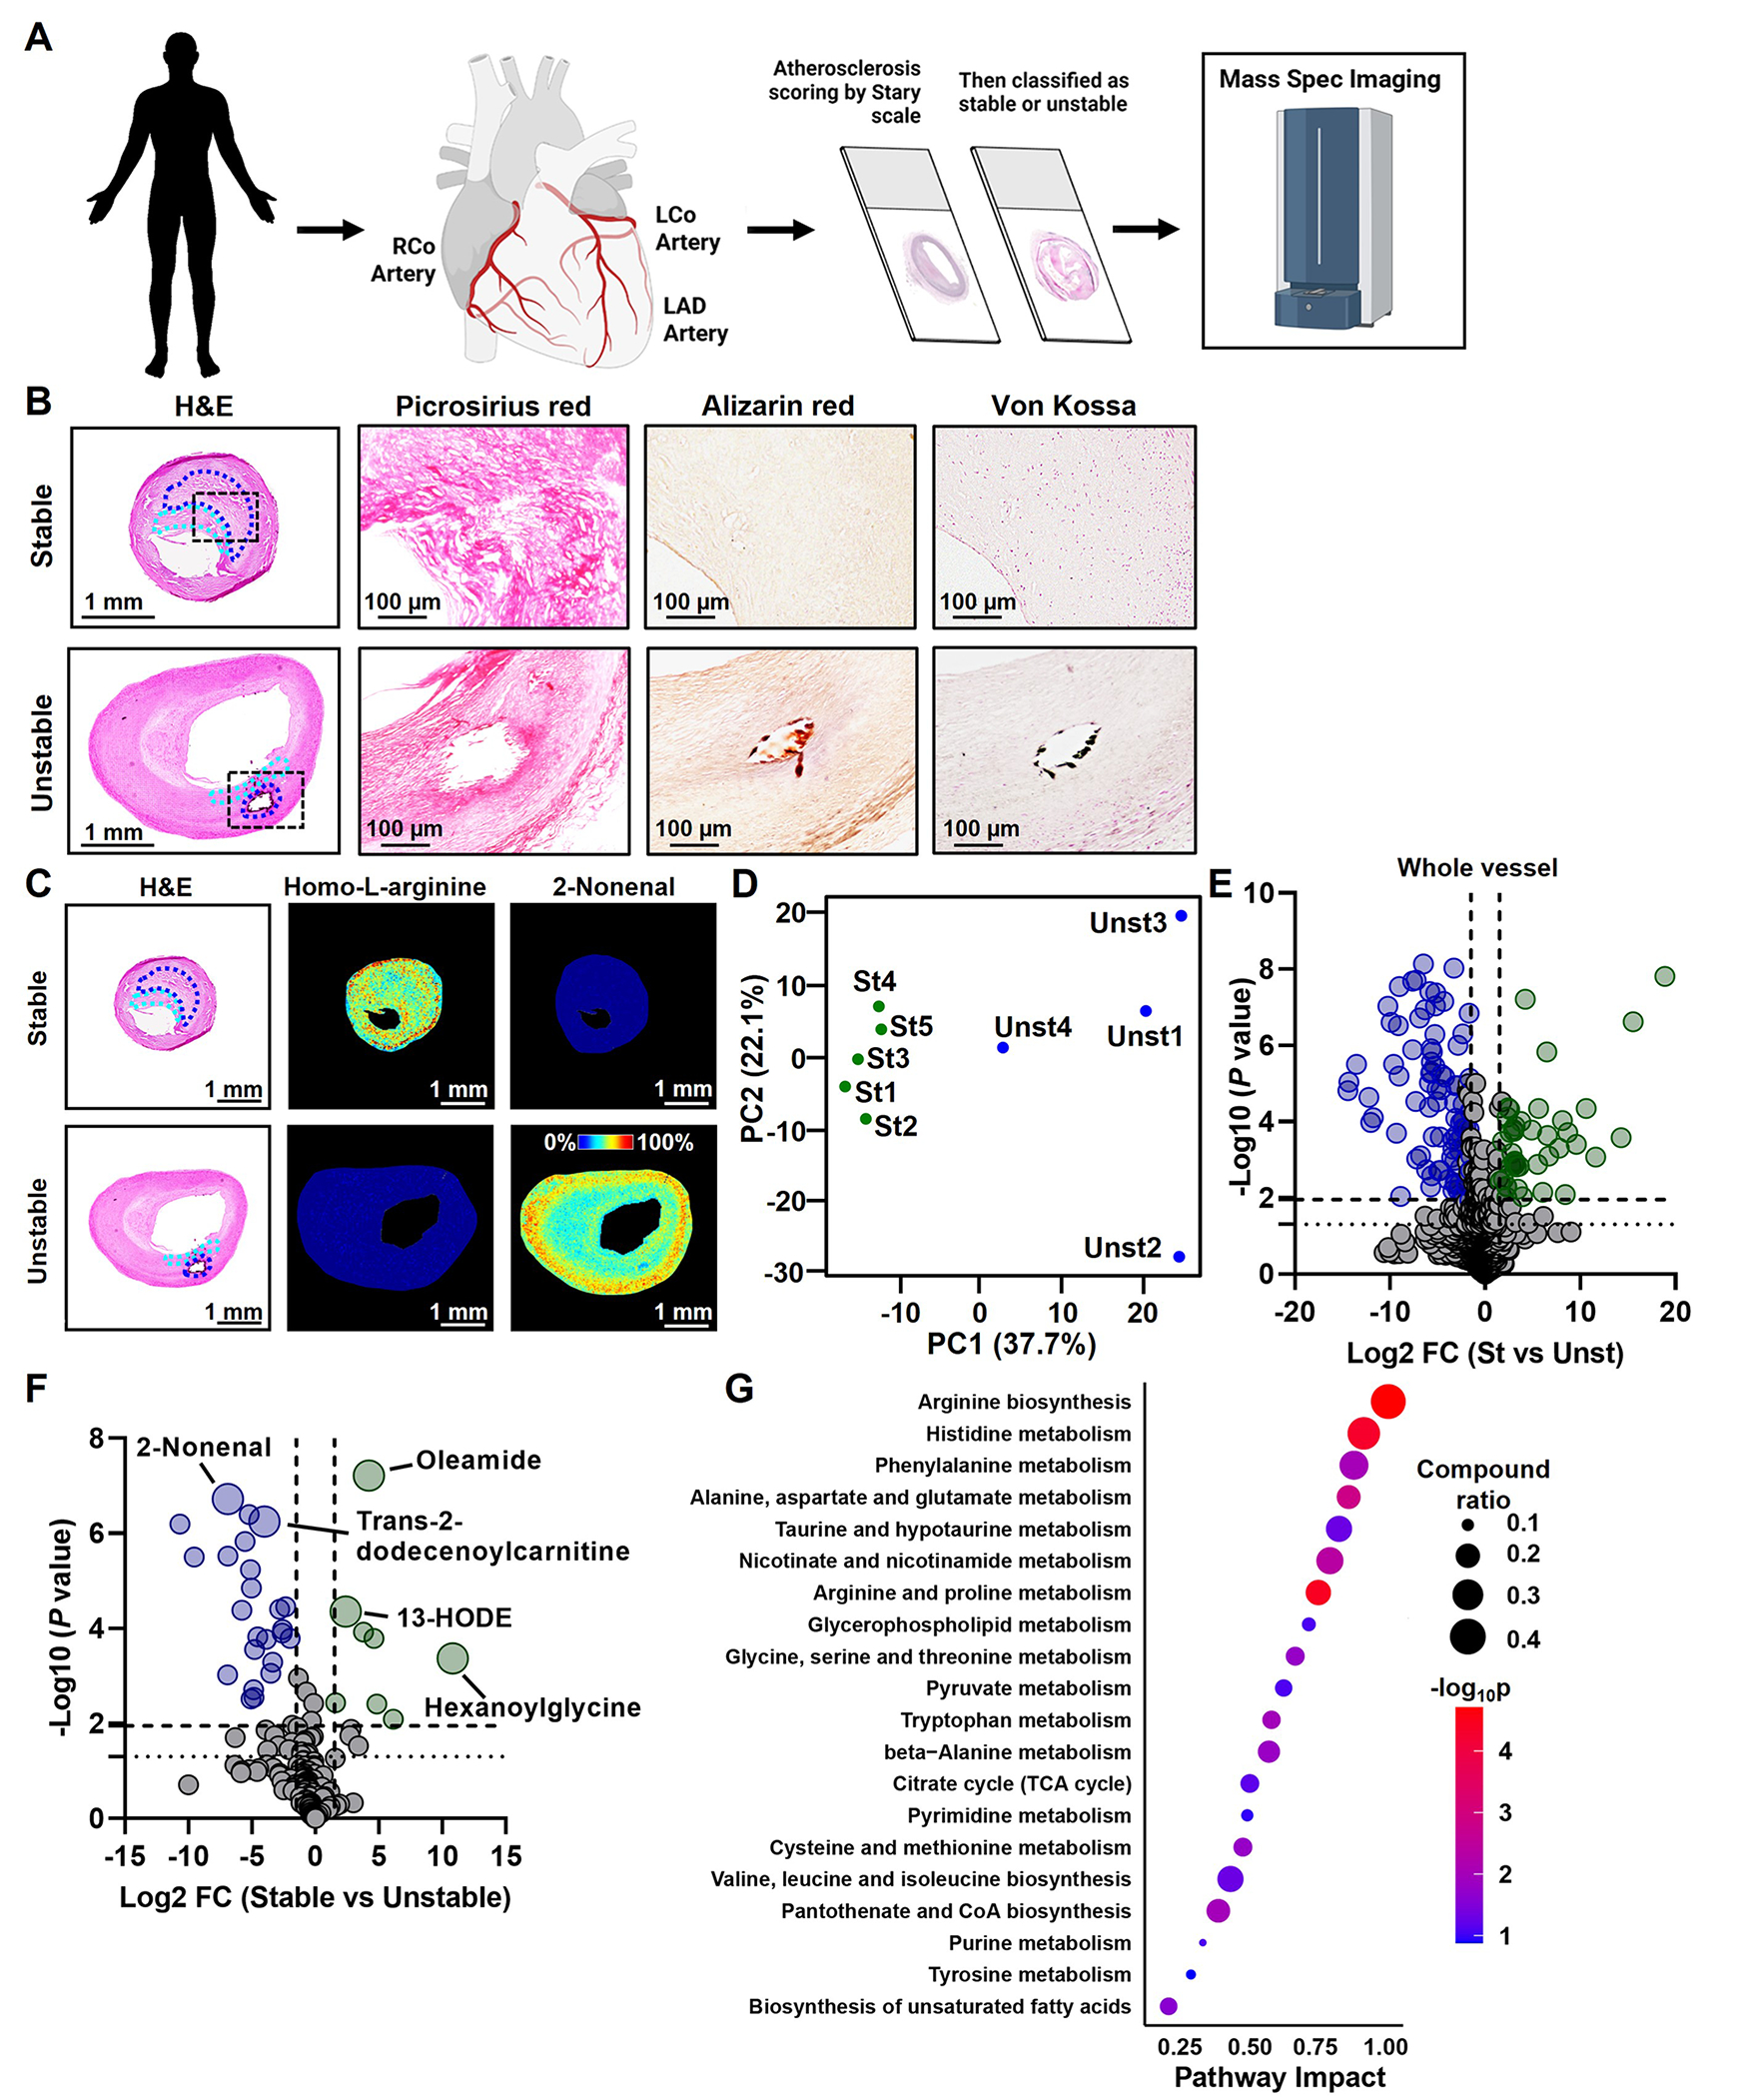
(A) We obtained 141 human atheromas and identified nine type V human atherosclerotic plaques suitable for MSI. (B) Plaque staging and scoring for plaque vulnerability were aided by H&E, Picrosirius red, Alizarin red, and von Kossa staining. Representative images are shown for stable and unstable atheromas. Regions of the fibrous cap are identified in the cyan dashed lines and the necrotic core regions are identified in the blue dashed lines. (C) MSI was performed after staging and scoring for plaque instability. Matrix was applied to tissue sections using a Robotic Reagent Sprayer. 10 mg/mL α-cyano-4-hydroxycinnamic acid (CHCA) in 50% acetonitrile, 0.1% trifluoroacetic acid was used for positive mode, whereas 10 mg/mL 1,5-diaminonaphthalene in 50% acetonitrile was applied for negative ion mode. Images were acquired using Bruker FlexImaging 5.1 on a Bruker timsTOF fleX mass spectrometer in both positive and negative ion mode at a spatial resolution of 30 μm over the m/z range 50–1000. Example images for homo-L-arginine and 2-nonenal are shown. (D) A principal component analysis was performed on the intensities of metabolite-related peaks. The first two dimensions, PC1 and PC2, show distinct clusters of stable (St) and unstable (Unst) plaque specimens. (E) Data were displayed as a Volcano plot and significance was determined as -Log10 P values above 1.95 (determined by Benjamini-Hochberg test) with a Log2 fold change ± 1.5. Peaks that are significantly elevated in the whole vessel of unstable plaques are displayed as blue circles, whereas peaks significantly elevated in the whole vessel of stable plaques are displayed as green circles. (F) Identification of metabolites was carried out by searching for deposited metabolites in MetaboScape. Mass-to-charge values were also compared to metabolite image identifications in METASPACE followed by formula searching using the Human Metabolome Database then queried for the designation of being detected and quantified. Data from annotated metabolites are displayed as a Volcano plot and significance was determined as -Log10 P values above 1.95 (determined by Benjamini-Hochberg test) with a log2 fold change ± 1.5. Metabolites that are significantly elevated in the whole vessel of unstable plaques are displayed as blue circles, whereas metabolites significantly elevated in the whole vessel of stable plaques are displayed as green circles. (G) Joint pathway analysis was performed with MetaboAnalyst 5.0 on top differentially expressed genes (P < 0.05) and significantly altered metabolites (P < 0.05). To integrate the transcriptomic and metabolic data, genes and metabolites of interest were pooled together in the enrichment and topological analyses to search for significant metabolic pathways in the KEGG database. Metabolic pathways are ranked by an impact factor indicating their topological impact (degree centrality) on the pathway.
Mass Spectrometry Imaging
Detailed methods can be found in the online supplemental file. Briefly, cross-sections were deparaffinized and applied with matrix used an HTX M5 Robotic Reagent Sprayer. Images were acquired using Bruker FlexImaging 5.1 on a Bruker timsTOF fleX mass spectrometer. After data acquisition the matrix was solubilized and the sections were stained with hematoxylin and eosin. Images were captured and merged with for co-registration, which was carried out using the GNU image program. Metabolite identification was performed using MetaboScape 2021b, the Human Metabolome Database, and METASPACE.
Statistical analysis
Statistical analyses were performed using GraphPad Prism version 9.0. Student’s t-test was conducted on the identified peaks then adjusted using a Benjamini-Hochberg correction test. Both adjusted and nominal P values are shown in the volcano plots as horizontal dashed and dotted lines, respectively.
RESULTS
To select stable and unstable human atherosclerosis samples for mass spectrometry imaging (MSI) analysis, we utilized a biobank of atherosclerotic tissue specimens taken from the right coronary artery, left coronary artery, left anterior descending artery, and the carotid sinuses of 141 individuals. These tissues were formalin-fixed, paraffin-embedded, sectioned and scored based on the Stary Classification scale12, then subdivided into stable and unstable atheromas. These samples were then processed for MSI and integrated with a publicly available RNAseq dataset comparing stable and unstable human atherosclerosis13. A general overview of the experimental design is described in Figure 1A. To score the atherosclerotic plaques, H&E, picrosirius red (identifies collagen), and Alizarin red and von Kossa (identifies extracellular calcium deposition) staining were performed (Figure 1B). Based on the features from these stains, we identified 41 late-stage (type V) human atheromas. Because MSI demands high-quality tissue sections, we next removed samples that contained histological artifacts, such as wrinkles, tears, folds, or incomplete sectioning (n = 32). Based on fibrous cap thickness, we obtained five stable (fibrous cap > 200 microns14) and four unstable (fibrous cap < 200 microns14) atheromas (Supplemental Figure 1 and Supplemental Table 1).
Cross-sections of these stable and unstable plaques were then deparaffinized, and matrix was applied using an automated reagent sprayer. Samples were then analyzed in positive and negative ion modes, and images were acquired using Bruker FlexImaging 5.1 on a Bruker timsTOF fleX mass spectrometer with a total of 1200 laser shots per pixel. Images of all samples were combined and viewed in SCiLS Lab Pro 2021b after root mean squared normalization. MSI examples of our collected human atherosclerosis specimens are shown in Figure 1C and Supplemental Figure 1. The MALDI-MSI platform was able to identify 855 peaks with assigned chemical formulas. Principal component analysis (PCA) was carried out by centering the peak intensities by mean subtraction and scaled by dividing them by standard deviations. Resultant data were used based on R functions and visualized with ggplot2. Importantly, PC analysis supported our assignments of the atheromas into stable and unstable atheromas, showing clear separation between the two groups (Figure 1D). After Benjamini-Hochberg adjustments, we found that 51 peaks were significantly elevated in the whole vessel of the stable plaques, and 128 peaks were significantly elevated in the entire vessel of unstable plaques (Figure 1E). Metabolite identification was performed by loading the ROIs into MetaboScape 2021b (Bruker) and searching against software-deposited metabolite databases. Mass-to-charge values were also compared to metabolite image identifications in METASPACE (https://metaspace2020.eu/) followed by formula searching using the Human Metabolome Database (HMDB, https://hmdb.ca/) then queried for the designation of being previously detected and quantified. We then selected twelve metabolites within different classes of molecules (e.g., nucleotides and amino acids) and compared these to commercially purchased standards. Each standard was spotted to a MALDI target, and an MS/MS spectrum was collected using collision-induced dissociation (CID). The same parent m/z values observed in the standards were targeted in tissue sections and subjected to MS/MS. The fragments observed in the MS/MS spectra from tissues were compared to those obtained from the standards (Supplemental Figures 2–5, green arrows in each set of spectra indicate fragment peaks common between the standards and tissue). Unsurprisingly, we found that more than one compound was fragmented simultaneously from tissue sections due to multiple peaks that were present within a ±1 Da isolation window, resulting in chimeric spectra with additional fragment peaks that do not entirely match the MS/MS spectra obtained from the standards. This filtering system resulted in 170 annotated metabolites (Figure 1F).
We then coupled our annotated metabolites with RNAseq of human stable and unstable atheromas13, which revealed metabolic pathways primarily related to amino acid metabolism, including arginine, histidine, alanine, proline, glycine, and tryptophan. We also uncovered alterations in glycerophospholipid metabolism, unsaturated fatty acid biosynthesis, pyrimidine metabolism, and pyruvate metabolism (Figure 1G). When evaluating RNAseq analysis of stable and unstable plaques alone, differences in pathways related to the metabolism of collagen, arginine, nitric oxide, N-acetylglucosamine, reactive oxygen species, aromatic amino acids, long-chain fatty acids, and lipids were uncovered (Figure 2A). Twenty-nine of the individually annotated metabolites that were significantly different between stable and unstable atheromas could be assigned to at least one atherosclerosis-relevant pathway (Figure 2A). The pathway with the highest number of assigned metabolites was lipid metabolism. Whereas acylcarnitines (tiglylcarnitine, butenylcarnitine, butyrylcarnitine, and 3-hydroxybutyrylcarnitine) and acylglycines (hexanoylglycine and capryloylglycine), both known to be involved in fatty acid metabolism/oxidation, were enriched in stable plaques, saturated fatty acids (palmitic acid and stearic acid) and lipid peroxidation metabolites (4-hydroxynonenal and 2-nonenal) were increased in unstable plaques. Because xylene can remove neutral lipids, the process of deparaffinizing FFPE tissue sections results in the removal of cholesterol. However, many lipid species, including saturated fatty acids, are solvent-resistant15. To determine whether xylene could remove these lipid species, we isolated fresh-frozen brain tissue slices, known to be rich in fatty acids, and performed MSI before and after xylene washing. We found that stearic acid, palmitic acid, and DHA were largely unaffected by xylene and retained their spatial properties (Supplemental Figure 6). In addition to fatty acids, we discovered that aromatic amino acids and tryptophan metabolites (phenylacetic acid, phenylacetaldehyde, N-acetyltryptophan, N-acetylserotonin, indoleacetaldehyde, and 5-hydroxyindoleacetic acid) were predominantly found in unstable plaques. Interestingly, most metabolites could not be assigned to atherosclerosis-relevant pathways identified through RNAseq. This suggests that there are other metabolic pathways relevant to atherosclerosis that have yet to be explored and highlights the potential for new avenues of research linking dysregulations in metabolism and plaque instability.
Figure 2. Integration with RNAseq of Stable and Unstable Atheromas and Spatial Resolution of Metabolites in the Fibrous Cap and Necrotic Core.
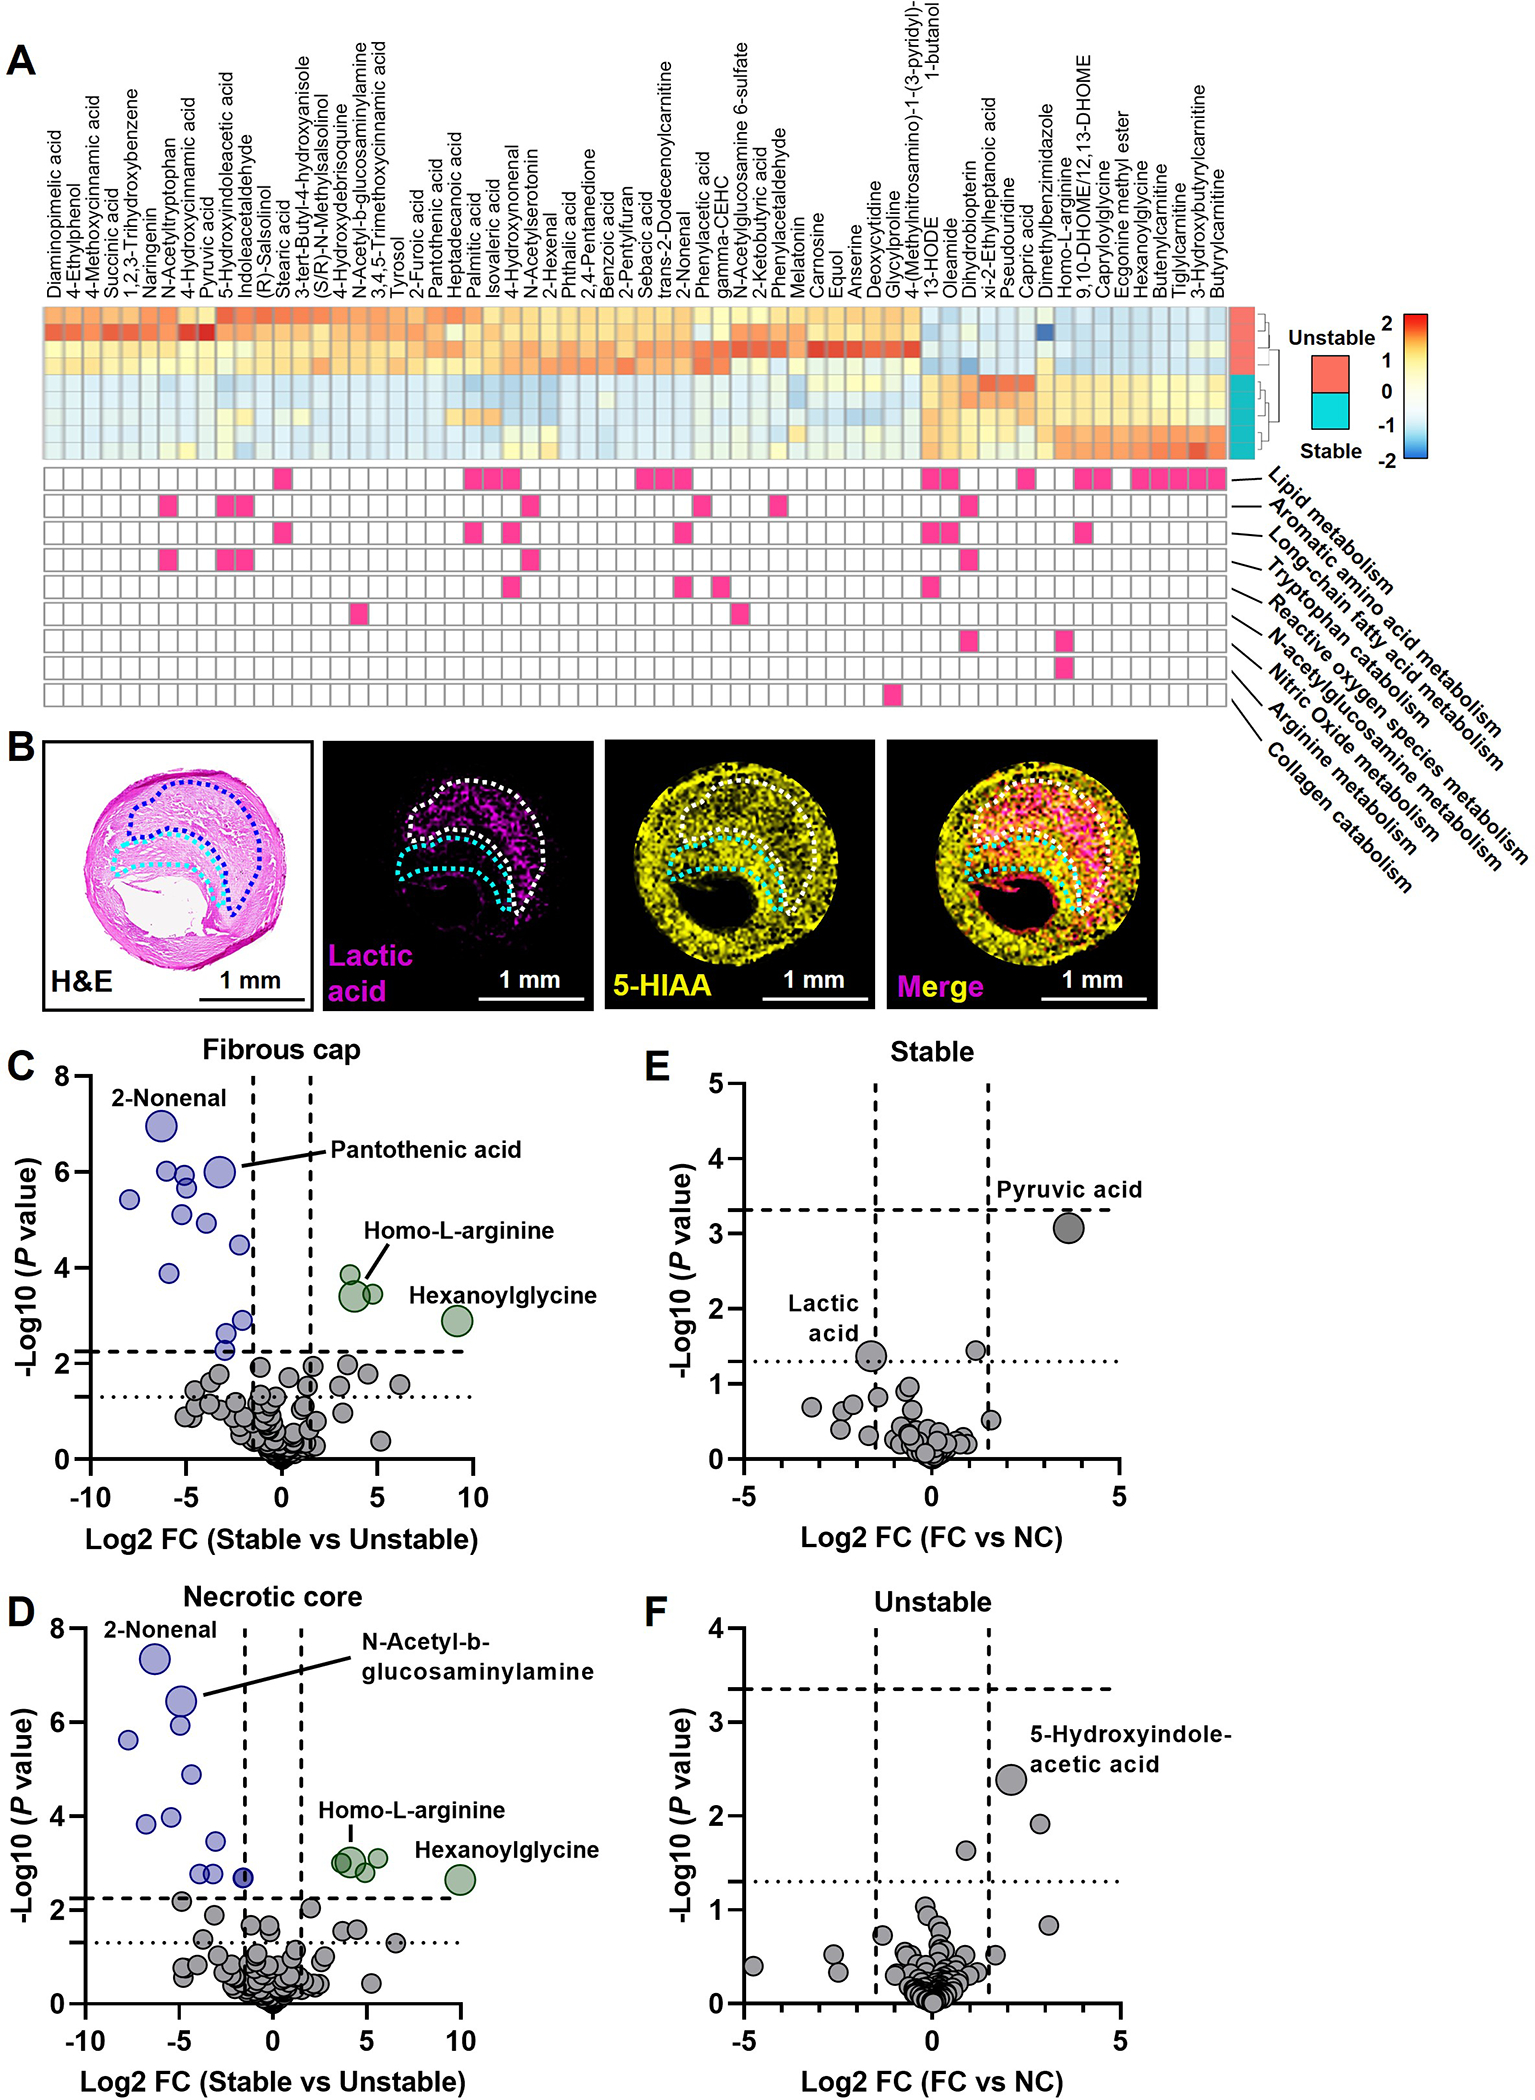
(A) Differential gene expression analysis was performed on an NCBI curated RNAseq dataset (GSE120521) comparing unstable and stable human atherosclerotic plaques. The impact of differentially expressed genes (P < 0.05) on biological processes was determined by gene set enrichment analysis using the Gene Ontology database. Metabolic pathways that are significantly enriched (P < 0.05) are shown below the annotated metabolites. (B) Images of lactic acid and 5-HIAA are shown as examples of metabolites enriched in the necrotic core and fibrous cap, respectively. (C-F) Metabolites that are significantly elevated in the fibrous cap (C) and necrotic core (D) of unstable plaques are displayed as blue circles, whereas metabolites significantly elevated in stable plaques are displayed as green circles. Data are displayed as a Volcano plot and significance was determined as -Log10 P values above 2.25 and 2.15, respectively, as determined by the Benjamini-Hochberg test (horizontal dashed line; nominal P value is a dotted horizontal line at 1.3), with a Log2 fold change ± 1.5 (vertical dashed lines). In stable (E) and unstable plaques (F), data are displayed as a Volcano plot and significance was determined as -Log10 P values above 3.33 and 3.36, respectively, as determined by the Benjamini-Hochberg test (horizontal dashed line; nominal P value is a dotted horizontal line at 1.3), with a Log2 fold change ± 1.5 (vertical dashed lines).
We next assessed differences in the fibrous cap and the necrotic core, comparing stable and unstable atheromas. An example of two metabolites and their colocalization is shown in Figure 2B. In the fibrous cap, we identified thirteen metabolites significantly elevated in unstable plaques, and four metabolites significantly elevated in stable plaques (Figure 2C). In the necrotic core microenvironment, we discovered eleven metabolites significantly elevated in the unstable atheromas and five significantly elevated in the stable atheromas (Figure 2D). Interestingly, homo-L-arginine, a substrate for nitric oxide synthase and an emerging protective cardiovascular risk factor16–18, was enriched in the fibrous cap and necrotic core of stable atheromas (Figure 2C and D). Whereas the lipid peroxidation metabolite 2-nonenal was elevated in both the fibrous cap and necrotic core of unstable atheromas (Figure 2C and D), pantothenic acid (vitamin B5), which contributes to fatty acid synthesis and reduces oxidative stress19,20, was enriched only in the fibrous cap (Figure 2C). We next assessed metabolite differences in the fibrous cap versus the necrotic core. While there were no metabolites that did not pass the statistical threshold set by the FDR calculation, nominal P values indicated a trend of increased pyruvic acid in the fibrous cap and elevated lactic acid in the necrotic core of stable plaques (Figure 2E). In unstable plaques, the tryptophan metabolite 5-hydroxyindoleacetic acid, linked to metabolic syndrome and systemic inflammation21, met the nominal P value threshold, suggesting a potential increase in the fibrous cap (Figure 2F). Altogether, using MALDI-MSI coupled with transcriptomics, we identified metabolic differences in the whole vessel, fibrous cap, and necrotic core between stable and unstable atheromas.
DISCUSSION
Elegant omics studies, including RNAseq, scRNAseq, and bulk metabolomics, have revealed differences in gene expression, cell composition, and metabolite profiles in human atherosclerosis22,23. However, these studies do not inform us wherein the plaques these differences occur. Here, we aimed to spatially resolve metabolites within the necrotic cores and fibrous caps of stable and unstable human atheromas in an unbiased manner. Integration of MSI with multi-omics approaches have yielded powerful results that more fully reveal tissue function during pathophysiologies24,25. Here, we annotated 170 metabolites out of 855 m/z peaks and integrated these results with a publicly available RNAseq dataset that determined a majority of annotated metabolites belonged to metabolic pathways that are not currently associated with atherosclerosis. We also found a variety of classes of metabolites in the fibrous cap and necrotic cores of stable and unstable atheromas.
Our dataset revealed that acylcarnitines and acylglycines were enriched in stable plaques. While our data might suggest that enhancing acylcarnitine levels would be atheroprotective, L-carnitine supplements, which enhance acylcarnitine levels26, worsen stenosis in individuals with metabolic syndrome27. Furthermore, links between elevated acylcarnitines and insulin resistance have been described28,29. Elevations in acylcarnitines are also associated with an increased risk of acute cardiovascular events30–32. In contrast to acylcarnitines, increased circulating glycine levels are linked to protections in clinical and experimental atherosclerosis9,33,34, and enhanced glycine levels increase circulating levels of acylglycines35. These fatty acid-conjugated amino acids, particularly acylcarnitines, are critical for transporting fatty acids across the inner mitochondrial membrane36, and the presence of these fatty acid-conjugated amino acids in stable plaques is in line with enhanced fatty acid oxidation, an atheroprotective metabolic pathway4,5.
In contrast to acylcarnitines and acylglycines, saturated fatty acids (palmitic acid and stearic acid) were found to be increased in unstable plaques. Data from the Rotterdam study revealed that intake of palmitic acid was strongly associated with coronary artery disease37. Consistently, feeding mice a palmitic acid-enriched diet modulates vascular smooth muscle cell (vSMC) phenotype38, drives inflammasome activation39, and enhances reactive oxygen species40, cellular processes that drive vascular calcification and plaque instability41,42. In contrast to palmitic acid, the role of stearic acid in atherosclerosis remains inconclusive. For instance, stearic acid not only lowers LDL-cholesterol but also lowers HDL-cholesterol43. Also, dietary stearic acid does not increase atherosclerosis risk and is linked with reductions in systolic blood pressure and improvements in cardiac function44–46. However, stearic acid accumulation in macrophages induces endoplasmic reticulum stress-mediated apoptosis47, a process known to drive necrotic core formation and plaque instability. While stearic acid alone may not impact the incidence of atherosclerosis, the action of both stearic acid and palmitic acid may drive vSMC phenotypic modulation, enhance proinflammatory responses in macrophages, and increase apoptosis.
In addition to saturated fatty acids, aromatic amino acids and tryptophan metabolites were also enriched in unstable plaques. Interestingly, phenylacetic acid induces reactive oxygen species in vSMCs and TNFα production in endothelial cells48,49. The fatty acid-conjugated amino acid N-acetyltryptophan is modified from tryptophan by the gut microbiota that is then absorbed by the intestine50. Supporting our observation that N-acetyltryptophan was present in unstable atheromas, enhanced levels of N-acetyltryptophan are associated with an increased risk of coronary heart disease51, which may be attributed to the effect of N-acetyltryptophan on hyperlipidemia52. While not passing the adjusted P value, the serotonin derivative 5-hydroxyindoleacetic acid (5-HIAA) did pass the nominal P value in the fibrous cap of unstable plaques, and interestingly, 5-HIAA is associated with metabolic syndrome and C-reactive protein (CRP), a biomarker of inflammation21. 5-HIAA can be oxidized by myeloperoxidase to form reactive quinones, and these 5-HIAA reactive quinones are found in advanced human atherosclerotic lesions53. However, a causative role for 5-HIAA in atherosclerosis has yet to be explored.
Despite not finding any metabolites passing the False Discovery Rate (FDR) correction threshold for Figures 2E and 2F, our study interestingly revealed that pyruvic acid and lactic acid were distinctly located in the fibrous cap and necrotic core of stable plaques, respectively – findings that did meet the nominal P value. During acute and chronic inflammation, a shift in immune cell metabolism towards glycolysis that leads to extracellular lactate accumulation occurs54, and elevations in circulating lactate are associated with hypertension55, type 2 diabetes56, and carotid atherosclerosis57. Lactate being enriched in the necrotic core support this concept that macrophages localized in these regions are proinflammatory. However, instead of promoting inflammatory responses that drive atherosclerosis progression, lactate plays a crucial role in resolution by driving IL-10 production in phagocytes engulfing apoptotic cells58, inducing histone lactylation59, and suppressing proinflammatory responses by inhibiting YAP and NFκB activation in macrophages60. In contrast to lactate, we found pyruvate might be enriched in the fibrous caps of stable plaques. Notably, pyruvate seems to promote features that drive fibrous cap formation. For instance, deleting pyruvate kinase M2, which substantially reduces the formation of pyruvate, in vSMCs suppresses phenotypic modulation and attenuates neointimal hyperplasia61. Interestingly, our analyses did not yield any metabolites that surpassed the adjusted P value threshold when we conducted a comparison between the fibrous cap and the necrotic core in both stable and unstable plaque formations (Figures 2E and 2F). This absence of discernable difference points towards a potential similarity in the dysregulation of metabolic pathways within the fibrous cap and necrotic cores of these plaques. These findings thus highlight a key concept – that there exists a highly coordinated metabolic crosstalk between lesional cells.
Our MSI data presented here validate known metabolites associated with atherosclerosis progression while also pointing to classes of metabolites that may play significant roles in plaque instability, highlighting the potential for new avenues of research. However, several technical and sample limitations exist that reveal new opportunities to extend our findings. First, we were unable to confidently annotate the majority of metabolite-related peaks that were identified, highlighting the need to improve the currently existing platforms for high-confidence peak annotation. Thus, future technical innovations that permit accurate annotation may reveal more metabolites that play critical roles in plaque instability. Also, metabolite concentrations and their spatial distributions in post-mortem specimens used in our study may be different compared to live tissues. Therefore, future studies that examine samples collected from live donors (e.g., carotid endarterectomies) will enhance our understanding of the metabolic differences between post-mortem and live specimens. In addition, while the number of specimens used here is similar to those of other studies utilizing MSI technology62–64 future work that includes more samples will extend our findings. However, this may be challenging due to the time- and cost-prohibitive nature of currently existing MSI platforms, which may be alleviated as technology advances. Ultimately, due to the inability to procure complete clinical data from the deceased subjects, there is a clear need for follow-up research. Future studies that involve a larger sample size will also address how factors such as age, sex, ethnicity, and the involvement of specific vascular beds (e.g., coronaries vs. carotids) might influence the metabolite profile and spatial distribution within stable and unstable atherosclerotic plaques. This enhanced focus will ensure a more comprehensive understanding of these influential factors. Nonetheless, our work presented here serves as a first step to defining an atlas of metabolic pathways involved in plaque destabilization in human atherosclerosis. We anticipate that this work will be a valuable resource for the scientific community and will ultimately open new avenues of research in cardiovascular disease.
Supplementary Material
HIGHLIGHTS.
MALDI-MSI revealed differences in metabolic pathways between stable and unstable atherosclerotic plaques.
Reactive oxygen species, aromatic amino acid, and tryptophan metabolism were found to be increased in unstable plaques while lipid metabolism and long-chain fatty acids were enriched in stable plaques.
This work represents one of the first steps toward creating an atlas of metabolic pathways involved in plaque destabilization, potentially creating new avenues of research for cardiovascular disease.
ACKNOWLEDGEMENTS
We thank Arun Sreekumar for donation of metabolite standards. Parts of the graphical abstract were created from Biorender.
SOURCES OF FUNDING
This study was supported by the NIH grants HL125838 and HL159461 (BR), DK106540 and DK124612 (WQL), DK134011 and HL150233 (OR), HL139755 (CBP), HL145131 and HL167758 (AYJ); American Diabetes Association #1-18-IBS-029 (BR); Veterans Affairs MERIT I01 BX003415 (BR); Collaborative Intramural Research Program (LSUHS and Ochsner Clinic Foundation; AYJ and OR); and the LSUHS Center for Cardiovascular Diseases and Sciences Malcolm Feist Fellowships (LD, ACF, and DK). RNAseq analysis was supported in part by the University of Pittsburgh Center for Research Computing through the resources provided. The Mass Spectrometry Imaging was performed at the Mass Spectrometry Imaging Facility at the University of Texas at Austin, supported by a Cancer Prevention and Research Institute of Texas award (RP190617).
Nonstandard Abbreviations and Acronyms
- 5-HIAA
5-hydroxyindoleacetic acid
- 13-HODE
13-hydroxyoctadecadienoic acid
- MALDI
Matrix-assisted laser desorption/ionization
- MSI
Mass spectroscopy imaging
- RNAseq
RNA sequencing
Footnotes
Conflict of Interest: The authors have declared that no conflict of interest exists.
REFERENCES
- 1.Xu J, Murphy SL, Kockanek KD, Arias E. Mortality in the United States, 2018. NCHS Data Brief. 2020:1–8. [PubMed] [Google Scholar]
- 2.Doran AC, Yurdagul A Jr., Tabas I. Efferocytosis in health and disease. Nat Rev Immunol. 2020;20:254–267. doi: 10.1038/s41577-019-0240-6 [DOI] [PMC free article] [PubMed] [Google Scholar]
- 3.Back M, Yurdagul A Jr., Tabas I, Oorni K, Kovanen PT. Inflammation and its resolution in atherosclerosis: mediators and therapeutic opportunities. Nat Rev Cardiol. 2019;16:389–406. doi: 10.1038/s41569-019-0169-2 [DOI] [PMC free article] [PubMed] [Google Scholar]
- 4.Tabas I, Bornfeldt KE. Intracellular and Intercellular Aspects of Macrophage Immunometabolism in Atherosclerosis. Circ Res. 2020;126:1209–1227. doi: 10.1161/CIRCRESAHA.119.315939 [DOI] [PMC free article] [PubMed] [Google Scholar]
- 5.Yurdagul A Jr. Metabolic Consequences of Efferocytosis and its Impact on Atherosclerosis. Immunometabolism. 2021;3. doi: 10.20900/immunometab20210017 [DOI] [PMC free article] [PubMed] [Google Scholar]
- 6.Yurdagul A Jr., Subramanian M, Wang X, Crown SB, Ilkayeva OR, Darville L, Kolluru GK, Rymond CC, Gerlach BD, Zheng Z, et al. Macrophage Metabolism of Apoptotic Cell-Derived Arginine Promotes Continual Efferocytosis and Resolution of Injury. Cell Metab. 2020;31:518–533 e510. doi: 10.1016/j.cmet.2020.01.001 [DOI] [PMC free article] [PubMed] [Google Scholar]
- 7.Yurdagul A Jr., Kong N, Gerlach BD, Wang X, Ampomah P, Kuriakose G, Tao W, Shi J, Tabas I. ODC (Ornithine Decarboxylase)-Dependent Putrescine Synthesis Maintains MerTK (MER Tyrosine-Protein Kinase) Expression to Drive Resolution. Arterioscler Thromb Vasc Biol. 2021;41:e144–e159. doi: 10.1161/ATVBAHA.120.315622 [DOI] [PMC free article] [PubMed] [Google Scholar]
- 8.Liu Y, Zhao Y, Shukha Y, Lu H, Wang L, Liu Z, Liu C, Zhao Y, Wang H, Zhao G, et al. Dysregulated oxalate metabolism is a driver and therapeutic target in atherosclerosis. Cell Rep. 2021;36:109420. doi: 10.1016/j.celrep.2021.109420 [DOI] [PMC free article] [PubMed] [Google Scholar]
- 9.Rom O, Liu Y, Finney AC, Ghrayeb A, Zhao Y, Shukha Y, Wang L, Rajanayake KK, Das S, Rashdan NA, et al. Induction of glutathione biosynthesis by glycine-based treatment mitigates atherosclerosis. Redox Biol. 2022;52:102313. doi: 10.1016/j.redox.2022.102313 [DOI] [PMC free article] [PubMed] [Google Scholar]
- 10.Caprioli RM, Farmer TB, Gile J. Molecular Imaging of Biological Samples: Localization of Peptides and Proteins Using MALDI-TOF MS. Anal Chem. 1997;69:4751–4760. [DOI] [PubMed] [Google Scholar]
- 11.Norris JL, Caprioli RM. Analysis of tissue specimens by matrix-assisted laser desorption/ionization imaging mass spectrometry in biological and clinical research. Chemical reviews. 2013;113:2309–2342. doi: 10.1021/cr3004295 [DOI] [PMC free article] [PubMed] [Google Scholar]
- 12.Stary HC, Chandler AB, Dinsmore RE, Fuster V, Glagov S, Insull W, Jr., [Google Scholar]; Rosenfeld ME, Schwartz CJ, Wagner WD, Wissler RW. A definition of advanced types of atherosclerotic lesions and a histological classification of atherosclerosis. A report from the Committee on Vascular Lesions of the Council on Arteriosclerosis, American Heart Association. Arterioscler Thromb Vasc Biol. 1995;15:1512–1531. doi: 10.1161/01.atv.15.9.1512 [DOI] [PubMed] [Google Scholar]
- 13.Mahmoud AD, Ballantyne MD, Miscianinov V, Pinel K, Hung J, Scanlon JP, Iyinikkel J, Kaczynski J, Tavares AS, Bradshaw AC, et al. The Human-Specific and Smooth Muscle Cell-Enriched LncRNA SMILR Promotes Proliferation by Regulating Mitotic CENPF mRNA and Drives Cell-Cycle Progression Which Can Be Targeted to Limit Vascular Remodeling. Circ Res. 2019;125:535–551. doi: 10.1161/CIRCRESAHA.119.314876 [DOI] [PMC free article] [PubMed] [Google Scholar]
- 14.Li ZY, Howarth SP, Tang T, Gillard JH. How critical is fibrous cap thickness to carotid plaque stability? A flow-plaque interaction model. Stroke. 2006;37:1195–1199. doi: 10.1161/01.STR.0000217331.61083.3b [DOI] [PubMed] [Google Scholar]
- 15.Buck A, Ly A, Balluff B, Sun N, Gorzolka K, Feuchtinger A, Janssen KP, Kuppen PJ, van de Velde CJ, Weirich G, et al. High-resolution MALDI-FT-ICR MS imaging for the analysis of metabolites from formalin-fixed, paraffin-embedded clinical tissue samples. J Pathol. 2015;237:123–132. doi: 10.1002/path.4560 [DOI] [PubMed] [Google Scholar]
- 16.Marz W, Meinitzer A, Drechsler C, Pilz S, Krane V, Kleber ME, Fischer J, Winkelmann BR, Bohm BO, Ritz E, et al. Homoarginine, cardiovascular risk, and mortality. Circulation. 2010;122:967–975. doi: 10.1161/CIRCULATIONAHA.109.908988 [DOI] [PubMed] [Google Scholar]
- 17.Pilz S, Meinitzer A, Tomaschitz A, Drechsler C, Ritz E, Krane V, Wanner C, Boehm BO, Marz W. Low homoarginine concentration is a novel risk factor for heart disease. Heart. 2011;97:1222–1227. doi: 10.1136/hrt.2010.220731 [DOI] [PubMed] [Google Scholar]
- 18.Atzler D, Baum C, Ojeda F, Keller T, Cordts K, Schnabel RB, Choe CU, Lackner KJ, Munzel T, Boger RH, et al. Low Homoarginine Levels in the Prognosis of Patients With Acute Chest Pain. J Am Heart Assoc. 2016;5:e002565. doi: 10.1161/JAHA.115.002565 [DOI] [PMC free article] [PubMed] [Google Scholar]
- 19.Leonardi R, Jackowski S. Biosynthesis of Pantothenic Acid and Coenzyme A. EcoSal Plus. 2007;2. doi: 10.1128/ecosalplus.3.6.3.4 [DOI] [PMC free article] [PubMed] [Google Scholar]
- 20.Depeint F, Bruce WR, Shangari N, Mehta R, O’Brien PJ. Mitochondrial function and toxicity: role of the B vitamin family on mitochondrial energy metabolism. Chem Biol Interact. 2006;163:94–112. doi: 10.1016/j.cbi.2006.04.014 [DOI] [PubMed] [Google Scholar]
- 21.Afarideh M, Behdadnia A, Noshad S, Mirmiranpour H, Mousavizadeh M, Khajeh E, Rad MV, Mazaheri T, Nakhjavani M, Esteghamati A. Association of Peripheral 5-Hydroxyindole-3-Acetic Acid, a Serotonin Derivative, with Metabolic Syndrome and Low-Grade Inflammation. Endocr Pract. 2015;21:711–718. doi: 10.4158/EP14442.OR [DOI] [PubMed] [Google Scholar]
- 22.Williams JW, Winkels H, Durant CP, Zaitsev K, Ghosheh Y, Ley K. Single Cell RNA Sequencing in Atherosclerosis Research. Circ Res. 2020;126:1112–1126. doi: 10.1161/CIRCRESAHA.119.315940 [DOI] [PMC free article] [PubMed] [Google Scholar]
- 23.Jin H, Goossens P, Juhasz P, Eijgelaar W, Manca M, Karel JMH, Smirnov E, Sikkink C, Mees BME, Waring O, et al. Integrative multiomics analysis of human atherosclerosis reveals a serum response factor-driven network associated with intraplaque hemorrhage. Clin Transl Med. 2021;11:e458. doi: 10.1002/ctm2.458 [DOI] [PMC free article] [PubMed] [Google Scholar]
- 24.Aichler M, Borgmann D, Krumsiek J, Buck A, MacDonald PE, Fox JEM, Lyon J, Light PE, Keipert S, Jastroch M, et al. N-acyl Taurines and Acylcarnitines Cause an Imbalance in Insulin Synthesis and Secretion Provoking beta Cell Dysfunction in Type 2 Diabetes. Cell Metab. 2017;25:1334–1347 e1334. doi: 10.1016/j.cmet.2017.04.012 [DOI] [PubMed] [Google Scholar]
- 25.Heijs B, Holst S, Briaire-de Bruijn IH, van Pelt GW, de Ru AH, van Veelen PA, Drake RR, Mehta AS, Mesker WE, Tollenaar RA, et al. Multimodal Mass Spectrometry Imaging of N-Glycans and Proteins from the Same Tissue Section. Anal Chem. 2016;88:7745–7753. doi: 10.1021/acs.analchem.6b01739 [DOI] [PubMed] [Google Scholar]
- 26.Primassin S, Ter Veld F, Mayatepek E, Spiekerkoetter U. Carnitine supplementation induces acylcarnitine production in tissues of very long-chain acyl-CoA dehydrogenase-deficient mice, without replenishing low free carnitine. Pediatr Res. 2008;63:632–637. doi: 10.1203/PDR.0b013e31816ff6f0 [DOI] [PubMed] [Google Scholar]
- 27.Johri AM, Hetu MF, Heyland DK, Herr JE, Korol J, Froese S, Norman PA, Day AG, Matangi MF, Michos ED, et al. Progression of atherosclerosis with carnitine supplementation: a randomized controlled trial in the metabolic syndrome. Nutr Metab (Lond). 2022;19:26. doi: 10.1186/s12986-022-00661-9 [DOI] [PMC free article] [PubMed] [Google Scholar]
- 28.Guasch-Ferre M, Ruiz-Canela M, Li J, Zheng Y, Bullo M, Wang DD, Toledo E, Clish C, Corella D, Estruch R, et al. Plasma Acylcarnitines and Risk of Type 2 Diabetes in a Mediterranean Population at High Cardiovascular Risk. J Clin Endocrinol Metab. 2019;104:1508–1519. doi: 10.1210/jc.2018-01000 [DOI] [PMC free article] [PubMed] [Google Scholar]
- 29.Zhao S, Liu ML, Huang B, Zhao FR, Li Y, Cui XT, Lin R. Acetylcarnitine Is Associated With Cardiovascular Disease Risk in Type 2 Diabetes Mellitus. Front Endocrinol (Lausanne). 2021;12:806819. doi: 10.3389/fendo.2021.806819 [DOI] [PMC free article] [PubMed] [Google Scholar]
- 30.Seo WK, Jo G, Shin MJ, Oh K. Medium-Chain Acylcarnitines Are Associated With Cardioembolic Stroke and Stroke Recurrence. Arterioscler Thromb Vasc Biol. 2018;38:2245–2253. doi: 10.1161/ATVBAHA.118.311373 [DOI] [PubMed] [Google Scholar]
- 31.Shah SH, Bain JR, Muehlbauer MJ, Stevens RD, Crosslin DR, Haynes C, Dungan J, Newby LK, Hauser ER, Ginsburg GS, et al. Association of a peripheral blood metabolic profile with coronary artery disease and risk of subsequent cardiovascular events. Circ Cardiovasc Genet. 2010;3:207–214. doi: 10.1161/CIRCGENETICS.109.852814 [DOI] [PubMed] [Google Scholar]
- 32.Shah SH, Sun JL, Stevens RD, Bain JR, Muehlbauer MJ, Pieper KS, Haynes C, Hauser ER, Kraus WE, Granger CB, et al. Baseline metabolomic profiles predict cardiovascular events in patients at risk for coronary artery disease. Am Heart J. 2012;163:844–850 e841. doi: 10.1016/j.ahj.2012.02.005 [DOI] [PubMed] [Google Scholar]
- 33.Wittemans LBL, Lotta LA, Oliver-Williams C, Stewart ID, Surendran P, Karthikeyan S, Day FR, Koulman A, Imamura F, Zeng L, et al. Assessing the causal association of glycine with risk of cardio-metabolic diseases. Nat Commun. 2019;10:1060. doi: 10.1038/s41467-019-08936-1 [DOI] [PMC free article] [PubMed] [Google Scholar]
- 34.Rom O, Villacorta L, Zhang J, Chen YE, Aviram M. Emerging therapeutic potential of glycine in cardiometabolic diseases: dual benefits in lipid and glucose metabolism. Curr Opin Lipidol. 2018;29:428–432. doi: 10.1097/MOL.0000000000000543 [DOI] [PMC free article] [PubMed] [Google Scholar]
- 35.White PJ, Lapworth AL, An J, Wang L, McGarrah RW, Stevens RD, Ilkayeva O, George T, Muehlbauer MJ, Bain JR, et al. Branched-chain amino acid restriction in Zucker-fatty rats improves muscle insulin sensitivity by enhancing efficiency of fatty acid oxidation and acyl-glycine export. Mol Metab. 2016;5:538–551. doi: 10.1016/j.molmet.2016.04.006 [DOI] [PMC free article] [PubMed] [Google Scholar]
- 36.Longo N, Frigeni M, Pasquali M. Carnitine transport and fatty acid oxidation. Biochim Biophys Acta. 2016;1863:2422–2435. doi: 10.1016/j.bbamcr.2016.01.023 [DOI] [PMC free article] [PubMed] [Google Scholar]
- 37.Praagman J, de Jonge EA, Kiefte-de Jong JC, Beulens JW, Sluijs I, Schoufour JD, Hofman A, van der Schouw YT, Franco OH. Dietary Saturated Fatty Acids and Coronary Heart Disease Risk in a Dutch Middle-Aged and Elderly Population. Arterioscler Thromb Vasc Biol. 2016;36:2011–2018. doi: 10.1161/ATVBAHA.116.307578 [DOI] [PubMed] [Google Scholar]
- 38.Shen H, Eguchi K, Kono N, Fujiu K, Matsumoto S, Shibata M, Oishi-Tanaka Y, Komuro I, Arai H, Nagai R, et al. Saturated fatty acid palmitate aggravates neointima formation by promoting smooth muscle phenotypic modulation. Arterioscler Thromb Vasc Biol. 2013;33:2596–2607. doi: 10.1161/ATVBAHA.113.302099 [DOI] [PubMed] [Google Scholar]
- 39.Gianfrancesco MA, Dehairs J, L’Homme L, Herinckx G, Esser N, Jansen O, Habraken Y, Lassence C, Swinnen JV, Rider MH, et al. Saturated fatty acids induce NLRP3 activation in human macrophages through K(+) efflux resulting from phospholipid saturation and Na, K-ATPase disruption. Biochim Biophys Acta Mol Cell Biol Lipids. 2019;1864:1017–1030. doi: 10.1016/j.bbalip.2019.04.001 [DOI] [PubMed] [Google Scholar]
- 40.Ly LD, Xu S, Choi SK, Ha CM, Thoudam T, Cha SK, Wiederkehr A, Wollheim CB, Lee IK, Park KS. Oxidative stress and calcium dysregulation by palmitate in type 2 diabetes. Exp Mol Med. 2017;49:e291. doi: 10.1038/emm.2016.157 [DOI] [PMC free article] [PubMed] [Google Scholar]
- 41.Donis N, Jiang Z, D’Emal C, Dulgheru R, Giera M, Blomberg N, Delvenne P, Nchimi A, Lancellotti P, Oury C. Regular Dietary Intake of Palmitate Causes Vascular and Valvular Calcification in a Rabbit Model. Front Cardiovasc Med. 2021;8:692184. doi: 10.3389/fcvm.2021.692184 [DOI] [PMC free article] [PubMed] [Google Scholar]
- 42.Waddington E, Sienuarine K, Puddey I, Croft K. Identification and quantitation of unique fatty acid oxidation products in human atherosclerotic plaque using high-performance liquid chromatography. Anal Biochem. 2001;292:234–244. doi: 10.1006/abio.2001.5075 [DOI] [PubMed] [Google Scholar]
- 43.Mensink RP. Effects of stearic acid on plasma lipid and lipoproteins in humans. Lipids. 2005;40:1201–1205. doi: 10.1007/s11745-005-1486-x [DOI] [PubMed] [Google Scholar]
- 44.Lu ZH, Mu YM, Wang BA, Li XL, Lu JM, Li JY, Pan CY, Yanase T, Nawata H. Saturated free fatty acids, palmitic acid and stearic acid, induce apoptosis by stimulation of ceramide generation in rat testicular Leydig cell. Biochem Biophys Res Commun. 2003;303:1002–1007. doi: 10.1016/s0006-291x(03)00449-2 [DOI] [PubMed] [Google Scholar]
- 45.Simon JA, Fong J, Bernert JT Jr. Serum fatty acids and blood pressure. Hypertension. 1996;27:303–307. doi: 10.1161/01.hyp.27.2.303 [DOI] [PubMed] [Google Scholar]
- 46.Senyilmaz-Tiebe D, Pfaff DH, Virtue S, Schwarz KV, Fleming T, Altamura S, Muckenthaler MU, Okun JG, Vidal-Puig A, Nawroth P, et al. Dietary stearic acid regulates mitochondria in vivo in humans. Nat Commun. 2018;9:3129. doi: 10.1038/s41467-018-05614-6 [DOI] [PMC free article] [PubMed] [Google Scholar]
- 47.Anderson EK, Hill AA, Hasty AH. Stearic acid accumulation in macrophages induces toll-like receptor 4/2-independent inflammation leading to endoplasmic reticulum stress-mediated apoptosis. Arterioscler Thromb Vasc Biol. 2012;32:1687–1695. doi: 10.1161/ATVBAHA.112.250142 [DOI] [PMC free article] [PubMed] [Google Scholar]
- 48.Schmidt S, Westhoff TH, Krauser P, Zidek W, van der Giet M. The uraemic toxin phenylacetic acid increases the formation of reactive oxygen species in vascular smooth muscle cells. Nephrol Dial Transplant. 2008;23:65–71. doi: 10.1093/ndt/gfm475 [DOI] [PubMed] [Google Scholar]
- 49.Morita M, Yano S, Yamaguchi T, Yamauchi M, Sugimoto T. Phenylacetic acid stimulates reactive oxygen species generation and tumor necrosis factor-alpha secretion in vascular endothelial cells. Ther Apher Dial. 2011;15:147–150. doi: 10.1111/j.1744-9987.2010.00887.x [DOI] [PubMed] [Google Scholar]
- 50.Wikoff WR, Anfora AT, Liu J, Schultz PG, Lesley SA, Peters EC, Siuzdak G. Metabolomics analysis reveals large effects of gut microflora on mammalian blood metabolites. Proc Natl Acad Sci U S A. 2009;106:3698–3703. doi: 10.1073/pnas.0812874106 [DOI] [PMC free article] [PubMed] [Google Scholar]
- 51.Feofanova EV, Chen H, Dai Y, Jia P, Grove ML, Morrison AC, Qi Q, Daviglus M, Cai J, North KE, et al. A Genome-wide Association Study Discovers 46 Loci of the Human Metabolome in the Hispanic Community Health Study/Study of Latinos. Am J Hum Genet. 2020;107:849–863. doi: 10.1016/j.ajhg.2020.09.003 [DOI] [PMC free article] [PubMed] [Google Scholar]
- 52.Yang L, Li Z, Song Y, Liu Y, Zhao H, Liu Y, Zhang T, Yuan Y, Cai X, Wang S, et al. Study on urine metabolic profiling and pathogenesis of hyperlipidemia. Clin Chim Acta. 2019;495:365–373. doi: 10.1016/j.cca.2019.05.001 [DOI] [PubMed] [Google Scholar]
- 53.Kato Y, Oki K, Suga N, Ono S, Ishisaka A, Miura Y, Kanazawa S, Naito M, Kitamoto N, Kettle AJ. A novel quinone derived from 5-hydroxyindoleacetic acid reacts with protein: Possible participation of oxidation of serotonin and its metabolite in the development of atherosclerosis. Free Radic Biol Med. 2016;101:500–510. doi: 10.1016/j.freeradbiomed.2016.11.023 [DOI] [PubMed] [Google Scholar]
- 54.Viola A, Munari F, Sanchez-Rodriguez R, Scolaro T, Castegna A. The Metabolic Signature of Macrophage Responses. Front Immunol. 2019;10:1462. doi: 10.3389/fimmu.2019.01462 [DOI] [PMC free article] [PubMed] [Google Scholar]
- 55.Juraschek SP, Bower JK, Selvin E, Subash Shantha GP, Hoogeveen RC, Ballantyne CM, Young JH. Plasma lactate and incident hypertension in the atherosclerosis risk in communities study. Am J Hypertens. 2015;28:216–224. doi: 10.1093/ajh/hpu117 [DOI] [PMC free article] [PubMed] [Google Scholar]
- 56.Crawford SO, Hoogeveen RC, Brancati FL, Astor BC, Ballantyne CM, Schmidt MI, Young JH. Association of blood lactate with type 2 diabetes: the Atherosclerosis Risk in Communities Carotid MRI Study. Int J Epidemiol. 2010;39:1647–1655. doi: 10.1093/ije/dyq126 [DOI] [PMC free article] [PubMed] [Google Scholar]
- 57.Shantha GP, Wasserman B, Astor BC, Coresh J, Brancati F, Sharrett AR, Young JH. Association of blood lactate with carotid atherosclerosis: the Atherosclerosis Risk in Communities (ARIC) Carotid MRI Study. Atherosclerosis. 2013;228:249–255. doi: 10.1016/j.atherosclerosis.2013.02.014 [DOI] [PMC free article] [PubMed] [Google Scholar]
- 58.Morioka S, Perry JSA, Raymond MH, Medina CB, Zhu Y, Zhao L, Serbulea V, Onengut-Gumuscu S, Leitinger N, Kucenas S, et al. Efferocytosis induces a novel SLC program to promote glucose uptake and lactate release. Nature. 2018;563:714–718. doi: 10.1038/s41586-018-0735-5 [DOI] [PMC free article] [PubMed] [Google Scholar]
- 59.Zhang D, Tang Z, Huang H, Zhou G, Cui C, Weng Y, Liu W, Kim S, Lee S, Perez-Neut M, et al. Metabolic regulation of gene expression by histone lactylation. Nature. 2019;574:575–580. doi: 10.1038/s41586-019-1678-1 [DOI] [PMC free article] [PubMed] [Google Scholar]
- 60.Yang K, Xu J, Fan M, Tu F, Wang X, Ha T, Williams DL, Li C. Lactate Suppresses Macrophage Pro-Inflammatory Response to LPS Stimulation by Inhibition of YAP and NF-kappaB Activation via GPR81-Mediated Signaling. Front Immunol. 2020;11:587913. doi: 10.3389/fimmu.2020.587913 [DOI] [PMC free article] [PubMed] [Google Scholar]
- 61.Jain M, Dhanesha N, Doddapattar P, Nayak MK, Guo L, Cornelissen A, Lentz SR, Finn AV, Chauhan AK. Smooth Muscle Cell-Specific PKM2 (Pyruvate Kinase Muscle 2) Promotes Smooth Muscle Cell Phenotypic Switching and Neointimal Hyperplasia. Arterioscler Thromb Vasc Biol. 2021;41:1724–1737. doi: 10.1161/ATVBAHA.121.316021 [DOI] [PMC free article] [PubMed] [Google Scholar]
- 62.Moerman AM, Visscher M, Slijkhuis N, Van Gaalen K, Heijs B, Klein T, Burgers PC, De Rijke YB, Van Beusekom HMM, Luider TM, et al. Lipid signature of advanced human carotid atherosclerosis assessed by mass spectrometry imaging. J Lipid Res. 2021;62:100020. doi: 10.1194/jlr.RA120000974 [DOI] [PMC free article] [PubMed] [Google Scholar]
- 63.Greco F, Quercioli L, Pucci A, Rocchiccioli S, Ferrari M, Recchia FA, McDonnell LA. Mass Spectrometry Imaging as a Tool to Investigate Region Specific Lipid Alterations in Symptomatic Human Carotid Atherosclerotic Plaques. Metabolites. 2021;11. doi: 10.3390/metabo11040250 [DOI] [PMC free article] [PubMed] [Google Scholar]
- 64.Khamehgir-Silz P, Gerbig S, Volk N, Schulz S, Spengler B, Hecker M, Wagner AH. Comparative lipid profiling of murine and human atherosclerotic plaques using high-resolution MALDI MSI. Pflugers Arch. 2022;474:231–242. doi: 10.1007/s00424-021-02643-x [DOI] [PMC free article] [PubMed] [Google Scholar]
Associated Data
This section collects any data citations, data availability statements, or supplementary materials included in this article.