

SUMMARY
Infancy and childhood are critical life stages for generating immune memory to protect against pathogens; however, the timing, location, and pathways for memory development in humans remain elusive. Here, we investigated T cells in mucosal sites, lymphoid tissues, and blood from 96 pediatric donors aged 0–10 years using phenotypic, functional, and transcriptomic profiling. Our results revealed that memory T cells preferentially localized in intestines and lungs during infancy and accumulated more rapidly in mucosal sites compared to blood and lymphoid organs, consistent with site-specific antigen exposure. Early life mucosal memory T cells exhibit distinct functional capacities and stem-like transcriptional profiles. In later childhood, they progressively adopt pro-inflammatory functions and tissue resident signatures, coincident with increased TCR clonal expansion in mucosal and lymphoid sites. Together, our findings identify staged development of memory T cells targeted to tissues during the formative years, informing how we might promote and monitor immunity in children.
Keywords: T cells, Infant Immunity, tissue resident memory T cells, mucosal immunity, developmental immunity
Graphical Abstract
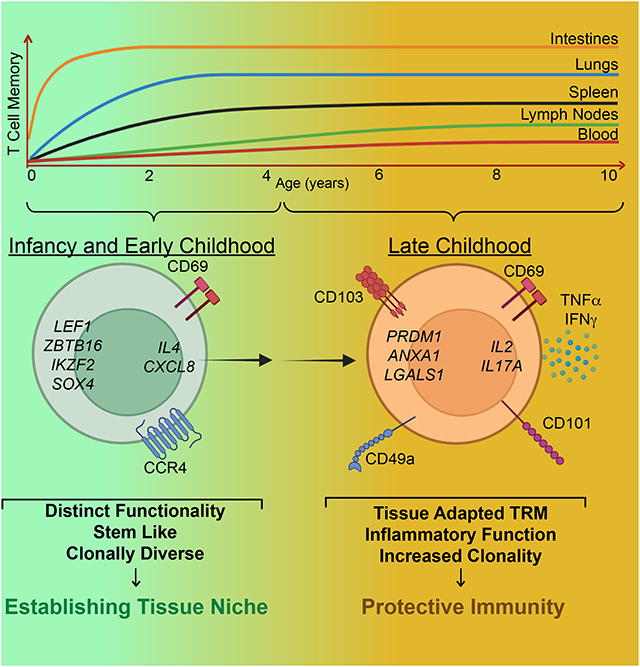
Immune memory generation during early childhood is critical for long-term protective immunity. Connors et al. analyze the development of human memory T cells in lymphoid organs, mucosal sites and blood over infancy and childhood. Memory T cells accumulate rapidly in intestines and lungs, and display age- and tissue-driven maturation stages.
INTRODUCTION
Infancy and childhood are critical periods for development and maturation of adaptive immunity. During this time, the immune system establishes protective immunity to pathogens and tolerance to innocuous microbial and environmental antigens. T cell-mediated responses during this window can set the stage for a lifetime of protection and health or predispose to dysregulated immune responses including allergies and inflammatory diseases1,2. While it is well known that infection and vaccination during infancy and childhood can generate immune memory and lifelong protective immunity3, identifying the pathways for T cell memory development during this life stage in humans has been elusive due to sampling constraints across all pediatric ages. A comprehensive understanding of human T cell differentiation and memory formation at the earliest life stages and defining when pediatric memory T cells reach functional maturation is needed to develop strategies for immune monitoring, vaccination, and immunotherapies targeted to children.
Immune memory is generated following primary responses to newly encountered antigens, which constitutes the majority of early life exposures. Naïve T cells are primed by antigen-bearing dendritic cells in lymphoid organs and subsequently differentiate to cytokine-producing effector cells. These effector cells migrate to sites of infection, and ultimately give rise to a heterogeneous memory pool maintained in blood and peripheral tissues. Tissue-resident memory T (TRM) cells are generated in sites of prior antigenic exposure, predominate in mucosal and barrier sites, and are critical for coordinating rapid protective responses in mouse infection models4–6. In humans, TRM cells are distinguished by a core phenotypic, functional, and transcriptional signature7,8 and comprise the majority of T cells in mucosal and peripheral tissues of adults7,9–11. We found that the proportion of TRM cells in specific sites, including the lungs and intestine remains stable over adulthood7,9,12,13, suggesting that the dynamic events in TRM formation occur much earlier in life.
The immune response in children is distinct from that of adults, and there are documented differences in activation and differentiation properties of neonatal compared to adult T cells14. In mouse models of virus infection, infant T cells exhibit higher proliferative responses and lower activation threshholds compared to adult T cells, and readily home to tissue sites of infection14–17. Despite the ability of early life T cells to generate tissue-homing, virus-specific effector cells, the subsequent development of memory T cells, including TRM cells, is reduced in mice infected as infants compared to adults14,17–19.
In humans, T cells respond to numerous pathogens which enter barrier and mucosal sites early after birth, as babies born without T cells (as in complete DiGeorge syndrome) develop multiple life-threatening infections at mucosal sites and succumb before 2yrs of age unless they receive a thymus transplant20,21. In blood, there is evidence for dynamic immune responses during the first weeks and months of life, though T cells remain predominantly naïve22,23, suggesting T cell activation is occurring elsewhere. We and others have detected memory T cells in intestines during infancy12,24–26; however, the fate and functions of these early memory cells remain unknown, including whether TRM cells develop directly from early exposures or require additional maturation. The pathways and timing for generation of functionally protective memory responses in humans have not yet been elucidated.
In this study, we analyzed samples obtained from 96 pediatric organ donors and study participants aged 0–10 years to reveal how T cell memory develops in mucosal sites and lymphoid organs and is manifested in blood from birth through the first decade of life. We identify site-specific accumulation of memory T cells in different sites, including rapid accrual of memory T cells in lungs and intestines during the first 3 years of life, and more gradual appearance of T cell memory in lymphoid organs and blood. We found that memory T cells exhibit staged maturation over childhood in mucosal sites coincident with downregulation of stem-like transcription factors; early mucosal memory T cells lack proinflammatory function and have reduced TRM cell marker expression compared to mucosal memory T cells in children 4 years of age and older which exhibit mature TRM phenotypes and function. Tracking TCR clonal dynamics reveals progressive increases in clonality over childhood in lymph nodes, consistent with dynamic priming of memory T cells at all ages. Our results identify key milestones in the development of T cell memory involving rapid mobilization in mucosal sites of high antigenic exposure and age-associated acquisition of tissue residency and functional capacity, leading to regional specialization of memory for robust protective immunity.
RESULTS
Pediatric samples to define immune development in blood and tissues
Pediatric blood and tissue samples including lungs, intestines, and lymphoid organs (spleen, lung- and gut-associated lymph nodes (LN)) were obtained from 68 organ donors, aged 0–10 years, including 30 donors <2 years of age to closely investigate this dynamic period of life (Figure 1A, Table S1; see Materials and Methods). Additional pediatric blood samples were obtained from children undergoing phlebotomy in the outpatient setting (aged 2 months-10 years (median age 2 years), n=28; Figure1A), including 12 subjects <2 years old. These pediatric cohorts represented a diverse racial and ethnic composition (Figure 1B). We analyzed these samples using confocal imaging, flow cytometry, and whole transcriptome profiling by RNA-sequencing (RNAseq) to determine how T cells populate tissues and develop immune memory over infancy and childhood, compared to adult tissues (n=8, Table S1).
Figure 1. Pediatric samples for examining T cell differentiation across blood and tissues over childhood and accumulation in mucosal sites.
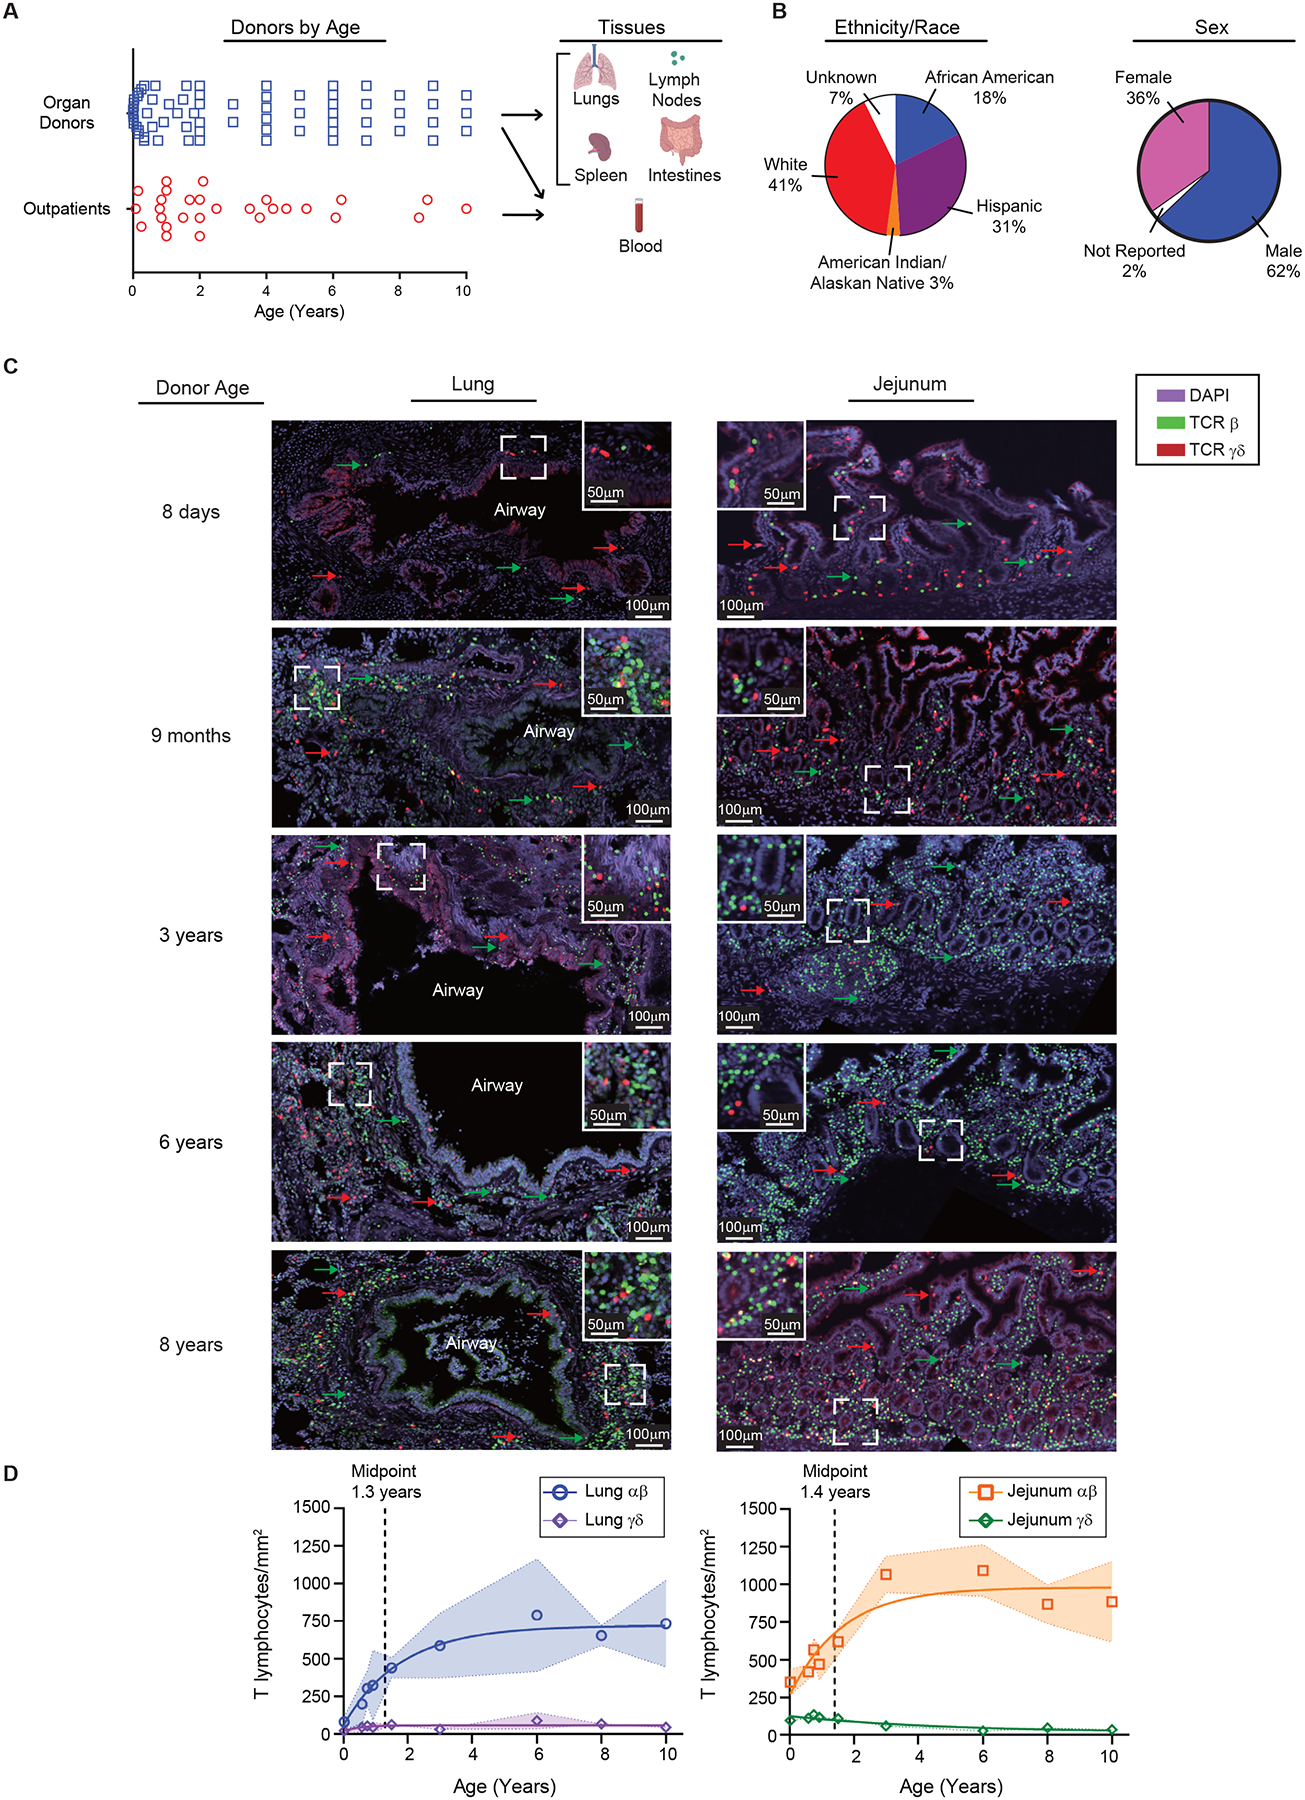
(A) Donor and subjects included in this study organized by age (left; organ donors: n=68, outpatients: n=28) and samples (right) used in this study. (B) Donor and subject demographics. Pie charts show stratification of pediatric donors and subjects combined by reported ethnicity and race. (C) T cell accumulation in mucosal sites over early life and childhood. Immunofluorescence imaging on sections obtained from lungs and intestines of organ donors (n=9). Representative staining with antibodies to T cell receptor (TCR) β, TCR γδ, and DAPI on lung (left) and jejunum (right) sections from 5 organ donors paired by row. CD3+ cells are shown based on their expression of TCR β (green) and TCR γδ (red). Sections shown at 40x magnification (with line demonstrating 100μm distance) with dotted square box shown as inset at 80x (line depicting 50μm distance). (D) Compiled analysis of αβ and γδ T cells by area (y-axis, cells/mm2) and age (x-axis, years) from lung (left) and jejunum (right). Data points represent mean cell/mm2 of sections from each individual donor (n=3–6 sections/donor) with shading depicting one standard deviation from the mean. Statistical testing was performed by Pearson correlation demonstrated correlation between age and cells/mm2: lung αβ; p=0.0025, jejunum αβ; p = 0.0292, and jejunum γδ; p = 0.0026. Line depicts best fit as determined by modeling (see methods). T cell subsets displayed as lung αβ (blue circles), lung γδ (purple diamonds), jejunum αβ (orange squares), jejunum γδ (green diamonds). See also Figures S1–3 and Table S1.
Accumulation of αβ T cells in mucosal sites during early life
The extent to which T cells seed mucosal sites during early life was investigated by confocal imaging of lungs and intestines. Quantitative immunofluorescence (IF) analysis revealed low densities of conventional αβ T cells and γδ T cells (lymphocytes of restricted diversity which develop early in ontogeny27) in each site in the early weeks of life (Figure 1C, Figure S1A,B). During the first 3 years of life, there were marked increases in the densities of αβ T cells in both lungs and intestines, accumulating around airways and in the lamina propria, respectively (Figure 1D). While the jejunum exhibited a greater density of αβ T cells than the lungs (Figure S1C), the kinetics of accumulation were similar for each site with midpoints of their accumulation at ages 1.3 and 1.4 years, respectively (Figure 1D). By contrast, the density of γδ T cells remained constant in the lungs and declined slightly but significantly in the jejunum during the early years of life (Figure 1D, Figure S1C). By flow cytometry, we found decreased frequencies of γδ T cells over childhood in the jejunum, consistent with imaging, and low frequencies of γδ T cells in the LN over age (Figure S2 and S3A). This progressive increase in αβ but not γδ T cells, in mucosal sites over the first few years of life suggest antigen-driven mechanisms rather than an autonomous developmental program.
Site-specific localization and accumulation of memory T cells over childhood
We hypothesized that the rapid increase in αβ T cells in mucosal sites was due to antigen-driven generation of effector and memory T cells. We used CD45RA and CCR7 expression to delineate naïve and previously activated or memory subsets including effector-memory (TEM), central-memory (TCM), and terminal effector (TEMRA) cells28 in blood and tissues of pediatric donors (Figure S2, S4). For assessing naïve and memory CD4+ T cells, we excluded regulatory T cells (Treg cells, CD4+/CD127−/CD25+/FoxP3+) which are thymically derived; Treg cell frequencies were generally low in tissues (<10%) and declined after the early years of life in intestinal sites and associated LN (Figure S3B) consistent with prior studies24. Overall, naïve CD4+ and CD8+ T cells were the predominant αβ T cell subsets in lymphoid organs and lungs during the first year of life, while CD4+ and CD8+ TEM (and CD8 TEMRA) cells were present in intestinal sites even at birth (Figure 2A, Figure S4A). From ages 2–10 years, CD4+ and CD8+ TEM cells were predominant in the intestines and lungs and exhibited substantial frequencies in lymphoid organs (Figure 2A). Across all ages, TCM cells were more prevalent among CD4+ compared to CD8+ T cells, found in low frequencies in blood, lymphoid sites, and colon, while TEMRA cells were mostly found among CD8+ T cells in lung, spleen, and intestines (Figure 2A, Figure S4B). Comparing the frequencies of non-naïve subsets across sites revealed significant differences between mucosal and blood/lymphoid sites for TEM, between gut and other sites for CD4+ TCM, and between spleen/lung and other sites for TEMRA (Figure S4C). Together, these findings show compartmentalization of memory subsets during early life and childhood largely in mucosal sites.
Figure 2. Memory T cells develop rapidly in mucosal sites with slower accumulation in blood and lymphoid organs.
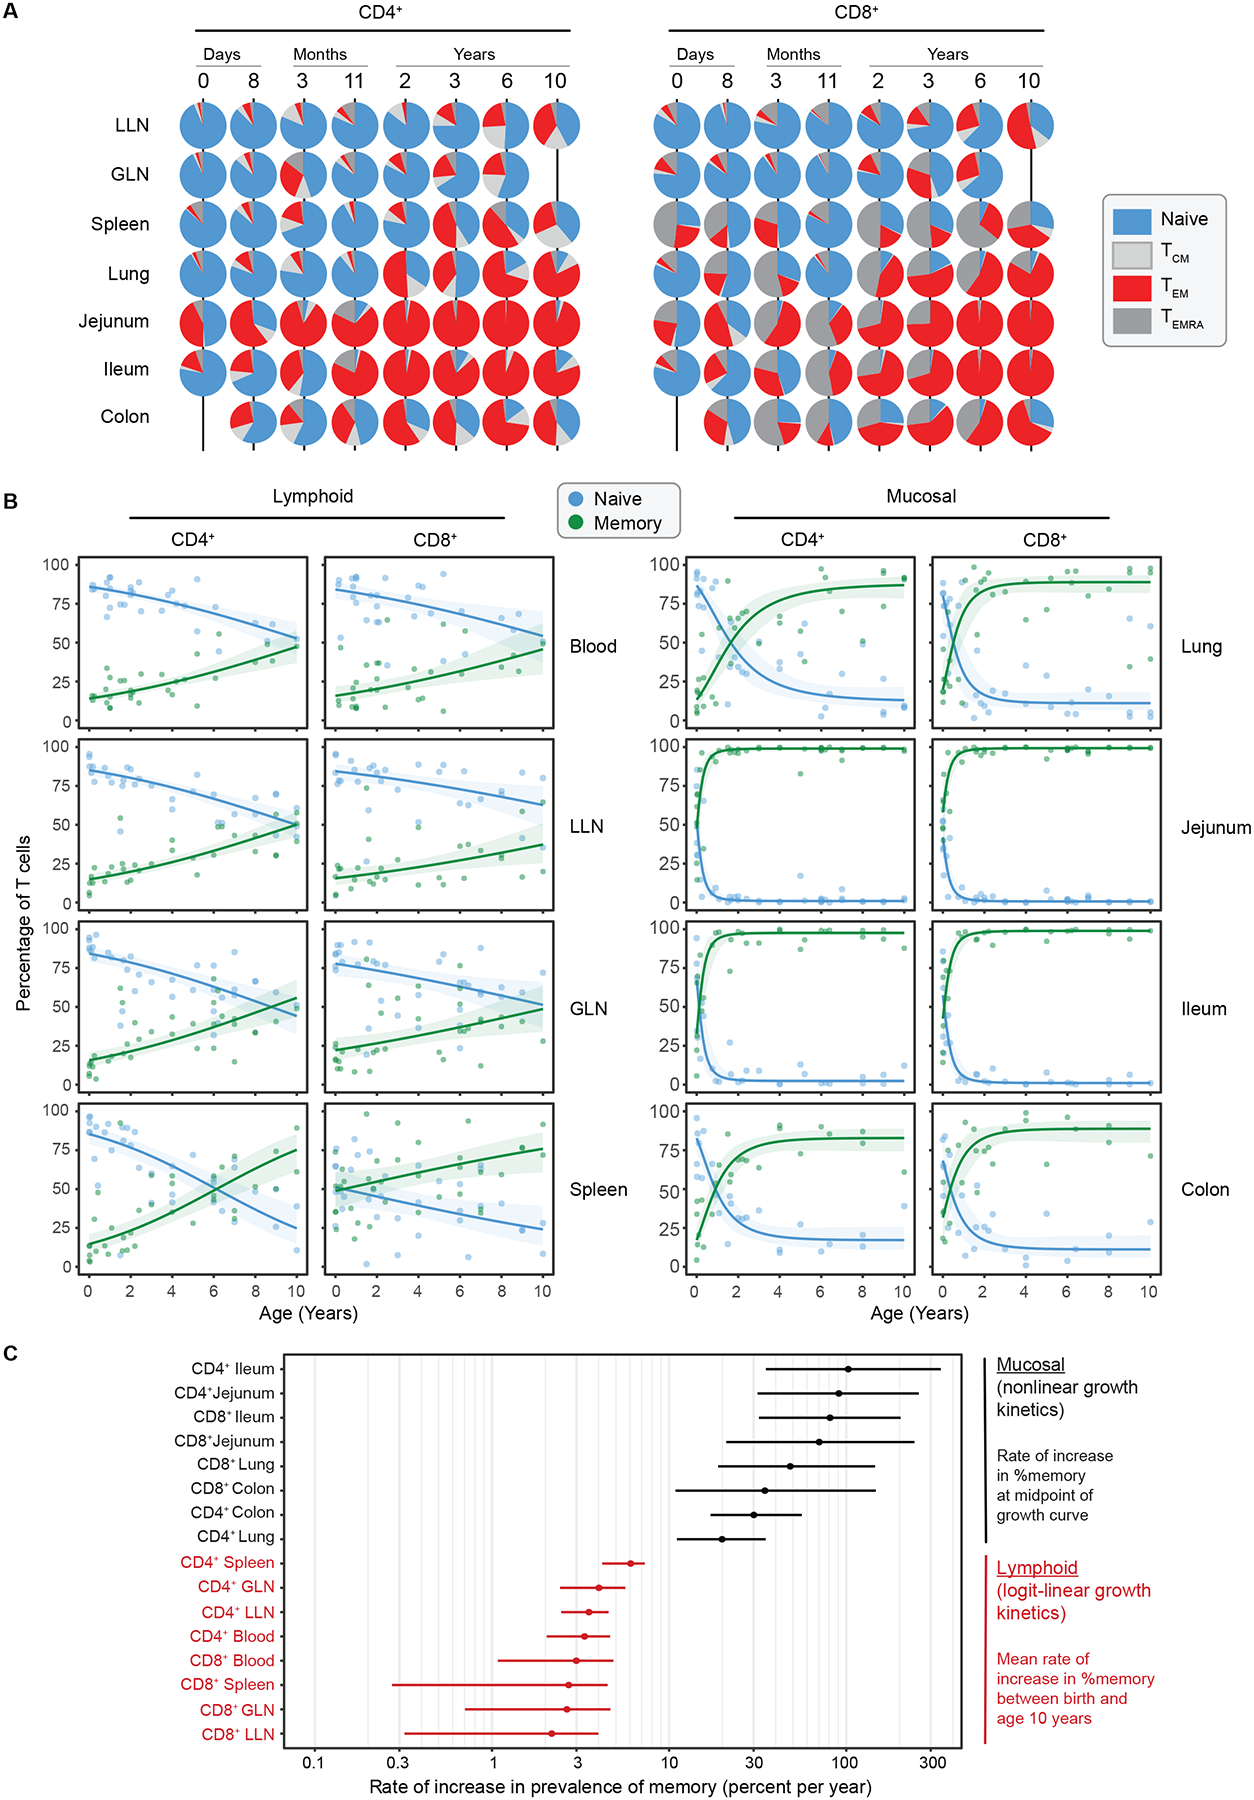
High-dimensional flow cytometry analysis was performed to identify major T cell subsets by tissue and age. (A) T cell subsets were defined by expression of CCR7 and CD45RA: Naïve (CCR7+CD45RA+, blue), Central Memory (TCM cells; CCR7+CD45RA−, light gray), Effector Memory (TEM cells; CCR7−CD45RA−, red), and Effector Memory cells expressing CD45RA (TEMRA cells; CCR7−CD45RA+, dark gray). Piecharts showing the proportion of CD4+ (left) and CD8+ (right) memory subsets within each tissue (row) for representative donors (column) of indicated ages over the first 10 years of life. (B) Compiled data from all donors showing relationship of total memory cells (TEM + TCM + TEMRA) (green) to naïve (blue) T cells vs age over the first 10 years of life, organized by tissue with lymphoid (left; blood n = 31, spleen n = 36, lung lymph node (LLN) n = 33, gut lymph node (GLN) n = 35) and mucosal (right; lung n = 36, jejunum n = 41, ileum n = 29, and colon n= 25). Lines depict best fitting model (see methods) logit-linear (lymphoid tissues) or nonlinear (mucosal tissues) with shading indicating 95% confidence intervals. C) Graph depicts log scaled maximal % accumulation rate per year (x-axis) of CD4+ and CD8+ memory T cells by tissue site (y-axis) with data organized by highest to lowest rate. Dots represent mean and bars represent 95% confidence intervals. See also Figure S2–5 and Table S1.
To depict memory T cell accumulation more clearly in each site over age, we plotted the increase in total memory T cells (TEM+TCM+TEMRA) and concomitant decrease in frequency of naïve T cells over age (Figure 2B). There was an exponential increase in memory accumulation in mucosal sites (lungs, small and large intestines) compared to more gradual, linear increases in blood and lymphoid organs (Figure 2B, Figure S5). For mucosal sites, the frequency of memory T cells approached 100% during the first 10 years, in contrast to lower magnitudes in lymphoid organs (25–60% in LN), and blood (~50%) (Figure 2B). These findings establish that the rate and magnitude of memory T cell accumulation is site-specific and markedly different between mucosal versus lymphoid sites. Moreover, T cell-based readouts of rapid memory formation during infancy are manifested in tissues and not in blood.
To define the kinetics of memory T cell prevalence more precisely, we characterized them empirically with logit-linear and non-linear models (Figure 2C). In mucosal sites, memory T cells accumulated rapidly, doubling their frequency each year in small intestines and achieving comparably high rates in lungs and colon (Figure 2C); the age at the midpoint of their accumulation was <6 months in jejunum and ileum, and approximately 1 year in lungs and colon (Figure 2C). In stark contrast, the increase in memory T cell frequency in blood, LN, and spleen increased with age much more gradually--at <10% per year (Figure 2C). Together, these analyses reveal that site and timing are critical factors for memory T cell generation and naïve T cell maintenance.
Functional maturation of memory T cells is age and site-specific
A functional hallmark of memory T cells is their capacity to rapidly secrete different types of effector cytokines post-stimulation, known as rapid recall. To assess the intrinsic functional capacity of TEM cells, we used short-term stimulation with PMA/ionomycin in the presence of protein secretion inhibitors to bypass TCR signaling and directly assess the cytokine production within cells. Our results revealed differences in the production of key pro-inflammatory cytokines, interferon-γ (IFN-γ) and/or tumor necrosis factor-α (TNF-α) between lineages, sites, and across age (Figure 3A). Between lineages, CD4+ TEM exhibited higher frequencies of TNF-α production compared to CD8+ TEM in spleen, lung, and intestines while CD8+ TEM produced more IFN-γ compared to CD4+ TEM in all sites examined (Figure 3A,B; Figure S6A). Between sites, TEM in jejunum contained the highest frequencies of cytokine producers across all ages including putative multifunctional TEM producing both IFN-γ and TNF-α (Figure 3B)— a feature of mature memory T cells in humans29. These findings demonstrate tissue-specific differences in functional capacity of memory T cells in children.
Figure 3. Functional maturation of effector-memory T cells over childhood.
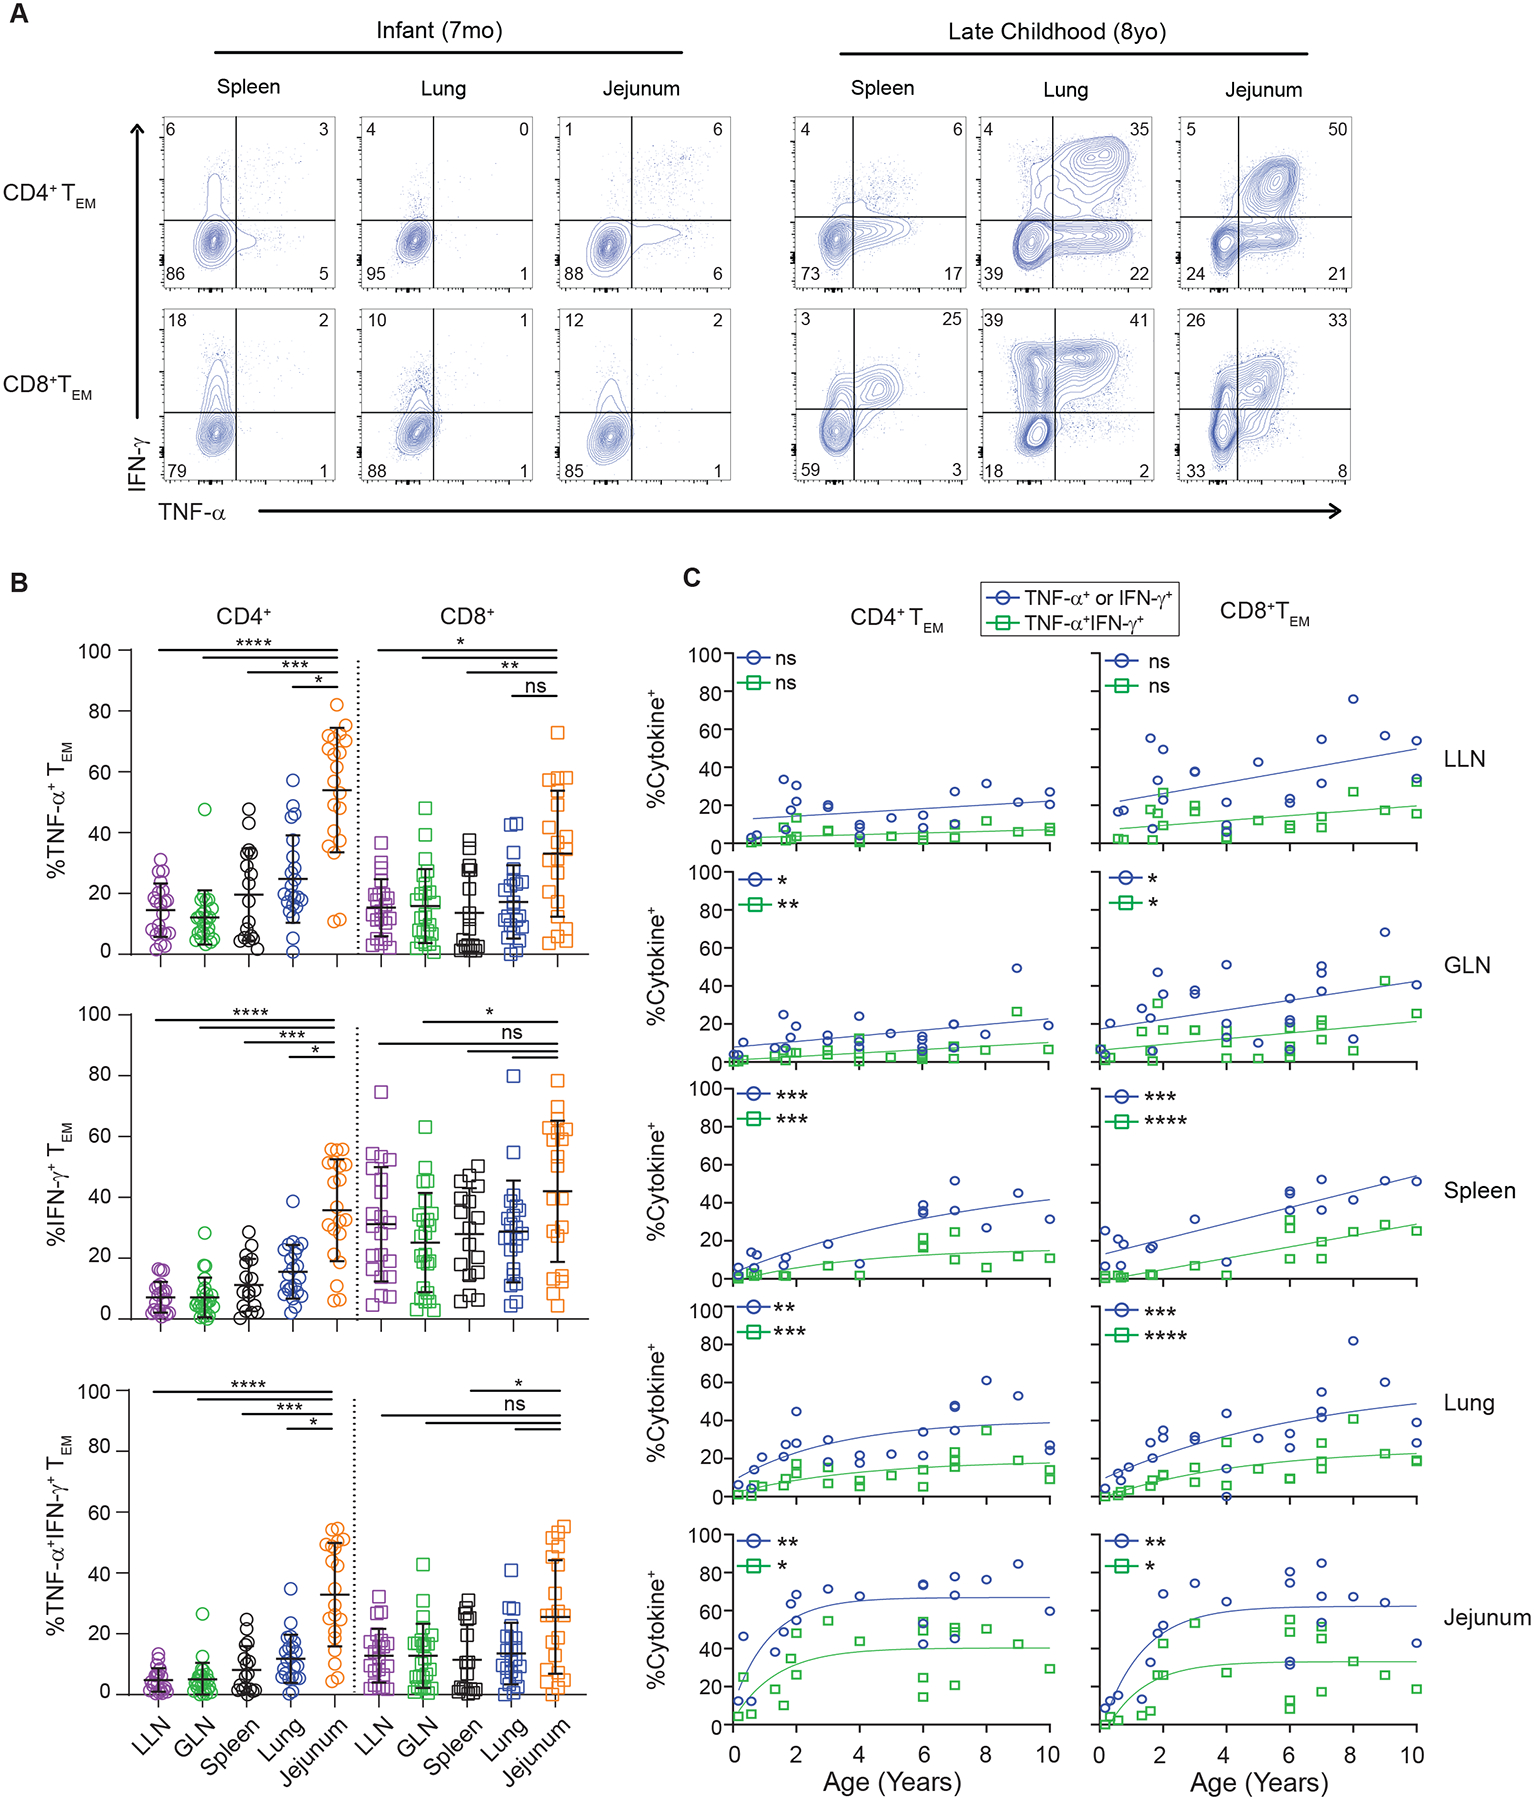
T cells from lymphoid and mucosal sites of organ donors aged 0–10 years were stimulated with PMA/ionomycin and effector cytokine production (TNF-α, IFN-γ) from TEM cells was assessed by intracellular cytokine staining (ICS). (A) Representative cytokine production by CD4+ (top) and CD8+ (bottom) TEM cells from indicated tissues obtained from an infant (7 months, left) and older pediatric (8 years, right) organ donor, showing frequency of IFN-γ+, TNF-α+ or IFN-γ/TNF-α+ cells in each site. Quadrants delineated based on unstimulated controls. (B) Effector cytokine production stratified by tissue site. Plots show cytokine production (TNFα+ (top), IFNγ+ (middle), and TNFα+/IFNγ+ (bottom)) by CD4+ (left) and CD8+ (right) TEM cells for each site for each individual pediatric donor. Lines depict mean with standard deviation. Statistical testing by Kruskal-Wallis Anova with Dunn’s correction for multiple comparisons. (C) Progressive acquisition of effector function over childhood. Cytokine production by CD4+ (left) and CD8+ (right) TEM cells in indicated sites over age showing frequency of cells expressing either TNFα+ or IFNγ+ (blue circles) and or both TNFα+/IFNγ+ (green squares). Lines depict best fitting linear or nonlinear model. Statistical testing using Spearman correlation. Donors; lung lymph node n= 21, gut lymph node n = 24, spleen n = 17, lung n = 22, and jejunum n=20. ns = p>0.05, * = p<0.05, **= p<0.01, ***=p<0.001, ****=p<0.0001. See also Figures S2,S6 and Table S1.
Across age, we identified progressive changes in memory T cell effector function in all sites. Memory T cells generated during infancy exhibited the lowest capacity for cytokine production compared to memory T cells isolated from older children (Figure 3A,C). There were increased proportions of CD4+ and CD8+ TEM cells producing either IFN-γ or TNF-α or both throughout childhood and in all tissues, except the LLN which demonstrated similar trends but did not reach statistical significance (Figure 3C). Between sites, the pattern of functional maturation with age followed exponential kinetics in intestines and lungs and linear kinetics in blood and lymphoid organs (Figure 3C), similar to the pattern of overall memory accumulation. These results reveal three important aspects of pediatric memory T cells in humans: 1. Early life memory T cells are functionally hyporesponsive independent of site; 2. Memory T cells functionally mature over childhood; and 3. The magnitude and kinetics of memory T cell functional maturation is site-specific.
Progressive acquisition of tissue residency markers over childhood
The majority of CD4+ and CD8+ memory T cells in lymphoid and mucosal tissues at all pediatric ages expressed the canonical TRM marker CD69, including 80–100% of mucosal memory T cells and 40–80% of lymphoid memory T cells (Figure 4A, Figure S6B). As expected, blood T cells lacked CD69 expression (Figure S6C). While there were slight but significant increases in CD69 expression with age over childhood in the spleen and LNs, (Figure 4A, Figure S6D), the high frequency of CD69+ memory T cells in lungs and intestines was similar in magnitude for these same sites in adults7,13. Moreover, CD69 expression by pediatric memory T cells in tissues was not associated with activation markers including CD25, and cytokine production in the absence of stimulation (Figure S2, Figure 3). Together, these results indicate that CD69 expression by mucosal memory T cells is a feature of localization in tissues and is not age-dependent; even at birth, memory T cells in all tissues express a core phenotypic marker of TRM cells that distinguishes them from memory T cells in blood.
Figure 4. Site- and age-regulated expression of tissue resident markers by mucosal memory T cells.
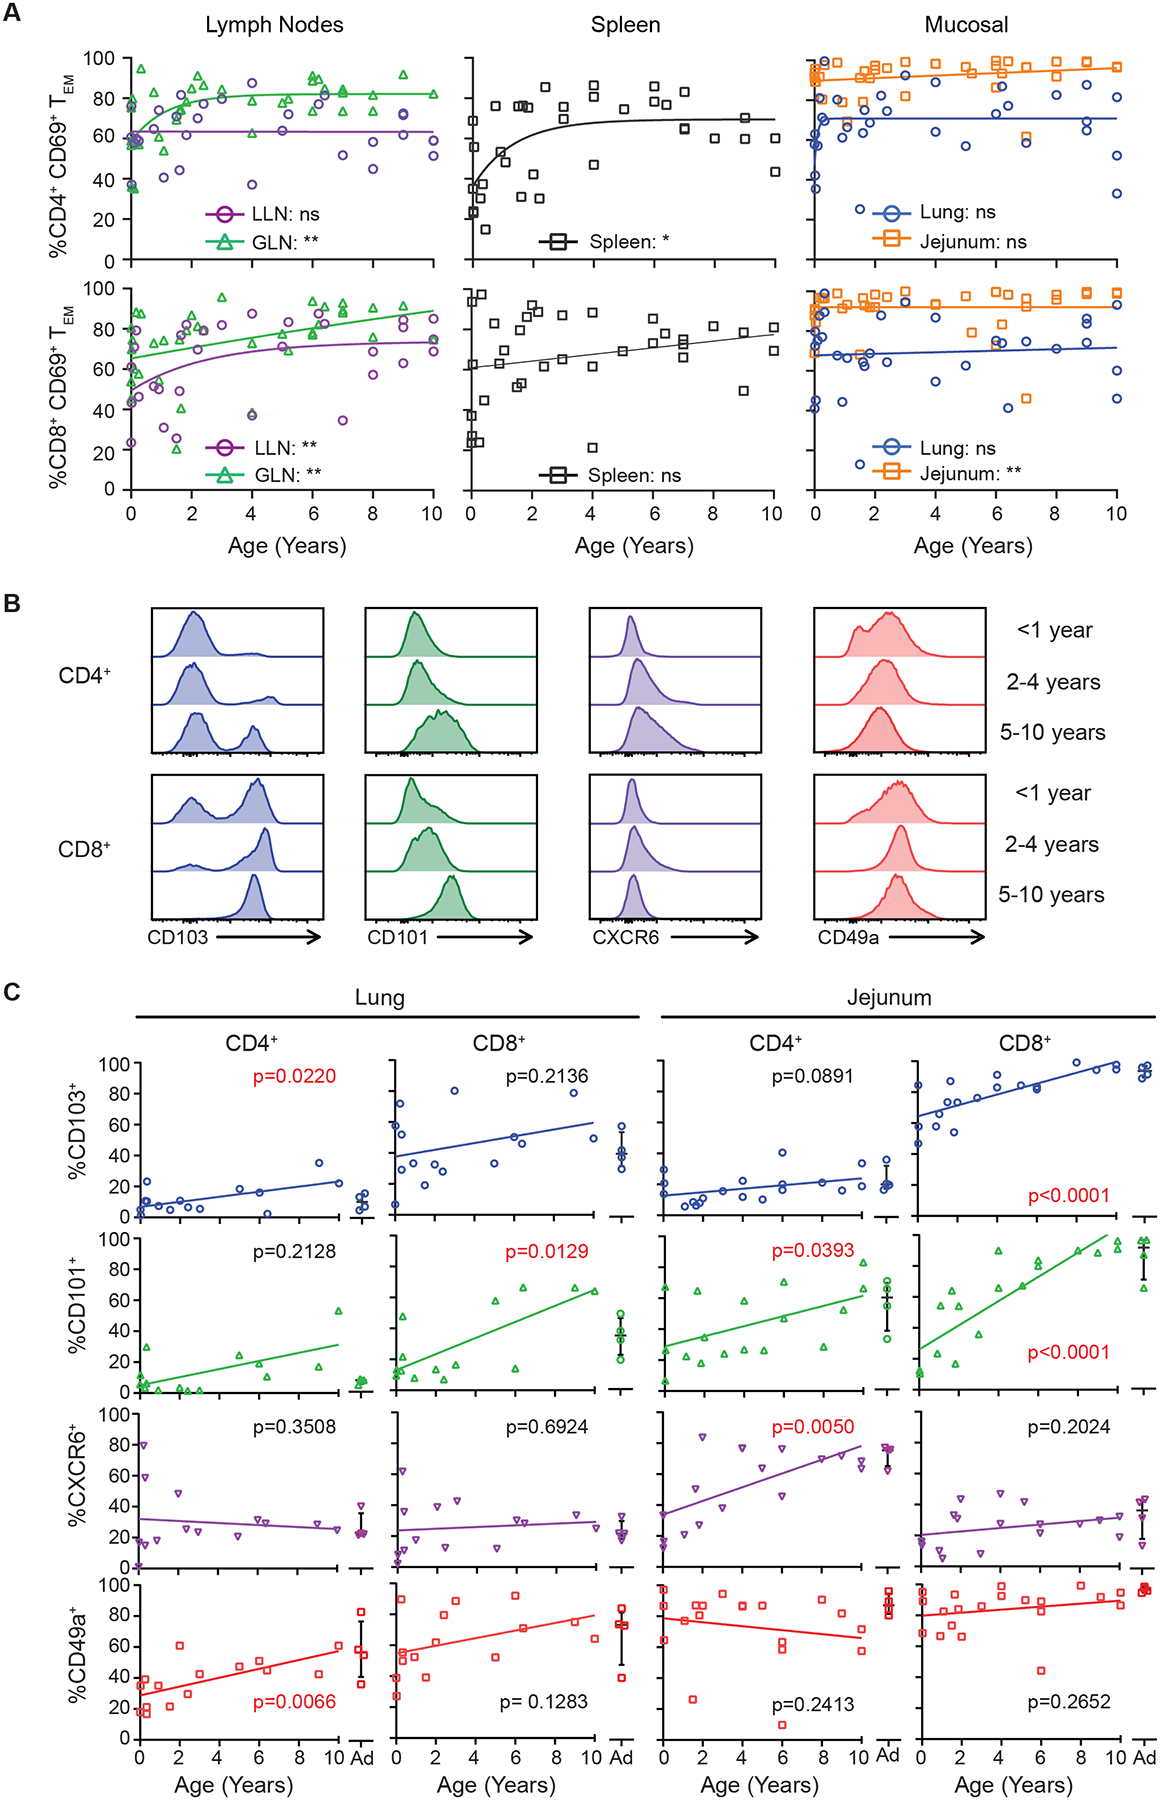
Flow cytometric analysis of expression of CD69 on effector memory (TEM) T cells. (A) Compiled data of all CD4+ (top) and CD8+ (bottom) % CD69+ TEM cells over age based on tissue site. Data organized by left (lymph nodes (LN); lung, gut), middle (spleen), right (mucosal; lung and jejunum). Statistical testing via Pearson or Spearman correlation with lines depicting best fitting model (linear vs nonlinear). Donors; spleen n = 35, LLN n = 31, GLN n = 36, lung n = 33, jejunum n = 39. (B) Flow cytometry histograms of core TRM marker expression by CD4+ (top) and CD8+ (bottom) CD69hi TEM cells from the jejunum of representative donors displayed by age grouping; <1 year, 2–4 years, and 5–10 years. Histograms normalized to mode. (C) Expression of TRM cell core markers (CD103, CD101, CXCR6, and CD49a) in the lung and jejunum over age shown in compiled data from infant (n=13–16) and adult organ donors (n=4 per graph, 8 total donors) by CD4+ (left) and CD8+ (right) CD69+ TEM cells. Values from adult donors (aged 20–50 years) are shown in each plot. Statistical testing performed using Pearson or Spearman correlation. * = p<0.05, ** p<0.01. See also Figures S2,S7 and Tables S1.
Expression of additional core TRM cell markers7, including the epithelial- and collagen-binding integrins CD103 and CD49a, respectively, the chemokine receptor CXCR6, and the negative regulator CD10130 showed differential expression across sites and over age (Figure 4B,C; Figure S6B). For a several TRM cell markers, the levels of expression by mucosal memory T cells in the early years of life was lower than observed in later childhood (Figure 4B, C). In particular, age-associated increases in CD103 surface expression were identified for lung CD4+ TRM and jejunum CD8+ TRM cells, CD101 expression for CD4+ and CD8+ TRM cells in the lung and jejunum, and CXCR6 and CD49a expression for CD4+ TRM cells in the jejunum and lungs, respectively (Figure 4C). These results provide evidence for dynamic maturation and tissue adaptation of pediatric TRM during the first decade of human life.
Transcriptional profiling reveals distinct stages of TRM cell development
To elucidate the underlying mechanisms for developmental maturation of early life mucosal memory T cells we assessed their gene expression profile across infancy and childhood. We performed population-level RNA-seq of sorted CD4+CD69+ and CD8+CD69+ TEM (TRM phenotype, Figure S2) cells from lungs and intestinal sites (jejunum, ileum) and their associated LN of 11 pediatric organ donors aged 3 months – 8 years binned into 4 different age groups: 0–1yrs; 1–3yrs; 4–6yrs, and >7years (Table S2). This strategy enabled direct comparison of transcriptional properties of memory T cells having a TRM-like phenotype across different ages. Principal component (PC) analysis of the transcriptional profiles for CD8+TRM cells in mucosal tissue showed that samples separated based on tissue (PC1) and age (PC2) with the youngest donors (<3 years) grouped together and distinct from older donors (>4 years) (Figure 5A). The number of differentially expressed genes (DEG) for CD8+TRM cells increased by age; there were low numbers of DEG between CD8+TRM cells in infants and CD8+TRM cells from 1–3 years in both sites, while there was a sharp increase in DEG relative to infant TRM cells in the 4–6yr and 7–10yr groups (Figure 5B). Moreover, the number of DEG between infants and older children was higher in the intestines compared to lungs (Figure 5B), consistent with the increased magnitude and kinetics of changes in intestinal T cells during early childhood shown earlier. Similar age-associated clustering and increases in DEG was observed for CD4+TRM cells in lungs and intestines (Figure S7A, B).
Figure 5. Transcriptional maturation of mucosal memory T cells over childhood.
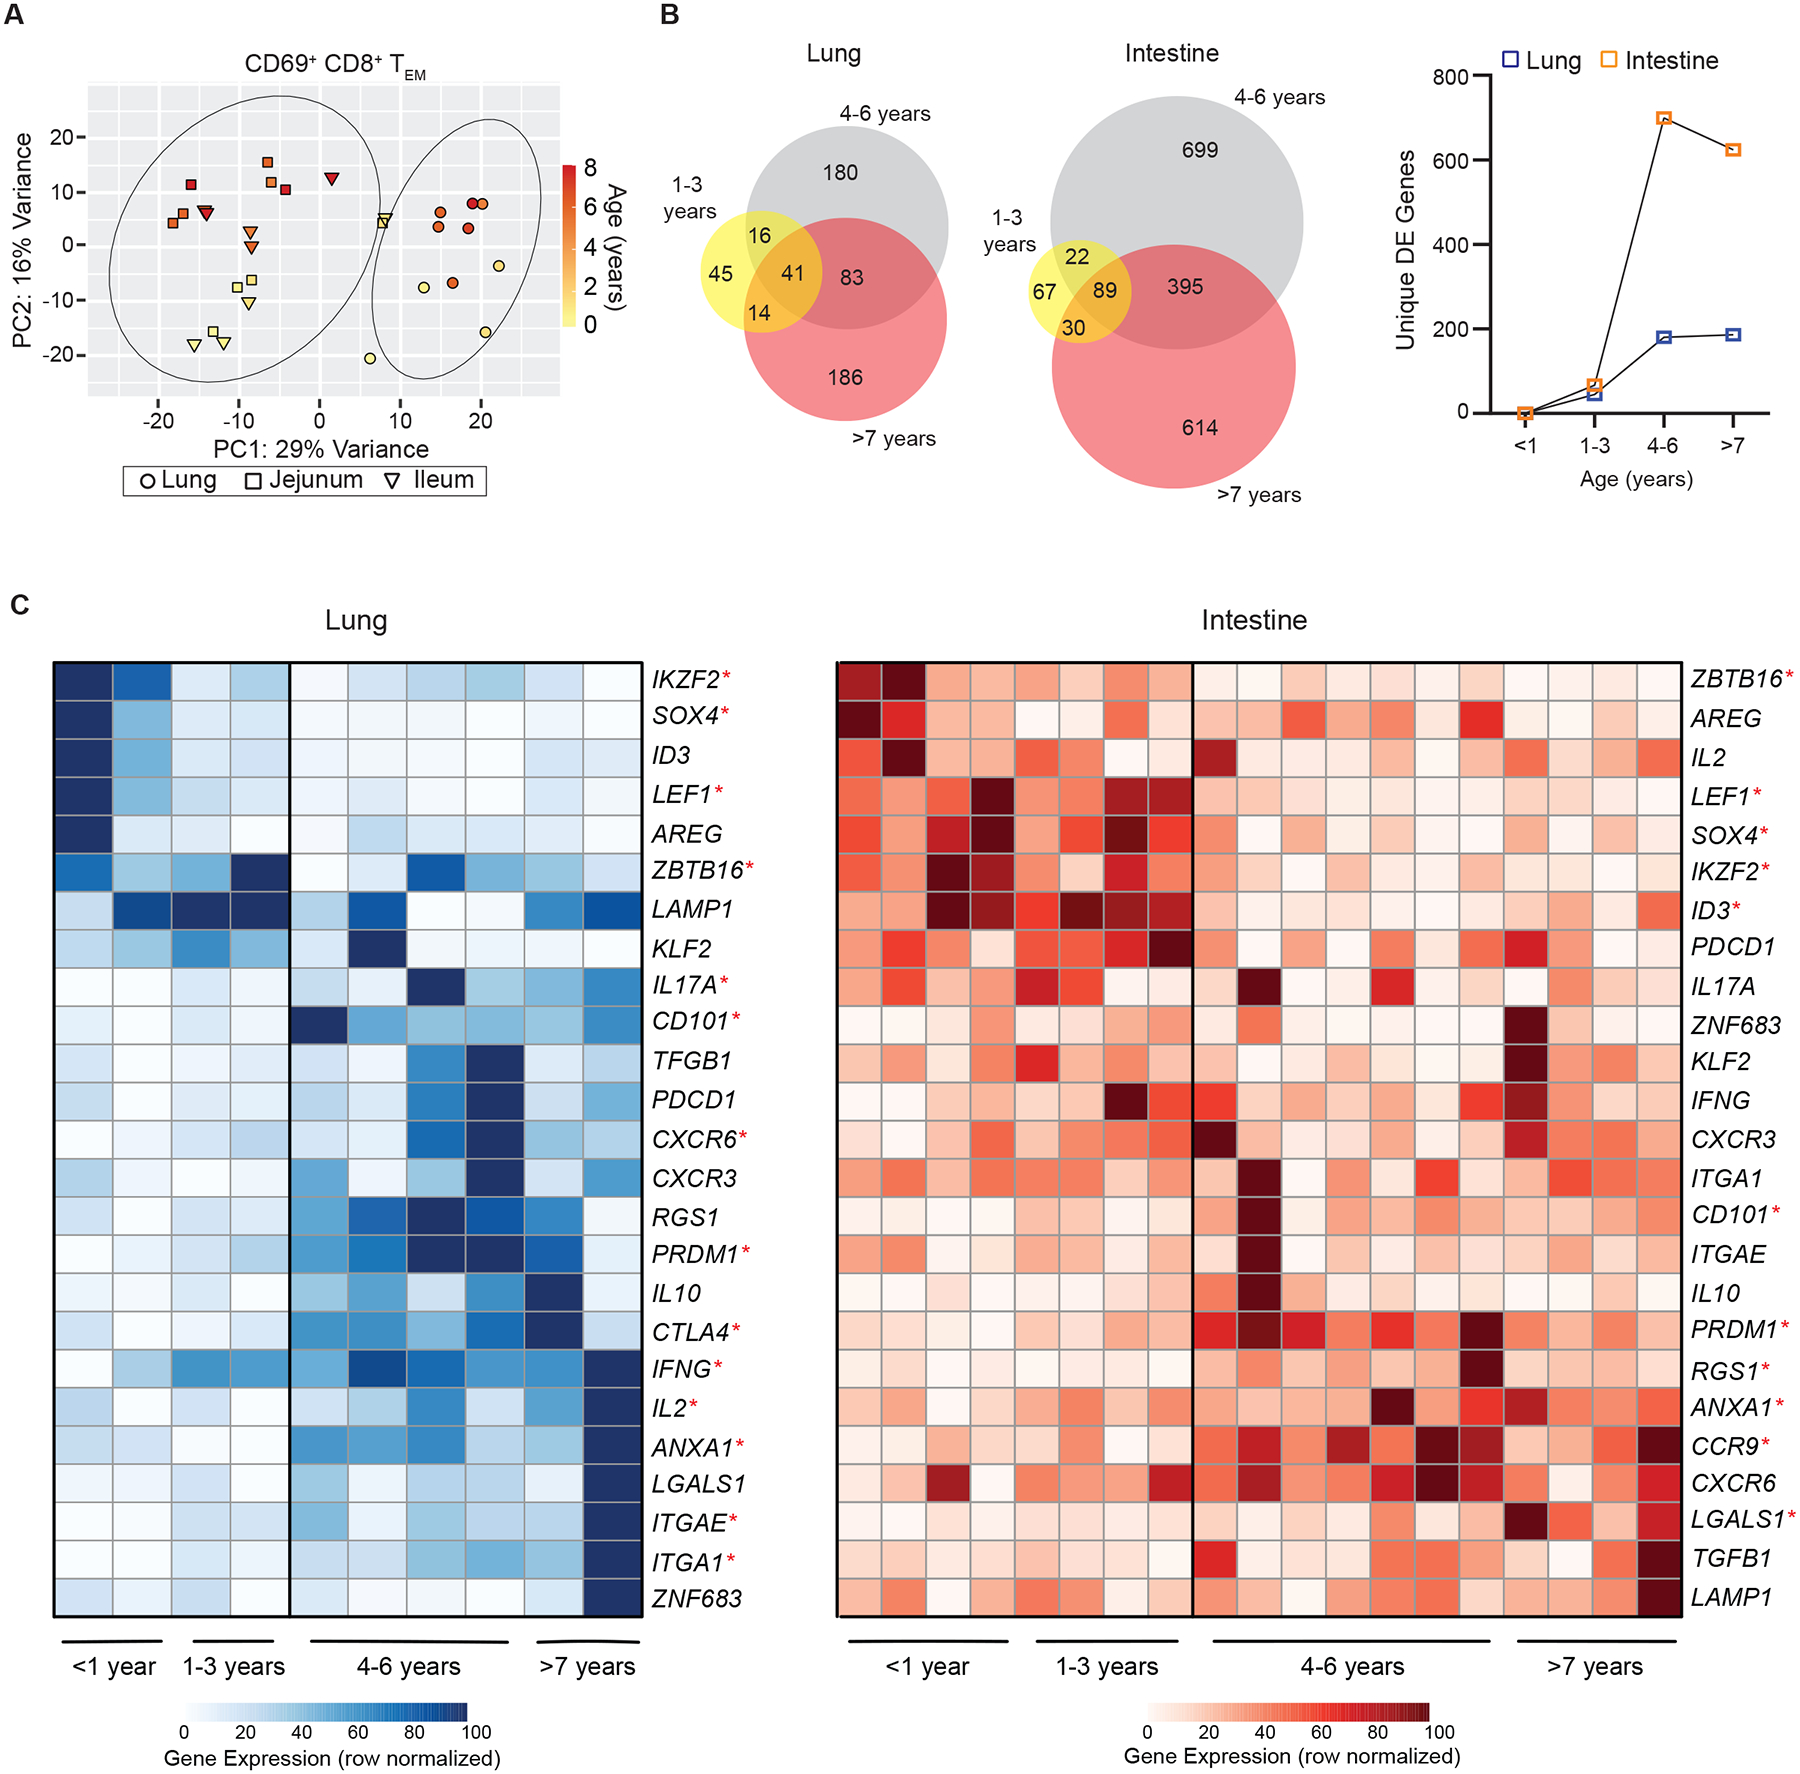
CD8+CD69+TEM cells were sorted from lungs and intestines from donors of indicated ages for whole transcriptome profiling by RNAseq (See methods). (A) Principal component analysis (PCA) of samples from the lung (circles; n = 10) and intestine squares; jejunum n=10, and triangle; ileum n=9) from n=11 organ donors (aged 3 months – 8 years) colored based on donor age. Circles represent one standard deviation based on tissue site (lung or intestine). (B) Differentially expressed (DE) genes from pediatric organ donors based on age groups (1–3 years, 4–6 years, and >7 years) relative to the youngest donors (<1 year). Venn diagrams (left) depicting DE genes (log2fold > ±0.5, p<0.05) within and across donor groups compared to the youngest donors. Line graph depicting unique DE genes in each age group compared to youngest donor group (lungs; blue squares and intestines; orange squares). (C) Heatmaps depicting row normalized gene expression of key genes differentially expressed over age by memory T cells isolated from lungs (left) and intestines (right) with donors (columns) arranged in increasing age. Statistical testing by Spearman or Pearson correlation analysis. * = p<0.05. See also Figure S2,S8 and Table S1–4.
Pathway analysis revealed that the genes influencing changes with age for CD8+TRM cells in the intestine (jejunum/ileum) and the lung were enriched for those regulating cellular differentiation, intracellular signal transduction, response to inflammation and cellular adhesion (Table S3). The specific genes which were significantly differentially expressed over age for TRM cells in lungs and intestines are depicted in heat maps (Figure 5C). For both sites, there was a set of genes which were more highly expressed in the youngest donors, <3 years of age, and another set of genes that was significantly elevated in the older children >4 years of age (Figure 5C). The genes with increased expression in TRM cells from the youngest donors (0–3 years of age) included fate-determining transcription factors involved or implicated in T cell development: IKZ2F (Helios)31, ZBTB16 (PLZF)32, SOX433,34, ID335. Early TRM cells also increased expression of the transcription factor LEF1, associated with stem-like properties36.
Conversely, genes specifically elevated in lung and intestinal TRM cells from older (>4 years) compared to the youngest children included multiple TRM signature genes (ITGA1 (CD49a), CD101, ITGAE (CD103), CXCR6), PRDM1, a central regulator of TRM cell formation in mice37, and genes associated with tissue adaptation (LGALS1, ANXA1)8. We also found increased expression of site-specific genes in TRM cells from older children including CCR9 in intestinal TRM cells, encoding a gut-homing marker38 and CTLA4 in lung TRM cells, a negative regulator known to be elevated in adult lung TRM cells7(Figure 6C). There was also increased expression of genes encoding multiple effector cytokines, such as IFNG, IL17A, and IL2, in TRM cells from older compared to the youngest donors within the lung (Figure 5C). Analysis of the gene expression for CD4+ TRM cells revealed similar age-related gene expression patterns with IKZF2, SOX4, and LEF1 expressed by early life TRM cells and LGALS1, PRDM1, CD101, expressed by TRM cells from older children (Figure S7). These results demonstrate a marked shift in the transcriptional profile of early life memory T cells from a stem-like cell state lacking signatures for certain effector functions and tissue residence, to a fully differentiated TRM cell expressing genes for core signature molecules, tissue adaptation, and effector function. These transcriptional results are also consistent with progressive increased expression of TRM cell surface phenotypes and cytokine production shown above.
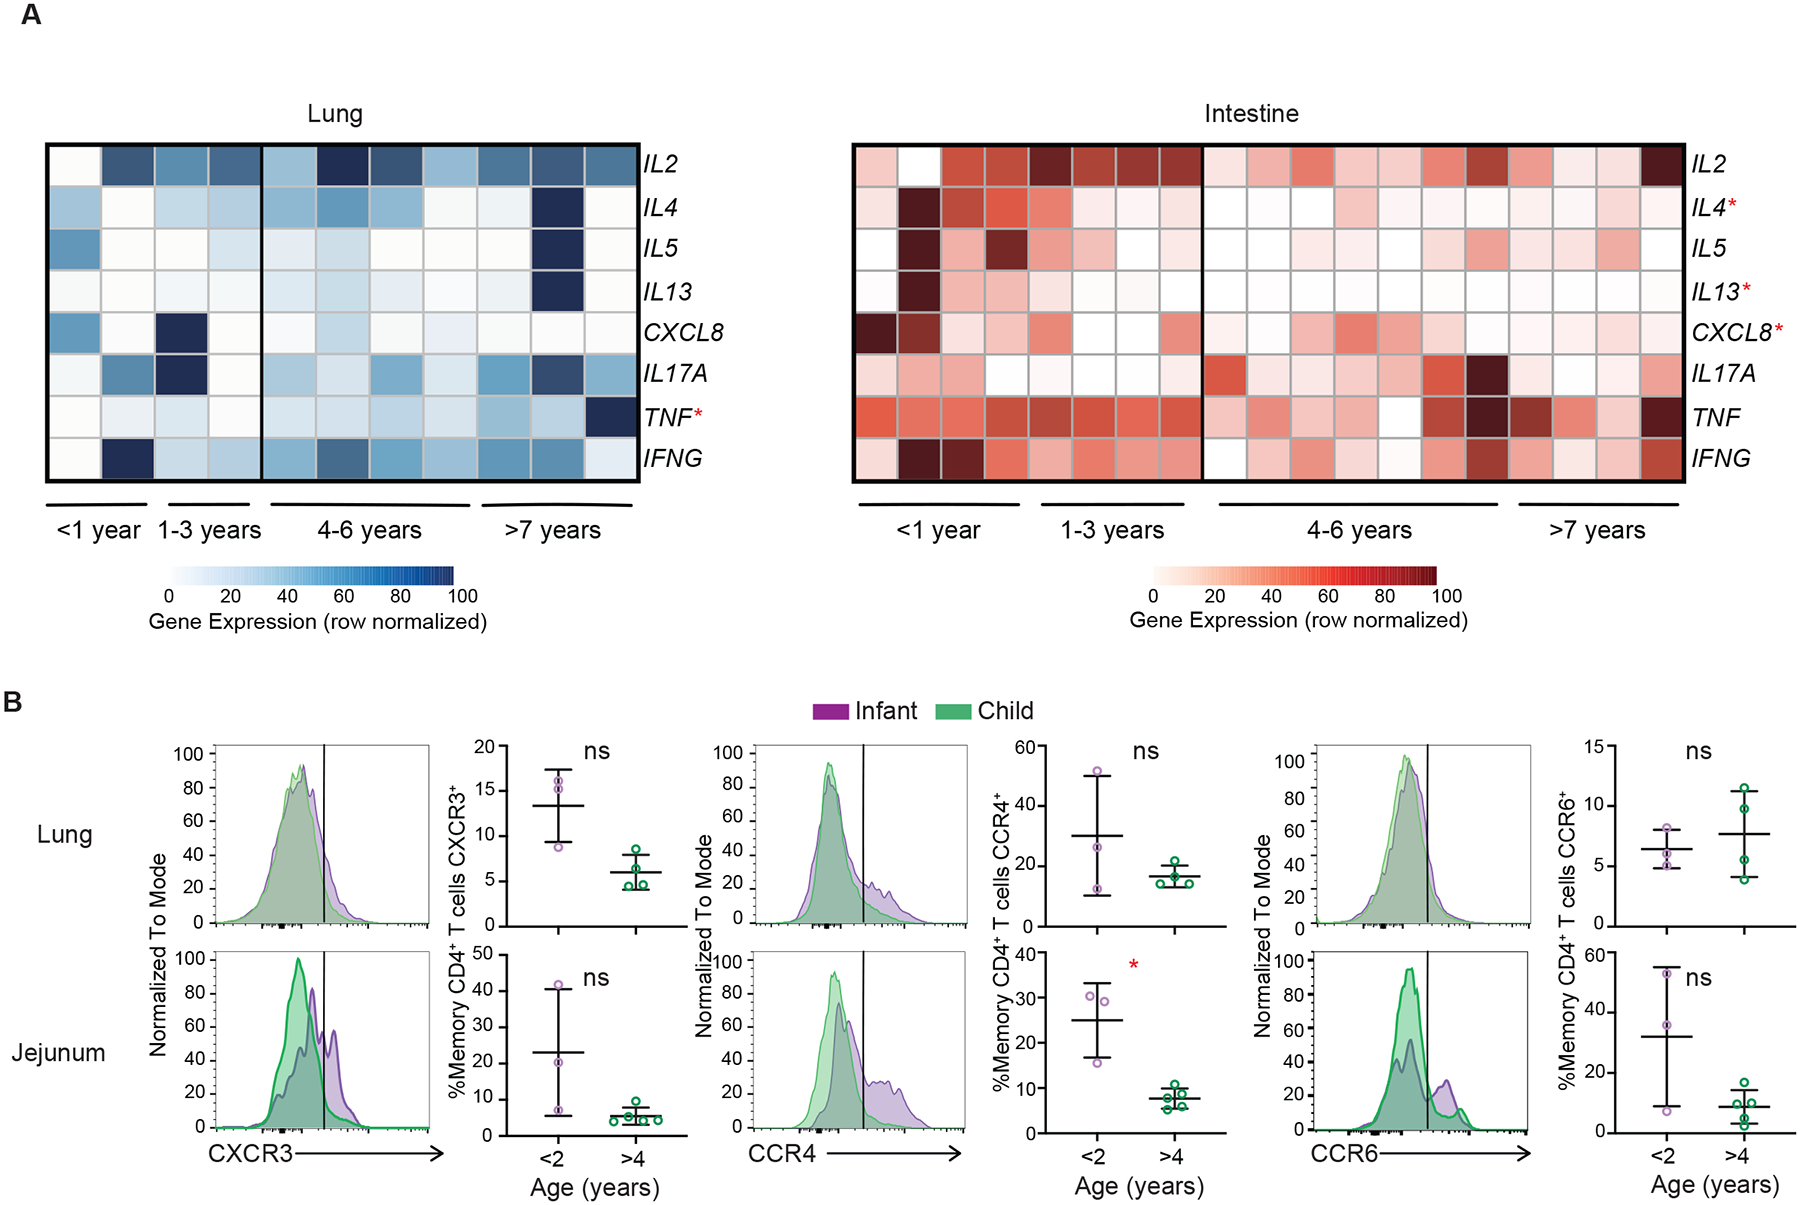
Figure 6: Dynamic shifts in functional capacity for memory CD4+ T cells over childhood.
(A) Heatmaps depicting row normalized cytokine gene expression from CD69+ CD4+ TEM cells within mucosal sites (lung; blue circles, n = 10 and intestine (jejunum and ileum); orange squares, n = 19) from n = 11 organ donors over age (0.3 – 8 years)). Statistical testing by Pearson or Spearman correlation. (B) Expression of indicated chemokine receptors denoting T-helper cell differentiation states by memory CD4+ T cells in lung (top; n=7) and jejunum (bottom; n=8) from organs donors aged 0.02–7 years shown as representative histograms (normalized to mode) from infant (<2 years; purple) and older child (>4 years; green) and compiled data from multiple donors. Statistical testing done with Mann-Whitney T test, lines depict mean and standard deviation. * = p <0.05, ** = p <0.01, *** = p<0.001. LLN = lung lymph node, GLN = gut lymph node. See also Figure S2 and Tables S1,S2.
Distinct cytokine capacity of memory CD4+ T cells in early compared to late childhood
Given the heterogeneity of CD4+ T cell effector functions39, we further interrogated changes in cytokine gene expression across age for mucosal memory CD4+ T cells using the RNAseq dataset (Figure 6A). Across both lung and intestinal sites, CD4+ T cells demonstrated age related changes in cytokine expression. In the intestine, transcripts encoding multiple cytokines associated with TH2 cell responses (IL4, IL5, and IL13) and the chemokine IL8 (CXCL8), which recruits and activates neutrophils, were highest in memory CD4+ T cells from the youngest donors (0–3yrs of age) and decreased in older children >4 years of age (Figure 6A). These results in intestines are consistent with previous studies showing predominant Th2 responses in neonatal mice40,41 and IL-8 was produced by newborn human T cells42; however, we did not see similar age-associated trends for Th2 and IL-8 genes in lung memory CD4+ T cells (Figure 6A). Over childhood, lung memory CD4+ T cells exhibited increased expression of transcripts encoding TNF-α (Figure 6A), consistent with cytokine secretion assays (Figure 3).
To further validate the functional state of mucosal memory CD4+ T cells, we assessed the surface expression of chemokine receptors associated with major T-helper cell lineages including CXCR3 for Th1 cells, CCR4 for Th2 cells, and CCR6 for Th17 cells43,44. Expression of CCR4 denoting Th2-like cells was higher in the intestine of donors <2 years of age compared to donors >4 years old and was also increased in lung CD4 T cells of younger compared to older children (Figure 6B). Expression of CXCR3 and CCR6 showed greater variation in intestinal compared to lung CD4+ T cells but was not different between age groups. Together, these findings point to a shift in the functional profile of mucosal memory CD4+ T cells in early years of life as being skewed to production of Th2-like cytokines and certain inflammatory mediators compared to memory CD4+ T cells in children >4yrs of age which exhibit mature Th1-like profiles and variable IL-17 production depending on site. These functional distinctions for memory CD4+ T cells are more strikingly manifested in the intestine, though they are more functionally heterogeneous across sites and donors than for memory CD8+ T cells.
Dynamic shifts in clonal diversity and tissue compartmentalization over childhood
Antigen exposure results in clonal expansion of T cells. To examine whether memory formation at different ages is associated with expansion of specific clones within or across tissues, we investigated the TCR repertoire including clonal expansion, distribution, and overlap across sites. We applied MiXCR to our population RNA-seq dataset, which included data from lung- and gut-associated LN (Table S5) (Figure 7A). Across sites and donors, CD8+ TRM cells were more clonally expanded than CD4+ TRM cells, and T cells in mucosal sites were more expanded compared to LN (Figure 7A). These trends are similar to our previous TCR repertoire analysis of memory T cells in adult tissues45.
Figure 7. T cell receptor analysis reveals loss of diversity and differential overlap between sites over age.
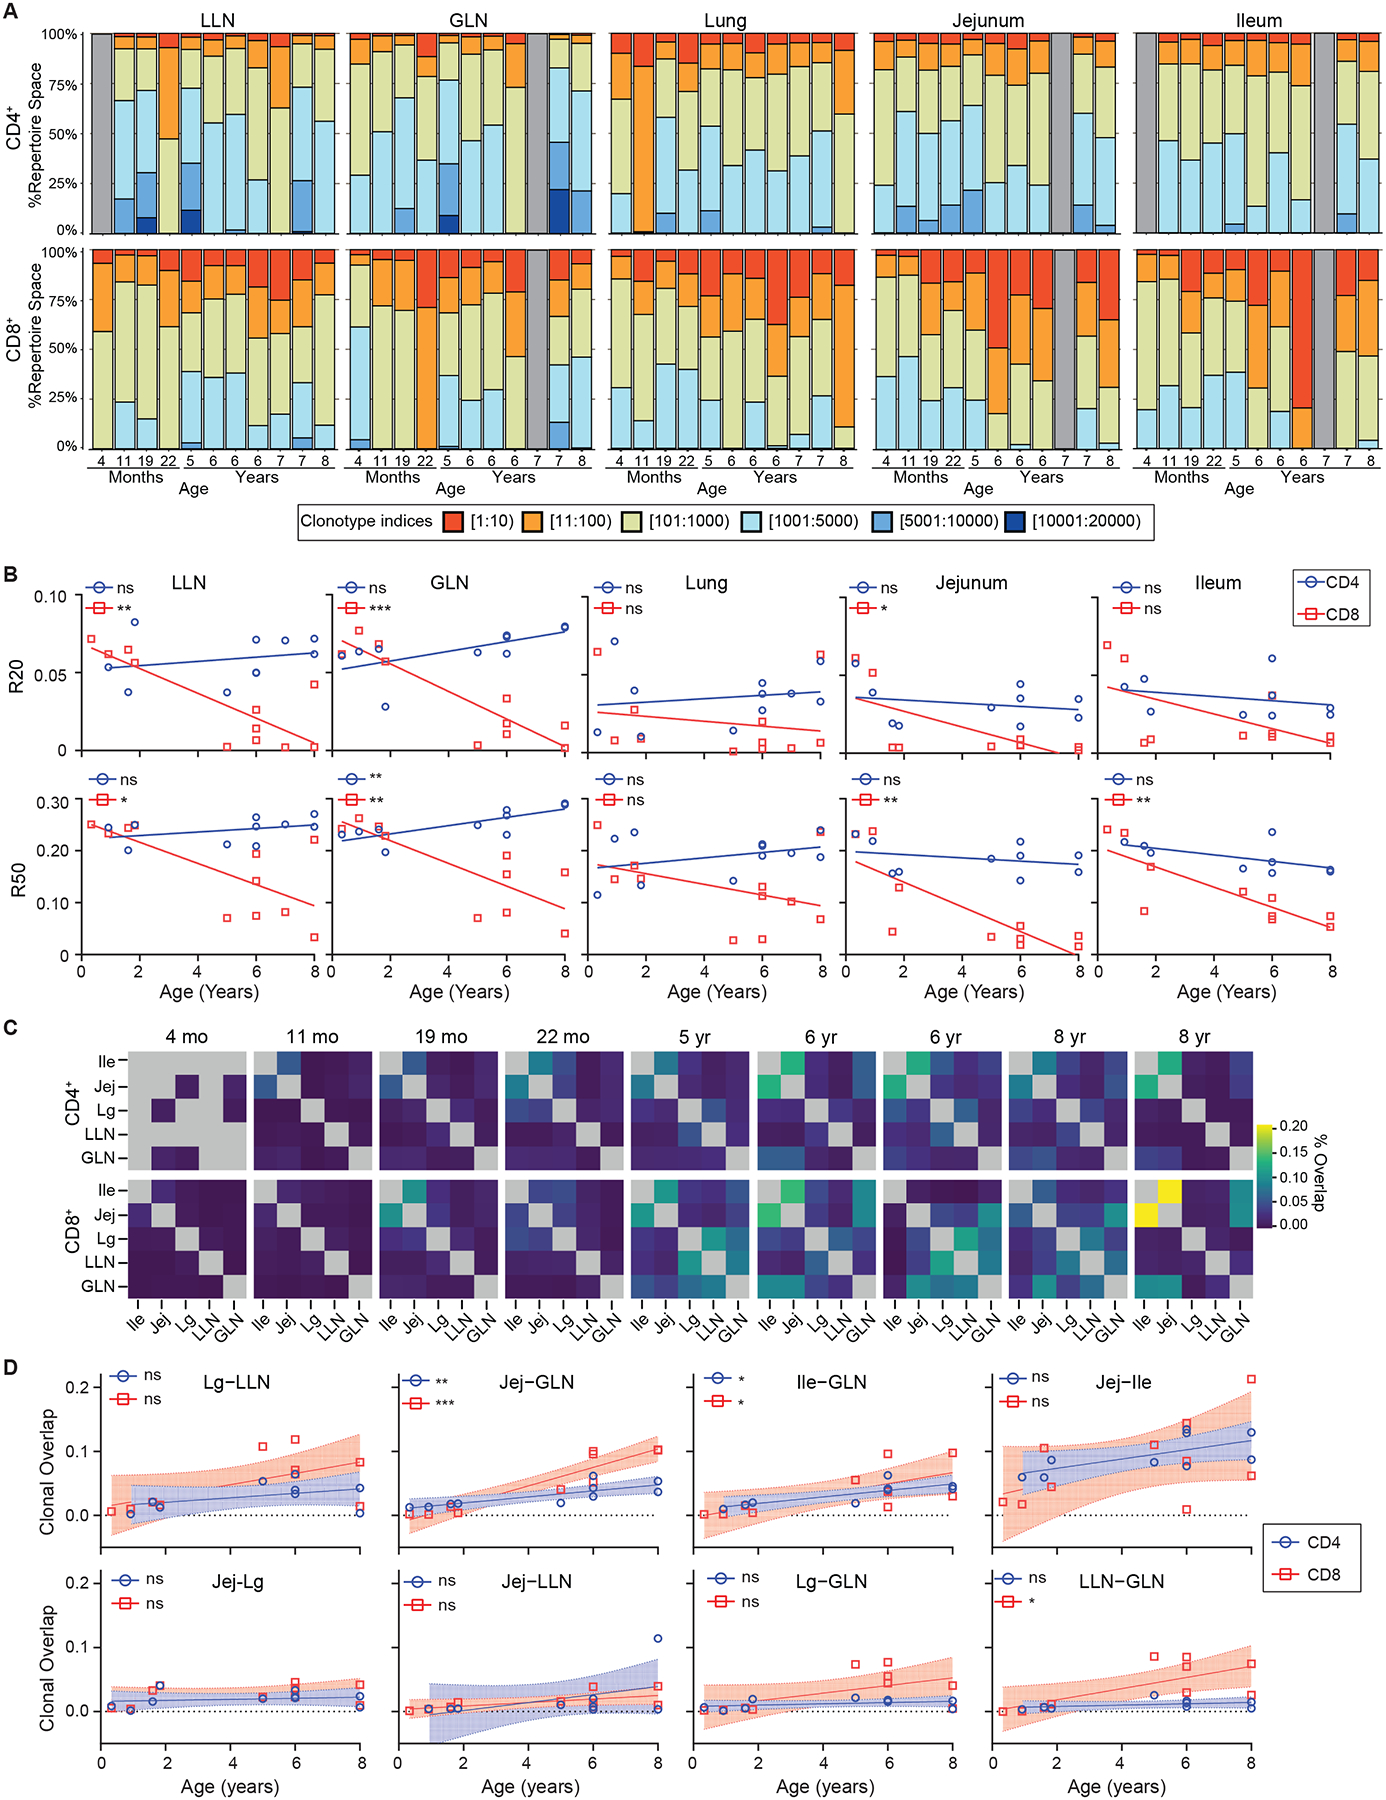
T cell receptor (TCR) analysis performed on population RNA sequencing of CD69+ TEM cells as in Fig. 5. (A) Clonotype analysis organized by tissue site (columns) and CD4+ (top) and CD8+ (bottom) with proportion of repertoire space (y-axis) occupied by clonotypes vs individual donors (x-axis; stacks) organized by increasing age. Gray bars depict donors/tissues were no sample was available. (B) R20 (top) and R50 (bottom) over age for CD4+ (blue circles) and CD8+ (red squares) T cells by tissue site. Statistical testing performed by Wald test. Line depicts best fitting linear or non-linear model. (C) Clonal overlap matrices for individual donors with CD4+ (top) and CD8+ (bottom) organized by individual donors (columns) by increasing age. Box color depicts % overlap. Gray boxes depict tissues were no sample was available. (D) Dotplots showing clonal overlap over age (years) for CD4+ (blue circles) and CD8+ (red squares) T cells. Line depicts best fit with 95% confidence interval. Statistical testing with Wald test. ns = p>0.05, * = p<0.05, ** = p<0.01, *** = p<0.001, **** = p<0.0001.
Abbreviations; Ile- Ileum, Jej- Jejunum, Lg- Lung. See also Tables S1,S5.
To characterize the extent of clonal expansion across tissue sites and age, we calculated R20 and R50, which denotes the fraction of total clones which cumulatively account for 20% and 50%, respectively of the sequenced repertoire (Figure 7B). R20 and R50 were similar (5–10%) across sites in the youngest donors, indicating a polyclonal memory response, but decreased over age rapidly in mucosal sites following exponential kinetics, and more gradually in lymphoid sites. This decrease in frequency occupied by R20 and R50 indicates clonal expansion over age, consistent with antigen-driven activation. We then assessed how the clonal repertoire was shared across tissue sites within individual donors (Figure 7C). Clonal overlap between sites was minimal in the youngest donors (<2 years of age); however, after 2 years of age, overlap between certain tissues was evident and increased with age (Figure 7C). Across all donors, the highest overlap was observed between adjacent mucosal sites (jejunum-ileum) followed by clonal overlap between mucosal sites and corresponding LNs (jejunum-GLN, ileum-GLN), which also increased with age. (Figure 7D). Across all ages, however, overlap was negligible between intestinal and lung sites (Figure 7D), suggesting compartmentalization of clonal repertoires. These results provide evidence that early life memory T cells comprise expanded and tissue-segregated clones, which become more expanded, and migrate between adjacent sites over childhood.
DISCUSSION
Our study provides a high-dimensional analysis of T cell development and memory formation during the critical developmental window of early life and childhood in multiple tissues and blood. We reveal rapid generation of memory T cells targeted specifically to mucosal sites, with slower accumulation in lymphoid sites and blood. Mucosal memory T cells in early life exhibit low effector function and expression of tissue residence markers, but progressively mature over childhood to resemble functional, tissue adapted TRM cells by the end of the first decade of life. We further establish that TRM cells generated in the early years of life comprise a distinct and transcriptional state expressing stem-like transcription factors, suggesting a role in establishing a memory cell niche for maturation of functionally protective TRM cells that predominate later in childhood. Finally, we reveal that seeding of clonally related memory T cells across distinct tissue environments occurs progressively over the course of childhood. These results establish the timing, localization, and developmental pathways promoting regional specialization of immune memory.
It is well-established in mouse models that tissue-localized TRM cells are important for protective immunity at sites of pathogen exposure6,46,47. In mice, one can track and analyze the primary response to a new pathogen and the subsequent development of memory in a completely naïve host. In humans, pathogen exposure in naïve hosts occurs mainly during early life and childhood, yet little is known about memory generation during this critical life stage. Here, we present a comprehensive analysis of memory T cell development across blood, multiple lymphoid organs, and key mucosal sites (lungs and intestines) obtained from infant and pediatric donors spanning birth through 10 years of age. We reveal that memory T cells are found predominantly in mucosal sites during the early years of life and exhibit rapid and exponential accumulation in the first 1–3 years both by frequency and absolute number. This biased accumulation of memory T cells in mucosal sites correlates with continuous exposure to a plethora of new antigens through breathing, eating, and the environment, and the known protective requirement of T cells in response to respiratory and enteric pathogens21,48. In mouse models, memory phenotype T cells can also be generated by lymphopenia-induced proliferation; transfer of naïve T cells into lymphocyte-deficient mice results in conversion to a memory phenotype driven by self-antigens, microbiome, and/or cytokines49–51. In humans, the rapid accrual of mucosal memory T cells over the first 2–3 years suggests that multiple types of antigens and factors may be involved.
Here, we identify that development of human TRM cells in mucosal sites occurs in discrete stages. Mucosal memory T cells generated during the first 3 years are distinct from those detected in later childhood in their reduced ability to produce multiple proinflammatory cytokines such as IFN-γ and TNF-α, and their reduced expression of TRM markers. However, these early mucosal memory T cells still exhibit the core features of antigen-experienced cells including expression of tissue memory phenotypes (CD45RO+CCR7−CD69+), upregulation of effector cytokine genes that are known to be associated with infant responses (i.e., IL-8, IL-4, and IL-13)42, and clonal expansions that increase with age. These early mucosal memory T cells could play roles in establishing the tissue niche and tolerance to mucosal exposures. Our results show that the Th2 bias is enhanced in intestines and may play a role in tolerance to food antigens that is known to occur in humans through early life exposures52. The second stage of TRM development is manifested after 3–4 years of age and marked by a functional shift to proinflammatory cytokine production including IFN-γ, reduced Th2 responses, and an increase in expression of TRM and tissue adaptation markers. These pediatric TRM cells resemble functionally protective TRM cells in mice and mature TRM cells in human tissues6,7,37,53.
The exact mechanisms for this staged maturation of human memory T cells over infancy and childhood are not clear; however, antigenic exposures and the tissue environment are likely contributing factors. Repeat exposures to ubiquitous pathogens over childhood could promote functional differentiation of memory T cells. We previously showed that children exhibited lower frequencies of influenza-specific T cells and TRM phenotypes in the lungs and LLN compared to adults54, consistent with this phenomenon. The tissue environment itself including the microbiome that is known to undergo dynamic maturation in the first 3 years of life55, and different cytokines and factors that result from the endogenous flora and developing tissue could also influence memory T cell maturation and phenotype. This maturation likely occurs in situ in mucosal sites, given our findings that lungs and jejunum retain clonal segregation of the TCR repertoire throughout childhood. In later childhood, priming in mucosal-associated lymph nodes and migration to the associated mucosal sites begins to establish local clonal neighborhoods, along with expansion of existing mucosal clones. This regional specialization of T cell memory is therefore established in the critical window of childhood.
Tissue compartmentalization of memory T cells at the earliest life stage as suggested by our findings has multiple implications for TRM cell longevity and for site- and age-specific targeting of tissue responses. We have reported that TRM cells in adult lungs and intestines express tissue-adapted phenotypes and transcriptional profiles and contain expanded clones that are segregated in each site7,45,56,57, similar to what we find in childhood. These results suggest that TRM cells generated during childhood may establish an early niche and persist long term. Moreover, the focused generation of memory in tissues during early life and the relative paucity of memory T cells in blood further suggests that blood may not be a reliable site for quantitative assessment of T cell responses during childhood. Conversely, site-directed strategies for promoting tissue-specific memory generation and immunity to vaccines may be particularly successful during the early years of life.
In summary, our results provide compelling evidence for tissue directed maturation of adaptive immunity during the formative years of early life and childhood to establish the landscape of immune protection and health for a lifetime.
Limitations of the Study
Because this is a study in humans and in samples obtained from deceased organ donors, it is not possible to assess the antigen specificity of the diverse population of memory T cells that are generated from the many different antigens encountered during early life and childhood. The low numbers of memory T cells present in mucosal sites during the first year of life also precludes direct testing for antigen-specific T cells by conventional peptide stimulation or tetramers using current technologies. Identifying the different types of stimuli, antigenic, microbiome, self-antigen, and cytokines involved in early memory T cell formation remains an avenue for further research. The direct role of specific transcription factors in the developmental shift from early life to mature TRM cells in humans also requires additional studies.
STAR Methods
RESOURCE AVAILABILITY
Lead contact
Further information and requests for reagents should be directed to and will be fulfilled by the lead contact Donna L. Farber (df2396@cumc.columbia.edu)
Materials availability
This study did not generate new unique reagents.
Data and code availability
Population RNAseq data has been uploaded to GEO and are publicly available as of the date of publication. Accession number is listed in key resources table.
KEY RESOURCES TABLE
| Reagent or Resource | Source | Identifier |
|---|---|---|
| Antibodies | ||
| Flow Cytometry | ||
| Anti-Human CCR4 BV605 | Biolegend | L291H4, Cat. #359418 |
| Anti-Human CCR6 BV480 | BD Biosciences | 11A9, Cat. #11A9 |
| Anti-Human CD101 APC | Biolegend | BB27; Cat. # 331007 |
| Anti-Human CD101 BV786 | BD Biosciences | V7.1; Cat. # 747545 |
| Anti-Human CD103 BB515 | BD Biosciences | Ber-ACT8; Cat 564578 |
| Anti-Human CD103 BUV395 | BD Biosciences | Ber-ACT8; Cat. # 564346 |
| Anti-Human CD103 PE/Cy7 | Biolegend | Ber-ACT8; Cat. # 350212 |
| Anti-Human CD103 PerCP/Cy.5.5 | Biolegend | Ber-ACT8; Cat. # 350226 |
| Anti-Human CD127 AF647 | Biolegend | A019D5; Cat. # 351318 |
| Anti-Human CD127 APC-R700 | BD Biosciences | HIL-7R-M21; Cat. #565185 |
| Anti-Human CD127 BV510 | Biolegend | A019D5; Cat. # 351332 |
| Anti-Human CD197 (CCR7) AF488 | Biolegend | G043H7; Cat. # 353206 |
| Anti-Human CD197 (CCR7) BV650 | Biolegend | G043H7; Cat. # 353234 |
| Anti-Human CD25 APC | Biolegend | BC96; Cat. # 302610 |
| Anti-Human CD25 BV605 | Biolegend | BC96; Cat. # 302632 |
| Anti-Human CD25 PE | Biolegend | BC96; Cat. # 302606 |
| Anti-Human CD279 (PD-1) BB700 | BD Biosciences | EH12.1; Cat. # 566460 |
| Anti-Human CD3 BV510 | Biolegend | OKT3; Cat. # 317332 |
| Anti-Human CD3 BV605 | Biolegend | OKT3; Cat. # 317322 |
| Anti-Human CD3 BV650 | Biolegend | OKT3; Cat. # 317324 |
| Anti-Human CD4 BU737 | BD Biosciences | SK3; Cat. # 612748 |
| Anti-Human CD4 BV421 | Biolegend | SK3; Cat. # 344632 |
| Anti-Human CD4 PE/Cy7 | Biolegend | SK3; Cat. # 980808 |
| Anti-Human CD4 cFluor YG584 | Cytek | SK3; Cat. #R7-20041 |
| Anti-Human CD45 Alexa Fluor® 700 | Biolegend | 2D1; Cat. # 368514 |
| Anti-Human CD45 PerCP | Biolegend | HI30; Cat. #304026 |
| Anti-Human CD45RA BV570 | Biolegend | HI100; Cat. 304132 |
| Anti-Human CD45RA BV605 | Biolegend | HI100; Cat. # 304134 |
| Anti-Human CD45RA PE/Cy7 | Biolegend | HI100; Cat. # 304126 |
| Anti-Human CD45RA PerCP/Cy.5.5 | Biolegend | HI100; Cat. # 304122 |
| Anti-Human CD45RO PerCP/Cy.5.5 | Biolegend | UCHL1; Cat. # 304222 |
| Anti-Human CD45RO PerCP-eFluor710 | eBioscience | UCHL1; Cat. # 46-0457-42 |
| Anti-Human CD49a BUV615 | BD Biosciences | SR84; Cat. # 751437 |
| Anti-Human CD49a PE | Biolegend | TS2/7; Cat. # 328304 |
| Anti-Human CD69 BV711 | Biolegend | FN50; Cat. # 310944 |
| Anti-Human CD69 PE/Dazzle 594 | Biolegend | FN50; Cat. # 310942 |
| Anti-Human CD69 PerCP/Cy.5.5 | Biolegend | FN50; Cat. # 310926 |
| Anti-Human CD8 APC/Fire 750 | Biolegend | SK1; Cat. # 344746 |
| Anti-Human CD8 BUV496 | BD Biosciences | RPA-T8; Cat. # 612942 |
| Anti-Human CD8 BV711 | Biolegend | SK1; Cat. # 344734 |
| Anti-Human CD8 BV805 | BD Biosciences | SK1; Cat. # 612889 |
| Anti-Human CXCR3 BB700 | BD Biosciences | 1C6/CXCR3, Cat. # 566532 |
| Anti-Human CXCR6 BV750 | BD Biosciences | 13B 1E5; Cat. # 747052 |
| Anti-Human CXCR6 PE/Dazzle 594 | Biolegend | K041E5; Cat. # 356016 |
| Anti-Human FoxP3 PE | Invitrogen | 236A/E7; Cat. # 72-5774-40 |
| Anti-Human FoxP3 PE/Dazzle 594 | Biolegend | 206D; Cat. # 320126 |
| Anti-Human IFNγ BV480 | BD Biosciences | B27, Cat. #566100 |
| Anti-Human TCR γ/δ PerCP-eFlour710 | Invitrogen | B1.1; Cat. #46-9959-42 |
| Anti-Human TCR γ/δ BV421 | Biolegend | B1; Cat. # 331217 |
| Anti-Human TNFα BV785 | Biolegend | Mab11; Cat. #502948 |
| Biological Samples | ||
| Human Pediatric deceased Organ Donor samples | Organ procurement organizations throughout the USA | https://bruskolab.diabetes.ufl.edu/research/handel-i/ |
| Human adult deceased organ donor samples | LiveOnNY | https://www.liveonny.org/ |
| Human Subjects Blood Samples | NYP Audubon Clinic | CUIMC IRB #AAAQ6732 |
| Immunofluorescence Imaging | ||
| Anti-Hu TCR V beta F1 APC | Invitrogen | 8A3; Cat. # 17-5766-42 |
| Anti-Hu TCR γδ PE | Life Technologies | MHGD04; Cat. # 2188772 |
| Anti-Hu CD3 Alexa Flour488 | Biolegend | OKT3; Cat. # 317310 |
| Chemicals, peptides and recombinant proteins | ||
| 10% Zinc Formalin | Anatech | Cat # 170 |
| ACK Lysing buffer | Gibco | Ref#A10492-01 |
| β-mercaptoethanol | Sigma | Cat#M6350-250ML |
| Collagenase | Millipore Sigma | Cat#11088882001 |
| DAPI | Chemometec | Cat. # 910-3013 |
| DNAse | Millipore Sigma | Cat#DN25-5G |
| DPBS | Corning | Cat #20-030-CV |
| EDTA | Corning | Cat #46-034-CI |
| Fetal Bovine Serum | GeminiBio | Cat#100-106 |
| Fixable Viability Dye eFIuor™ 780 | Thermo Fisher Scientific | Cat. # 65-0865-18 |
| Fixable Viability Dye Zombie NIR | Biolegend | Cat. # 423106 |
| Fixation Buffer | Invitrogen | Cat#00-5223-56 |
| GolgiPlug | BD Biosciences | Cat#555029 |
| GolgiStop | BD Biosciences | Cat#554724 |
| IMDM | Gibco | Ref#122440-053 |
| Ionomycin | Sigma | Cat#I9657 |
| Lymphocyte Separation Media | Corning | Cat#25-072-CI |
| O.C.T. Compound | Fisher Healthcare | Cat#23-730-571 |
| Penicillin/Streptomycin/L-glutamine | GeminiBio | Cat#c400-110 |
| Permeabilization Buffer | Invitrogen | Cat#00-8333-56 |
| PMA | Sigma | Cat#P1585 |
| RLT Buffer | Qiagen | Cat#1053393 |
| Rneasy Micro Kit | Qiagen | Cat#74004 |
| RPMI 1640 | Corning | Cat #10-040-CM |
| TrueStain FcX | BioLegend | Cat #422302 |
| True-Stain Monocyte Blocker | BioLegend | Cat #426102 |
| Critical Commercial Assays | ||
| RNA 6000 Pico Kit | Agilent | Cat#5067-1513 |
| SMART-Seq Ultra-low input RNA kit | Takara Bio | Cat#634894 |
| Deposited Data | ||
| Population RNA-seq Data | This article | GSE220094 |
| Software and Algorithms | ||
| Imaris Software v9.8.2 | Oxford Instruments | https://imaris.oxinst.com |
| FlowJo v 10.7 software | Tree Start | https://www.flowjo.com |
| FCS express v 7.12.0005 software | Denovo Software | https://denovosoftware.com |
| GSEA v4.3.1 | UC San Diego/ Broad Institute | https://www.gsea-msigdb.org/gsea/index.isp |
| Prism v 9.4.0 software | GraphPad | www.graphpad.com |
| Rstudio version | Rstudio, Inc. (2019) | https://www.rstudio.com |
| R version | R Foundation for Statistical Computing | https://www.R-project.com |
No original code was created for the purposes of this study.
Any additional information required to reanalyze the data reported in this paper is available from the lead contact upon request.
EXPERIMENTAL MODEL AND STUDY PARTICIPANT DETAILS
Human samples
Organ Donors:
Tissues from deceased organ donors were obtained at time of organ acquisition for clinical transplantation from donors whose consent for use of tissues for research was obtained by next-of kin through collaborations and research protocols with organ procurement organizations (OPO). Tissues from pediatric organ donors were obtained through the Human Atlas for Neonatal DEveLopment (HANDEL) program based on the network for Pancreatic Organ Donors with Diabetes (nPOD) program58 involving Material transfer agreements with OPOs throughout the USA. Tissues from adult organ donors were obtained through an approved and longstanding protocol and material transfer agreement with LiveOnNY, the OPO for the New York metropolitan area, as previously described7,24,59,60. Donors used in this study (see Table S1) were free of cancer, seronegative for hepatitis B, C, and HIV, and had no evidence of active infection based on respiratory, blood, and urine surveillance testing. The use of tissues from organ donors does not qualify as human subjects research as confirmed by the Columbia University IRB, as tissues are obtained from deceased, not living, individuals.
Outpatient Subjects:
Informed consent was obtained from parents under a protocol approved by the Institutional Review Board of Columbia University Medical Center (New York, NY) to collect blood for research from children aged 0–10yrs having routine phlebotomy for clinical purposes. Subjects were seen across medical campus for routine pediatric care or elective surgical procedures.
METHOD DETAILS
Sample Processing
Organ donor samples (whole lungs, intestinal blocks, spleen, blood) in saline or University of Wisconsin solution were placed on ice, transported to the laboratory, and processed within 24–36 hours of procurement. Single cell suspensions were obtained from spleen, lungs, small and large intestines, and associated lymph nodes (LN) using mechanical and enzymatic digestion as previously described24,59,61. Lymph nodes were isolated by dissection from the mesentery of intestinal blocks and the tracheobronchial tree of the lung. Isolated LN and spleen samples were placed in complete media (IMDM (Gibco, ref #12440-053) +1% PSQ (100 U/ml penicillin, 100 μg/ml streptomycin, 2 mM L-glutamine, GeminiBio, cat #c400-110) + 10% FBS (GeminiBio, cat #100-106)) and mechanically disrupted with scissors and double filtered through 100μm strainers. Suspensions were washed with wash buffer (PBS (Corning, cat #20-030-CV) + 2mM EDTA (Corning, cat #46-034-CI) + 5% FBS) followed by red blood cell lysis (ACK lysing buffer, Gibco, ref A10492-01), then resuspended in complete media. Lung parenchyma were separated from the large airways (trachea) using scissors then placed into digestion media (IMDM + Collagenase D 1mg/mL (Millipore Sigma cat# 11088882001) and + DNAse 0.1mg/mL (Millipore Sigma cat# DN25-5G) on a shaker at 37°Cfor 30 minutes. Intestinal tissue was washed with sterile PBS to remove luminal contents, chopped into pieces using scissors, then placed into digestion media on a shaker at 37°C for 30 minutes. Following incubation, lung and intestinal samples were strained and washed with wash buffer. Samples were centrifuged with resultant cell pellet diluted for mononuclear cells isolation by density gradient centrifugation (Lymphocyte Separation Medium, Corning, cat #25-072-CI) followed by resuspension in complete media. Peripheral blood mononuclear cells were isolated from blood samples by density centrifugation.
Immunofluorescence Imaging
Lung and intestinal tissue were cut into 0.5cm thickness samples and fixed with 4% paraformaldehyde, lysine and periodate buffer (PLP, 0.05 M phosphate buffer, 0.1 M L-lysine, pH 7.4, 2mg/mL NaI04, and 10mg/mL paraformaldehyde). Samples were then placed on a shaker and maintained at 4°C overnight. Samples were then washed with PLP buffer and placed into 30% sucrose solution for 48 hours at 4°C followed by embedding in OCT (Fisher Healthcare, cat#23-730-571) compound. Samples were then frozen and stored at −80°C. Frozen samples used for imaging were sectioned using a Leica CM1950 cryostat to 20μm thickness. Prior to antibody staining, Fc blocking was performed using human TruStain FcX (Biolegend, cat #422302) diluted in PBS (Corning, cat #20-030-CV) containing 2% goat serum and 5% FBS for 1 hour at room temperature (RT). Sections were then stained with DAPI and fluorescent tagged antibodies for 1 hour at RT protected from light. Images were acquired using a Nikon A1 confocal microscope. Imaged data were analyzed using Imaris software (Bitplane; Oxford Instruments) using surface creation and spot detection functions. Two sections per donor were imaged for intestinal sites with area and positive cells calculated per 1cm of tissue. Three sections per donor were imaged for lung tissue with area and positive cells calculated around 4–5 central airways per donor.
Flow cytometry and Cell Sorting
Single cell suspensions were stained with fluorescently labeled antibodies for flow cytometry analysis and sorting. For analytical flow cytometry, cells were washed with FACS buffer (PBS with 2% heat inactivated FBS) then resuspended in human TruStain FcX for 10 min at RT. For surface staining, fluorochrome-conjugated antibodies (STAR methods) in FACS buffer were added to cell suspensions for 20 minutes at RT protected from light, followed by washing with FACS-buffer, centrifugation, and resuspension in fixation buffer (Invitrogen, cat #00-5223-56 and #00-5123-43) for 20 minutes on ice. Following fixation, cells were washed with FACS buffer, and stained with antibodies for intracellular detection (STAR methods) in permeabilization buffer (Invitrogen, cat #00-8333-56) for 20 minutes on ice, followed by washing and resuspension in FACS buffer. Stained cells were analyzed using the BD LSRII or Cytek Aurora flow cytometer. For cell sorting, cells were washed with EasySep Buffer (PBS with 2% heat inactivated FBS and 1mM EDTA) then resuspended in TruStain FcX for 10 min at RT. Surface stain was added to cell suspension using fluorochrome-conjugated antibodies in FACS buffer for 20 minutes at RT protected from light, then washed in FACS buffer followed by centrifugation and resuspension in FACS buffer. Cell populations were sorted into FBS on an BD Influx Cell Sorter.
Ex vivo T cell stimulations
Single cell mononuclear suspensions isolated from blood and tissue samples prepared as above were plated in 96 well U-bottom plates (5X10⁶ cells per well) in 500μL of complete media (as described above) containing PMA (Sigma, Cat#P1585) (50ng/mL) plus ionomycin (Sigma, Cat#I9657) (1μg/mL). Stimulated cells were incubated at 37°C for 4 hours in the presence of GolgiStop (BD Biosciences, cat#554724) and GolgiPlug (BD Bioscience cat#555029). Cells were washed, stained with fixable viability marker (Zombie NIR, Biolegend, cat#423106) prior to surface and intracellular staining.
Whole transcriptome profiling by RNAseq
Tissue resident memory phenotype (CD45RA−CCR7−CD69+) CD4+ and CD8+ T cells were sorted from lungs, jejunum, ileum, colon, and associated lymph nodes from organ donors aged 0.33–8 years of age (Table S2). Following sorting, samples (>10,000 cells) were centrifuged and resuspended in RLT Buffer Plus (Qiagen, cat #1053393) with β-mercaptoethanol (Sigma, cat #M6250-250ML) and stored at −80°C until RNA extraction. RNA extraction was done using the RNeasy Micro Kit (Qiagen, cat#74004) and the resultant RNA was resuspended in water and run on an Agilent Bioanalyzer using the RNA 6000 Pico Kit (Agilent, cat #5067-1513) to assess RNA integrity. Library preparation was done using the SMART-Seq® ultra-low input RNA kit (Takara bio). RNA samples were sequenced (2×150 paired end) at GENEWIZ (South Plainfield, NJ) using a HiSeq2500 system (Ilumina). Trimmed paired-end reads were aligned to the Homo sapiens GRCh38 reference genome available on ENSEMBL using the STAR aligner v.2.5.2b. Read quantification was done by Genewiz using featureCounts on the Subread package v.1.5.2. Differential gene expression analysis and principal component analysis was performed using DESeq262. Visualization of differentially expressed genes between age groups was done using Venn diagrams63, diffggplot2, and GraphPad Prism. Heatmaps were generated using the pheatmap64 package. Geneset enrichment analysis was performed using GSEA software65,66(ver 4.3.1; UC San Diego and Broad Institute) using a preranked gene list based on log2 fold change of differentially expressed genes between infant organ donors (<1 year) and oldest organ donors (>4 years) by tissue site.
Extraction and analysis of TCR repertoire from T cell RNA-seq data
The MiXCR analysis pipeline67 was used to extract TCR repertoire data from the RNA-seq datasets described above. Using default parameters, sequencing reads within the fastq files were aligned against reference V,D,J, and C genes, followed by contig assembly and export of all TCR clonotypes with associated clone counts. We used the TRBV CDR3 nucleotide sequence as a proxy of T cell clonal identity and was analyzed using metrics of diversity and clonal overlap. Repertoire diversity was quantified using the R20 score, which is defined by the fraction of unique clones, in descending order of frequency, which account for 20% of the sequenced repertoire68. Repertoire overlap between tissues was quantified as the ratio of intersection to union of total clonotypes from compared tissues. The correlation between ages and diversity/clonal overlap was analyzed using the linear least-squares regression function of SciPy69.
QUANTIFICATION AND STATISTICAL ANALYSIS
Flow cytometry data were analyzed using FCS express (ver. 7.12.0005) and FlowJo (ver. 10.7.1). Descriptive analyses and statistical testing of compiled flow cytometry and imaging data were performed using Prism (GraphPad ver. 9.3.1) and R. To analyze the kinetics of memory T cell prevalence within the mucosal and lymphoid sites (Figure 2), percentages were converted to frequencies and then logit-transformed to normalize scatter across the range of measurements. For each memory T cell subset at each location we then fitted two descriptive models to the time course of its frequency, using least-squares approaches (the lm() and nls() functions in R). One model assumed a linear dependence of the transformed frequency (f) on age (t), f(t) = f0 + pt. The other took a nonlinear (saturating exponential) form, (t) = f0 + (f1 − f0)(1 − e−rt), where f0 and f1 are the initial and endpoint values of the transformed memory T cell frequency, respectively, and the rate r reflects the steepness of the approach to the endpoint. We compared the fits of these non-nested models using the Akaike Information Criterion (AIC), with the simpler linear model favored for absolute differences in AIC smaller than 2. The trajectories of memory T cell frequencies in mucosal tissues were uniformly described best by the saturating exponential model (ΔAIC between 4 and 22 relative to the linear model). The linear model was favored for all subsets in all lymphoid sites, except for CD4+ T cell memory in GLN (ΔAIC = 11 in favor of nonlinear). In that instance the fitted predictions were visually very close to linear in form and we selected the linear model for clarity. Prediction curves for all models were generated using the inverse logit-transform to map fitted values back to cell frequencies. For nonlinear fits, rates of accumulation of memory are quoted at the mid-point of the growth curve on the untransformed scale. For the log-linear fits we quote the average growth rates on the untransformed scale. 95% confidence intervals on all rate estimates and best-fit prediction curves were generated by bootstrapping (N=1999). The 95% confidence intervals on the estimated growth rates of memory CD4+ and CD8+ T cells in blood spanned zero but are truncated in Figure 3C due to the logarithmic scale.
Supplementary Material
Highlights.
Memory T cells preferentially accumulate in human mucosal tissues during early life.
Tissue resident memory T cells (TRM) undergo functional maturation over childhood
TRM exhibit distinct transcriptional programs and site-specific expansion over age.
Acknowledgements
We extend our gratitude to the families whose gift of organ donation made this work possible. We acknowledge the dedication and support of Mingder Yang and Robert O’Flynn from the network for Pancreatic Organ Donors with Diabetes (nPOD), the transplant coordinators and staff of LiveOnNY, Carlos Aguilar-Breton for human subject acquisition. This work was supported by the US National Institutes of Health (NIH) (Grant nos. AI106697, AI100119, AI168634 to DLF; AI150650 to A.J.Y. and D.L.F.; AI106697 and AI128949 to P.A.S.; AI141686 to TJC), and the Helmsley Charitable trust to TMB and DLF. PASz was supported by a Canadian Institutes of Health Research Fellowship. Research reported here was performed in the Columbia Flow Cytometry Core (supported by NIH awards S10RR027050, S10OD020056), the Sulzberger Columbia Genome Center, and the Columbia Single Cell Analysis Core (supported by grant P30CA013696). Additional support was provided in part by Columbia University’s CTSA grant No. UL1TR001873 from NCATS/NIH. The content is solely the responsibility of the authors and does not necessarily represent official views of the NIH.
Inclusion and Diversity
We support inclusive, diverse, and equitable conduct of research.
Footnotes
Publisher's Disclaimer: This is a PDF file of an unedited manuscript that has been accepted for publication. As a service to our customers we are providing this early version of the manuscript. The manuscript will undergo copyediting, typesetting, and review of the resulting proof before it is published in its final form. Please note that during the production process errors may be discovered which could affect the content, and all legal disclaimers that apply to the journal pertain.
Declaration of Interests: The authors declare no competing interests.
Supplementary Excel Tables
Table S3. Related to Figure 5. RNA sequencing DE gene lists.
REFERENCES
- 1.Bach JF (2002). The effect of infections on susceptibility to autoimmune and allergic diseases. N Engl J Med 347, 911–920. 10.1056/NEJMra020100. [DOI] [PubMed] [Google Scholar]
- 2.Reynolds LA, and Finlay BB (2017). Early life factors that affect allergy development. Nat Rev Immunol 17, 518–528. 10.1038/nri.2017.39. [DOI] [PubMed] [Google Scholar]
- 3.Amanna IJ, Carlson NE, and Slifka MK (2007). Duration of humoral immunity to common viral and vaccine antigens. N Engl J Med 357, 1903–1915. 10.1056/NEJMoa066092. [DOI] [PubMed] [Google Scholar]
- 4.Szabo PA, Miron M, and Farber DL (2019). Location, location, location: Tissue resident memory T cells in mice and humans. Sci Immunol 4, eaas9673. 10.1126/sciimmunol.aas9673. [DOI] [PMC free article] [PubMed] [Google Scholar]
- 5.Masopust D, and Soerens AG (2019). Tissue-Resident T Cells and Other Resident Leukocytes. Annu Rev Immunol 37, 521–546. 10.1146/annurev-immunol-042617-053214. [DOI] [PMC free article] [PubMed] [Google Scholar]
- 6.Paik DH, and Farber DL (2021). Anti-viral protective capacity of tissue resident memory T cells. Curr Opin Virol 46, 20–26. 10.1016/j.coviro.2020.09.006. [DOI] [PMC free article] [PubMed] [Google Scholar]
- 7.Kumar BV, Ma W, Miron M, Granot T, Guyer RS, Carpenter DJ, Senda T, Sun X, Ho SH, Lerner H, et al. (2017). Human Tissue-Resident Memory T Cells Are Defined by Core Transcriptional and Functional Signatures in Lymphoid and Mucosal Sites. Cell Rep 20, 2921–2934. 10.1016/j.celrep.2017.08.078. [DOI] [PMC free article] [PubMed] [Google Scholar]
- 8.Szabo PA, Levitin HM, Miron M, Snyder ME, Senda T, Yuan J, Cheng YL, Bush EC, Dogra P, Thapa P, et al. (2019). Single-cell transcriptomics of human T cells reveals tissue and activation signatures in health and disease. Nat Commun 10, 4706. 10.1038/s41467-019-12464-3. [DOI] [PMC free article] [PubMed] [Google Scholar]
- 9.Kumar BV, Connors TJ, and Farber DL (2018). Human T Cell Development, Localization, and Function throughout Life. Immunity 48, 202–213. 10.1016/j.immuni.2018.01.007. [DOI] [PMC free article] [PubMed] [Google Scholar]
- 10.Pallett LJ, Davies J, Colbeck EJ, Robertson F, Hansi N, Easom NJW, Burton AR, Stegmann KA, Schurich A, Swadling L, et al. (2017). IL-2(high) tissue-resident T cells in the human liver: Sentinels for hepatotropic infection. J Exp Med 214, 1567–1580. 10.1084/jem.20162115. [DOI] [PMC free article] [PubMed] [Google Scholar]
- 11.Weisberg SP, Carpenter DJ, Chait M, Dogra P, Gartrell-Corrado RD, Chen AX, Campbell S, Liu W, Saraf P, Snyder ME, et al. (2019). Tissue-Resident Memory T Cells Mediate Immune Homeostasis in the Human Pancreas through the PD-1/PD-L1 Pathway. Cell Rep 29, 3916–3932 e3915. 10.1016/j.celrep.2019.11.056. [DOI] [PMC free article] [PubMed] [Google Scholar]
- 12.Senda T, Dogra P, Granot T, Furuhashi K, Snyder ME, Carpenter DJ, Szabo PA, Thapa P, Miron M, and Farber DL (2019). Microanatomical dissection of human intestinal T-cell immunity reveals site-specific changes in gut-associated lymphoid tissues over life. Mucosal Immunol 12, 378–389. 10.1038/s41385-018-0110-8. [DOI] [PMC free article] [PubMed] [Google Scholar]
- 13.Thome JJ, Yudanin N, Ohmura Y, Kubota M, Grinshpun B, Sathaliyawala T, Kato T, Lerner H, Shen Y, and Farber DL (2014). Spatial map of human T cell compartmentalization and maintenance over decades of life. Cell 159, 814–828. 10.1016/j.cell.2014.10.026. [DOI] [PMC free article] [PubMed] [Google Scholar]
- 14.Rudd BD (2020). Neonatal T Cells: A Reinterpretation. Annu Rev Immunol 38, 229–247. 10.1146/annurev-immunol-091319-083608. [DOI] [PMC free article] [PubMed] [Google Scholar]
- 15.Reynaldi A, Smith NL, Schlub TE, Venturi V, Rudd BD, and Davenport MP (2016). Modeling the dynamics of neonatal CD8(+) T-cell responses. Immunol Cell Biol 94, 838–848. 10.1038/icb.2016.47. [DOI] [PMC free article] [PubMed] [Google Scholar]
- 16.Smith NL, Wissink E, Wang J, Pinello JF, Davenport MP, Grimson A, and Rudd BD (2014). Rapid proliferation and differentiation impairs the development of memory CD8+ T cells in early life. J Immunol 193, 177–184. 10.4049/jimmunol.1400553. [DOI] [PMC free article] [PubMed] [Google Scholar]
- 17.Zens KD, Chen JK, Guyer RS, Wu FL, Cvetkovski F, Miron M, and Farber DL (2017). Reduced generation of lung tissue-resident memory T cells during infancy. J Exp Med 214, 2915–2932. 10.1084/jem.20170521. [DOI] [PMC free article] [PubMed] [Google Scholar]
- 18.Zens KD, Connors T, and Farber DL (2017). Tissue compartmentalization of T cell responses during early life. Semin Immunopathol. 10.1007/s00281-017-0648-7. [DOI] [PMC free article] [PubMed] [Google Scholar]
- 19.Thapa P, Guyer RS, Yang AY, Parks CA, Brusko TM, Brusko M, Connors TJ, and Farber DL (2021). Infant T cells are developmentally adapted for robust lung immune responses through enhanced T cell receptor signaling. Sci Immunol 6, eabj0789. 10.1126/sciimmunol.abj0789. [DOI] [PMC free article] [PubMed] [Google Scholar]
- 20.Markert ML, Boeck A, Hale LP, Kloster AL, McLaughlin TM, Batchvarova MN, Douek DC, Koup RA, Kostyu DD, Ward FE, et al. (1999). Transplantation of thymus tissue in complete DiGeorge syndrome. N Engl J Med 341, 1180–1189. [DOI] [PubMed] [Google Scholar]
- 21.Markert ML, Sarzotti M, Ozaki DA, Sempowski GD, Rhein ME, Hale LP, Le Deist F, Alexieff MJ, Li J, Hauser ER, et al. (2003). Thymus transplantation in complete DiGeorge syndrome: immunologic and safety evaluations in 12 patients. Blood 102, 1121–1130. [DOI] [PubMed] [Google Scholar]
- 22.Olin A, Henckel E, Chen Y, Lakshmikanth T, Pou C, Mikes J, Gustafsson A, Bernhardsson AK, Zhang C, Bohlin K, and Brodin P (2018). Stereotypic Immune System Development in Newborn Children. Cell 174, 1277–1292 e1214. 10.1016/j.cell.2018.06.045. [DOI] [PMC free article] [PubMed] [Google Scholar]
- 23.Lee AH, Shannon CP, Amenyogbe N, Bennike TB, Diray-Arce J, Idoko OT, Gill EE, Ben-Othman R, Pomat WS, van Haren SD, et al. (2019). Dynamic molecular changes during the first week of human life follow a robust developmental trajectory. Nat Commun 10, 1092. 10.1038/s41467-019-08794-x. [DOI] [PMC free article] [PubMed] [Google Scholar]
- 24.Thome JJ, Bickham KL, Ohmura Y, Kubota M, Matsuoka N, Gordon C, Granot T, Griesemer A, Lerner H, Kato T, and Farber DL (2016). Early-life compartmentalization of human T cell differentiation and regulatory function in mucosal and lymphoid tissues. Nat Med 22, 72–77. 10.1038/nm.4008. [DOI] [PMC free article] [PubMed] [Google Scholar]
- 25.Schreurs R, Baumdick ME, Sagebiel AF, Kaufmann M, Mokry M, Klarenbeek PL, Schaltenberg N, Steinert FL, van Rijn JM, Drewniak A, et al. (2019). Human Fetal TNF-alpha-Cytokine-Producing CD4(+) Effector Memory T Cells Promote Intestinal Development and Mediate Inflammation Early in Life. Immunity 50, 462–476 e468. 10.1016/j.immuni.2018.12.010. [DOI] [PubMed] [Google Scholar]
- 26.Schreurs R, Sagebiel AF, Steinert FL, Highton AJ, Klarenbeek PL, Drewniak A, Bakx R, The SML, Ribeiro CMS, Perez D, et al. (2021). Intestinal CD8(+) T cell responses are abundantly induced early in human development but show impaired cytotoxic effector capacities. Mucosal Immunol 14, 605–614. 10.1038/s41385-021-00382-x. [DOI] [PMC free article] [PubMed] [Google Scholar]
- 27.Clark BL, and Thomas PG (2020). A Cell for the Ages: Human gammadelta T Cells across the Lifespan. Int J Mol Sci 21. 10.3390/ijms21238903. [DOI] [PMC free article] [PubMed] [Google Scholar]
- 28.Sallusto F, Langenkamp A, Geginat J, and Lanzavecchia A (2000). Functional subsets of memory T cells identified by CCR7 expression. Curr Top Microbiol Immunol 251, 167–171. [DOI] [PubMed] [Google Scholar]
- 29.Darrah PA, Patel DT, De Luca PM, Lindsay RW, Davey DF, Flynn BJ, Hoff ST, Andersen P, Reed SG, Morris SL, et al. (2007). Multifunctional TH1 cells define a correlate of vaccine-mediated protection against Leishmania major. Nat Med 13, 843–850. [DOI] [PubMed] [Google Scholar]
- 30.Schey R, Dornhoff H, Baier JL, Purtak M, Opoka R, Koller AK, Atreya R, Rau TT, Daniel C, Amann K, et al. (2016). CD101 inhibits the expansion of colitogenic T cells. Mucosal Immunol 9, 1205–1217. 10.1038/mi.2015.139. [DOI] [PMC free article] [PubMed] [Google Scholar]
- 31.Shahin T, Kuehn HS, Shoeb MR, Gawriyski L, Giuliani S, Repiscak P, Hoeger B, Yuce Petronczki O, Bal SK, Zoghi S, et al. (2021). Germline biallelic mutation affecting the transcription factor Helios causes pleiotropic defects of immunity. Sci Immunol 6, eabe3981. 10.1126/sciimmunol.abe3981. [DOI] [PMC free article] [PubMed] [Google Scholar]
- 32.Kim EY, Lynch L, Brennan PJ, Cohen NR, and Brenner MB (2015). The transcriptional programs of iNKT cells. Semin Immunol 27, 26–32. 10.1016/j.smim.2015.02.005. [DOI] [PMC free article] [PubMed] [Google Scholar]
- 33.Hu G, and Chen J (2013). A genome-wide regulatory network identifies key transcription factors for memory CD8(+) T-cell development. Nat Commun 4, 2830. 10.1038/ncomms3830. [DOI] [PMC free article] [PubMed] [Google Scholar]
- 34.Yoshitomi H, Kobayashi S, Miyagawa-Hayashino A, Okahata A, Doi K, Nishitani K, Murata K, Ito H, Tsuruyama T, Haga H, et al. (2018). Human Sox4 facilitates the development of CXCL13-producing helper T cells in inflammatory environments. Nat Commun 9, 3762. 10.1038/s41467-018-06187-0. [DOI] [PMC free article] [PubMed] [Google Scholar]
- 35.Blom B, Heemskerk MH, Verschuren MC, van Dongen JJ, Stegmann AP, Bakker AQ, Couwenberg F, Res PC, and Spits H (1999). Disruption of alpha beta but not of gamma delta T cell development by overexpression of the helix-loop-helix protein Id3 in committed T cell progenitors. EMBO J 18, 2793–2802. 10.1093/emboj/18.10.2793. [DOI] [PMC free article] [PubMed] [Google Scholar]
- 36.Kuo CT, and Leiden JM (1999). Transcriptional regulation of T lymphocyte development and function. Annu Rev Immunol 17, 149–187. [DOI] [PubMed] [Google Scholar]
- 37.Mackay LK, Minnich M, Kragten NA, Liao Y, Nota B, Seillet C, Zaid A, Man K, Preston S, Freestone D, et al. (2016). Hobit and Blimp1 instruct a universal transcriptional program of tissue residency in lymphocytes. Science 352, 459–463. 10.1126/science.aad2035. [DOI] [PubMed] [Google Scholar]
- 38.Kunkel EJ, Campbell JJ, Haraldsen G, Pan J, Boisvert J, Roberts AI, Ebert EC, Vierra MA, Goodman SB, Genovese MC, et al. (2000). Lymphocyte CC chemokine receptor 9 and epithelial thymus-expressed chemokine (TECK) expression distinguish the small intestinal immune compartment: Epithelial expression of tissue-specific chemokines as an organizing principle in regional immunity. J Exp Med 192, 761–768. [DOI] [PMC free article] [PubMed] [Google Scholar]
- 39.Nakayamada S, Takahashi H, Kanno Y, and O’Shea JJ (2012). Helper T cell diversity and plasticity. Curr Opin Immunol 24, 297–302. 10.1016/j.coi.2012.01.014S0952-7915(12)00027-1 [pii]. [DOI] [PMC free article] [PubMed] [Google Scholar]
- 40.Adkins B, Bu Y, and Guevara P (2001). The generation of Th memory in neonates versus adults: prolonged primary Th2 effector function and impaired development of Th1 memory effector function in murine neonates. J Immunol 166, 918–925. [DOI] [PubMed] [Google Scholar]
- 41.Adkins B, and Du RQ (1998). Newborn mice develop balanced Th1/Th2 primary effector responses in vivo but are biased to Th2 secondary responses. J Immunol 160, 4217–4224. [PubMed] [Google Scholar]
- 42.Gibbons D, Fleming P, Virasami A, Michel ML, Sebire NJ, Costeloe K, Carr R, Klein N, and Hayday A (2014). Interleukin-8 (CXCL8) production is a signatory T cell effector function of human newborn infants. Nat Med 20, 1206–1210. 10.1038/nm.3670nm.3670 [pii]. [DOI] [PubMed] [Google Scholar]
- 43.Rivino L, Messi M, Jarrossay D, Lanzavecchia A, Sallusto F, and Geginat J (2004). Chemokine receptor expression identifies Pre-T helper (Th)1, Pre-Th2, and nonpolarized cells among human CD4+ central memory T cells. J Exp Med 200, 725–735. [DOI] [PMC free article] [PubMed] [Google Scholar]
- 44.Singh SP, Zhang HH, Foley JF, Hedrick MN, and Farber JM (2008). Human T cells that are able to produce IL-17 express the chemokine receptor CCR6. J Immunol 180, 214–221. 180/1/214 [pii]. [DOI] [PubMed] [Google Scholar]
- 45.Miron M, Meng W, Rosenfeld AM, Dvorkin S, Poon MML, Lam N, Kumar BV, Louzoun Y, Luning Prak ET, and Farber DL (2021). Maintenance of the human memory T cell repertoire by subset and tissue site. Genome Med 13, 100. 10.1186/s13073-021-00918-7. [DOI] [PMC free article] [PubMed] [Google Scholar]
- 46.Schenkel JM, Fraser KA, Beura LK, Pauken KE, Vezys V, and Masopust D (2014). T cell memory. Resident memory CD8 T cells trigger protective innate and adaptive immune responses. Science 346, 98–101. 10.1126/science.1254536science.1254536 [pii]. [DOI] [PMC free article] [PubMed] [Google Scholar]
- 47.Rosato PC, Beura LK, and Masopust D (2017). Tissue resident memory T cells and viral immunity. Curr Opin Virol 22, 44–50. 10.1016/j.coviro.2016.11.011. [DOI] [PMC free article] [PubMed] [Google Scholar]
- 48.Collins C, Sharpe E, Silber A, Kulke S, and Hsieh EWY (2021). Congenital Athymia: Genetic Etiologies, Clinical Manifestations, Diagnosis, and Treatment. J Clin Immunol 41, 881–895. 10.1007/s10875-021-01059-7. [DOI] [PMC free article] [PubMed] [Google Scholar]
- 49.Cho JH, Boyman O, Kim HO, Hahm B, Rubinstein MP, Ramsey C, Kim DM, Surh CD, and Sprent J (2007). An intense form of homeostatic proliferation of naive CD8+ cells driven by IL-2. J Exp Med 204, 1787–1801. [DOI] [PMC free article] [PubMed] [Google Scholar]
- 50.Kieper WC, Troy A, Burghardt JT, Ramsey C, Lee JY, Jiang HQ, Dummer W, Shen H, Cebra JJ, and Surh CD (2005). Recent immune status determines the source of antigens that drive homeostatic T cell expansion. J Immunol 174, 3158–3163. [DOI] [PubMed] [Google Scholar]
- 51.Purton JF, Tan JT, Rubinstein MP, Kim DM, Sprent J, and Surh CD (2007). Antiviral CD4+ memory T cells are IL-15 dependent. J Exp Med 204, 951–961. [DOI] [PMC free article] [PubMed] [Google Scholar]
- 52.Pitt TJ, Becker AB, Chan-Yeung M, Chan ES, Watson WTA, Chooniedass R, and Azad MB (2018). Reduced risk of peanut sensitization following exposure through breast-feeding and early peanut introduction. J Allergy Clin Immunol 141, 620–625 e621. 10.1016/j.jaci.2017.06.024. [DOI] [PubMed] [Google Scholar]
- 53.Teijaro JR, Turner D, Pham Q, Wherry EJ, Lefrancois L, and Farber DL (2011). Cutting edge: tissue-retentive lung memory CD4 T cells mediate optimal protection to respiratory virus infection. J Immunol 187, 5510–5514. jimmunol.1102243 [pii] 10.4049/jimmunol.1102243. [DOI] [PMC free article] [PubMed] [Google Scholar]
- 54.Poon MML, Byington E, Meng W, Kubota M, Matsumoto R, Grifoni A, Weiskopf D, Dogra P, Lam N, Szabo PA, et al. (2021). Heterogeneity of human anti-viral immunity shaped by virus, tissue, age, and sex. Cell Rep 37, 110071. 10.1016/j.celrep.2021.110071. [DOI] [PMC free article] [PubMed] [Google Scholar]
- 55.Torow N, Hand TW, and Hornef MW (2023). Programmed and environmental determinants driving neonatal mucosal immune development. Immunity 56, 485–499. 10.1016/j.immuni.2023.02.013. [DOI] [PMC free article] [PubMed] [Google Scholar]
- 56.Weisberg SP, Ural BB, and Farber DL (2021). Tissue-specific immunity for a changing world. Cell 184, 1517–1529. 10.1016/j.cell.2021.01.042. [DOI] [PMC free article] [PubMed] [Google Scholar]
- 57.Poon MML, Caron DP, Wang Z, Wells SB, Chen D, Meng W, Szabo PA, Lam N, Kubota M, Matsumoto R, et al. (2023). Tissue adaptation and clonal segregation of human memory T cells in barrier sites. Nat Immunol 24, 309–319. 10.1038/s41590-022-01395-9. [DOI] [PMC free article] [PubMed] [Google Scholar]
- 58.Pugliese A, Yang M, Kusmarteva I, Heiple T, Vendrame F, Wasserfall C, Rowe P, Moraski JM, Ball S, Jebson L, et al. (2014). The Juvenile Diabetes Research Foundation Network for Pancreatic Organ Donors with Diabetes (nPOD) Program: goals, operational model and emerging findings. Pediatr Diabetes 15, 1–9. 10.1111/pedi.12097. [DOI] [PMC free article] [PubMed] [Google Scholar]
- 59.Sathaliyawala T, Kubota M, Yudanin N, Turner D, Camp P, Thome JJ, Bickham KL, Lerner H, Goldstein M, Sykes M, et al. (2013). Distribution and compartmentalization of human circulating and tissue-resident memory T cell subsets. Immunity 38, 187–197. 10.1016/j.immuni.2012.09.020S1074-7613(12)00521-3 [pii]. [DOI] [PMC free article] [PubMed] [Google Scholar]
- 60.Carpenter DJ, Granot T, Matsuoka N, Senda T, Kumar BV, Thome JJC, Gordon CL, Miron M, Weiner J, Connors T, et al. (2018). Human immunology studies using organ donors: Impact of clinical variations on immune parameters in tissues and circulation. Am J Transplant 18, 74–88. 10.1111/ajt.14434. [DOI] [PMC free article] [PubMed] [Google Scholar]
- 61.Granot T, Senda T, Carpenter DJ, Matsuoka N, Weiner J, Gordon CL, Miron M, Kumar BV, Griesemer A, Ho SH, et al. (2017). Dendritic Cells Display Subset and Tissue-Specific Maturation Dynamics over Human Life. Immunity 46, 504–515. 10.1016/j.immuni.2017.02.019. [DOI] [PMC free article] [PubMed] [Google Scholar]
- 62.Love MI, Huber W, and Anders S (2014). Moderated estimation of fold change and dispersion for RNA-seq data with DESeq2. Genome Biol 15, 550. 10.1186/s13059-014-0550-8. [DOI] [PMC free article] [PubMed] [Google Scholar]
- 63.Hulsen T, de Vlieg J, and Alkema W (2008). BioVenn - a web application for the comparison and visualization of biological lists using area-proportional Venn diagrams. BMC Genomics 9, 488. 10.1186/1471-2164-9-488. [DOI] [PMC free article] [PubMed] [Google Scholar]
- 64.Kolde R (2012). Pheatmap: pretty heatmaps. R package version 1. [Google Scholar]
- 65.Mootha VK, Lindgren CM, Eriksson KF, Subramanian A, Sihag S, Lehar J, Puigserver P, Carlsson E, Ridderstrale M, Laurila E, et al. (2003). PGC-1alpha-responsive genes involved in oxidative phosphorylation are coordinately downregulated in human diabetes. Nat Genet 34, 267–273. 10.1038/ng1180. [DOI] [PubMed] [Google Scholar]
- 66.Subramanian A, Tamayo P, Mootha VK, Mukherjee S, Ebert BL, Gillette MA, Paulovich A, Pomeroy SL, Golub TR, Lander ES, and Mesirov JP (2005). Gene set enrichment analysis: a knowledge-based approach for interpreting genome-wide expression profiles. Proc Natl Acad Sci U S A 102, 15545–15550. 10.1073/pnas.0506580102. [DOI] [PMC free article] [PubMed] [Google Scholar]
- 67.Bolotin DA, Poslavsky S, Mitrophanov I, Shugay M, Mamedov IZ, Putintseva EV, and Chudakov DM (2015). MiXCR: software for comprehensive adaptive immunity profiling. Nat Methods 12, 380–381. 10.1038/nmeth.3364. [DOI] [PubMed] [Google Scholar]
- 68.DeWolf S, Grinshpun B, Savage T, Lau SP, Obradovic A, Shonts B, Yang S, Morris H, Zuber J, Winchester R, et al. (2018). Quantifying size and diversity of the human T cell alloresponse. JCI Insight 3. 10.1172/jci.insight.121256. [DOI] [PMC free article] [PubMed] [Google Scholar]
- 69.Virtanen P, Gommers R, Oliphant TE, Haberland M, Reddy T, Cournapeau D, Burovski E, Peterson P, Weckesser W, Bright J, et al. (2020). SciPy 1.0: fundamental algorithms for scientific computing in Python. Nat Methods 17, 261–272. 10.1038/s41592-019-0686-2. [DOI] [PMC free article] [PubMed] [Google Scholar]
Associated Data
This section collects any data citations, data availability statements, or supplementary materials included in this article.
Supplementary Materials
Data Availability Statement
Population RNAseq data has been uploaded to GEO and are publicly available as of the date of publication. Accession number is listed in key resources table.
KEY RESOURCES TABLE
| Reagent or Resource | Source | Identifier |
|---|---|---|
| Antibodies | ||
| Flow Cytometry | ||
| Anti-Human CCR4 BV605 | Biolegend | L291H4, Cat. #359418 |
| Anti-Human CCR6 BV480 | BD Biosciences | 11A9, Cat. #11A9 |
| Anti-Human CD101 APC | Biolegend | BB27; Cat. # 331007 |
| Anti-Human CD101 BV786 | BD Biosciences | V7.1; Cat. # 747545 |
| Anti-Human CD103 BB515 | BD Biosciences | Ber-ACT8; Cat 564578 |
| Anti-Human CD103 BUV395 | BD Biosciences | Ber-ACT8; Cat. # 564346 |
| Anti-Human CD103 PE/Cy7 | Biolegend | Ber-ACT8; Cat. # 350212 |
| Anti-Human CD103 PerCP/Cy.5.5 | Biolegend | Ber-ACT8; Cat. # 350226 |
| Anti-Human CD127 AF647 | Biolegend | A019D5; Cat. # 351318 |
| Anti-Human CD127 APC-R700 | BD Biosciences | HIL-7R-M21; Cat. #565185 |
| Anti-Human CD127 BV510 | Biolegend | A019D5; Cat. # 351332 |
| Anti-Human CD197 (CCR7) AF488 | Biolegend | G043H7; Cat. # 353206 |
| Anti-Human CD197 (CCR7) BV650 | Biolegend | G043H7; Cat. # 353234 |
| Anti-Human CD25 APC | Biolegend | BC96; Cat. # 302610 |
| Anti-Human CD25 BV605 | Biolegend | BC96; Cat. # 302632 |
| Anti-Human CD25 PE | Biolegend | BC96; Cat. # 302606 |
| Anti-Human CD279 (PD-1) BB700 | BD Biosciences | EH12.1; Cat. # 566460 |
| Anti-Human CD3 BV510 | Biolegend | OKT3; Cat. # 317332 |
| Anti-Human CD3 BV605 | Biolegend | OKT3; Cat. # 317322 |
| Anti-Human CD3 BV650 | Biolegend | OKT3; Cat. # 317324 |
| Anti-Human CD4 BU737 | BD Biosciences | SK3; Cat. # 612748 |
| Anti-Human CD4 BV421 | Biolegend | SK3; Cat. # 344632 |
| Anti-Human CD4 PE/Cy7 | Biolegend | SK3; Cat. # 980808 |
| Anti-Human CD4 cFluor YG584 | Cytek | SK3; Cat. #R7-20041 |
| Anti-Human CD45 Alexa Fluor® 700 | Biolegend | 2D1; Cat. # 368514 |
| Anti-Human CD45 PerCP | Biolegend | HI30; Cat. #304026 |
| Anti-Human CD45RA BV570 | Biolegend | HI100; Cat. 304132 |
| Anti-Human CD45RA BV605 | Biolegend | HI100; Cat. # 304134 |
| Anti-Human CD45RA PE/Cy7 | Biolegend | HI100; Cat. # 304126 |
| Anti-Human CD45RA PerCP/Cy.5.5 | Biolegend | HI100; Cat. # 304122 |
| Anti-Human CD45RO PerCP/Cy.5.5 | Biolegend | UCHL1; Cat. # 304222 |
| Anti-Human CD45RO PerCP-eFluor710 | eBioscience | UCHL1; Cat. # 46-0457-42 |
| Anti-Human CD49a BUV615 | BD Biosciences | SR84; Cat. # 751437 |
| Anti-Human CD49a PE | Biolegend | TS2/7; Cat. # 328304 |
| Anti-Human CD69 BV711 | Biolegend | FN50; Cat. # 310944 |
| Anti-Human CD69 PE/Dazzle 594 | Biolegend | FN50; Cat. # 310942 |
| Anti-Human CD69 PerCP/Cy.5.5 | Biolegend | FN50; Cat. # 310926 |
| Anti-Human CD8 APC/Fire 750 | Biolegend | SK1; Cat. # 344746 |
| Anti-Human CD8 BUV496 | BD Biosciences | RPA-T8; Cat. # 612942 |
| Anti-Human CD8 BV711 | Biolegend | SK1; Cat. # 344734 |
| Anti-Human CD8 BV805 | BD Biosciences | SK1; Cat. # 612889 |
| Anti-Human CXCR3 BB700 | BD Biosciences | 1C6/CXCR3, Cat. # 566532 |
| Anti-Human CXCR6 BV750 | BD Biosciences | 13B 1E5; Cat. # 747052 |
| Anti-Human CXCR6 PE/Dazzle 594 | Biolegend | K041E5; Cat. # 356016 |
| Anti-Human FoxP3 PE | Invitrogen | 236A/E7; Cat. # 72-5774-40 |
| Anti-Human FoxP3 PE/Dazzle 594 | Biolegend | 206D; Cat. # 320126 |
| Anti-Human IFNγ BV480 | BD Biosciences | B27, Cat. #566100 |
| Anti-Human TCR γ/δ PerCP-eFlour710 | Invitrogen | B1.1; Cat. #46-9959-42 |
| Anti-Human TCR γ/δ BV421 | Biolegend | B1; Cat. # 331217 |
| Anti-Human TNFα BV785 | Biolegend | Mab11; Cat. #502948 |
| Biological Samples | ||
| Human Pediatric deceased Organ Donor samples | Organ procurement organizations throughout the USA | https://bruskolab.diabetes.ufl.edu/research/handel-i/ |
| Human adult deceased organ donor samples | LiveOnNY | https://www.liveonny.org/ |
| Human Subjects Blood Samples | NYP Audubon Clinic | CUIMC IRB #AAAQ6732 |
| Immunofluorescence Imaging | ||
| Anti-Hu TCR V beta F1 APC | Invitrogen | 8A3; Cat. # 17-5766-42 |
| Anti-Hu TCR γδ PE | Life Technologies | MHGD04; Cat. # 2188772 |
| Anti-Hu CD3 Alexa Flour488 | Biolegend | OKT3; Cat. # 317310 |
| Chemicals, peptides and recombinant proteins | ||
| 10% Zinc Formalin | Anatech | Cat # 170 |
| ACK Lysing buffer | Gibco | Ref#A10492-01 |
| β-mercaptoethanol | Sigma | Cat#M6350-250ML |
| Collagenase | Millipore Sigma | Cat#11088882001 |
| DAPI | Chemometec | Cat. # 910-3013 |
| DNAse | Millipore Sigma | Cat#DN25-5G |
| DPBS | Corning | Cat #20-030-CV |
| EDTA | Corning | Cat #46-034-CI |
| Fetal Bovine Serum | GeminiBio | Cat#100-106 |
| Fixable Viability Dye eFIuor™ 780 | Thermo Fisher Scientific | Cat. # 65-0865-18 |
| Fixable Viability Dye Zombie NIR | Biolegend | Cat. # 423106 |
| Fixation Buffer | Invitrogen | Cat#00-5223-56 |
| GolgiPlug | BD Biosciences | Cat#555029 |
| GolgiStop | BD Biosciences | Cat#554724 |
| IMDM | Gibco | Ref#122440-053 |
| Ionomycin | Sigma | Cat#I9657 |
| Lymphocyte Separation Media | Corning | Cat#25-072-CI |
| O.C.T. Compound | Fisher Healthcare | Cat#23-730-571 |
| Penicillin/Streptomycin/L-glutamine | GeminiBio | Cat#c400-110 |
| Permeabilization Buffer | Invitrogen | Cat#00-8333-56 |
| PMA | Sigma | Cat#P1585 |
| RLT Buffer | Qiagen | Cat#1053393 |
| Rneasy Micro Kit | Qiagen | Cat#74004 |
| RPMI 1640 | Corning | Cat #10-040-CM |
| TrueStain FcX | BioLegend | Cat #422302 |
| True-Stain Monocyte Blocker | BioLegend | Cat #426102 |
| Critical Commercial Assays | ||
| RNA 6000 Pico Kit | Agilent | Cat#5067-1513 |
| SMART-Seq Ultra-low input RNA kit | Takara Bio | Cat#634894 |
| Deposited Data | ||
| Population RNA-seq Data | This article | GSE220094 |
| Software and Algorithms | ||
| Imaris Software v9.8.2 | Oxford Instruments | https://imaris.oxinst.com |
| FlowJo v 10.7 software | Tree Start | https://www.flowjo.com |
| FCS express v 7.12.0005 software | Denovo Software | https://denovosoftware.com |
| GSEA v4.3.1 | UC San Diego/ Broad Institute | https://www.gsea-msigdb.org/gsea/index.isp |
| Prism v 9.4.0 software | GraphPad | www.graphpad.com |
| Rstudio version | Rstudio, Inc. (2019) | https://www.rstudio.com |
| R version | R Foundation for Statistical Computing | https://www.R-project.com |
No original code was created for the purposes of this study.
Any additional information required to reanalyze the data reported in this paper is available from the lead contact upon request.