

Summary
Vasoactive intestinal peptide (VIP) interneurons in sensory cortex modulate sensory responses based on global exploratory behavior and arousal state, but their function during non-exploratory, goal-directed behavior is not well understood. In particular, whether VIP cells are activated by sensory cues, reward-seeking actions or directly by reinforcement is unclear. We trained mice on a Go/NoGo whisker touch detection task that included a delay period and other features designed to separate sensory-evoked, action-related and reward-related neural activity. Mice had to lick in response to a whisker stimulus to receive a variable-sized reward. Using 2-photon calcium imaging, we measured ΔF/F responses of L2/3 VIP neurons in whisker somatosensory cortex (S1) during behavior. In both expert and novice mice, VIP cells were strongly activated by whisker stimuli and goal-directed actions (licking), but not by reinforcement. VIP cells showed somatotopic whisker tuning that was spatially organized relative to anatomical columns in S1, unlike lick-related signals which were spatially widespread. In expert mice, lick-related VIP responses were suppressed, not enhanced, when a reward was delivered, and the amount of suppression increased with reward size. This reward-related suppression was not seen in novice mice, where reward delivery was not yoked to licking. These results indicate that besides arousal and global state variables, VIP cells are activated by local sensory features and goal-directed actions, but not directly by reinforcement. Instead, our results are consistent with a role for VIP cells in encoding the expectation of reward associated with motor actions.
eTOC Blurb
Vasoactive intestinal peptide (VIP) interneurons are a key modulator of sensory processing, but the behavioral signals that activate them are incompletely understood. Ramamurthy et al. show that VIP cells are driven by sensory inputs and reward-seeking actions, but not directly by reinforcement itself.
Graphical Abstract
Introduction
Vasoactive intestinal peptide-expressing (VIP) interneurons, which constitute 10–15% of cortical inhibitory neurons1,2, are an important cell type for regulating pyramidal cell activity based on behavioral state. Active exploratory behaviors like locomotion and whisking drive VIP cells in sensory cortex to disinhibit pyramidal cells, thus increasing sensory responses2–5. But what role do VIP cells play in non-exploratory, goal-directed sensorimotor behaviors? A common idea is that VIP cells are activated by primary reinforcers including both reward and punishment1,5–9. But current literature does not adequately separate these putative reinforcement signals from signals related to goal-directed actions such as licking, which co-occur with reinforcement. We developed a Go/NoGo whisker touch detection task that separates sensory-driven, action-related, and reward-related signals using a delay period and variable reward delivery. Using 2-photon calcium imaging, we measured activity of L2/3 VIP interneurons in S1 during behavior. VIP cells were engaged by multiple task events. VIP cells showed strong whisker sensory responses that were somatotopically tuned, suggesting a role in local sensory processing and not just global, state-based modulation. VIP cells were robustly activated by lick initiation in both task-expert and novice mice, but were not activated by reward. Instead, VIP cells were either suppressed following reward delivery (in task expert mice) or unaffected by reward (in novice mice). These findings support a role for VIP cells in encoding reward expectation related to goal-directed actions, but not in encoding reinforcement itself.
Results
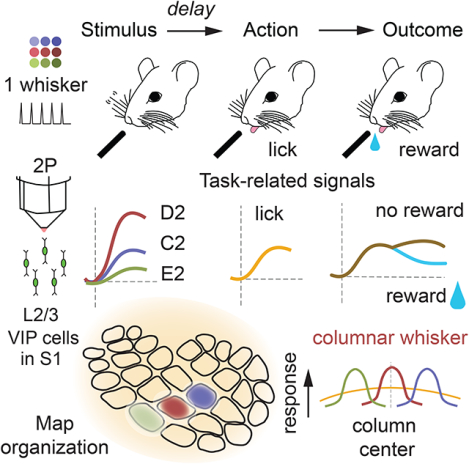
To study VIP cell activity during sensory-guided, goal-directed behavior, we trained mice on a Go/NoGo whisker detection task. Head-fixed, stationary VIP-Cre; Ai162D or Drd3-Cre; Ai162D mice (which express GCaMP6s in VIP or L2/3 PYR cells, respectively) had 9 whiskers inserted into a piezoelectric actuator array. On each trial, one randomly chosen whisker was deflected (Go trials), or no whisker was deflected (NoGo trials). Mice were trained to lick on Go trials to receive a reward, and to suppress licking on NoGo trials, which were neither rewarded nor punished (Figure 1A–B, Video S1). A 0.5–1.0 sec delay period between whisker deflection and lick response window served to dissociate sensory and lick signals, and a reward size gradient within the response window decorrelated licking from reward size (Figure 1C). Mice learned to delay most licks beyond the analysis window for sensory responses (0.7 sec) within 20.2 ± 0.69 training days (Figure 1D–E). Expert mice successfully performed whisker detection with the delay period (mean hit rate: 60.3 ± 3.69%, false alarm (FA) rate: 28.2 ± 2.44%, d-prime: 0.93 ± 0.04; Figure 1F–G), while maintaining a low fraction of early licks (8.76 ± 0.91% of trials aborted due to early licks; Figure 1H). Due to the reward size gradient, mice received a broad range of reward sizes for hits on Go trials, including near-zero reward sizes for licks at the onset of the response window (Figure 1I). Thus, this task structure separates whisker stimuli from licking actions, and decorrelates licking actions from reward size. Here we report the activity of L2/3 VIP cells and L2/3 pyramidal (PYR) cells during behavior in task-expert mice, as well as VIP cells in novice mice and in expert mice after Botox injection to induce whisker paralysis (mouse N’s shown in Figure 1J).
Figure 1. Whisker detection task with a delay period.

A. Behavioral setup for head-fixed mice. B. Trial types and behavioral outcomes. Hits were rewarded, while miss, correct rejection and false alarm trials were neither rewarded nor punished. C. Trial structure. Either a short or a long delay period separated stimulus presentation from the response window. Blue trace shows reward size, which varied based on time of first response lick. Windows for image analysis were aligned to (1) stimulus onset, (2) first lick in the response window and (3) first lick for each lick bout in the intertrial interval. D. Median time of first lick across all imaging sessions, for each mouse. Bullseye is the median across sessions. Small circles are outliers (> 1.5 x interquartile range). E. Number of sessions (after initial acclimation) to reach expert performance, for mice trained with short or long delay periods. F–H. Hit and false alarm rates (F), mean d-prime (G), and fraction of trials aborted due to early licks (H) across imaging sessions for expert mice. Gray boxes, ±SEM; open boxes, ±SD. I. Cumulative distributions of reward size (fraction of maximum reward) obtained per hit trial by each mouse. Mice obtained an average of ~45% of the maximum reward across trials and obtained the maximum reward on ~16% of trials per session. J. Experimental design showing number of mice per imaging condition. See also Video S1.
Whisker-evoked responses of VIP cells in S1
We performed two photon (2-p) imaging of L2/3 VIP interneurons in S1 during behavior in expert mice. Imaged cells were localized relative to anatomical column boundaries by post hoc histology (Figure 2A). Imaging fields were located at 110–250 μm depth (Figure S1A–D), where most cortical VIP interneurons are located10. Whisker stimuli evoked VIP cell responses (Figure 2B–C). We analyzed whisker sensory responses on Go trials during windows that were completely free of licks and rewards (<0.8 s following stimulus onset), enabled by the delay period. Individual cells showed sensory-evoked calcium transients (ΔF/F) that were whisker-specific (Figure 2B–C). On average, VIP cells were strongly driven by whisker stimuli on Go trials in these expert mice. On NoGo trials, when whisker stimuli, licks and rewards were absent, VIP cell activity showed a mean negative slope, which we removed by detrending ΔF/F traces (Figure 2D, see STAR methods). This negative slope was correlated with the systematic decline of whisker motion, body motion, and pupil size during each intertrial interval, and thus likely reflects VIP cell encoding of these behaviors (Figure S1E). The mean VIP cell response to each cell’s best whisker (BW) was stronger than for L2/3 PYR cells in the same task (Figure 2D; VIP 0.17 ± 0.01 ΔF/F; PYR 0.07 ± 0.004 ΔF/F; p < 0.001, permutation test for difference in means, subsequently referred to as ‘permutation test’). This was also true for responses to the columnar whisker (CW, VIP 0.11 ± 0.01 ΔF/F; PYR 0.06 ± 0.004 ΔF/F; p < 0.001). Sensory responses were also present in novice mice (Figure 2D) prior to learning the stimulus-action-reward association, but weaker than in experts (BW: VIP novice 0.05 ± 0.01 ΔF/F; p < 0.001, permutation test; CW: VIP novice 0.09 ± 0.01 ΔF/F; p = 0.22). Thus, VIP cells exhibit sensory responses even without training, but may strengthen with training on the whisker detection task.
Figure 2. Sensory-evoked activity of VIP interneurons.
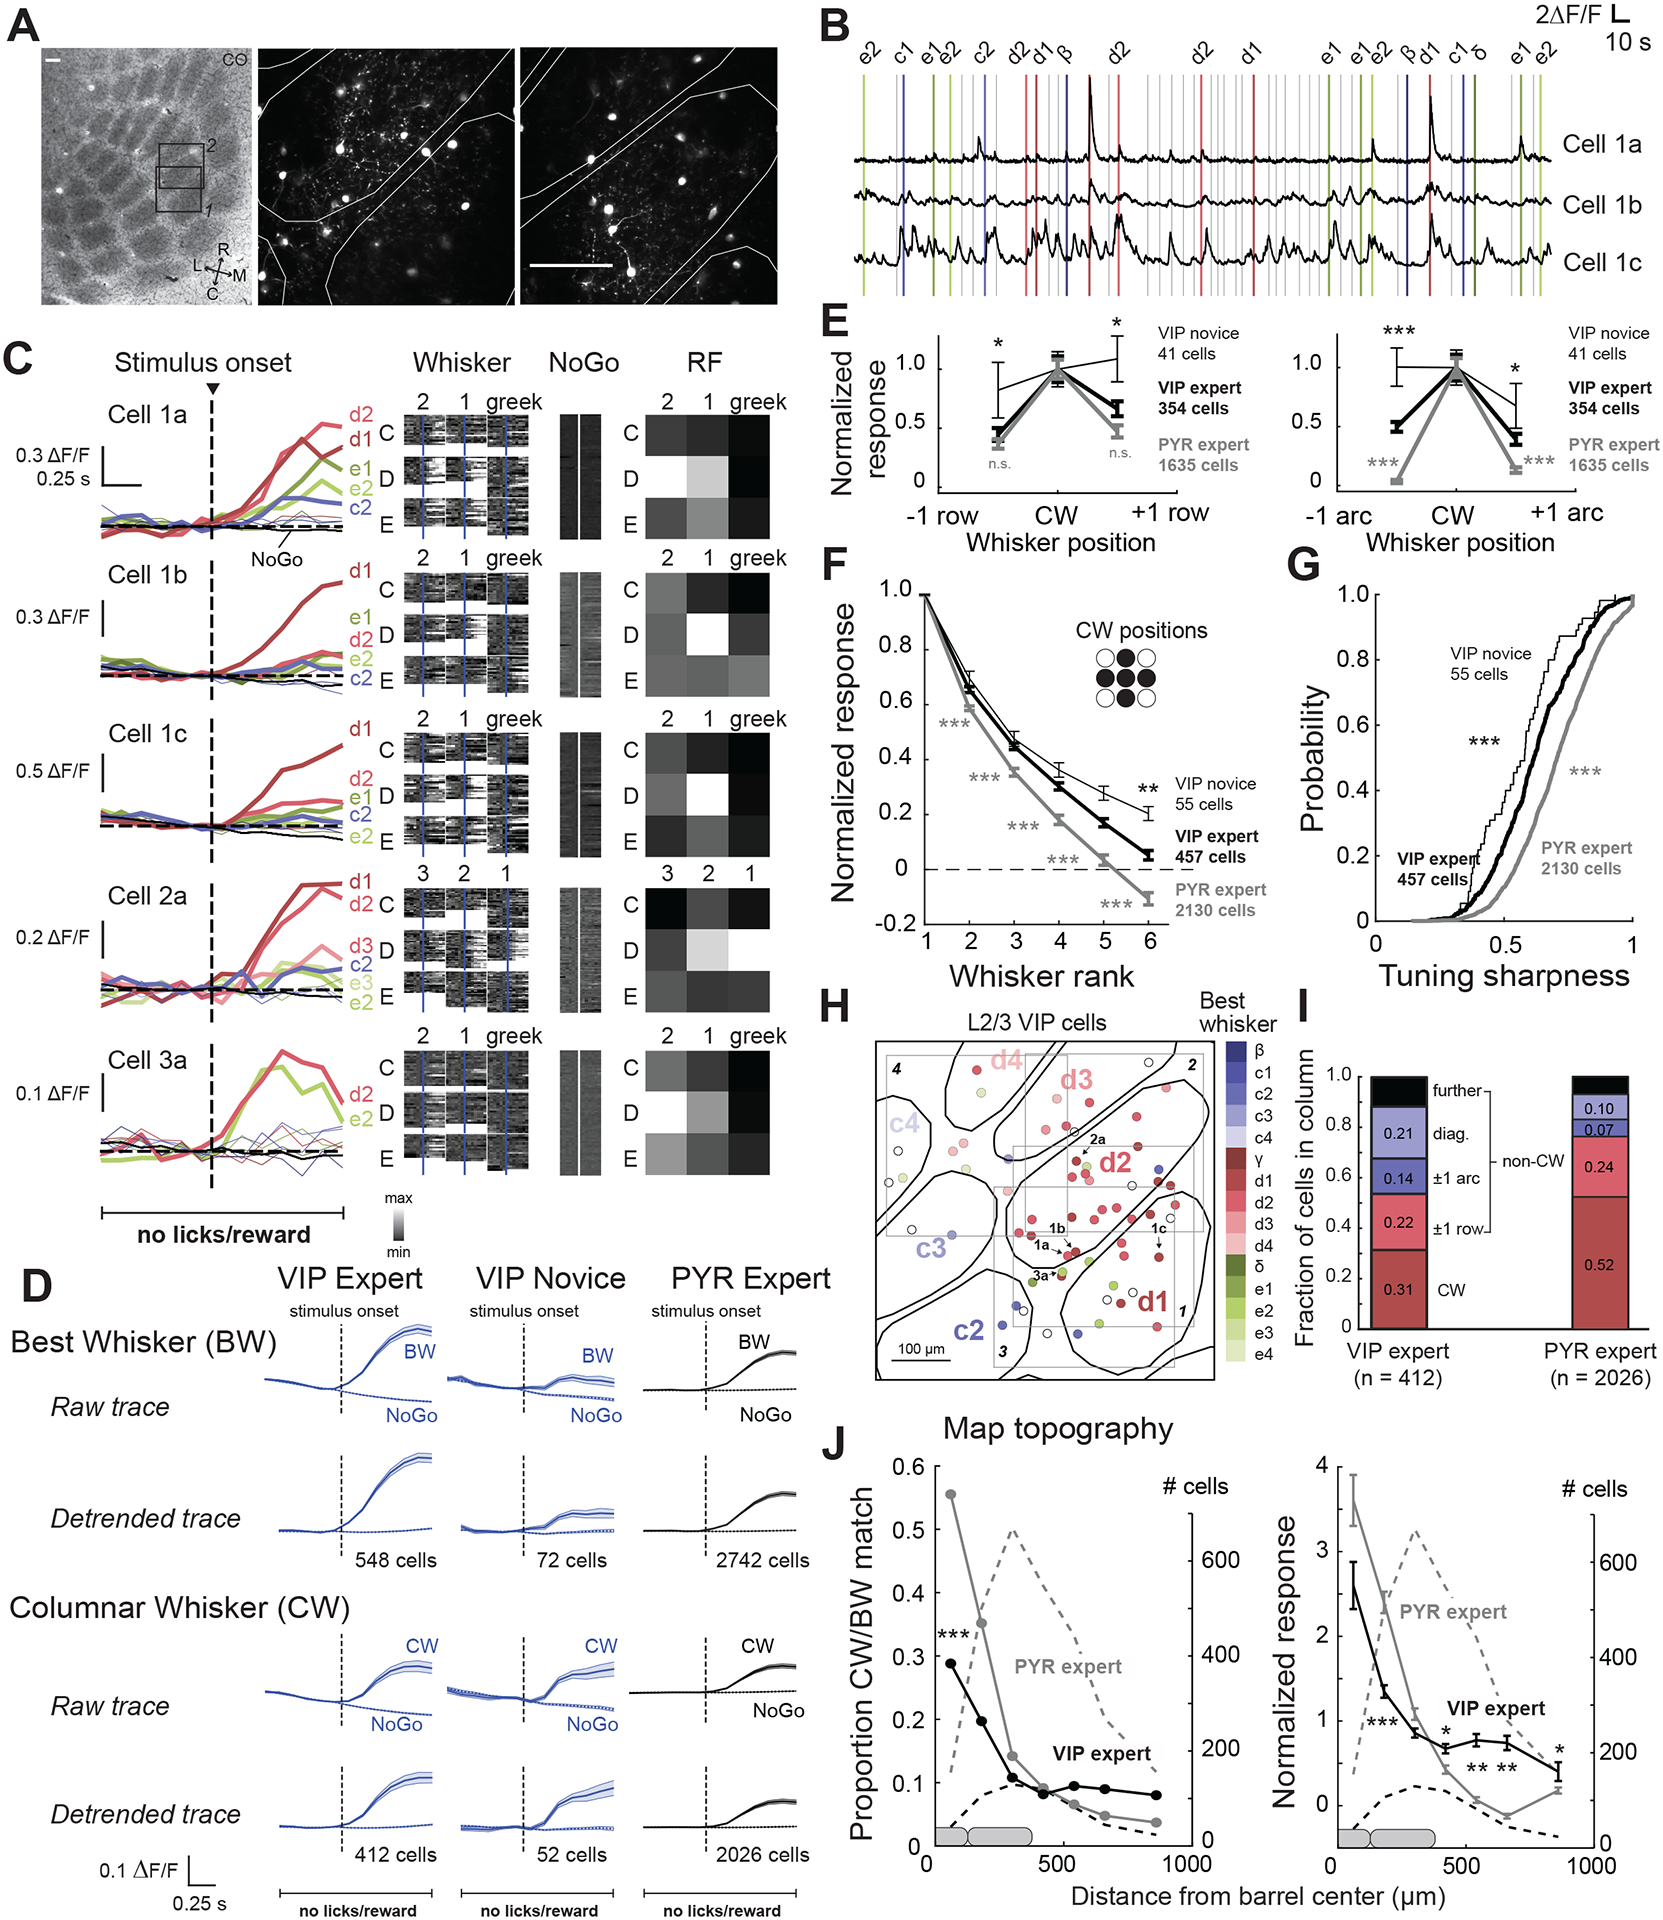
A. Two L2/3 imaging fields from a VIP-Cre; Ai162D mouse, localized relative to CO-stained barrels in L4. White contours are column boundaries. B. ΔF/F traces from 3 VIP cells from one field. Bars show time of whisker deflections on Go trials (color-coded by whisker identity) or NoGo trials (gray bars), which contained dummy piezo movement but no whisker deflection. C. Whisker receptive fields for 5 VIP cells, including those in (B). Left, median ΔF/F trace for each whisker (color) and dummy (NoGo) stimulus (gray). Middle, ΔF/F traces for each trial for each stimulus type. Right, Normalized response magnitude across whiskers. D. Mean whisker stimulus-aligned ΔF/F trace for all VIP and PYR cells with significant whisker responses. For columnar whisker responses, cells located in septa were excluded. Detrended traces were linearly detrended by prestimulus baseline (0.666 s). Error bars show mean±SEM. E. Mean responses to CW and same-row or same-arc surround whisker (SWs), for all whisker-responsive cells for which the CW and at least 5 SWs were tested. F. Mean rank-ordered receptive field for all whisker-responsive cells. Same data as (E). G. Distribution of tuning sharpness, calculated as (RBW−RW)/(RBW + RW), where RBW = mean ΔF/F to BW, and RW = mean ΔF/F for all other whiskers. Same data as (E) and (F). H. VIP cells from 4 imaging fields in one mouse. Color indicates best whisker, open circles are non-whisker responsive. Arrows, example cells from (B) & (C). I. Identity of best whiskers for cells located within a barrel column (septal cells excluded). J. Proportion of cells tuned to a reference whisker, as a function of distance from the reference whisker column. Dashed lines, cell count in each spatial bin. K. Same, but showing mean response to a reference whisker. See also Figure S1 and Table S1.
To verify that sensory responses in VIP cells were touch responses, rather than activity due to motor whisking, which can drive VIP cells in S13,11, we paralyzed the whiskers of expert mice with Botox injection into the whisker pad. VIP cells still showed significant whisker responses (0.08 ± 0.01 ΔF/F; Figure S1F). To validate that whisker responses were distinct from licking-related or putative reward-related signals, we analyzed whisker-evoked activity on trials where no lick or reward occurred for at least 3 s following stimulus onset (compared to the 0.8 sec lick- and reward-free period used above). VIP cells still showed significant whisker responses on these trials (0.13 ± 0.02 ΔF/F; Figure S1G). The magnitude of whisker-evoked responses was not significantly modulated by spontaneous whisker or body motion that occurred on each trial (Figure S1H).
VIP sensory responses showed somatotopic tuning. On average, a mean of 3.03 ± 0.09 whiskers (out of 9) drove significant responses in each VIP cell, and 1.65 ± 0.05 whiskers drove statistically equal responses that were greater than all the rest (equivalent best whiskers, eBW). Thus, VIP cells were tuned to specific whiskers. Average whisker tuning of VIP cells was slightly broader than for PYR cells in Drd3-Cre;Ai162D mice performing the task. This is shown in Figure 2E for CW-centered tuning curves in the row and arc dimensions (p = 0.05 and p<0.001, respectively, permutation test) and in Figure 2F for rank-ordered receptive fields (p < 0.001). Slightly broader tuning of VIP cells was also suggested from a tuning sharpness metric (VIP expert: 0.62 ± 0.01, PYR expert: 0.71 ± 0.003, p < 0.001, permutation test for resampled distributions; Figure 2G), but this was a marginal effect because it was not apparent in a mixed model that takes mouse N into account (see Table S1). VIP cells in novice animals were also whisker-tuned, but more broadly than in expert mices (VIP novice: 0.56 ± 0.02, p < 0.001, permutation test for tuning width based on resampled distributions; mixed model that takes mouse N into account p < 0.001, Table S1; row-wise tuning curve: p<0.01, arc-wise tuning curve: p<0.001, rank-ordered tuning curve: p < 0.001). Thus, somatotopic tuning exists without training, but appears to be further refined through training.
In mouse S1, L2/3 pyramidal cells tuned to different whiskers are intermixed in each column in a salt-and-pepper organization12–13. We examined the tuning organization of VIP cells in the whisker map (Figure 2H). 31% of whisker-responsive VIP cells in any given column were tuned the CW, 22% to a neighboring whisker in the same row, 14% in the same arc, 21% at diagonal positions and 12% further away (Figure 2I). In this analysis, we considered a cell to be tuned to a whisker if that whisker was one of the statistically equivalent eBWs, and a cell was only considered tuned to a non-CW if that whisker elicited a significantly stronger response than the CW.
The fraction of cells tuned to any given whisker and the magnitude of the response evoked by that whisker greatest at that whisker’s column center, and gradually fell off across multiple columns (Figure 2J). Thus, L2/3 VIP cells showed average correct somatotopy, but with substantial local intermixing like PYR cells12–13. Under our task conditions, PYR cells also showed salt-and-pepper somatotopic intermixing, but less so than VIP cells, with 52% of L2/3 PYR cells in each column tuned the CW (p = 0.004, Fisher’s Exact Test; Figure 2I). Thus, for both singlecell tuning width and intermixing of differently tuned cells, VIP cells showed more diffuse somatotopic organization than PYR cells. This was also true for the spread of whisker-evoked response magnitude across S1 anatomical columns (Figure 2J). Across individual mice, whisker sensory responses were consistently present (Figure S1I, see Table S1 for statistics that take mouse N into account), and a broad range of tuning widths was observed (Figure S1J). Thus, VIP cells in S1 show strong whisker sensory responses, with clear somatotopic tuning and a salt-and-pepper topographic organization.
Lick-related activity of VIP cells in S1
Next, we asked whether goal-directed actions, which in our task are licks, drive VIP cell activity. To isolate lick-related activity, we analyzed licks during intertrial intervals (ITI; Figure 3A), when sensory stimuli and rewards were absent. Individual VIP cells showed significant ΔF/F increases aligned to lick bout onset during ITIs (aligned to the first lick in each lick bout; Figure 3B). On average, VIP cells in expert mice showed strong lick-related responses (0.11 ± 0.003 ΔF/F; Figure 3C) which were comparable in magnitude to CW-evoked sensory responses (p = 0.682, permutation test) and were ~60% of the mean response to each cell’s best whisker. In novice mice licking for random reward, VIP cells also exhibited significant lick-related responses (0.13 ± 0.01 ΔF/F), which were larger in magnitude than either CW or BW responses in the same animals (p < 0.001 for each, permutation test; Figure 3C). Mean lick responses were higher in novice mice than expert mice (p < 0.001, permutation test). Thus, VIP lick responses were present before task learning. In contrast, only a small subset of PYR cells were significantly lick-responsive (Figure 3C), with mean lick responses (0.06 ± 0.004 ΔF/F) that were on average weaker than for VIP cells in expert mice (p < 0.001, permutation test).
Figure 3. Lick-related activity of VIP interneurons.
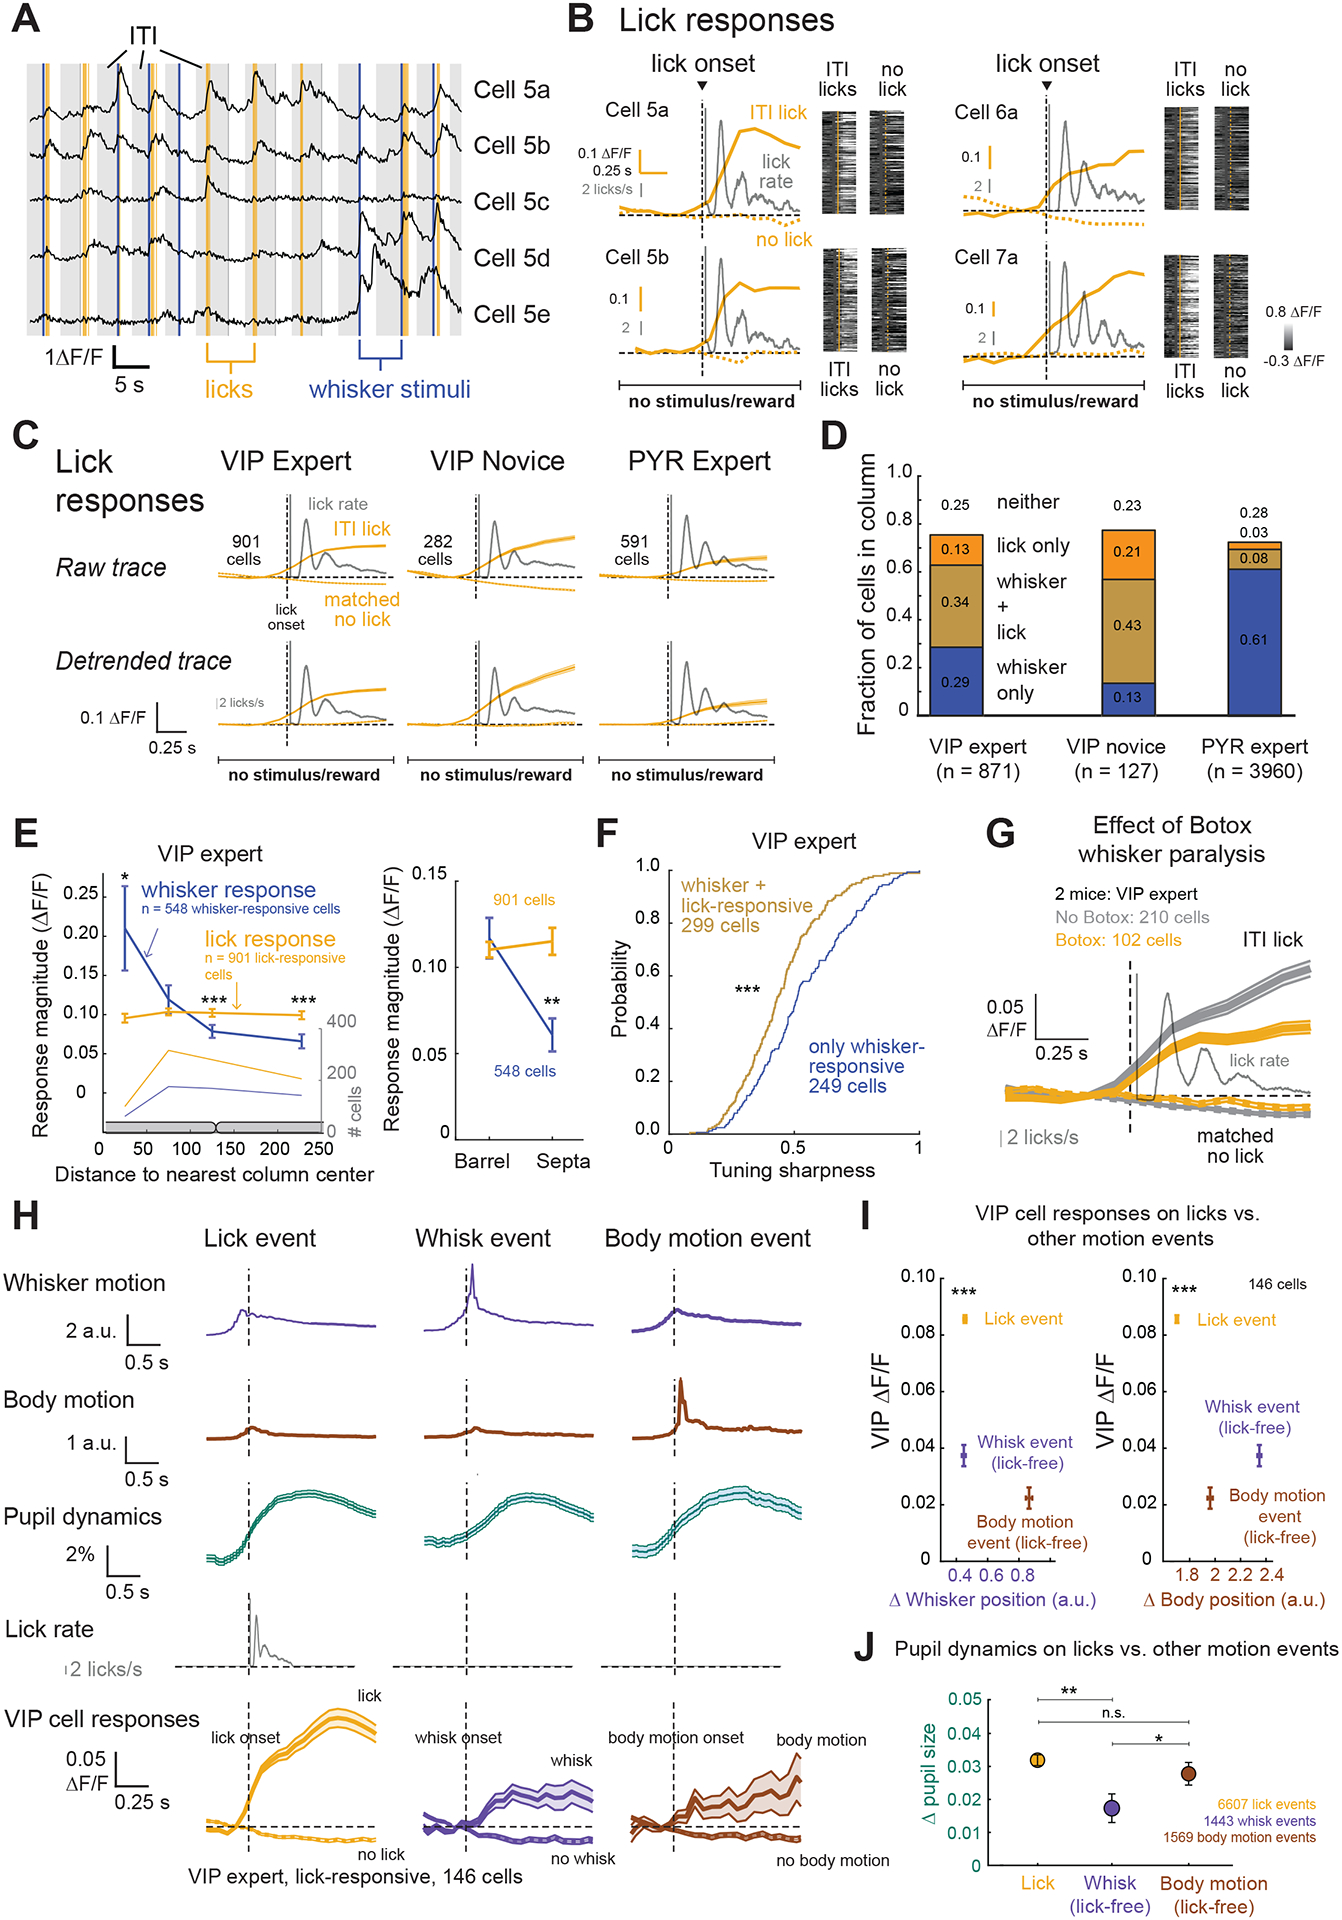
A. Example ΔF/F traces from 5 VIP cells in one imaging field, aligned to whisker deflection (blue), dummy piezo movement on NoGo trials (gray), and licks (yellow). Light gray is intertrial interval (ITI). B. Lick-related activity for 4 VIP cells. Left, median ΔF/F trace for licks and matched no-lick times, overlaid on lick time histogram (gray; 1 ms bins, smoothed by 50 ms moving average). Right, ΔF/F traces for each trial aligned to lick events (yellow) and matched no-lick times (gray). C. Mean ΔF/F trace for all cells with significant lick-related activity, aligned to lick bout onset and matched no-lick times. Detrended traces were linearly detrended from the prestimulus baseline (0.666 s). Lick time histogram (gray) plotted as in (B). Error bars show mean ± SEM for all panels. D. Proportion of L2/3 VIP cells that were whisker-responsive, lick-responsive, or neither. E. Left, mean whisker-evoked and lick-evoked response (ΔF/F) of VIP cells as a function of cell location from the nearest column center. Right, Same, averaged across all cells in barrel column vs. septa compartments. F. Tuning sharpness for solely whisker-responsive, or whisker- and lick-responsive cells. G. Mean ΔF/F trace aligned to lick onset and no-lick times for VIP cells during Botox sessions and non-Botox sessions in the same mice. Thin trace is lick time histogram. H. Mean change in whisker position, body position and pupil size, across lick events, spontaneous whisk events and spontaneous body motion events. Bottom, mean ΔF/F trace for all VIP cells with significant lick-related activity in sessions with DeepLabCut tracking, aligned to lick events, spontaneous whisk events, or spontaneous body motion events. I. Magnitude of VIP activity evoked by lick vs. whisk or body motion events, plotted relative to mean change in whisker position (left) or body position (right) within the response analysis window. J. Mean change in pupil size (0–0.799 s window) following lick events, vs. spontaneous whisking or body motion events with matched magnitude of whisker/body motion. See also Figure S2 and Table S1.
We examined the prevalence of whisker- and lick-related responses across VIP and PYR cells. In experts, both sensory and lick responses were common in VIP cells (Figure 3D) with 34% of cells being both whisker- and lick-responsive, 29% being solely whisker-responsive and 13% being solely lick-responsive. (Thus, 63% of cells showed whisker responses and 47% showed lick responses.) Novice mice showed a similar range of responsiveness, but with a larger proportion of lick-responsive cells (64%; p = 0.023, Fisher’s Exact Test) and fewer purely whisker responsive cells (13%; p = 0.009). Lick responses were much rarer among PYR cells in expert mice (11%; Figure 3D). Topographically in S1, while whisker signals were topographically organized relative to the center of barrel columns, lick signals were broadly distributed across columns and septa (p < 0.001, permutation test, Figure 3E). VIP cells that were both lick- and whisker-responsive (0.44 ± 0.01) had broader whisker tuning than cells that were purely whisker responsive (0.53 ± 0.02) despite responses being measured during lick-free periods in both cases (p < 0.001, permutation test, Figure 3F).
Licking is accompanied by orofacial movements including whisking, body movements, and pupilillary changes that reflect arousal14. We therefore asked whether lick-related activity in VIP cells could be explained purely by active whisking3,11, body motion4, or arousal (indexed by pupil size)14–15 that accompanies licking, rather than licking itself. First, we induced whisker paralysis using Botox in expert mice and found that even though active whisker movements were absent, VIP cells still exhibited significant lick responses (mean lick response, Botox: 0.06 ± 0.001 ΔF/F, non-Botox: 0.08 ± 0.001 ΔF/F) (Figure 3G). Second, in non-Botox sessions of expert mice, we used DeepLabCut16 to track whisker motion, body motion and pupil size (Figure S2A) during task performance. We calculated mean cross-correlograms between VIP ΔF/F traces and whisker motion, body motion or pupil size time series, across whole sessions (Figure S2B). This revealed a weak but positive correlation of VIP cell activity with whisker motion (0.02 ± 0.002, 2.40 s), body motion (peak correlation coefficient: 0.09 ± 0.004, time lag: 1.73 s), and pupil size (0.04 ± 0.01, 1.60 s), consistent with known exploratory motion- and arousal-related signals in VIP cells4,11,15. To test whether this modulation could underlie the apparent lick responses, we quantified whisker motion, body motion, and pupil size during licks, and compared these to spontaneous whisker motion events and body motion events during lick-free periods (Figure 3H). Whisker and body movements increased 350–550 ms prior to lick onset and gradually declined post-licking, accompanied by 3.19 ± 0.16% increase in pupil size. Increases in pupil size also accompanied spontaneous lick-free whisker motion (1.73 ± 0.27%) and body motion events (2.78 ± 0.35%). VIP responses associated with spontaneous lick-free whisking and body events were weak (whisk events: 0.04 ± 0.004 ΔF/F; body motion events: 0.02 ± 0.004 ΔF/F) relative to lick responses in the same cells (0.09 ± 0.001 ΔF/F) (Figure 3H–I; Figure S2C). Pupil dilation during lick events was significantly greater than during spontaneous whisker motion events, but not different from pupil dilation during spontaneous body motion events with amplitudes matched to those during lick events (Figure 3J). Based on this analysis, greater VIP cell activity during licks vs. spontaneous events was not related to larger increases in pupil-linked arousal during licks. Thus, lick-evoked activation of VIP cells cannot be attributed solely to whisker motion, body motion or arousal during licking. Across individual mice, lick responses in VIP cells were observed consistently (Figure S2D, see Table S1 for statistics).
Reward modulation of VIP cells in S1
A major goal of our study was to test the common idea that VIP cells in sensory cortex encode positive and negative reinforcement. Few studies have directly examined the effects of reinforcers on VIP cell activity5–7, or separated reinforcement from licking in their task design. We tested whether reinforcement drives VIP cell activity in several ways. First, we examined lick-aligned VIP cell activity for rewarded and unrewarded licks which occurred in periods without a stimulus. In expert mice, we compared Go trials with rewarded licks (Hit licks) to activity on NoGo trials with unrewarded licks (FA licks) and to ITI licks, which were also unrewarded (Figure 4A). We also compared rewarded licks to another category of unrewarded licks, which occurred on a subset of trials where expert mice performed a correct response by licking on a Go trial but did not receive reward (unrewarded Hits, see STAR Methods). If VIP cells encode positive reinforcement, there should be higher activity for rewarded Hit licks than for any of these non-rewarded lick types. We separately analyzed early lick responses (0 – 0.799 s) and late lick responses (1.0 – 2.0 s), which showed different effects.
Figure 4. Reward modulation of VIP interneuron activity.
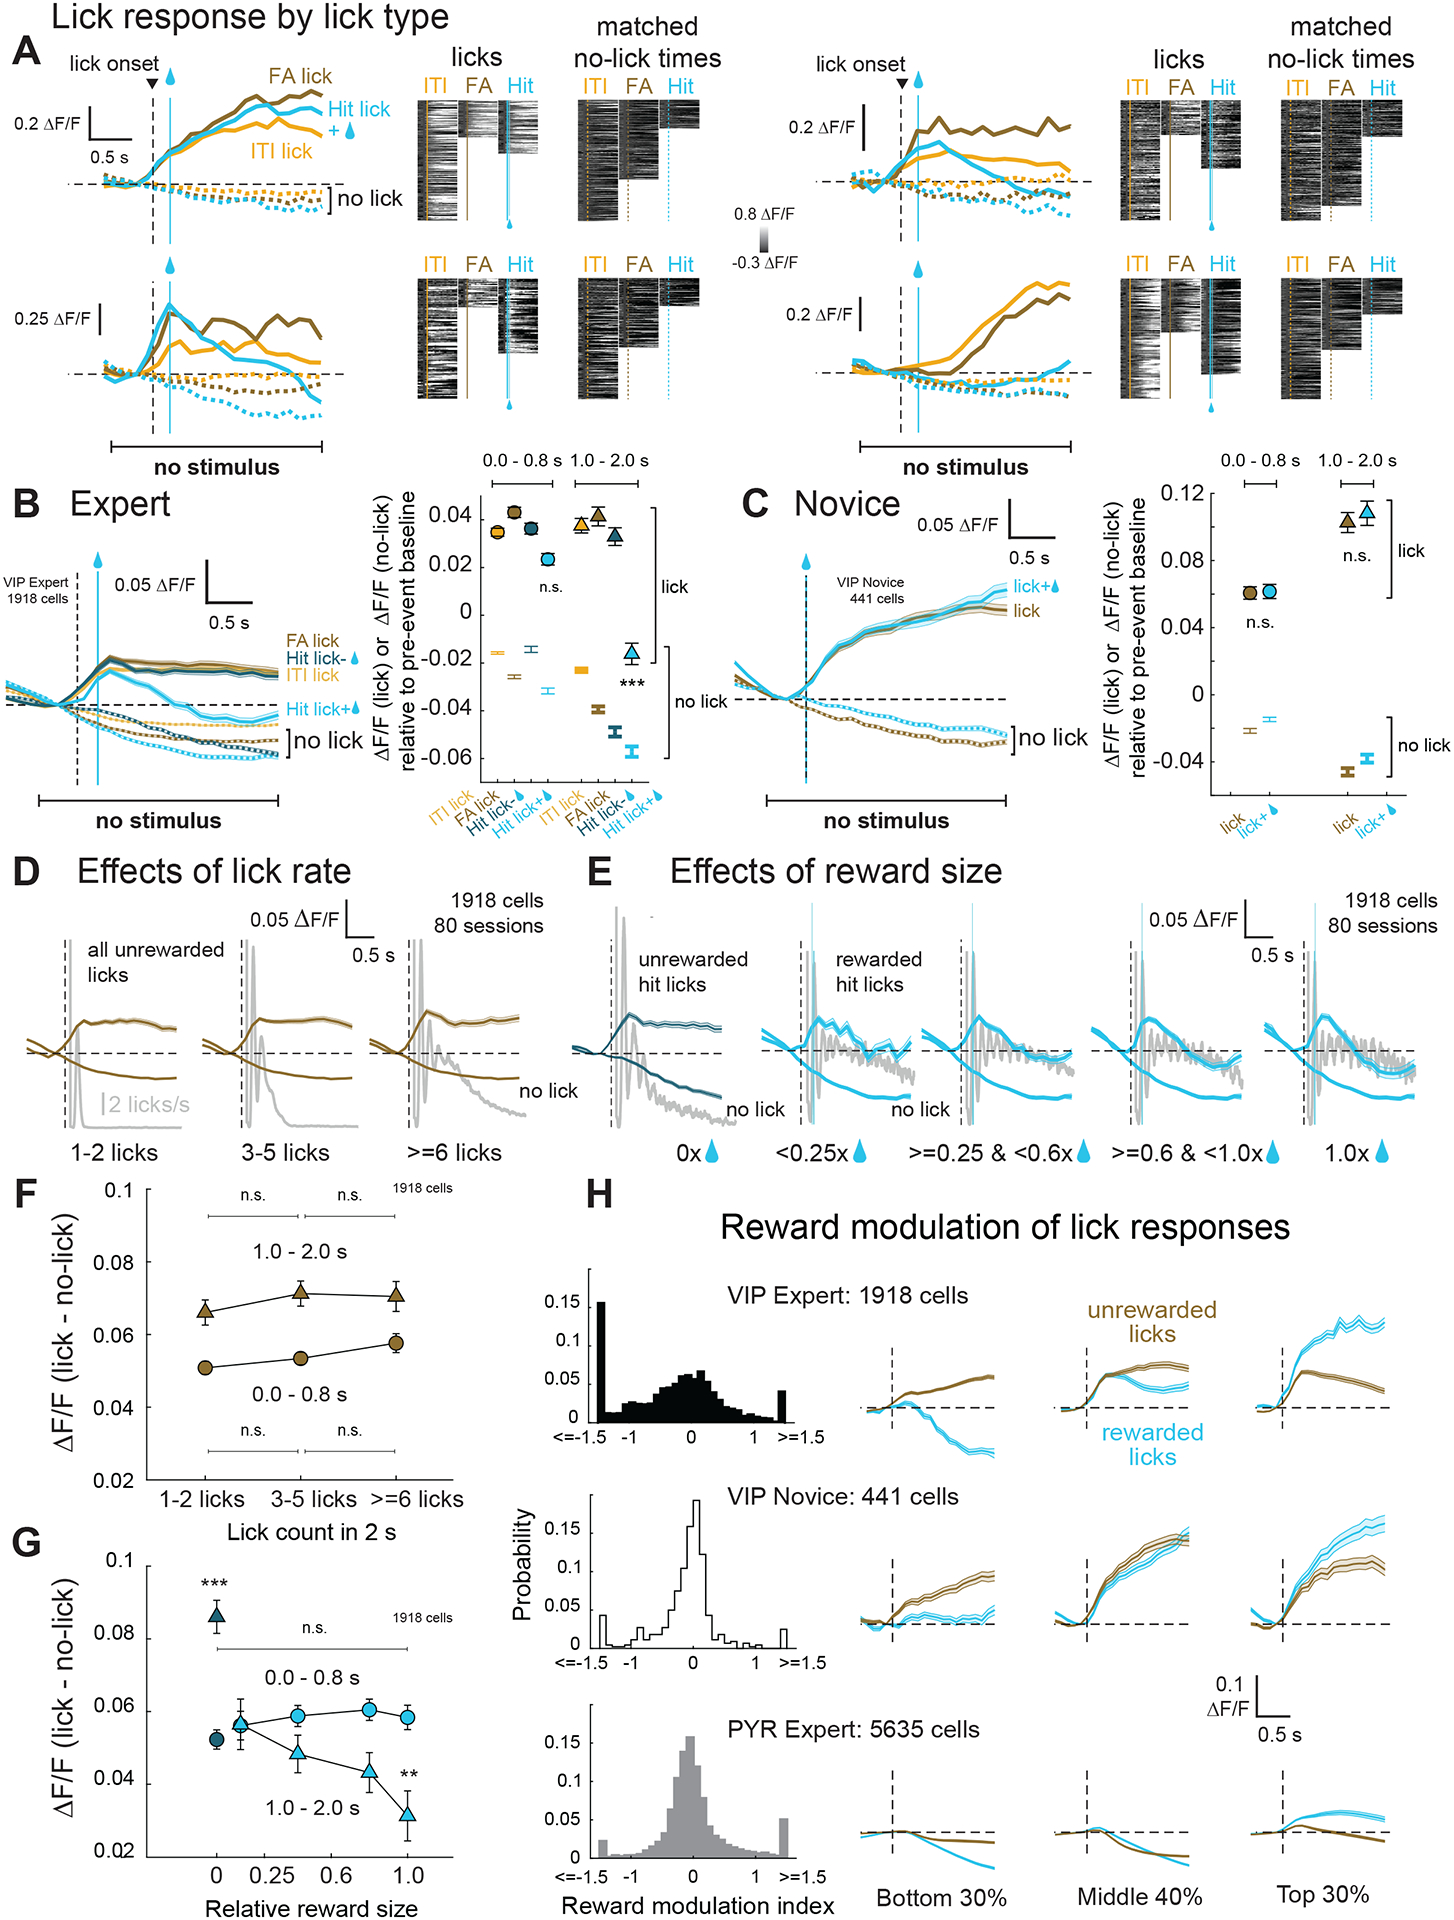
A. Lick- and reward-related activity for 4 VIP cells. Left, median ΔF/F trace for different licks and matched no-lick times. Right, ΔF/F traces for each trial aligned to lick times or matched no-lick times. Blue bar, median time of reward on Hit trials. B. Left, mean ΔF/F trace across VIP cells in expert mice aligned to lick onset for different types of licks, or matched no-lick times. Rewarded licks on Hit trials are light blue, and licks on unrewarded Hit trials are dark blue. Error bars show mean ±SEM for all panels. Right, mean ΔF/F magnitude within early and late windows following lick bout onset (<0.8 s, circles; 1 – 2 s, triangles). Matched no-lick activity for each lick type is shown as a markerless error bar in the corresponding color. C. Same as (B), but for novice mice, where spontaneous licks were rewarded randomly. D. Relationship of VIP cell activity to lick rate in expert mice. Mean ΔF/F traces are aligned to lick onset, for trials with different numbers of licks, and with no licks. Gray shows lick time histogram, plotted as in Fig. 3B. E. Relationship of VIP cell activity to reward size in expert mice. Mean ΔF/F traces are aligned to lick onset or matched no-lick times, for trials with different reward sizes (expressed as fraction of maximum reward size). 0x represents unrewarded hits. F. Quantification of effects in (D) during early (<0.8 s; circles) and late (1–2 s; triangles) windows. The y-axis is the difference between lick and no-lick ΔF/F in Panel B. G. Quantification of effects in (E). Dark blue, unrewarded hits, light blue, rewarded hits. H. Distribution of reward modulation index (RMI) for VIP and PYR cells. RMI was calculated from baseline-detrended traces as the difference in late window (1.0 – 2.0 s) lick-evoked activity between rewarded and unrewarded licks, divided by the absolute value of their sum: RMI = (ΔF/F rewarded - ΔF/F unrewarded)/|ΔF/F rewarded + ΔF/F unrewarded|. To visualize reward modulation, we plot average lick-evoked ΔF/F traces (after subtracting no-lick traces) on rewarded vs. non-rewarded trials. Left, center and right columns are cells with RMI values in the bottom 30%, middle 40% and top 30% of the population. See also Figure S3 and Table S1.
In the early period, VIP activity was not significantly different between rewarded Hit licks and unrewarded lick types (ITI licks, FA licks, unrewarded Hit licks), quantified as mean response magnitude after subtraction of matched no-lick activity (rewarded Hit licks: 0.06 ± 0.003 ΔF/F, unrewarded licks: 0.06 ± 0.001 ΔF/F ; p = 0.779, permutation test). In the late period, VIP cell activity was actually suppressed, not elevated, on rewarded Hit licks compared to all unrewarded lick types. This suppression began after the mean reward delivery time following lick onset on Hit trials (0.144 s; Figure 4B) and was maximal in the 1.0 – 2.0 s window (rewarded Hit licks: 0.04 ± 0.005 ΔF/F, unrewarded licks: 0.07 ± 0.002 ΔF/F; p <0.001, permutation test; post hoc pairwise comparisons – ITI licks p<0.01, FA licks p<0.001, unrewarded licks p<0.001). Thus, reinforcement suppresses lick-related activity in expert mice.
In contrast, novice mice did not show any significant differences in lick-aligned activity during either early or late windows (Figure 4C; rewarded licks – early: 0.08 ± 0.005 ΔF/F, late: 0.15 ± 0.01 ΔF/F, p = 0.362, permutation test; unrewarded licks – early: 0.08 ± 0.005 ΔF/F, late: 0.15 ± 0.01 ΔF/F, p = 0.834). Reward-related suppression in experts, and lack thereof in novice mice, was not explained by lick rate or spontaneous behaviors that accompany licking as these factors were higher on rewarded vs. unrewarded trials in both groups (Figure S3A). Reward-related suppression was not an artifact of swallowing – it was not present in novice mice even with full size rewards – nor an artifact associated with high motion on rewarded vs. unrewarded trials – it was present on both low- and high-motion trials (p < 0.001, permutation test), and high-motion trials showed the expected trend of increasing VIP cell activity relative to low motion trials (Figure S3B). Reward effects were retained in lick-responsive cells of Botox-injected expert mice, (p < 0.001, permutation test), similar to lick-responsive cells in non-Botox experiments (p < 0.05, permutation test, Figure S3C–D) verifying that active whisking did not drive VIP activity differences on rewarded vs. unrewarded licks. Further, reward-related suppression in expert mice did not depend on ongoing stimulus presentation: in a small number of interleaved sessions, we tested expert mice licking for random reward in the absence of any whisker stimuli, and found the same effects (p<0.01, permutation test, Figure S3E–F).
To understand reward-related suppression of VIP activity, we examined the relationship of VIP cell activity with lick rate and reward size, two factors that differed between rewarded and unrewarded licks (Figure 4D–E). For unrewarded licks, VIP cells in expert mice were not significantly modulated by lick rate during either early or late windows (p>0.05, permutation test, Figure 4F; early: 1–2 licks: 0.05 ± 0.002 ΔF/F, >=6 licks: 0.06 ± 0.003 ΔF/F; late: 1–2 licks: 0.07 ± 0.004 ΔF/F, >=6 licks: 0.07 ± 0.004 ΔF/F). Lick responses were also independent of the number of licks in the analysis window for novice mice (Figure S3G–H). For rewarded licks, VIP responses in expert mice were significantly modulated by reward size such that larger rewards led to greater suppression in the late window (permutation test; unrewarded hit: 0.09 ± 0.01 ΔF/F, <0.25x reward: 0.06 ± 0.01 ΔF/F, 1x reward: 0.03 ± 0.01 ΔF/F), but not in the early window (p>0.05, permutation test, unrewarded hit: 0.05 ± 0.003 ΔF/F, <0.25x reward: 0.06 ± 0.004 ΔF/F, 1x reward: 0.06 ± 0.003 ΔF/F, Figure 4G). Reward-related suppression was also seen in expert mice but not novice mice when considering matched reward volumes in novice and expert mice (Figure S3I). In expert mice, reward-related suppression was independent of reward time poststimulus (short delay: p = 0.745, long delay: p = 0.905, permutation test, Figure S3J). These reward-related effects on lick responses were consistent across most individual mice (Figure S3K, see Table S1 for statistics).
We computed a reward-modulation index for each cell in VIP expert, VIP novice and PYR expert populations (Figure 4H). For PYR cells, a greater proportion of cells exhibited positive modulation by reward (308/5635) than negative modulation by reward (143/5635; p<0.001, Fisher’s exact test). In contrast, in VIP expert mice, a larger fraction of VIP cells (335/1918; p<0.001, Fisher’s exact test) was significantly negatively modulated than significantly positively modulated (87/1918). In novice mice, fractions of positively modulated (11/441) vs. negatively modulated VIP cells (22/441) were not different (p = 0.207, Fisher’s exact test). Thus, VIP cells in S1 do not directly encode reward, instead they exhibit lick-related activity on both unrewarded and rewarded trials, with mean suppression by reward in expert animals.
Discussion
Sensory responses in VIP interneurons are known17–31, but there have been conflicting reports of sensory response magnitude and tuning sharpness6,20–31, measured under anesthesia6,20–23 or in animals that are not task-engaged24–28. Prior studies of VIP sensory responses during goal-directed behavior are few29,30. Our results reveal clear sensory tuning for VIP cells during goal-directed behavior, with slightly broader tuning than for PYR cells. The existence of somatotopic tuning and columnar organization for VIP cell sensory responses indicates that VIP cells participate in shaping cortical circuit activity based on local sensory input31, not just global behavioral state.
VIP cells in S1 exhibited strong lick-related activity in both novice and expert mice, that cannot be fully explained by orofacial or body movements or by arousal. VIP cell activation by licks has not been previously reported in sensory cortex and may have been misattributed to reward-related activation, although we cannot rule out the possibility that VIP cells may directly encode reward at a different learning stage than assessed in our novice or expert mice. Multiple anatomical pathways32–33 could drive lick signals in VIP cells in S1, including top-down inputs from areas that encode goal-directed aspects of licking behavior34–38, and basal forebrain cholinergic inputs that are known to be excited by licking39–42. Licking activated VIP cells more strongly than whisker or body movements, and more strongly than slow arousal-related activity locked to pupil diameter, suggesting that licks have special access to VIP circuits during goal-directed behavior.
We propose that lick responses in VIP cells reflect not motor action per se, but the expectation of reward associated with actions. This hypothesis can explain why VIP cells are active immediately before and during licks, and why reward suppresses lick-related activity in VIP cells. The onset of lick-associated activity in VIP cells just prior to lick onset could reflect this reward expectation, as well as responses to orofacial motion, body motion and arousal that begin prior to lick detection. Licking is inherently a reward-seeking action, so reward expectation is high at the onset of a lick bout, in both expert and novice mice. This corresponds with high VIP cell activity early during lick bouts in both these groups. In our measurements in novice mice, reward delivery did not depend on licking, so expectation of reward associated with licking would remain high regardless of whether reward was obtained. VIP cell activity remained high throughout licking in these mice. In contrast, expert mice presumably learned to expect an average reward size, and learned that once reward was obtained on a given trial, additional licks would not yield additional reward. Thus, in expert mice, VIP cell activity decreased after a Hit (Fig. 4B) and decreased in proportion to the reward size that was delivered (Fig. 4I). In contrast, when reward was not delivered, the expectation for reward associated with licking would remain high, and VIP cell activity remained high with additional licks (Fig. 4F–G). This reward modulation of lick-related activity in VIP cells was not dependent on ongoing stimulus presentation. Thus, VIP cells encode the relationship between action and outcome, rather than stimulus-outcome or stimulus-action relationships.
Suppression of movement-related VIP cell activity following motor learning has been previously reported in motor cortex (and other dorsal cortical areas) in a sensorimotor task with temporally overlapping behavioral events40, where results supported the role of higher VIP activity in the initial learning phase as being permissive for motor learning by disinhibition of PYR cells through VIP cells mediated by a cholinergic mechanism. The reward-related modulation of lick-related activity in VIP cells that we find in expert mice – high when unrewarded, low when rewarded – may similarly play a role in learning of new action-reward contingencies in expert mice in the absence of expected reward for performing an action.
Concluding Remarks
We found that VIP cells in sensory cortex are strongly activated by sensory stimuli (whisker deflections) and goal-directed actions (licking), and more weakly activated by movements or pupillary size changes consistent with shifts in arousal during goal-directed behavior. However, direct activation of VIP cells by reward was lacking. Instead, reward suppressed lick-related VIP cell activity in expert mice, in a manner that suggests that VIP cells encode the expectation of reward associated with action. These results, plus our finding that VIP cells show strong somatotopic tuning for specific whiskers, are consistent with a role for VIP cells in shaping sensory cortex activity based on local sensory input, not just global behavioral state, and based on the expectation of reward associated with actions. This latter function may facilitate adaptive behavior in the absence of expected outcomes for performing goal-directed actions.
STAR METHODS
RESOURCE AVAILABILITY
Lead contact
Further information and requests for resources and reagents should be directed to and will be fulfilled by the lead contact, Daniel Feldman (dfeldman@berkeley.edu)
Materials availability
This study did not generate new unique reagents.
Data and code availability
Source data for results reported in this manuscript are available on the Feldman lab GitHub repository, https://github.com/dfeldman189/Ramamurthy2023Data. The DOI is listed in the key resources table.
Original code for data analysis is available on the Feldman lab GitHub repository, https://github.com/dfeldman189/Ramamurthy2023Data. The DOI is listed in the key resources table.
Any additional information required to reanalyze the data reported in this paper is available from the lead contact upon request.
KEY RESOURCES TABLE
| REAGENT or RESOURCE | SOURCE | IDENTIFIER |
|---|---|---|
| Chemicals, Peptides, and Recombinant Proteins | ||
| Botulinum Neurotoxin Type A from Clostridium botulinum | List Labs | Cat#130B |
| Cytochrome C from equine heart | Sigma-Aldrich | Cat#C2506-500MG |
| Diaminobenzidine tetrahydrochloride hydrate | Sigma-Aldrich | cat#D5637 |
| Deposited Data | ||
| Source data | This paper |
https://github.com/dfeldman189/Ramamurthy2023Data doi: 10.5281/zenodo.7879613 |
| Experimental Models: Organisms/Strains | ||
| Vip-Cre mice (Viptm1(cre)Zjh/J) | The Jackson Laboratory, Maine | JAX Strain #010908 RRID:IMSR_JAX:010908 |
| Drd3-Cre mice (Tg(Drd3-cre)KI196Gsat/Mmucd) | Drd3-Cre mice (Tg(Drd3-cre)KI196Gsat/Mmucd)Gensat (MMRRC) | MMRRC:034610 |
| Ai16D mice (B6.Cg-lgSjtm162.1(tetO-GCaMP6s,CAGtTA2)Hze/J) | The Jackson Laboratory, Maine | JAX Strain #031562 RRID:IMSR_JAX:031562 |
| Software and Algorithms | ||
| Igor Pro | WaveMetrics, Portland, OR | https://www.wavemetrics.com/products/igorpro |
| MATLAB | R2021a, Mathworks, Natick, MA | https://www.mathworks.com/products/matlab.html |
| Imaging analysis pipeline | LeMessurier AM. 2019. Imaging_ analysis_ pipeline. GitHub 5a21c9f. | https://github.com/elifesciences-publications/imaging_analysis_pipeline |
| Analysis code | This paper |
https://github.com/dfeldman189/Ramamurthy2023Data doi: 10.5281/zenodo.7879613 |
| Arduino IDE 2.0 | 2021, Arduino, Italy | https://www.arduino.cc/en/software |
| Other | ||
| Arduino Mega 2560 R3 | Arduino | A000067 |
EXPERIMENTAL MODEL AND STUDY PARTICIPANT DETAILS
All procedures were approved by the UC Berkeley Animal Care and Use Committee and were in accordance with NIH guidelines. Data included for VIP interneurons in expert mice was obtained from 80 imaging experiments across seven VIP-Cre; Ai162D (3 male, 4 female), generated by crossing VIP-Cre mice (JAX #10908) and Ai162D mice (TIGRE2.0-GCaMP6s, JAX #031562), obtained from The Jackson Laboratory. Data for the novice stage were obtained from 4/7 mice for lick responses and 2/7 mice for whisker responses. Experiments following Botox injection were performed in 2/7 expert mice (Figure 1D; Figure S1C–D). Data from pyramidal (PYR) cells collected across 51 experiments in three Drd3-Cre; Ai162D mice (2 male, 1 female), generated by crossing Drd3-Cre mice (Gensat MMRRC: 034610) with the Ai162D line. Mice were housed in a reverse 12:12 light cycle, with littermates prior to surgery and singly housed following surgery to implant the chronic cranial window for imaging. No sex differences were found for key results reported in this study.
METHOD DETAILS
Surgery
Adult mice (2–3 months) were anesthetized with isoflurane (1.0–3.0%), with body temperature maintained at 37°C. Pre-operative dexamethasone (2 mg/kg, to reduce inflammation), meloxicam (5–10 mg/kg, for prophylactic analgesia) and enrofloxacin (10 mg/kg, to prevent infection) were administered, sterile technique was followed during the surgery. A lightweight (<3 g) head plate containing a 6 mm aperture was affixed to the skull using cyanoacrylate glue and Metabond (C&B Metabond, Parkell). Intrinsic signal optical imaging (ISOI) was used to localize either C-row (C1, C2, C3) or D-row (D1, D2, D3) barrel columns in S143, and a 3 mm craniotomy was made over either the C2 or D2 column, using a biopsy punch. The craniotomy was covered by placing a 3 mm diameter glass coverslip (#1 thickness, CS-3R, Warner Instruments) over the dura, and sealed with Metabond to form a chronic cranial window. Mice were allowed to recover on a heating pad and monitored until sternal recumbency was regained. Buprenorphine (0.05 mg/kg) was given subcutaneously for post-operative analgesia, and mice were returned to the home cage. Mice were allowed to recover for 1 week before behavioral training commenced. After recovery, ISOI was repeated through the cranial window to verify the locations of barrel columns prior to the start of imaging experiments.
Botox injections
To induce temporary whisker paralysis, we performed Botox (Botulinum Neurotoxin Type A from Clostridium botulinum, List Labs #130B) injections in the whisker pads of mice13,44–45. Botox was reconstituted to a stock solution (40 ng/μl) with 1mg/ml bovine serum albumin in distilled water. A microliter syringe (Hamilton Company) was used to inject 1 μl of a 10 pg/μl dilution made up from the stock solution into the mystacial whisker pads of mice. Whisking ceased within 24 hours, and lasted for approximately one week before whisker movements started to recover. A 50% supplemental dose of Botox was injected once per week, if necessary for additional data collection. Botox injections (initial dose and supplements) were performed the day before imaging experiments, and absence of whisking was verified before the start of each experiment.
Behavioral task
To motivate behavior, mice were water regulated. The daily water ration (typically 0.8–1.5 mL) was calibrated for each mouse to achieve a stable target body weight of 85% of pre-training body weight. Mice were trained to perform a Go/NoGo whisker detection task. During the task, the mouse was head-fixed, with the body resting on spring-mounted stage13. Nine whiskers were inserted in a 3 × 3 piezo array (consisting of nine independent, calibrated piezoelectric actuators mounted with pipet tips to hold individual whiskers) such that the tips of the piezos were positioned ~5 mm from the face. A plastic shield prevented piezos from contacting other neighboring whiskers. The array was centered on a D-row or C-row whisker, and each whisker was held in place with a small amount of rubber cement applied at the start of each session. A tenth piezo was positioned nearby, but did not contact any whisker (“dummy piezo”). A lickport with a capacitive lick sensor was placed in front of the mouse, and used to deliver water rewards (4 μl, mean reward volume). Mice were briefly anesthetized with isoflurane (0.5–2.0%) at the start of each session for head-fixation and whisker insertion, and data collection began after all observable effects of anesthesia had fully subsided. Behavior was conducted in the dark, with 850 nm infrared (IR) illumination for video monitoring. A masking noise designed to conceal sounds from the piezo actuators was played in the background throughout the task. Task control was performed using an Arduino Mega 2560 microcontroller board (Arduino), and custom routines in Igor Pro (WaveMetrics) were used for user input and task monitoring.
Training stages
Behavior was shaped gradually, through a series of training stages (lasting 1–5 days each). In Stage 1, mice were acclimated to experimental rig and handling by trainers. In Stage 2, they were acclimated to head-fixation and licking at the port to obtain water rewards. Full reward volume was provided and reward delivery was cued by a blue light, until the final stages when the training of delayed licking was performed. In Stage 3, reward (cued by a blue light) was automatically delivered if mice suppressed licking below an inter-lick interval (ILI) threshold for ~3 seconds. In Stage 4, the whisker stimulus was introduced, with reward (cued by a blue light) automatically delivered in the response window regardless of the actions of the mouse, and 50% NoGo trials were introduced. When mice began shifting licks such that they preceded reward delivery, they were advanced to the next stage. In Stage 5, the task shifted to operant mode (with no delay period). Reward was provided only if the mouse licked in the response window, which began 0 – 300 ms after whisker stimulus onset. Learning progress was evaluated by the divergence of lick probability on Go and NoGo trials. In Stage 6, training for delayed licking was introduced. Trial abort window was incrementally lengthened, in tandem with gradual shifts in the reward plateau time within the response window. A limit was placed on the number of consecutive Go or NoGo trials to facilitate learning of delayed licking. Learning progress was evaluated measuring the median time of first licks in trials, relative to stimulus onset. In Stage 7, the final version of the whisker detection task was implemented, with fully randomized Go/NoGo trials and trial abort window and reward plateau parameters at their final values and blue light signaling reward delivery turned off. Mice were considered to achieve criterion performance when performance at this stage remained stable at d’ ≥ 1 (mean running d-prime) for three consecutive sessions. Fully trained mice performed a total of 500–1000 trials per daily session.
Task Structure: Novice Mice
Data for the novice stage were obtained during Stage 3 of training described above, except that the blue light cueing reward delivery was not used during imaging. Lick responses were measured in 4 mice, and stimulus-evoked responses were measured in 2/4 mice. To prevent mice from learning the association between stimulus and licking across the 5–6 sessions necessary to sample sufficient L2/3 VIP interneurons in each individual mouse, licking during the first half of each session (stimuli turned off), and stimuli were presented half of the session (lickport removed). A fixed reward size (2–9 μl, median reward size, 5 μl) was used per session in novice mice. Other aspects of trial structure were identical to that used in experts (described below).
Task structure: Expert Mice
On each trial, one randomly selected whisker was deflected (Go trials) or no whisker was deflected (NoGo trials). The number of Go trials and NoGo trials was balanced (50% each). The whisker stimulus on each Go trial consisted of a train of 5 deflections with a 100 ms interval between them. Each individual deflection consisted of a 300 μm amplitude (6° angular deflection) rostrocaudal ramp-and-return movement with 2 ms rise/fall time and 10 ms duration. On each NoGo trial, the same stimulus occurred on a dummy piezo that did not have any whisker attached to it. This ensured that any unmasked auditory cue generated by piezo movement was identical on Go and NoGo trials. Trial onset was irregular – the inter-trial interval (ITI) was a 3 ± 2 s, after which mice were required to suppress licking below an ILI threshold for ~ 3 s to initiate the next trial. Mice were rewarded for licking within the response window (2.0 s) on Go trials but were neither rewarded nor punished for licking on NoGo trials. 2/7 VIP expert mice we randomly interleaved 10–15% of Go trials where licking within the response window was not rewarded (unrewarded Hits). Behavioral outcomes on each trial were recorded as hit, miss, false alarm or correct rejection. For licking in the response window to count towards a behavioral outcome of hit or false alarm, licking needed to occur with interlick intervals below a threshold of 300 ms (i.e., >2 licks need to occur in 300 ms).
To separate sensory-driven activity from action- or reward-related neural signals during goal-directed behavior, we incorporated a delay period in our whisker detection task. Mice were trained either with a short delay period or a long delay period. We used two task parameters which were effective to promote delayed licking. The first was a trial abort window. This included the stimulus window (0.5 sec) for mice trained with a short delay period, and the stimulus window (0.5 sec) plus an additional post-stimulus delay period (0.5 s) for mice trained with a long delay period. Licking during the trial abort window caused termination of the trial. The second was a graded reward delivery paradigm to shift the onset of response licks – reward size on hit trials was larger the later mice licked in the response window. Reward size followed a ramp/plateau gradient – there was linear ramp in reward volume during the first 50 – 75% of the response window (ramp duration: long delay – 1 s, short delay – 1.5 s), which then plateaued to the maximum reward volume (8–13 μl; median reward size, 4 μl). Aborted trials with licks that occurred (0 – 0.799 s after stimulus onset) were excluded from analysis. Aborted trials with licks that occurred (>0.799 s after stimulus onset) were classified as unrewarded Hits on Go trials and False Alarms on NoGo trials. Thus, measurements on unrewarded Hits came from reclassified aborted trials in all mice, and additionally from intentionally interleaved unrewarded Go trials in 2/7 VIP mice. The task structure in experiments performed under whisker paralysis induced by Botox was identical to that used in standard expert animal experiments.
Video monitoring and tracking of whisker motion, body motion and pupil size
Mice were monitored during data acquisition using either a Logitech HD Pro Webcam C920 (modified for IR detection; version 1 videos) or FLIR Blackfly S (BFS-U3–63S4M; version 2 videos). A subset of the videos (15–30 fps) was used to track spontaneous body movements during the task with DeepLabCut16. Labels were manually placed at points of interest for tracking facial movements (snout tip, whisker pad and 2–3 prominently visible whiskers), overall body motion (corner of the mouse stage), pupil size (8 labels on the pupil circumference), eyelids (8 labels on the eyelid circumference), and licking (tongue and tip of the lickport) to generate a training dataset. Two DeepLabCut networks were trained – one model was used for an initial set of videos that did not include pupil information (version 1). This network was trained for 200,000 iterations on 960 labeled frames extracted from 24 video clips across three VIP-Cre; Ai162D mice. A second model was used for videos that included pupil information (version 2). This network was trained for 200,000 iterations on 1110 labeled frames extracted from 37 video clips across three VIP-Cre; Ai162D mice and three Drd3-Cre; Ai162D mice. These training regimens produced good fit of the models to the training data (loss <0.005).
Behavioral videos from 44 imaging sessions of VIP interneuron responses in expert mice were used in analysis of VIP cell activity relative to whisker motion, body motion and pupil size. Individual whisker identity was not tracked in the videos, rather an estimate of overall whisker motion over the session was quantified as the mean displacement of all whisker-related labels, plotted as a function of time in the session. For an overall estimate of body motion, we tracked the front corner of the spring-mounted stage on which the mouse was seated. Pupil size was computed as the area of the ellipse fit to the pupil circumference labels. A one-dimensional moving median filter (40 frame window) was applied to the trace of pupil size as a function of time to remove artifacts related to blinking. Eyelid labels were used to assess whether the eyes remained open during the task. The time series of lick events estimated from tongue and lickport labels was matched to the time series of licks detected by the capacitive lick sensor in order to aid alignment of behavior videos with trial onset times.
Whisk events were detected at timepoints when the whisker motion trace exceeded the 70th percentile of displacement values for the entire session, and remained above 4x this threshold for at least 100 frames following whisk onset. These parameters were selected for relatively high amplitude, prolonged spontaneous whisker motion events for comparison with whisker movements that typically accompany licking. Whisk events were considered spontaneous rather than lick-associated, if they were not preceded by licks for >=3 s and not followed by licks for >=1 s. To avoid including multiple whisk events from within the same whisk bout, only whisk events that were not preceded by other whisk events for at least 3 s were included in the analysis.
Similarly, body motion events were detected when body motion position exceeded the 70th percentile of displacement values for the entire session, and remained above 4x this threshold for at least 100 frames following whisk onset. Spontaneous body motion events were required to not be preceded by licks for >=3 s and not followed by licks for >=1 s. Only body motion events that were not preceded by other body motion events for at least 3 s were included in the analysis.
To compare changes in pupil size that accompanied lick events with changes in pupil size that occurred on spontaneous motion events we identified spontaneous whisker motion events with amplitudes ≤ 0.5 standard deviations of the mean amplitude of whisker motion events that co-occur with licking, and spontaneous body motion events with amplitudes ≤ 0.5 standard deviations of the mean amplitude of body motion events that co-occur with licking.
For analyses comparing neural activity on low motion vs. high motion trials, magnitude of whisker/body motion on each trial was computed in the same time window used for quantifying neural activity. Values in the lower 50% of distribution for whisker/body motion amplitudes were classified as “low motion trials” and those in the upper 50% of whisker/body motion amplitudes were classified as “high motion trials.”
2-photon calcium imaging
Once criterion performance was achieved on the whisker detection task, imaging was conducted through the cranial window during daily behavior sessions. 2-photon imaging was performed using a Sutter Moveable-Objective Microscope with one resonant scanner (RESSCAN-MOM, Sutter) and one galvo scanner (Cambridge Technology). A Chameleon Ti-Sapphire pulsed laser (Coherent) tuned to 920 nm (or, for a subset of the data, an ALCOR 920 nm fixed wavelength femtosecond fiber laser; Spark Lasers) was used for excitation of GCaMP6s. Fluorescence emission was collected through a water-dipping objective (16x, 0.8 NA, Nikon), band-pass filtered (HQ 575/50 filter, Chroma) and detected by GaAsP photomultiplier tubes (H10770PA-40, Hamamatsu). Single Z-plane images (512 × 512 pixels) were serially acquired at 7.5 Hz (30 Hz acquisition, averaged every 4 frames) using ScanImage 5 software (Vidrio Technologies). Laser power of 60–90 mW (at the front of objective) was used. Each imaging field measured 305 μm × 305 μm, and 7–8 imaging fields were obtained per mouse at depths of 110–250 μm below the cortical surface10. Imaging fields in individual mice with substantial X–Y overlap (>25%) were separated by at least 20 μm in depth to avoid repetition of cells across multiple sessions. The blood vessels at the surface of each imaging field were imaged at the start of each session for later use in alignment with vasculature during histology. After the final imaging session, the mouse was euthanized and the brain was collected for histology, to reconstruct the locations of imaging fields in the whisker map.
Histology and localization of imaging fields
The brain was removed and fixed overnight in 4% paraformaldehyde. The cortex was then flattened, sunk in 30% sucrose and sectioned at 50 μm parallel to the cortical surface. Tangential sections were processed for cytochrome oxidase (CO) staining. CO-stained sections revealed surface vasculature (in the most superficial section) and barrel boundaries (in sections through L4). Alignment of histological sections was performed manually using Fiji46. Custom MATLAB code was used to localize the centroid of each of the nine anatomical barrels corresponding to whiskers stimulated per session, and the position of cells relative to barrel boundaries. Mean barrel width was calculated as the average of the major and minor axes across all barrels. Imaging fields were aligned to their locations in barrel cortex based on landmarks in surface vasculature, and the X–Y coordinate of each cell relative to barrel boundaries was determined. A cell was considered to be located within a specific barrel column if >50% of its pixels were located inside the boundaries of that column, as determined from the CO-stained sections. Cells not located within any column were classified as being located within septa. Distance of each cell from barrel column centroids was used for spatial analysis of sensory and action-related responses in the whisker map. Additionally, images of coronal sections from one VIP-Cre; Ai162D and one Drd3Cre; Ai162D are included (Figure 2A) to visualize L2/3 VIP and PYR cells. These were stained with DAPI to determine laminar boundaries.
QUANTIFICATION AND STATISTICAL ANALYSIS
Image processing and selection of ROIs
Image processing was conducted in MATLAB using custom pipeline code (adapted from LeMessurier, 201947). Raw imaging movies were corrected for slow XY drift in MATLAB using dftregistration48. Regions-of-interest (ROIs) were manually defined as ellipsoid regions drawn over neuronal somata that appeared when frames averaged across an entire registered imaging movie. The ROI signal was calculated as the mean fluorescence of its component pixels. Neuropil subtraction was not applied for VIP cells. For PYR cells, neuropil correction was applied. A neuropil mask was created as a 10 pixel-wide ring starting two pixels from the somatic ROI. Neuropil pixels correlated with any somatic ROI (r>0.2) were excluded from the neuropil mask. Mean fluorescence of the neuropil mask was scaled by 0.1 and subtracted from the raw somatic ROI fluorescence. For each ROI, the raw fluorescence time series (or neuropil subtracted fluorescence trace, in the case of PYR cells) was converted to ΔF/F, which was defined as (Ft-F0)/F0, where F0 is the 20th percentile of fluorescence across the entire imaging movie and Ft is the fluorescence on each frame.
Analysis of behavioral performance
Signal detection theory was applied to calculate d’ as a measure of detection performance according to the standard definition as Z(Hit Rate) - Z(False Alarm Rate), where Z is the inverse cumulative of the normal distribution. For each session, analysis was restricted to trials between the first trial with a sliding d’ > 0.8 to the last trial with a sliding d’ > 0.8 to minimize effects of satiety level during the earlier and later portions of the session. All key analyses were also performed with more restrictive or less restrictive sliding d’ cutoff values (1.0 and 0.5 respectively) to capture different ranges of daily performance within expert mice, but the choice of cutoff did not affect the interpretation of results in this study.
Cross-correlation analysis
To examine the association of VIP interneuron activity with spontaneous whisking, body motion and pupil-linked arousal, we performed cross-correlation analyses. Cross-correlograms were generated for each cell using the time series of ΔF/F trace for entire sessions in expert and the corresponding traces for whisker motion, body motion and pupil-linked arousal traces. Cross-correlations were calculated after downsampling whisker motion, body motion and pupil size traces to the sample rate of 2-p imaging (7.51 Hz), subtracting the mean from each trace and dividing by the product of the standard deviations so that cross-correlation at zero lag was equal to the correlation coefficient between the two signals. The mean cross-correlogram was generated by average cross-correlograms across the whole population, and time lag for peak cross-correlation was determined within a 16 s window relative to zero lag.
Detrending methods
To account for the negative trend in baseline activity of VIP interneurons that was correlated with the decrease in spontaneous whisker motion, body motion and arousal observed in the pre-trial period, we adopted three approaches for detrending.
First, the magnitude of all event-evoked responses reported was quantified in the general form : response magnitude = (post-event ΔF/F) – (pre-event ΔF/F) - (post-no-event ΔF/F) – (pre-no-event ΔF/F). Thus, we report response magnitudes measured relative to pre-event baseline, corrected for trends in baseline activity over time by subtracting the change in activity measured in the absence of the event of interest. To estimate changes in activity in the absence of whisker stimuli, we examined neural activity aligned to dummy piezo deflection times on NoGo trials. We estimated changes in activity in the absence of licks by examining neural activity aligned to “no-lick” events at timepoints matched to the timepoints of lick events. To do this, we obtained the distribution of all lick event times relative to trial onset (within the time segment corresponding to each imaging movie). We then randomly selected values from this distribution and identified the corresponding times relative to trial onset on trials in which no licks occurred, and designated these as “matched no-lick” times. These were computed separately for each lick type. A similar procedure was used to identify “no whisk” and “no body motion events” for comparison relative to spontaneous whisk and body motion events. Although there was some variation in the baseline trends over time (e.g. Figure 4B) when estimated based on different event types (i.e. stimuli, different types of licks, spontaneous motion events), overall there were no systematic trends related to event type and “no-event” aligned traces for licks and spontaneous events were largely overlapping with mean traces aligned to dummy piezo deflection times on NoGo trials. Similar results were also obtained for all main analyses when event-aligned traces for all event types were compared to the same “no-event” trace (dummy piezo deflection times on NoGo trials).
Second, for whisker- or lick- responses within the early window (0–0.799 s) following event onset (where the negative trend in baseline activity was linear, Figure S1E), we also present mean traces of linearly detrended traces of neural activity aligned to event onset. For each cell, a line was fit to the median trace of prestimulus baseline (in a 0.666 s window) across trials for event-aligned traces and no-event-aligned traces which was then subtracted from each trial for the full peri-event trace. The mean trace of neural activity aligned to matched no-event times indicated that the trends in baseline activity become non-linear over longer time intervals (Figure 4). Since modulation by reward was observed primarily observed in a late window following lick onset, we report results of reward modulation analysis using a modified approach. The mean trace aligned to matched no-lick events for unrewarded events for each cell was subtracted from the mean trace aligned to lick events for unrewarded events for that cell. Similarly, the mean trace aligned to matched no-lick events for rewarded events for each cell was subtracted from the mean trace aligned to lick events for rewarded events for that cell. These detrended traces for lick-aligned activity were then used to calculate the reward modulation index for each cell (described below under Reward modulation of neural activity).
Quantification of evoked responses
All evoked responses were quantified relative to the relevant event (stimulus, lick, spontaneous whisking, spontaneous body motion) using the same post-event analysis window (7 frames, 0.799 s) and pre-event baseline window (2 frames, 0.270 s).
Whisker responses
Only sessions where a median of >=15 trials per whisker were included for analyses of whisker-evoked responses, to ensure accurate measurement of mean responses and receptive fields. On each Go trial, whisker-evoked ΔF/F signal was quantified for each ROI as (mean ΔF/F in the post-stimulus window) – (mean ΔF/F in the baseline window). On each NoGo trial, ΔF/F signal aligned to the NoGo stimulus (dummy piezo deflection) was calculated for each ROI, using the same method. For each ROI, the response magnitude to every whisker was calculated as (median whisker-evoked ΔF/F signal across Go trials – median ΔF/F signal across NoGo trials). Trials in which any licks occurred during the post-stimulus window (0 – 0.799 s) were excluded from analysis. A cell was considered to have a significant whisker-evoked response if at least one whisker produced a significant response above baseline activity, as computed using a permutation test.
To do this, the distribution of whisker-evoked ΔF/F signal on Go trials was combined with the distribution of median ΔF/F signal on NoGo trials. The combined distribution of mean signals was split into two randomly chosen groups, and the difference in means of the groups was measured. This was repeated 10,000 times, and the actual difference between the Go and NoGo distributions was compared to the distribution of permuted differences in means. A difference greater than the 95th percentile of the permuted distribution was considered to be significant. Correction for multiple comparisons (False Discovery Rate correction49) was applied to p-values for each of the nine whiskers. Cells that did not exhibit a positive response magnitude to at least one whisker were not considered responsive to whisker stimulation.
Quantification of receptive fields and map organization
The whisker associated with the anatomical home column of each cell was defined as its columnar whisker (CW). The whisker that evoked the numerically highest magnitude response was defined as the best whisker (BW). Equivalent best whiskers (eBWs) were defined as whiskers that evoked significant responses (relative to NoGo trials), but were not statistically different from the BW, based on permutation test. If the CW was amongst the eBWs for a cell, the cell was considered tuned to the CW, otherwise it was considered tuned to the BW. Receptive field analyses were performed only for whisker-responsive cells. Negative ΔF/F responses were not excluded from receptive field analyses, however only cells with significant responses that had a positive BW response were included. For receptive field analyses, cells were only included in the analysis if the columnar whisker and at least five surround whiskers were tested. This was to ensure that our measures of tuning width were not affected by limited sampling of whiskers in the receptive field due to positioning of the CW at the edges of the piezo actuator array that delivers whisker stimuli.
Whisker responses for each cell were normalized by Z-scoring to spontaneous (NoGo trial) activity, rank-ordered by response strength, and then averaged across cells to obtain the mean rank-ordered receptive field, centered on the BW. BW tuning preference (tuning sharpness) was defined as (RBW - RW)/(RBW + RW), where RBW = ΔF/F to BW, and RW = mean ΔF/F for all other whiskers. CW-centered tuning curves were also generated, shown separately for the row dimension and the arc dimension.
Tuning heterogeneity within barrel columns was quantified as the fraction of cells within each column that were tuned to CW vs. non-CW whiskers. Cells overlying the septa were excluded from this analysis. To assess tuning heterogeneity across the whisker map, each cell’s response to every whisker tested was examined as a function of distance from the center of the barrel column associated with that whisker (reference column). Cells in barrels and septa were both included in this analysis. For comparison with the organization of lick-related signals in the map, organization of whisker-evoked signals in the map was also examined as function of distance from the nearest column center.
Lick responses
To measure lick-evoked responses, the same procedure was followed, except that lick-evoked ΔF/F signal was used in place of whisker-evoked ΔF/F signals, and matched no-lick events (computed separately for each lick type) were used in place of NoGo trials. For each ROI, the response magnitude to licks was calculated as (median lick-evoked ΔF/F signal across lick trials) – (median ΔF/F signal across matched no-lick trials). We refer to this metric as ‘ΔF/F (lick – no-lick’)’. For a few summary plots, we also show the lick-evoked ΔF/F signal and matched nolick ΔF/F signal separately to facilitate comparison with the raw data traces. This is indicated as ‘ΔF/F (lick) or ΔF/F (no-lick’) relative to pre-event baseline.’
The ΔF/F trace was aligned to lick times (time of contact of the mouse’s tongue with the lickport), as recorded by the capacitive lick sensor, however we also provide measurements of whisker and body movements aligned to these same lick events to allow assessment of the time course of neural activity in relative to the initiation of orofacial movements that accompany licking.
Only the first lick of each lick bout was used. Licks within bouts were identified as licks that occurred with interlick intervals < the 90th percentile of the distribution of interlick intervals on each trial. Licks were classified as rewarded or unrewarded licks in both expert and novice mice. In expert mice, unrewarded licks included ITI licks, FA licks, unrewarded Hit licks, while rewarded licks included Hit licks. FA licks, unrewarded Hit licks and Hit licks were licks that occurred in the response window of trials, while ITI licks occurred outside of the trial period. Only lick events that were not preceded by licks for at least 3 s were included in the analysis of neural activity. For ITI licks, an additional restriction of not being preceded by whisker stimulus for at least 3 s was also applied.
Cells that did not exhibit a positive response magnitude to lick onset were not considered responsive to licking.
For comparison of the organization of lick-related signals relative to whisker signals in the map, the magnitude of lick responses was examined as function of distance from the nearest column center.
Spontaneous whisking and body motion responses
To measure responses evoked by spontaneous whisking and body motions, the same procedure used for stimulus- and lick-evoked responses was used, except that ΔF/F was aligned to whisk/body motion events determined from video analysis (described above in the section on ‘Video monitoring and tracking body movements’). Only whisk or body motion events that were not preceded by licks or whisk/body motion events for at least 3 s were included in this analysis. Additionally, only whisk/body motion events that were not followed by a lick within 1 s were used for spontaneous events – since the goal of this analysis was to examine activity evoked in VIP interneurons purely by whisking/body motion, as opposed to the whisker/body movements that typically occur while licking.
Reward modulation of neural activity
To study reward modulation of VIP cell responses, we compared mean responses evoked by rewarded vs. unrewarded licks. We also computed a reward modulation index that compared responses evoked by rewarded vs. unrewarded licks in each cell. We adopted this approach because receipt of reward co-occurs with licking, which elicits strong responses in VIP cells as reported in this manuscript. To compute the reward modulation index (RMI), first we subtracted the trace neural activity aligned to matched no-lick events from the trace of lick aligned neural activity for unrewarded and rewarded licks (baseline trend-subtracted traces; see Detrending Methods). Reward modulation index was then calculated as the difference in late window (1.0 – 2.0 s) between activity measured for rewarded and unrewarded licks, divided by the absolute value of their sum: RMI = ΔF/F rewarded - ΔF/F unrewarded/|ΔF/F rewarded + ΔF/F unrewarded|. Cells were considered to be significantly modulated by reward if they had an RMI > 2.0 standard deviations above the mean of all RMI values.
Statistical analysis of summary data
Statistical analyses were performed in MATLAB. Sample size (n) for each analysis is displayed in the corresponding Figure panel, statistical tests used and p-values are reported in the Results section. Differences in mean between two groups were tested with a permutation test for difference in means, abbreviated ‘permutation test’ in the main text. Fisher’s exact test was used for comparison between proportions. Summary data are reported as mean ± SEM. Population means were compared using permutation tests, with correction for multiple comparisons (False Discovery Rate correction49) where necessary. For comparison of population means with different subgroups, a permutation test was first performed to determine whether a main effect between groups was present, followed by post hoc tests comparing pairwise means with False Discovery Rate correction for multiple comparisons. A significance level (alpha) of 0.05 was used. Behavioral measures are reported for individual mice. For imaging data, population analyses combined cells across mice. For key results, we also show averages separately for individual mice tested to allow comparison with population data, and performed additional tests if necessary. In the analysis of receptive fields, we found there was a large overlap in distributions of the tuning sharpness measure for VIP and PYR cells in individual mice. We therefore repeated analyses from resampled distributions generated from randomly sampled subsets of mice to ensure that the results were not driven by any specific mouse, and found results that were similar to those obtained from the combined population analysis.
All statistical tests reported in main Results text use n of cells, but we verify that all major effects were consistent across individual mice in Supplemental Figures (Figure S1I, S1J, S2D, S3K). To account for interindividual variability, we also tested all key results using a linear mixed effects model with the formula:
where mouse sex and mouse ID are modeled as random effects. A summary of results tested using this approach is provided in Table S1.
Supplementary Material
Mouse performing the whisker detection task with delay period. Related to Figure 1. A continuous sequence of eight trials that captures all possible trial types and outcomes on successfully completed (unaborted) trials is shown in real time (30 fps) along with DeepLabCut labels tracking pupil (green), whisker (purple) and body (red-brown) motion.
Highlights.
VIP cells in S1 show strong somatotopic whisker responses in goal-directed behavior
Lick initiation activates VIP cells in S1, beyond movement or arousal modulation
Random or task-related reward does not directly activate VIP cells in S1
Reward suppresses VIP cells in S1 and could encode expectation linked to actions
Acknowledgements
We thank Katherine Smith, Stephanie Richards, Tasfia Rashid and Katie Lin for mouse colony management. This work was funded by NIH grant F32NS114327 (DLR), a UC Berkeley SURF fellowship supported by the Anselm M&PS Fund (AC), and NIH grants R37 NS092367 and R01 NS092367–08A1 (DEF).
Inclusion and Diversity
One or more of the authors of this paper self-identifies as a gender minority in their field of research. One or more of the authors of this paper self-identifies as a member of the LGBTQIA+ community.
Footnotes
Publisher's Disclaimer: This is a PDF file of an unedited manuscript that has been accepted for publication. As a service to our customers we are providing this early version of the manuscript. The manuscript will undergo copyediting, typesetting, and review of the resulting proof before it is published in its final form. Please note that during the production process errors may be discovered which could affect the content, and all legal disclaimers that apply to the journal pertain.
Declaration of interests
The authors declare no competing interests.
References
- 1.Tremblay R, Lee S, Rudy B (2016). GABAergic Interneurons in the Neocortex: From Cellular Properties to Circuits. Neuron 91:260–292. [DOI] [PMC free article] [PubMed] [Google Scholar]
- 2.Pfeffer CK, Xue M, He M, Huang ZJ, Scanziani M (2013). Inhibition of inhibition in visual cortex: the logic of connections between molecularly distinct interneurons. Nature neuroscience 16:1068–1076. [DOI] [PMC free article] [PubMed] [Google Scholar]
- 3.Lee S, Kruglikov I, Huang ZJ, Fishell G, Rudy B (2013). A disinhibitory circuit mediates motor integration in the somatosensory cortex. Nat Neurosci 16:1662–1670. [DOI] [PMC free article] [PubMed] [Google Scholar]
- 4.Fu Y, Tucciarone JM, Espinosa JS, Sheng N, Darcy DP, Nicoll RA, Huang ZJ, Stryker MP (2014). A cortical circuit for gain control by behavioral state. Cell 156:1139–1152. [DOI] [PMC free article] [PubMed] [Google Scholar]
- 5.Pi HJ, Hangya B, Kvitsiani D, Sanders JI, Huang ZJ, Kepecs A (2013). Cortical interneurons that specialize in disinhibitory control. Nature 503:521–524. [DOI] [PMC free article] [PubMed] [Google Scholar]
- 6.Szadai Z, Pi H-J, Chevy Q, Ócsai K, Albeanu DF, Chiovini B, Szalay G, Katona G, Kepecs A, Rózsa B (2022). Cortex-wide response mode of VIP-expressing inhibitory neurons by reward and punishment. eLife 11:e78815. [DOI] [PMC free article] [PubMed] [Google Scholar]
- 7.Lee C, Harkin EF, Yin X, Naud R, Chen S (2022). Cell-type specific responses to associative learning in the primary motor cortex. Elife 11:e72549. doi: 10.7554/eLife.72549. [DOI] [PMC free article] [PubMed] [Google Scholar]
- 8.Wilmes KA, Clopath C (2019). Inhibitory microcircuits for top-down plasticity of sensory representations. Nature Communications 10:5055. [DOI] [PMC free article] [PubMed] [Google Scholar]
- 9.Letzkus JJ, Wolff SB, Luthi A (2015). Disinhibition, a Circuit Mechanism for Associative Learning and Memory. Neuron 88:264–276. [DOI] [PubMed] [Google Scholar]
- 10.Prönneke A, Scheuer B, Wagener RJ, Möck M, Witte M, Staiger JF (2015). Characterizing VIP neurons in the barrel cortex of VIPcre/tdTomato mice reveals layer-specific differences. Cerebral Cortex 25(12):4854–68. [DOI] [PMC free article] [PubMed] [Google Scholar]
- 11.Munoz W, Tremblay R, Levenstein D, Rudy B (2017). Layer-specific modulation of neocortical dendritic inhibition during active wakefulness. Science 355:954–959. [DOI] [PubMed] [Google Scholar]
- 12.Clancy KB, Schnepel P, Rao AT, Feldman DE (2015). Structure of a single whisker representation in layer 2 of mouse somatosensory cortex. J Neurosci 35:3946–3958. [DOI] [PMC free article] [PubMed] [Google Scholar]
- 13.Wang HC, LeMessurier AM, Feldman DE (2022). Tuning instability of non-columnar neurons in the salt-and-pepper whisker map in somatosensory cortex. Nat Commun 13:6611. [DOI] [PMC free article] [PubMed] [Google Scholar]
- 14.Cazettes F, Reato D, Morais JP, Renart A, Mainen ZF (2021). Phasic Activation of Dorsal Raphe Serotonergic Neurons Increases Pupil Size. Curr Biol 31:192–197.e194. [DOI] [PMC free article] [PubMed] [Google Scholar]
- 15.Reimer J, Froudarakis E, Cadwell CR, Yatsenko D, Denfield GH, Tolias AS (2014). Pupil fluctuations track fast switching of cortical states during quiet wakefulness. Neuron 84(2):355–62. doi: 10.1016/j.neuron.2014.09.033. [DOI] [PMC free article] [PubMed] [Google Scholar]
- 16.Mathis A, Mamidanna P, Cury KM, Abe T, Murthy VN, Mathis MW, Bethge M (2018). DeepLabCut: markerless pose estimation of user-defined body parts with deep learning. Nature Neuroscience 21:1281–1289. [DOI] [PubMed] [Google Scholar]
- 17.Audette NJ, Bernhard SM, Ray A, Stewart LT, Barth AL (2019). Rapid Plasticity of Higher-Order Thalamocortical Inputs during Sensory Learning. Neuron 103:277–291.e274. [DOI] [PMC free article] [PubMed] [Google Scholar]
- 18.Sermet BS, Truschow P, Feyerabend M, Mayrhofer JM, Oram TB, Yizhar O, Staiger JF, Petersen CCH (2019). Pathway-, layer- and cell-type-specific thalamic input to mouse barrel cortex. eLife 8:e52665. [DOI] [PMC free article] [PubMed] [Google Scholar]
- 19.Wall NR, De La Parra M, Sorokin JM, Taniguchi H, Huang ZJ, Callaway EM (2016). Brain-Wide Maps of Synaptic Input to Cortical Interneurons. The Journal of Neuroscience 36:4000. [DOI] [PMC free article] [PubMed] [Google Scholar]
- 20.Mesik L, Ma WP, Li LY, Ibrahim LA, Huang ZJ, Zhang LI, Tao HW (2015). Functional response properties of VIP-expressing inhibitory neurons in mouse visual and auditory cortex. Front Neural Circuits 9:22. [DOI] [PMC free article] [PubMed] [Google Scholar]
- 21.Kerlin AM, Andermann ML, Berezovskii VK, Reid RC (2010). Broadly Tuned Response Properties of Diverse Inhibitory Neuron Subtypes in Mouse Visual Cortex. Neuron 67:858–871. [DOI] [PMC free article] [PubMed] [Google Scholar]
- 22.Kastli R, Vighagen R, van der Bourg A, Argunsah AÖ, Iqbal A, Voigt FF, Kirschenbaum D, Aguzzi A, Helmchen F, Karayannis T (2020). Developmental divergence of sensory stimulus representation in cortical interneurons. Nat Commun 11(1):5729. doi: 10.1038/s41467-020-19427-z. [DOI] [PMC free article] [PubMed] [Google Scholar]
- 23.Guy J, Möck M, Staiger JF (2023). Direction selectivity of inhibitory interneurons in mouse barrel cortex differs between interneuron subtypes. Cell Rep 42:111936. [DOI] [PubMed] [Google Scholar]
- 24.de Vries SEJ, Lecoq JA, Buice MA, Groblewski PA, Ocker GK, Oliver M, Feng D, Cain N, Ledochowitsch P, Millman D, et al. (2020). A large-scale standardized physiological survey reveals functional organization of the mouse visual cortex. Nat Neurosci 23(1):138–151. doi: 10.1038/s41593-019-0550-9. [DOI] [PMC free article] [PubMed] [Google Scholar]
- 25.Ayzenshtat I, Karnani MM, Jackson J, Yuste R (2016). Cortical Control of Spatial Resolution by VIP+ Interneurons. J Neurosci 36(45): p. 11498–11509. [DOI] [PMC free article] [PubMed] [Google Scholar]
- 26.Dipoppa M, Ranson A, Krumin M, Pachitariu M, Carandini M, Harris KD (2018). Vision and Locomotion Shape the Interactions between Neuron Types in Mouse Visual Cortex. Neuron 98(3):602–615.e8. doi: 10.1016/j.neuron.2018.03.037. [DOI] [PMC free article] [PubMed] [Google Scholar]
- 27.Dudai A, Yayon N, Lerner V, Tasaka GI, Deitcher Y, Gorfine K, Niederhoffer N, Mizrahi A, Soreq H, London M (2020). Barrel cortex VIP/ChAT interneurons suppress sensory responses in vivo. PLoS Biol 18(2): p. e3000613. [DOI] [PMC free article] [PubMed] [Google Scholar]
- 28.Gasselin C, Hohl B, Vernet A, Crochet S, Petersen CCH (2021). Cell-typespecific nicotinic input disinhibits mouse barrel cortex during active sensing. Neuron, 109(5):778–787 [DOI] [PMC free article] [PubMed] [Google Scholar]
- 29.Sachidhanandam S, Sermet BS, and Petersen CCH (2016). ParvalbuminExpressing GABAergic Neurons in Mouse Barrel Cortex Contribute to Gating a GoalDirected Sensorimotor Transformation. Cell Reports, 15(4): p. 700–706. [DOI] [PMC free article] [PubMed] [Google Scholar]
- 30.Yu J, Hu H, Agmon A, Svoboda K (2019). Recruitment of GABAergic Interneurons in the Barrel Cortex during Active Tactile Behavior. Neuron 104(2): 412–427.e4. [DOI] [PMC free article] [PubMed] [Google Scholar]
- 31.Mossing DP, Veit J, Palmigiano A, Miller KD, Adesnik H (2021). Antagonistic inhibitory subnetworks control cooperation and competition across cortical space. bioRxiv:2021.2003.2031.437953. [Google Scholar]
- 32.Naskar S, Qi J, Pereira F, Gerfen CR, Lee S (2021). Cell-type-specific recruitment of GABAergic interneurons in the primary somatosensory cortex by long-range inputs. Cell Rep 34(8):108774. doi: 10.1016/j.celrep.2021.108774. [DOI] [PMC free article] [PubMed] [Google Scholar]
- 33.Batista-Brito R, Zagha E, Ratliff JM, Vinck M (2018). Modulation of cortical circuits by top-down processing and arousal state in health and disease. Curr Opin Neurobiol 52:172–181. [DOI] [PubMed] [Google Scholar]
- 34.Pinto L, and Dan Y (2015). Cell-Type-Specific Activity in Prefrontal Cortex during Goal-Directed Behavior. Neuron 87(2): p. 437–450. [DOI] [PMC free article] [PubMed] [Google Scholar]
- 35.Chen JL, Margolis DJ, Stankov A, Sumanovski LT, Schneider BL, Helmchen F (2015). Pathway-specific reorganization of projection neurons in somatosensory cortex during learning. Nat Neurosci 18:1101–1108. [DOI] [PubMed] [Google Scholar]
- 36.Vavladeli A, Daigle T, Zeng H, Crochet S, Petersen CC (2020). Projection-specific activity of layer 2/3 neurons imaged in mouse primary somatosensory barrel cortex during a whisker detection task. Function 1(1):zqaa008. [DOI] [PMC free article] [PubMed] [Google Scholar]
- 37.Banerjee A, Parente G, Teutsch J, Lewis C, Voigt FF, Helmchen F (2020). Valueguided remapping of sensory cortex by lateral orbitofrontal cortex. Nature 585:245–250 [DOI] [PubMed] [Google Scholar]
- 38.Gutierrez R, Carmena JM, Nicolelis MA, Simon SA (2006). Orbitofrontal ensemble activity monitors licking and distinguishes among natural rewards. J Neurophysiol 95:119133. [DOI] [PubMed] [Google Scholar]
- 39.Eggermann E, Kremer Y, Crochet S, Petersen CCH (2014). Cholinergic Signals in Mouse Barrel Cortex during Active Whisker Sensing. Cell Reports 9:1654–1660. [DOI] [PubMed] [Google Scholar]
- 40.Ren C, Peng K, Yang R, Liu W, Liu C, Komiyama T (2022). Global and subtypespecific modulation of cortical inhibitory neurons regulated by acetylcholine during motor learning. Neuron 110:2334–2350.e2338. [DOI] [PMC free article] [PubMed] [Google Scholar]
- 41.Zou J, Trinh S, Erskine A, Jing M, Yao J, Walker S, Li Y, Hires SA (2021). Directed motor actions and choice signalling drive cortical acetylcholine dynamics. bioRxiv:2021.2012.2021.473699. [Google Scholar]
- 42.Harrison TC, Pinto L, Brock JR, Dan Y (2016). Calcium imaging of basal forebrain activity during innate and learned behaviors. Frontiers in neural circuits 10:36. doi: 10.3389/fncir.2016.00036. [DOI] [PMC free article] [PubMed] [Google Scholar]
- 43.Drew PJ, Feldman DE (2009). Intrinsic Signal Imaging of Deprivation-Induced Contraction of Whisker Representations in Rat Somatosensory Cortex. Cerebral Cortex 19:331–348. [DOI] [PMC free article] [PubMed] [Google Scholar]
- 44.Landers M, Pytte C, Zeigler HP (2002). Reversible blockade of rodent whisking: Botulinum toxin as a tool for developmental studies. Somatosens Mot Res 19(4):358–63. [DOI] [PubMed] [Google Scholar]
- 45.Yang H, Kwon SE, Severson KS, O’Connor DH (2016). Origins of choice-related activity in mouse somatosensory cortex. Nat Neurosci 19, 127–134. [DOI] [PMC free article] [PubMed] [Google Scholar]
- 46.Schindelin J, Arganda-Carreras I, Frise E, Kaynig V, Longair M, Pietzsch T, Preibisch S, Rueden C, Saalfeld S, Schmid B, Tinevez J-Y, White DJ, Hartenstein V, Eliceiri K, Tomancak P, Cardona A (2012). Fiji: an open-source platform for biological-image analysis. Nature Methods 9:676–682. [DOI] [PMC free article] [PubMed] [Google Scholar]
- 47.LeMessurier AM (2019). Imaging_analysis_pipeline. GitHub 5a21c9f https://github.com/alemessurier/imaging_analysis_pipeline
- 48.Guizar-Sicairos M, Thurman ST, Fienup JR (2008). Efficient subpixel image registration algorithms. Opt Lett 33:156–158. [DOI] [PubMed] [Google Scholar]
- 49.Benjamini Y, Hochberg Y (1995). Controlling the False Discovery Rate: A Practical and Powerful Approach to Multiple Testing. Journal of the Royal Statistical Society: Series B (Methodological) 57:289–300. [Google Scholar]
Associated Data
This section collects any data citations, data availability statements, or supplementary materials included in this article.
Supplementary Materials
Mouse performing the whisker detection task with delay period. Related to Figure 1. A continuous sequence of eight trials that captures all possible trial types and outcomes on successfully completed (unaborted) trials is shown in real time (30 fps) along with DeepLabCut labels tracking pupil (green), whisker (purple) and body (red-brown) motion.
Data Availability Statement
Source data for results reported in this manuscript are available on the Feldman lab GitHub repository, https://github.com/dfeldman189/Ramamurthy2023Data. The DOI is listed in the key resources table.
Original code for data analysis is available on the Feldman lab GitHub repository, https://github.com/dfeldman189/Ramamurthy2023Data. The DOI is listed in the key resources table.
Any additional information required to reanalyze the data reported in this paper is available from the lead contact upon request.
KEY RESOURCES TABLE
| REAGENT or RESOURCE | SOURCE | IDENTIFIER |
|---|---|---|
| Chemicals, Peptides, and Recombinant Proteins | ||
| Botulinum Neurotoxin Type A from Clostridium botulinum | List Labs | Cat#130B |
| Cytochrome C from equine heart | Sigma-Aldrich | Cat#C2506-500MG |
| Diaminobenzidine tetrahydrochloride hydrate | Sigma-Aldrich | cat#D5637 |
| Deposited Data | ||
| Source data | This paper |
https://github.com/dfeldman189/Ramamurthy2023Data doi: 10.5281/zenodo.7879613 |
| Experimental Models: Organisms/Strains | ||
| Vip-Cre mice (Viptm1(cre)Zjh/J) | The Jackson Laboratory, Maine | JAX Strain #010908 RRID:IMSR_JAX:010908 |
| Drd3-Cre mice (Tg(Drd3-cre)KI196Gsat/Mmucd) | Drd3-Cre mice (Tg(Drd3-cre)KI196Gsat/Mmucd)Gensat (MMRRC) | MMRRC:034610 |
| Ai16D mice (B6.Cg-lgSjtm162.1(tetO-GCaMP6s,CAGtTA2)Hze/J) | The Jackson Laboratory, Maine | JAX Strain #031562 RRID:IMSR_JAX:031562 |
| Software and Algorithms | ||
| Igor Pro | WaveMetrics, Portland, OR | https://www.wavemetrics.com/products/igorpro |
| MATLAB | R2021a, Mathworks, Natick, MA | https://www.mathworks.com/products/matlab.html |
| Imaging analysis pipeline | LeMessurier AM. 2019. Imaging_ analysis_ pipeline. GitHub 5a21c9f. | https://github.com/elifesciences-publications/imaging_analysis_pipeline |
| Analysis code | This paper |
https://github.com/dfeldman189/Ramamurthy2023Data doi: 10.5281/zenodo.7879613 |
| Arduino IDE 2.0 | 2021, Arduino, Italy | https://www.arduino.cc/en/software |
| Other | ||
| Arduino Mega 2560 R3 | Arduino | A000067 |