

Abstract
Aim:
Assessment of neurologic injury within the immediate hours following out-of-hospital cardiac arrest (OHCA) resuscitation remains a major clinical challenge. Extracellular vesicles (EVs), small bodies derived from cytosolic contents during injury, may provide the opportunity for “liquid biopsy” within hours following resuscitation, as they contain proteins and RNA linked to cell type of origin. We evaluated whether micro-RNA (miRNA) from serologic EVs were associated with post-arrest neurologic outcome.
Methods:
We obtained serial blood samples in an OHCA cohort. Using novel microfluidic techniques to isolate EVs based on EV surface marker GluR2 (present on excitatory neuronal dendrites enriched in hippocampal tissue), we employed reverse transcription quantitative polymerase chain reaction (RT-qPCR) methods to measure a panel of miRNAs and tested association with dichotomized modified Rankin Score (mRS) at discharge.
Results:
EVs were assessed in 27 post-arrest patients between 7/3/2019–7/21/2022; 9 patients experienced good outcomes. Several miRNA species including miR-124 were statistically associated with mRS at discharge when measured within 6 hours of resuscitation (AUC=0.84 for miR-124, p<0.05). In a Kendall ranked correlation analysis, miRNA associations with outcome were not strongly correlated with standard serologic marker measurements, or amongst themselves, suggesting that miRNA provide distinct information from common protein biomarkers.
Conclusions:
This study explores the associations between miRNAs from neuron-derived EVs (NDEs) and circulating protein biomarkers within 6 hours with neurologic outcome, suggesting a panel of very early biomarker may be useful during clinical care. Future work will be required to test larger cohorts with a broader panel of miRNA species.
INTRODUCTION
Early assessment of neurologic injury following out-of-hospital cardiac arrest (OHCA) remains a major challenge and domain of active research. While serum biomarkers of neuronal injury, such as nerve-specific enolase or neurofilament light chain (NFL),1,2 have been statistically associated with clinical outcomes, they lack granularity to identify specific neuronal subtypes or cerebral regions that have sustained injury, which may have important implications for both patient-specific treatment and withdrawal of care decisions.3 The development of more specific biomarkers that might characterize injury subtypes within hours of resuscitation would be of potential great value to tailor therapy. Recent work has suggested that the dosing of targeted temperature management (TTM) may depend on neurologic injury severity;4–6 other treatment parameters such as target arterial pressure and oxygenation may depend on injury severity as well.7
Extracellular vesicles (EVs) are small circulating lipid-enveloped particles that contain cytosolic contents from their cells of origin, including proteins and nucleic acids. EVs may play an important role in intercellular signaling and carry a collection of cell-type specific microRNA (miRNA) species in circulation that can be measured and sequenced.8,9 The analysis of brain derived EVs allow precise analysis of a “transcriptome of brain injury”, potentially offering a serologic tool to assess injury with greater granularity than offered by protein markers. In this study we use a nanomagnetic EV isolation technology, track etched magnetic nanopore (TENPO),10 previously developed for traumatic brain injury,11,12 that enriches for neuron derived EVs.13,14 We sought to establish a cohort of post-arrest patients with serial EV sampling and test whether specific miRNAs would be associated with neurologic outcomes. Our goal was two-fold: (1) to evaluate the effectiveness of prognosing outcome of OHCA patients using longitudinally measured sets of GluR2+ EV packaged miRNA (SUPPLEMENTAL TABLE 1) and circulating protein biomarkers, and (2) to determine if GluR2+ EV miRNA species and plasma biomarker proteins (IL-10, TNFα, cytokines implicated in a range of inflammatory processes including post-arrest injury;15,16 GFAP, NFL, Tau, and UCH-L1, neuronal injury markers17) provided distinct and complementary information linked to outcomes.
METHODS
Subject accrual
Patients were screened and enrolled at the Hospital of the University of Pennsylvania and the Penn Presbyterian Medical Center, academic medical centers within the Penn Medicine health system. Research coordinators were available in-hospital 24/7 to respond to OHCA resuscitations via the Penn Acute Research Collaboration (PARC) program. Adult (age>17 y) patients were considered eligible if they (1) experienced non-traumatic OHCA, (2) experienced return of spontaneous circulation (ROSC) in the prehospital setting immediately before hospital arrival or during Emergency Department (ED) care. Subsequent exclusion criteria included death before six hours as serial blood sampling could not be conducted. A control cohort was also enrolled, comprised of patients who presented to the ED experiencing acute coronary syndrome (ACS) or myocardial infarction (MI), without cardiac arrest or known brain injury. (FIG.1C) This investigation was approved by the University of Pennsylvania Institutional Review Board (IRB#833107), with legally authorized representative consent.
FIGURE 1.

A. cardiac arrest patient plasma was collected at resuscitation (T0), 6 hrs post resuscitation (T6), neurological outcomes were evaluated at discharge, and re-evaluation of survived patient with poor outcome 6 months post discharge. B. miRNA biomarkers were analyzed using qPCR from neuronal EV isolated from patient plasma on exoTENPO, plasma protein biomarkers ’concentrations were measured with Simoa. C. numbers of patients in each cohort analyzed in this study. Definitions of outcome - good outcome: MRS<6 at discharge or evidence of improvement at follow-up; poor outcome: MRS>= 6 at discharge, no evidence of improvement at follow-up, or died before discharge.
Clinical outcome assessment
The two clinical outcomes included in this study were survival to hospital discharge and neurologic status at discharge. For neurological outcome prediction, we performed modified Rankin Scale (mRS) assessments before hospital discharge as well as within 6 months of discharge. Briefly, mRS represents a subjective scaled score from 0–6, where a greater score indicates worse neurologic status. For this study we dichotomized mRS scores as “good” outcomes (mRS 0–3, achieved within 6 months of discharge) and “poor” outcomes (mRS 4–6). For patients who survived to discharge with poor outcomes, we reviewed clinical records to assess for improvement within 6 months and considered the higher of the two mRS values in neurologic assessment.
Blood sampling
Blood samples were drawn within 2 hr of ROSC (0 h timepoint) and subsequently at 6 hr timepoints. Blood samples were obtained in two 6 mL EDTA tubes and processed within 4 hours of collection. The samples were first centrifuged for 10 min with a deceleration of 0 at 1600g. The plasma was then centrifuged twice more for 10 min with a deceleration of 0 at 3000g. For each sample, 3 aliquots containing 1.0 mL of plasma were frozen at −80°C within 6 hours of collection.
EV isolation and analysis
We applied a nanofluidic chip device referred as exoTENPO to isolate target subgroups of EVs from serum samples.10 The fundamental design of this device is 3 layers of track-etched membrane with pore diameter of 3 μm coated with nickel-iron material.18 When a magnetic field is applied, a gradient of magnetic field forms at each pore, with the strongest magnetic field present at the pore edges, where the magnetic particles passing through the pores are driven to and captured. The target EVs in each sample are immunoaffinity-linked to magnetic nanoparticles (50 nm, Miltenyi Biotec BV) and the serum samples are pulled through the membrane using a syringe pump (Braintree Scientific, Braintree, MA) as has been previously described. As biofluid sample flows through each membrane, sufficiently labeled magnetically-labeled target EVs, which highly express GluR2, are captured by the magnetic traps at the pores. Non-targeted EVs flow through the device into a waste output. The captured EVs are then lyesd on chip and their miRNA contents analyzed off-chip.
We used biotinylated GluR1/GluR2 antibody (Bioss Antibodies, Woburn, MA) as capture antibodies for neuron-derived EVs; this surface marker has been shown previously to enrich neuron-derived EVs (NDEs) from plasma.11–14 Antibody-labeled EVs were linked to anti-biotin ultrapure 50-nm-diameter nanoparticles (Miltenyi Biotec BV, Bergisch Gladbach, Germany) so that the target EVs are magnetically labelled. We diluted 0.3ml of plasma sample to 1ml in phosphate buffered saline (PBS) and 1 μl of biotinylated GluR1/GluR2 antibodies (1μg/μl) and incubated at room temperature for 20 min on a shaking mixer. Subsequently, we added 50 μl of anti-biotin magnetic nanoparticles per sample and mixed for another 20 min. Next, the samples were loaded into the reservoir of exoTENPO pre-blocked with 1% F-127 and washed with 1 ml PBS. Samples were driven through membranes at a flow rate of 1 ml/hr via a programmable syringe pump. For molecular analysis, EVs were lysed on-chip with 0.7 ml QIAzol lysis reagent (Qiagen, Hilden, Germany) after 2 min on-chip incubation. miRNA was then enriched and purified from this lysate with miRNeasy Serum/Plasma Advanced Kit (Qiagen).
Quantification of miRNA markers
EV-encapsulated miRNAs were analyzed via reverse transcription quantitative polymerase chain reaction (RT-qPCR) methods. We first constructed cDNA via reverse transcription from miRNA purified from exoTENPO lysate using miRCURY LNA RT Kit (Qiagen). The cDNA samples were subject to qPCR quantification of the candidate miRNAs using miRCURY LNA SYBR Green PCR Kit (Qiagen) and miRCURY LNA miRNA PCR Assay Primers (Qiagen). A cycle threshold (CT) value was obtained for each reaction to quantify the corresponding miRNA in the measured sample.
Circulating Protein Quantification with Simoa Assay and kit selection
To quantify circulating protein biomarkers, frozen plasma samples were thawed, centrifuged at 10000 g for 10 min at 4°C to remove large particles prior to aliquoting, and then analyzed using a standard protein immunoassay multiplex platform (Simoa, Quanterix). Assay kits were used to measure IL-10, TNF-alpha, glial fibrillary acidic protein (GFAP), neurofilament light chain (NFL), tau and Ubiquitin C-terminal hydrolase L1 (UCH-L1) with Neurology 4-Plex A Kit (Quanterix).
Data Analysis
In this study, all our analyses were conducted using Matlab R2022b (Natick, Massachusetts: The MathWorks Inc.). We generated Receiver Operating Characteristic (ROC) Curve for each biomarker by calculating the sensitivity and specificity for each possible threshold value for that biomarker, above which we call a positive and below which we call a negative. The Area Under the Curve (AUC) is the integral of the ROC curve, wherein an AUC = 1 corresponds to a perfect diagnostic and AUC = 0.5 corresponds to random guessing. This AUC score provides an aggregate measure of performance across all possible classification thresholds when no machine learning models were used and is a threshold invariant reflection of the classification value of the biomarker analyzed.
We calculated the correlation between all individual markers using Kendall’s correlation. Kendall’s correlation measures the similarity of the data ordering when ranked by each of the quantities, and in this way is a more general correlation coefficient which reveals monotonic relationship between two quantities. Quantity of miRNA was represented as 2^(Ct) in this procedure to calculate the correlation of absolute quantities of biomarker pairs. Lastly, we evaluated the overall correlation within each group of markers and between different groups of markers via averaging the absolute value of the correlations between individual markers from corresponding groups.
In this study, our small number of samples relative to the number of features that we measured would make it unlikely to obtain meaningful results with machine learning which were not obscured with overfitting and lack of statistical power.19, 20
RESULTS
Patients were enrolled between 7/3/2019 and 7/21/2022. 27 subjects met inclusion criteria, with a mean age of 63.9 (SD 11.8). Females comprised 48% of the study cohort. Initial rhythm was ventricular fibrillation/ventricular tachycardia in 24%, pulseless electrical activity in 30%, and asystole in 3%, with 6% unknown rhythms. 64% of patients survived to discharge, with a good neurologic outcome (mRS<4) at discharge in 12% and at 6 months in 30%. While etiology of arrest was unknown in a substantial portion of our patient cohort, no included patients had a neurologic cause of arrest (i.e., brain CT on all patients revealed no patients with intracranial hemorrhage or massive stroke).
We first confirmed candidate miRNA markers associated with post-arrest injury in comparison to myocardial infarction controls. Selected miRNA markers were measured and compared between plasma of 27 OHCA subjects at T0 and 8 ACS/MI control subjects. The markers were each evaluated using receiver operating characteristic (ROC) analysis, where we report the area under the curve (AUC), to distinguish OHCA patients who developed post-arrest neurologic injury from brain injury-free controls. Result indicated that overall, most EV miRNA markers and circulating protein biomarkers were indicated to be predictive when stratifying OHCA patients from ACS/MI controls. Specifically, circulating Tau, UCH-L1 and IL-10 were upregulated in OHCA patients’ plasma comparing to ACS/IM controls’, with Mann-Whitney U test p values lower than 0.05 (FIG.2 A) and AUCs greater than 0.75 (FIG.2 B). For NDE-encapsulated miRNA biomarkers, we showed that miR-122a-5p, miR-30a-5p, miR-126–5p, miR-223–5p and miR-374b-5p were upregulated in OHCA patients compared to ACS/IM controls with Mann-Whitney U test p values all lower than 0.01 (FIG.2 C), and AUCs greater than 0.75 (FIG.2 D). To reduce the likelihood of obtaining false positive results, we performed Benjamini Hochberg correction with a false discovery rate (FDR) of 0.1, and all the significant markers above remained significant.
FIGURE 2.
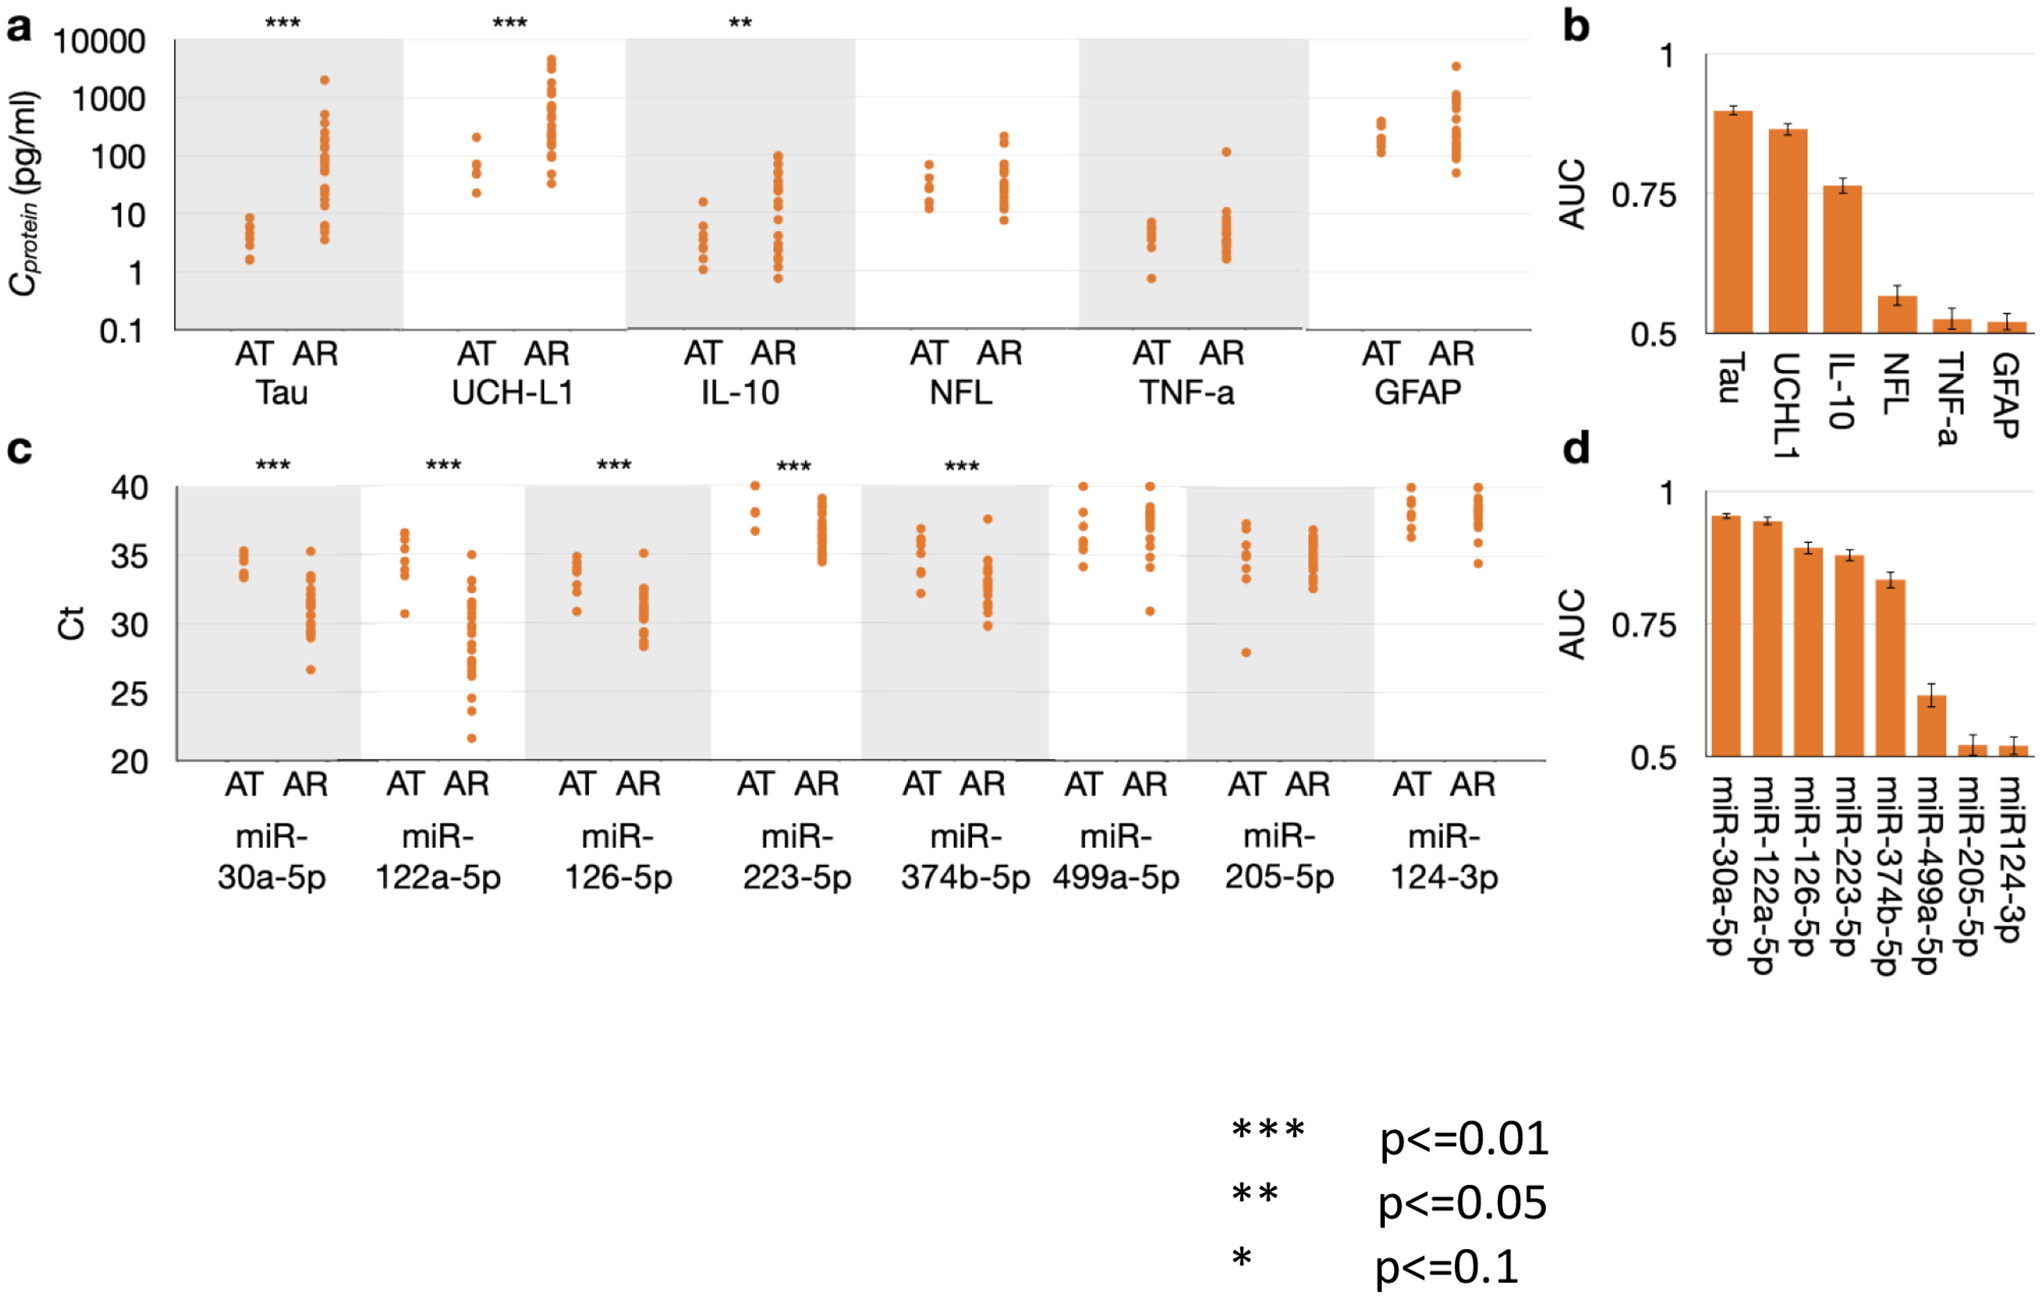
A. Distribution of protein biomarker concentrations between OHCA patient (AR) and ACS/MI controls (AT) B. AUC values for each protein biomarker. C. Distributions of Ct values of each miRNA biomarkers between OHCA patient (AR) and ACS/MI controls (AT) D. AUC values for each miRNA biomarker.
Association of EV miRNA markers with clinical outcomes
For distinguishing good neurological outcomes from poor outcomes, plasma samples were collected at T0 (at initial resuscitation), and T6 (6 hrs post resuscitation). We assessed 27 OHCA patients; 9 experienced good neurological outcome and 18 experienced poor outcome. Protein analysis indicated that several markers are predictive of neurological outcome: at T0, IL-10 was downregulated in plasma of patients with poor neurological outcome compared to plasma of patients with good outcomes with Mann Whitney p values below 0.05, while Tau and UCH-L1 were upregulated in the plasma of patients with poor outcome with Mann Whitney p values below 0.1 (FIG.3 A); at T6. The above-mentioned biomarkers were all capable of stratifying the two cohorts with AUC greater than 0.7 (FIG.3 B), with medium (>0.5) or large (>0.8) effect sizes (SUPPLEMENTAL TABLE 2).
FIGURE 3.
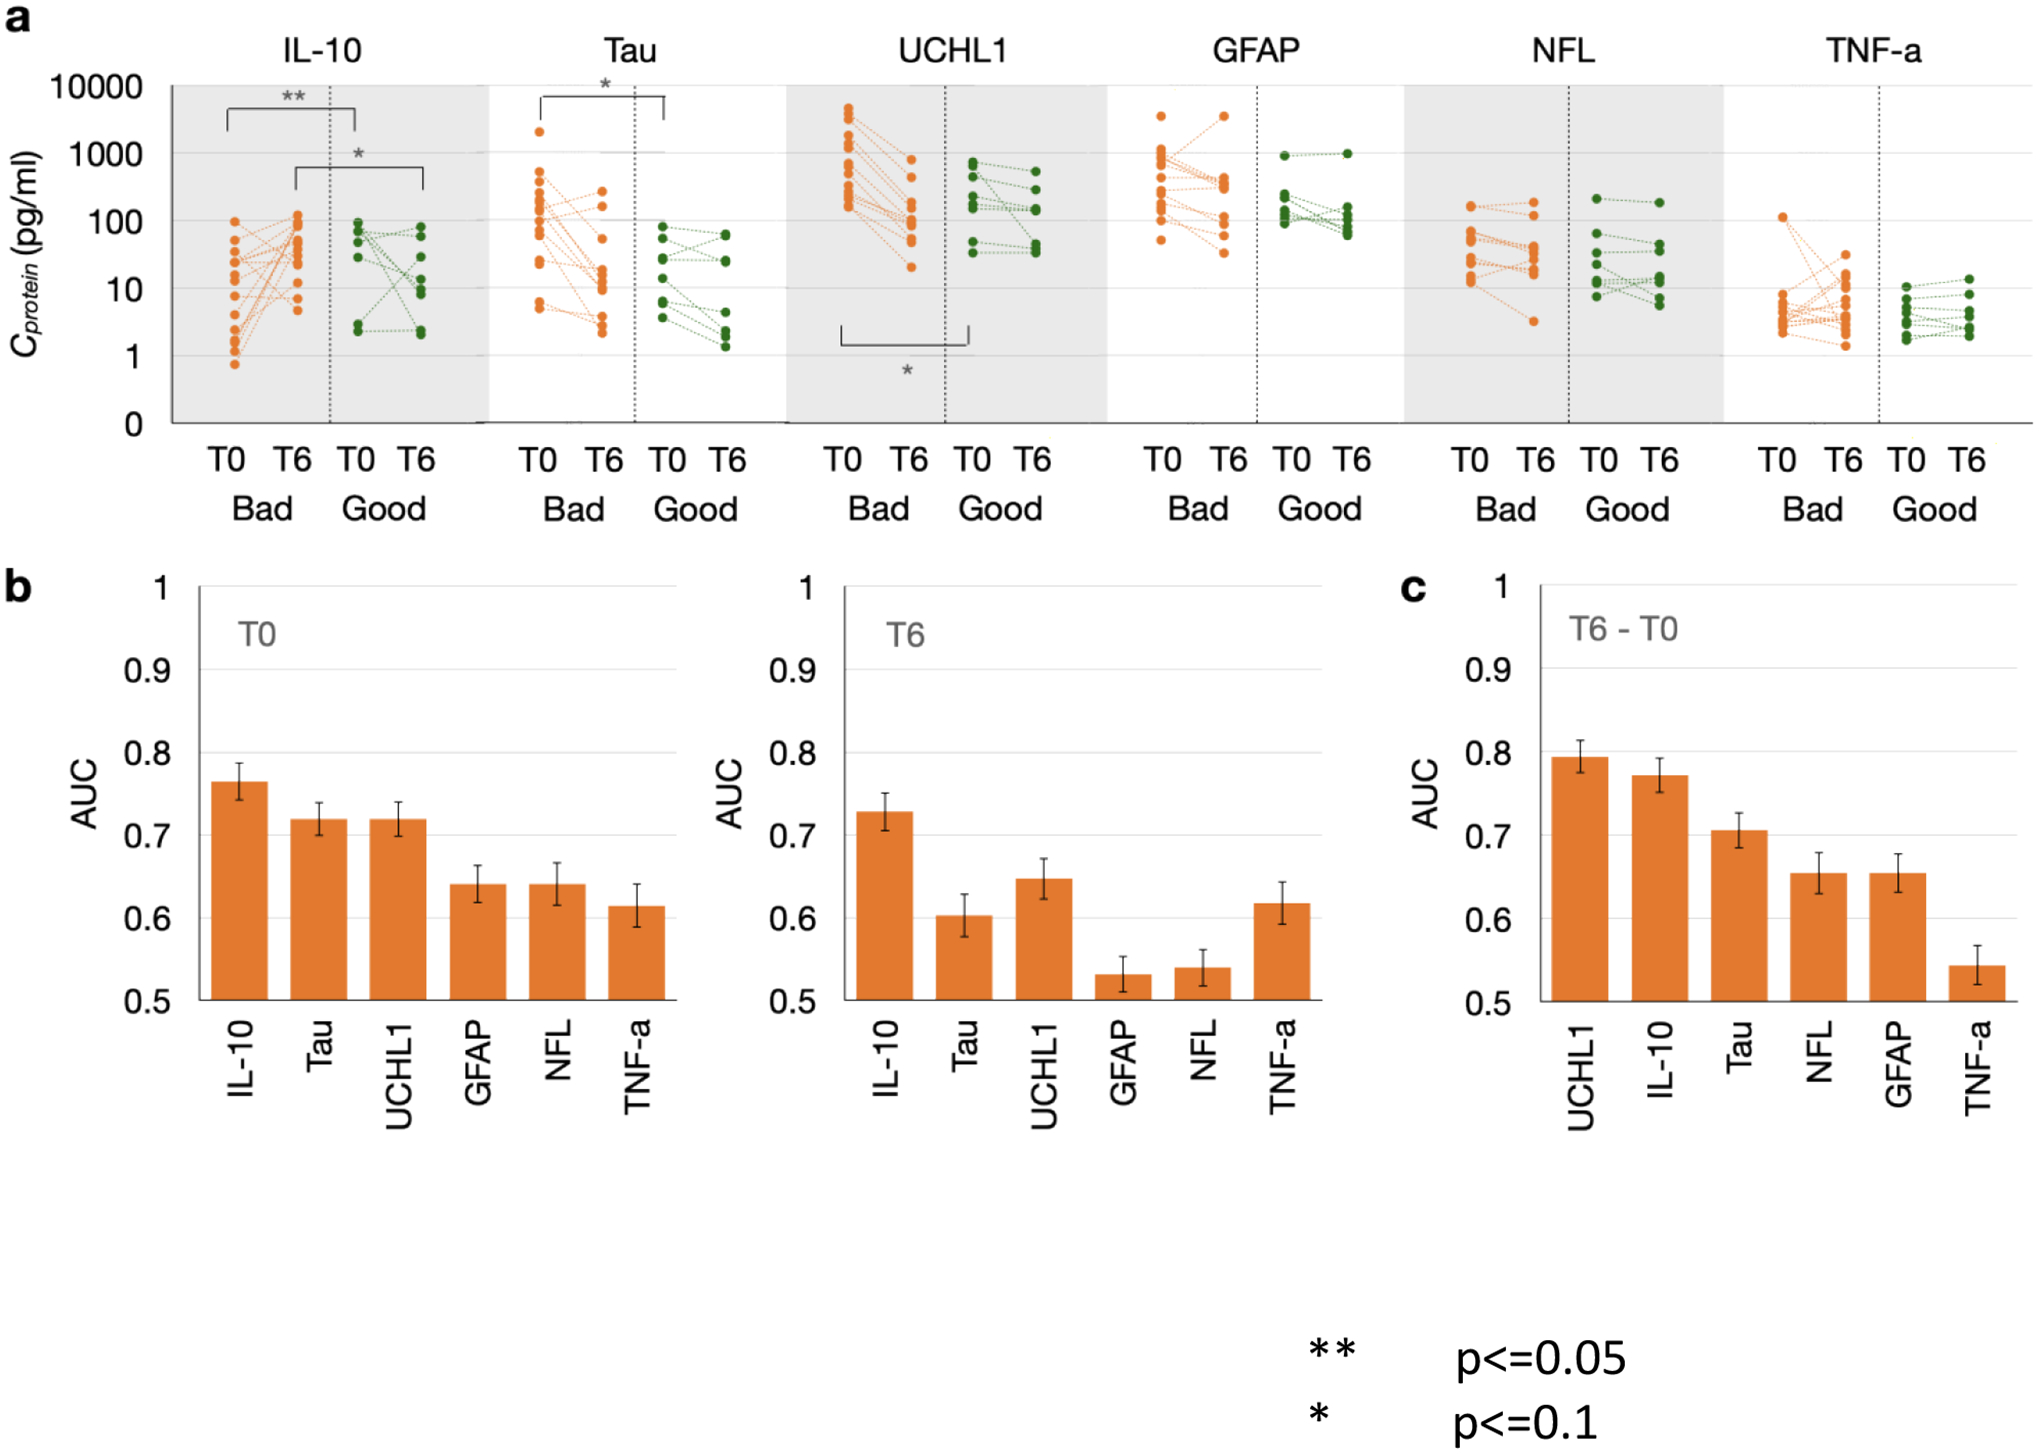
A. Distribution of miRNA biomarker CT values between good outcomes and poor outcomes at both T0 and T6 B. AUC values for each miRNA biomarker at T0 and T6. C. AUC values for each miRNA biomarker’s difference between T0 and T6
We subtracted T6 level of each protein marker with T0 level from the same patient, and performed the same analysis as above using the difference between the two longitudinal measures. This analysis indicated that two markers UCHL-1 and IL-10 were predictive when partitioning good outcome from poor outcome, with AUC greater than 0.75. (FIG.3C) and medium (>0.5) effect sizes (SUPPLEMENTAL TABLE 2).
We repeated the analysis described above on the same cohorts using our 9 neuron EV miRNA markers. NDE-encapsulated miR-124 was upregulated in poor outcome subjects compared to good outcome ones at both T0 and T6 with Mann Whitney p values (p<0.05 for each), and miR-499a was upregulated in poor outcomes samples at T0 with a Mann Whitney p value below 0.1 (FIG.4A). miR-124 and miR-499a at T0 both had AUCs greater than 0.7 when stratifying the two cohorts while miR-124 at T6 achieved an AUC of 0.84 (FIG.4B). All these statistically significant markers exhibited medium (>0.5) or large (>0.8) effect sizes (SUPPLEMENTAL TABLE 2). We then considered the difference between the T6 and T0 longitudinal measures for the NDE-encapsulated miRNA markers. No marker was sufficiently predictive with AUC>0.7 or Mann Whitney p value <0.05. (FIG.4C)
FIGURE 4.

A. Distribution of each protein biomarker’s concentrations between good outcomes and poor outcomes at both T0 and T6 B. AUC values for each protein biomarker at T0 and T6. C. AUC values for each protein biomarker’s difference between T0 and T6.
We also performed Benjamini Hochberg corrections on these significant markers when comparing patients with good outcomes and those with bad outcomes. With an FDR of 0.1, only miR-124 at T6 remained significant after the correction. Due to the exploratory nature of this study, we also chose a higher FDR of 0.2 to identify more potential leads or hypotheses for further research, which results in three additional significant markers IL-10 at T6, T6-T0 difference of IL-10 and T6-T0 difference of UCH-L1 after correction.
Correlation between selected markers
We calculated the correlation between all individual markers from our quantification. As we could not make assumptions of normal distribution of any measured markers or linear correlation between any pair of selected biomarkers, the correlation value was calculated with Kendall ranked correlation.
There was only very weak correlations between different individual markers (FIG.5 A,C) and between panels (FIG.5 B,D) at both T0 and T6, which indicated that these different panels of markers provide orthogonal information for OHCA prognosis.
FIGURE 5.

A. heatmap showing the correlations between each pair of individual biomarkers at T0. B. averaged correlations of markers within the same or different marker panels at T0. C. heatmap showing the correlations between each pair of individual biomarkers at T6 D. averaged correlations of markers within the same or different marker panels at T6.
DISCUSSION
In this OHCA clinical cohort study performed at two hospitals, we have demonstrated that miRNA species measured from brain-derived EVs are associated with cardiac arrest brain injury and clinical outcomes. This work extends on prior work that has shown the potential for EVs as an early biomarker for brain injury after trauma.12,14 We included currently available serum protein biomarkers in this work, assessed in parallel to EV markers, with the goal of eventual rigorous comparison to ask the question of whether EV assessment will be an improvement over current markers such as NSE. This represents the first study on EVs as potential novel biomarkers in the early phase of post-arrest injury.
There has been great interest in serologic biomarkers as potential tools for post-arrest prognostication, as the clinical examination remains challenging for several days following cardiac arrest and neuroprognostication remains highly variable in practice.21,22 Prior investigations have largely focused on protein markers of cellular injury, such as neuron specific enolase, glial fibrillary acid protein, tau protein, and neurofilament light chain, among other markers.23–25 Taken together, these investigations have shown the potential for such markers to be statistically associated with outcomes, yet they each have been found to have limitations in positive predictive value for poor outcomes, a key criterion for clinical utility. In addition, these markers are summative in nature, reflective of total volume of cellular injury rather than specific cell or tissue type. Finally, marker studies have suggested optimal predictive value at 24 hours or later; for example, a multicenter study of serologic neurofilament light chain suggested the highest specificity at 24 hours. A marker that might predict outcome earlier (6 or 12 hours, for example) would be valuable in tailoring patient care and informing family discussions. However, because of the wide variety of injury types and severities endemic to the post-arrest state, and the unique and dynamically changing combination of multiple endophenotypes of an injured and recovering brain—including axonal shearing, inflammation, glial cell damage, brain edema, and vascular injury—it has remained challenging to adequately map any biomarker or sets of biomarkers to an individual’s unique state of injury and recovery to improve clinical outcomes. Our assay in future may be able to provide prompt prediction of neurological outcomes (within 6 hours post OHCA); the current proof-of-concept work has demonstrated biomarker to outcome association in samples harvested at time of hospitalization (T0).
Markers that contain additional information regarding specific neurologic cell types of injury or regional information might serve to provide a “liquid biopsy” during post-arrest care, providing clinicians with specific information about the phenotype of injury. EVs, lipid vesicles which contain RNA species and cell-surface receptors that reflect cell type of origin, may represent such an approach. EVs originate from brain cells and contain proteins and nucleic acids from their parent cells. Remarkably, they have the ability to cross the blood-brain barrier (BBB) and preserve encapsulated miRNAs and proteins. GluR2 is known to be enriched in brain-derived EVs, making GluR2+ EVs an ideal target for analysis of brain injury over circulating protein markers. Detecting protein biomarkers in cerebrospinal fluid (CSF) or blood faces difficulties due to their low concentrations (often in the femtomolar to picomolar range), vulnerability to proteolytic degradation, elimination by the liver or kidney, and binding to carrier proteins.14,26 However, EVs offer a promising alternative. Similar to protein markers, EVs possess the ability to traverse the blood-brain barrier (BBB).14,27 Moreover, they have distinct advantages: EVs are derived from many types of tissues including brain tissue and contain proteins and nucleic acids from their originating cells,14,28 allowing further enrichment of tissue-specific information through immunoaffinity-based assays. Additionally, EVs safeguard encapsulated miRNAs and proteins against degradation.29 These characteristics render GluR2+ EVs an superior target for assessing brain injuries compared to circulating protein markers. Other work has suggested the value of serologic EVs in a number of disease states, including pancreatic cancer,10,23 traumatic brain injury,14 and sepsis.24 Technologic innovations have created methods to assess EVs that are clinically feasible in real-time, such as the microfluidics methods described in our work and previous studies from our team.25 Additional studies will be required on larger patient cohorts, in conjunction with MRI and EEG data, to explore both the early phase utility of this EV-based strategy, and to assess the correlation of EV data and structural injuries suggested by these separate testing modalities.
It is probable that no single approach to neuroprognostication will be sufficient during the complex pathophysiology of post-arrest reperfusion syndrome. Instead, multimodal approaches will likely be required, including multiple serologic markers, initial brain CT imaging and early EEG assessment. Studies have suggested that grey-white matter ratio (GWR) on initial head CT imaging, often performed in the first 6 hours post-arrest, is associated with outcome, which with limited positive predictive value.30,31 Whether such data could be combined with early biomarker information, in either a scoring system or other algorithmic approach, remains to be determined.
A key attraction of serologic markers resides in their practical simplicity. While a number of investigations have suggested the value of continuous EEG to aid in neuroprognostication, many hospitals do not have continuous EEG as an available modality or struggle to establish such monitoring on a consistent basis during early phases of care.32 In similar fashion, MRI imaging yields important information on neuroprognostication when performed between days 3 and 7 post-arrest,33,34 but is limited by practical considerations of performing MRI on intubated, sedated, critically ill patients. An early marker might allow clinicians to decide if and whether subsequent testing is required, allowing for more appropriate care planning for the days following initial resuscitation. In addition, an early marker might be useful to tailor post-arrest targeted temperature management (TTM) in future trials to assess TTM dosing, an area of considerable current debate. Recent work has suggested that patients with more substantial post-arrest injury might benefit from deeper (33°C) TTM temperature goals, while patients with lesser injuries might have better outcomes if managed with less aggressive (36°C) temperature targets.4 This notion of tailored care has not yet been tested in prospective trials, in part due to the lack of validated early markers to assess degree of brain injury. If such trials demonstrated some value of tailored care, improved characterization of the degree of neurologic injury, and the neurologic tissue types experiencing injury, may in turn serve to guide any patient-specific tailoring of post-arrest care modalities. This might include, for example, decisions regarding whether to employ TTM (at either 33°C or 36°C) versus therapeutic normothermia.
With EV miRNAs and circulating proteins providing orthogonal information for OHCA prognosis, given a greater sample size, we can potentially construct a machine learning algorithm with different markers from all these panels that can outperform any individual markers or single modality data from either EV miRNAs or circulating proteins. To support this assertion, we employed Lasso feature selection on our data with limited sample size. By scanning Lasso’s hyperparameter, we identified sets of up to 6 biomarkers at both T0 and T6. Notably, these panels comprised both protein and EV miRNA biomarkers. (SUPPLEMENTAL FIGURE 2.)
Our study has important limitations. As a pilot study conducted at two hospitals, sample size was limited and therefore more granular analysis of the association of EVs with neurologic outcomes is challenging. We also evaluated several miRNA species and their association with outcomes, which in a small sample size increases the risk of statistically spurious association. Finally, we only assessed EVs isolated via surface marker GluR1/GluR1 surface receptors, such that only neuron-derived EVs were assessed. At present, our assay does not provide the means to evaluate the association between EV-miRNA and specific brain regions affected by injury. However, an intriguing future step would involve incorporating biomarkers exclusive to cells in particular brain regions or modifying our assay to introduce an additional layers of specificity, such as magnitude or the presence or absence of additional biomarkers. These advancements could enable us to investigate the impact of EV-miRNA in the context of specific region brain injuries, and in that sense would represent a form of “liquid biopsy” for brain injury phenotypes. Multicenter enrollment for future work will test our EV assessment model in a more extensive array of OHCA patients and associated physiologic injuries. Interpretation of our findings should be somewhat attenuated by relatively low AUC values (>0.75 but not >0.9), which still has informative value but is not yet at the level expected for clinical testing standards.38–41 In similar fashion, while significant differences were noted in select biomarkers regarding patient outcomes, we did not characterize the magnitude of these via effect size analysis; this will be more meaningfully conducted in subsequent larger cohorts.
In conclusion, our work has demonstrated proof of concept for the use of early-phase serologic assessment of post-arrest brain injury via miRNA characterization from isolated EVs. We have shown an association between EV markers and both survival and neurologic outcomes. Future work will assess this approach in a larger cohort combined with EEG and MRI data to develop a more comprehensive approach to early assessment following resuscitation from cardiac arrest.
Supplementary Material
ACKNOWLEDGEMENTS
We wish to thank the nursing staff at the Hospital of the University of Pennsylvania and the Penn Presbyterian Medical Center for their assistance with patient sample collections. We also wish to thank the members of the Penn Acute Research Collaboration for support during the project efforts.
Financial Support:
This work was supported by the National Institute of Neurological Disorders and Stroke (R21NS109763) to BSA, and by the National Cancer Institute (R21CA236653) to DAI, the Department of Defense (W81XWH1920002) to DAI, and the National Human Genome Research Institute (RM1 HG010023) to DAI.
Footnotes
Publisher's Disclaimer: This is a PDF file of an unedited manuscript that has been accepted for publication. As a service to our customers we are providing this early version of the manuscript. The manuscript will undergo copyediting, typesetting, and review of the resulting proof before it is published in its final form. Please note that during the production process errors may be discovered which could affect the content, and all legal disclaimers that apply to the journal pertain.
DECLARATION OF INTERESTS
David Issadore is a founder and holds equity in Chip Diagnostics. Dr. Abella has received research funding from the NIH, DOD, Becton Dickinson and Neuroptics. He has received consulting honoraria from Becton Dickinson, Neuroptics, Stryker and Zoll. Dr. Abella also serves on the editoral board of Resuscitation.
AUTHOR CONTRIBUTIONS
Hanfei Shen: conceptualization, methodology, software, writing-original draft preparation, writing-reviewing and editing, data curation; Daria Zaitseva: data curation, writing – reviewing and editing; Zijian Yang: methodology, software; Liam Forsythe: data curation, writing – reviewing and editing; Sarah Joergensen: data curation, writing – reviewing and editing; Alea Zone: data curation, writing – reviewing and editing; Joana Shehu- data curation, writing – reviewing and editing; Sarah Maghraoui: data curation, writing – reviewing and editing; Anahita Ghorbani: data curation, writing – reviewing and editing; Antonio Davila: data curation, methodology; David Issadore: conceptualization, methodology, sofware, data curation, supervision; Benjamin Abella: conceptualization, methodology, sofware, data curation, supervision.
REFERENCES
- 1.Ryczek R, Kwasiborski PJ, Rzeszotarska A, et al. Neuron-Specific Enolase and S100B: The Earliest Predictors of Poor Outcome in Cardiac Arrest. J Clin Med. 2022;11:2344. [DOI] [PMC free article] [PubMed] [Google Scholar]
- 2.Blennow Nordström E, Lilja G, Ullén S, et al. Serum neurofilament light levels are correlated to long-term neurocognitive outcome measures after cardiac arrest. Brain Inj. 2022;36:800–809. [DOI] [PubMed] [Google Scholar]
- 3.Calabrese E, Gandhi S, Shih J, et al. Parieto-Occipital Injury on Diffusion MRI Correlates with Poor Neurologic Outcome following Cardiac Arrest. AJNR Am J Neuroradiol. 2023;44:254–260. [DOI] [PMC free article] [PubMed] [Google Scholar]
- 4.Callaway CW, Coppler PJ, Faro J, et al. Association of Initial Illness Severity and Outcomes After Cardiac Arrest With Targeted Temperature Management at 36°C or 33°C. JAMA Netw Open. 2020;3:e208215. [DOI] [PMC free article] [PubMed] [Google Scholar]
- 5.Nishikimi M, Ogura T, Nishida K, et al. Outcome Related to Level of Targeted Temperature Management in Postcardiac Arrest Syndrome of Low, Moderate, and High Severities: A Nationwide Multicenter Prospective Registry. Crit Care Med. 2021;49:e741–e750. [DOI] [PubMed] [Google Scholar]
- 6.Nutma S, Tjepkema-Cloostermans MC, Ruijter BJ, et al. Effects of targeted temperature management at 33°C vs. 36°C on comatose patients after cardiac arrest stratified by the severity of encephalopathy. Resuscitation. 2022;173:147–153. [DOI] [PubMed] [Google Scholar]
- 7.Skrifvars MB, Bray J, Hassager C. Optimal oxygen and mean arterial blood pressure targets after cardiac arrest. Intensive Care Med. 2023; 21:1–3. [DOI] [PMC free article] [PubMed] [Google Scholar]
- 8.Liu YJ, Wang C. A review of the regulatory mechanisms of extracellular vesicles-mediated intercellular communication. Cell Commun Signal. 2023;21:77. [DOI] [PMC free article] [PubMed] [Google Scholar]
- 9.Ren Y, Zhang H. Emerging role of exosomes in vascular diseases. Front Cardiovasc Med. 2023;10:1090909. [DOI] [PMC free article] [PubMed] [Google Scholar]
- 10.Ko J, Bhagwat N, Yee SS, et al. Combining Machine Learning and Nanofluidic Technology To Diagnose Pancreatic Cancer Using Exosomes. ACS Nano 2017;11:11182–11193. [DOI] [PubMed] [Google Scholar]
- 11.Beard K, Yang Z, Haber M, et al. Extracellular vesicles as distinct biomarker reservoirs for mild traumatic brain injury diagnosis. Brain Commun 2021;3:fcab151. [DOI] [PMC free article] [PubMed] [Google Scholar]
- 12.Ko J, Hemphill M, Yang Z, et al. Multi-Dimensional Mapping of Brain-Derived Extracellular Vesicle MicroRNA Biomarker for Traumatic Brain Injury Diagnostics. J Neurotrauma 2020;37:2424–34. [DOI] [PMC free article] [PubMed] [Google Scholar]
- 13.Muraoka S, DeLeo AM, Sethi MK, et al. Proteomic and biological profiling of extracellular vesicles from Alzheimer’s disease human brain tissues. Alzheimers Dement 2020;16:896–907. [DOI] [PMC free article] [PubMed] [Google Scholar]
- 14.Ko J, Hemphill M, Yang Z, et al. Diagnosis of traumatic brain injury using miRNA signatures in nanomagnetically isolated brain-derived extracellular vesicles. Lab Chip 2018;18:3617–30. [DOI] [PMC free article] [PubMed] [Google Scholar]
- 15.Adrie C, Laurent I, Monchi M, et al. Postresuscitation disease after cardiac arrest: a sepsis-like syndrome? Curr Opin Crit Care 2004;10:208–12. [DOI] [PubMed] [Google Scholar]
- 16.Patel JK, Sinha N, Hou W, et al. Association of post-resuscitation inflammatory response with favorable neurologic outcomes in adults with in-hospital cardiac arrest. Resuscitation 2021;159:54–59. [DOI] [PubMed] [Google Scholar]
- 17.Amoo M, Henry J, O’Halloran PJ, et al. S100B, GFAP, UCH-L1 and NSE as predictors of abnormalities on CT imaging following mild traumatic brain injury: a systematic review and meta-analysis of diagnostic test accuracy. Neurosurg Rev 2022;45:1171–1193. [DOI] [PubMed] [Google Scholar]
- 18.Andrew L, Hanfei S, Griffin S et al. Parallelized immunomagnetic nanopore sorting: modeling, scaling, and optimization of surface marker specific isolation of extracellular vesicles from complex media, 16 May 2023, PREPRINT (Version 1) available at Research Square [ 10.21203/rs.3.rs-2913647/v1] [DOI] [PMC free article] [PubMed]
- 19.Shen Hanfei, et al. “A web-based automated machine learning platform to analyze liquid biopsy data.” Lab on a Chip 20.12 (2020): 2166–2174. [DOI] [PubMed] [Google Scholar]
- 20.Lin Andrew A., et al. “Extracellular vesicle–based multianalyte liquid biopsy as a diagnostic for cancer.” Annual Review of Biomedical Data Science 5 (2022): 269–292. [DOI] [PubMed] [Google Scholar]
- 21.Benghanem S, Pruvost-Robieux E, Bouchereau E, et al. Prognostication after cardiac arrest: how EEG and evoked potentials may improve the challenge. Ann Intensive Care 2022;12:111. [DOI] [PMC free article] [PubMed] [Google Scholar]
- 22.Grossestreuer AV, Abella BS, Leary M, et al. Time to awakening and neurologic outcome in therapeutic hypothermia-treated cardiac arrest patients. Resuscitation 2013;84:1741–6. [DOI] [PubMed] [Google Scholar]
- 23.Stammet P Blood biomarkers of hypoxic-ischemic brain injury after cardiac arrest. Semin Neurol 2017;37:75–80. [DOI] [PubMed] [Google Scholar]
- 24.Oddo M, Rossetti AO. Predicting neurological outcome after cardiac arrest. Curr Opin Crit Care 2011;17:254–9. [DOI] [PubMed] [Google Scholar]
- 25.Snyder-Ramos SA, Böttiger BW. Molecular markers of brain damage--clinical and ethical implications with particular focus on cardiac arrest. Restor Neurol Neurosci. 2003;21:123–39. [PubMed] [Google Scholar]
- 26.Zetterberg Henrik, Smith Douglas H, and Blennow Kaj. “Biomarkers of Mild Traumatic Brain Injury in Cerebrospinal Fluid and Blood.” Nature reviews. 9.4 (2013): 201–210. [DOI] [PMC free article] [PubMed] [Google Scholar]
- 27.Alvarez-Erviti L, et al. Delivery of siRNA to the mouse brain by systemic injection of targeted exosomes. Nat Biotechnol. 2011;29(4):341–345. doi: 10.1038/nbt.1807 [DOI] [PubMed] [Google Scholar]
- 28.Yáñez-Mó M, et al. Biological properties of extracellular vesicles and their physiological functions. J Extracell Vesicles. 2015;4:27066. doi: 10.3402/jev.v4.27066 [DOI] [PMC free article] [PubMed] [Google Scholar]
- 29.Mateescu B, et al. Obstacles and opportunities in the functional analysis of extracellular vesicle RNA – an ISEV position paper. J Extracell Vesicles. 2017;6(1):1286095. doi: 10.1080/20013078.2017.1286095 [DOI] [PMC free article] [PubMed] [Google Scholar]
- 30.Yang Z, LaRiviere MJ, Ko J, et al. A Multianalyte Panel Consisting of Extracellular Vesicle miRNAs and mRNAs, cfDNA, and CA19–9 Shows Utility for Diagnosis and Staging of Pancreatic Ductal Adenocarcinoma. Clin Cancer Res 2020;26:3248–58. [DOI] [PMC free article] [PubMed] [Google Scholar]
- 31.Schiavello M, Vizio B, Bosco O, et al. Extracellular Vesicles: New players in the mechanisms of sepsis- and COVID-19-Related thromboinflammation. Int J Mol Sci 2023;24:1920. [DOI] [PMC free article] [PubMed] [Google Scholar]
- 32.Iyer V, Yang Z, Ko J, et al. Advancing microfluidic diagnostic chips into clinical use: a review of current challenges and opportunities. Lab Chip 2022;22:3110–3121. [DOI] [PMC free article] [PubMed] [Google Scholar]
- 33.Kenda M, Cheng Z, Guettler C, et al. Inter-rater agreement between humans and computer in quantitative assessment of computed tomography after cardiac arrest. Front Neurol 2022;13:990208. [DOI] [PMC free article] [PubMed] [Google Scholar]
- 34.Wang GN, Zhang ZM, Chen W, et al. Timing of brain computed tomography for predicting neurological prognosis in comatose cardiac arrest survivors: a retrospective observational study. World J Emerg Med 2022;13:349–354. [DOI] [PMC free article] [PubMed] [Google Scholar]
- 35.Elmer J, Steinberg A, Callaway CW. Paucity of neuroprognostic testing after cardiac arrest in the United States. Resuscitation 2023:109762. [DOI] [PMC free article] [PubMed] [Google Scholar]
- 36.Park JY, Kim YH, Ahn SJ, et al. Association between the extent of diffusion restriction on brain diffusion-weighted imaging and neurological outcomes after an out-of-hospital cardiac arrest. Resuscitation 2023:109761. [DOI] [PubMed] [Google Scholar]
- 37.Keijzer HM, Verhulst MMLH, Meijer FJA, et al. Prognosis after cardiac arrest: the additional value of DWI and FLAIR to EEG. Neurocrit Care 2022;37:302–13. [DOI] [PubMed] [Google Scholar]
- 38.Bossuyt PM, et al. Towards complete and accurate reporting of studies of diagnostic accuracy: the STARD initiative. Clinical Chemistry and Laboratory Medicine. 2003;41(1):68–73. [DOI] [PubMed] [Google Scholar]
- 39.Zweig MH, Campbell G. Receiver-operating characteristic (ROC) plots: a fundamental evaluation tool in clinical medicine. Clinical Chemistry. 1993;39(4):561–577. [PubMed] [Google Scholar]
- 40.Hanley JA, McNeil BJ. The meaning and use of the area under a receiver operating characteristic (ROC) curve. Radiology. 1982;143(1):29–36. [DOI] [PubMed] [Google Scholar]
- 41.Hajian-Tilaki K. Receiver Operating Characteristic (ROC) Curve Analysis for Medical Diagnostic Test Evaluation. Caspian Journal of Internal Medicine. 2013;4(2):627–635. [PMC free article] [PubMed] [Google Scholar]
Associated Data
This section collects any data citations, data availability statements, or supplementary materials included in this article.