

SUMMARY
The parafascicular (Pf) nucleus of the thalamus has been implicated in arousal and attention, but its contributions to behavior remain poorly characterized. Here, using in vivo and in vitro electrophysiology, optogenetics, and 3D motion capture, we studied the role of Pf in behavior using a continuous reward tracking task in freely moving mice. We found that many Pf neurons precisely represent vector components of velocity, with a strong preference for ipsiversive movements. Their activity usually leads velocity, suggesting that Pf output is critical for self-initiated orienting behavior. To test this hypothesis, we expressed excitatory or inhibitory opsins in VGlut2+ Pf neurons to manipulate neural activity bidirectionally. We found that selective optogenetic stimulation of these neurons consistently produced ipsiversive head turning, whereas inhibition stopped turning and produced downward movements. Taken together, our results suggest that the Pf can send continuous top-down commands that specify detailed action parameters (e.g., direction and speed of the head), thus providing guidance for orienting and steering during behavior.
Keywords: Parafascicular nucleus, thalamus, action, steering, attention, kinematics, reward, tracking, arousal
eTOC blurb
Fallon et al., use electrophysiology, optogenetics, and 3D motion capture, to elucidate the role of parafasicular thalamic neurons in orienting behavior during continuous reward tracking.
Introduction
The parafascicular (Pf) nucleus is an intralaminar thalamic nucleus that sends glutamatergic projections to the basal ganglia, a set of subcortical nuclei implicated in the initiation and execution of actions1,2. Traditionally considered a thalamic component of the reticular activating system, the Pf receives afferent inputs from both neuromodulatory brainstem circuits as well as sensory pathways3.
Studies have implicated the Pf in arousal and attention4–6. In primates, many Pf neurons respond with short latency to salient stimuli in multiple modalities, especially when they are unexpected. More recent work also showed that the Pf plays a role in action initiation. In mice, many Pf neurons increase activity at the time of action initiation in an operant lever pressing task, and inhibition of these neurons could delay action initiation7. While the Pf is not required for instrumental learning (e.g. lever pressing for reward), it is critical for the regulation of behavioral flexibility, to adapt to changes in action-outcome contingencies8,9. Moreover, activation of Pf projections to the STN can restore movement during dopamine depletion10. These results suggest the Pf plays a key role in action generation, but its contribution remains poorly understood.
A limitation of previous work on the Pf is the lack of precise quantification of continuous behavioral measures with high temporal and spatial resolution. To examine the relationship between Pf activity and continuous behavioral variables, in this study, we trained mice on a continuous reward tracking task while simultaneously recording behavior using 3D motion capture and single unit neural activity from the Pf 11,12. We found distinct populations of Pf projection neurons that represent vector components of velocity with high precision. The most common type of Pf neurons represented ipsiversive velocity. Furthermore, optogenetic excitation of Pf neurons also produced ipsiversive turning of the head followed by the body, and optogenetic inhibition paused turning. These results reveal that the Pf is critical for orienting the head towards salient stimuli, and quantitatively determines the parameters of turning behavior.
Results
To understand the relationship between Pf neural activity and continuously generated behavior, we first used wireless electrophysiological recording to monitor neural activity while tracking behavior with a three-dimensional (3D) motion capture system12,13. Water-deprived mice with chronically implanted electrode arrays in the Pf were trained to track a reward spout (target) from left to right (~30 mm) to receive a sucrose reward (Figures 1A and 1B). Horizontal movements of the spout were chosen because previous work has shown Pf activity is related to turning behavior10 and also modulated during transition from a reward-port to a lever on an operant lever press task 7. One infrared marker was placed on the target and two infrared markers were placed on each side of a bar affixed to the head (Figure 1B). Using six infrared cameras that were placed around the testing arena, kinematic variables such as position, velocity and acceleration could be obtained from the infrared markers with high temporal and spatial resolution (100 Hz, Figures 1C–D).
Figure 1. In vivo electrophysiological recordings in the Pf during a reward tracking task.

(A) Left: Chronically implanted 16-channel electrode arrays were inserted into the right Pf of wild type mice. Right: Coronal sections through the thalamus and placement of electrode array into the Pf. Black arrows denote electrode tips. B) Schematic of reward tracking experimental design. Reflective markers were placed on the head (c and i) of water-deprived freely behaving mice and the reward spout (s) to track movements in relation to a 10% sucrose reward during wireless recordings of Pf neural activity. The right panel illustrates simultaneous neural recordings during acquisition of movement kinematic information from reflective markers in Cartesian space while mice tracked a reward lever. C) As mice followed the reward spout (target) left and right, they received rewards only when their head was close s to the target. Mice spent an average of 75% of their time following the target. D) The target moved along the horizontal axis with a full cycle taking approximately 5 seconds (top). See also Video S1.
The target is a sucrose spout that moves continuously along the horizontal axis. Mice had to follow it closely to earn the reward. When the mice entered a region close to the target (X axis: 30 mm, Y axis: 20 mm, Z axis: 30 mm), a 10% sucrose solution was delivered every 700 ms. After 3–4 days of training, mice learned to follow the target closely for approximately 75% of the recording session. This task allowed recordings of neural activity during continuous, self-initiated behaviors while the mice tracked a moving target.
We first recorded in vivo single-unit activity (n = 111) in the Pf of Wild-Type (WT) mice (n = 7, 5 males and 2 females, 10–13 weeks old) and compared their activity on the continuous tracking task with motion capture data. We found three distinct populations of neurons that represent different vector components of velocity. Thxe first population is by far the most common (n = 38, 34%), and accurately represented ipsiversive velocity: these neurons increased firing when the mouse moves towards the side where the neurons are recorded and decreased their firing when moving the contraversive direction. They showed an extremely high correlation (population r2 = 0.99) with ipsiversive velocity (Figure 2A–F, 5E). The second population, which is less common (n = 9, 8%) (Figure 3A–F, 5E) represented contraversive velocity, increasing firing when moving in the contraversive direction and decreased firing when moving in the ipsiversive direction (population r2 = 0.97, Figure 3A–F, 5E). The third population (n = 12, 11%) represented forward velocity, increasing firing rate when moving forward and decreasing firing rate when moving backwards (population r2 = 0.98) with forward velocity (Figure 4A–F). The relationship between velocity and firing rate could be detected even when the mouse was not actively tracking the spout, though correlation was much stronger during tracking (Figure S1). The predictability of the spout movement did not seem to affect Pf activity, as single unit activity immediately started to represent velocity when the spout suddenly started moving (Figure S2). Although mice frequently receive sucrose rewards, the activity of the Pf neurons is not related to reward delivery. We quantified reward rate by measuring the number of sucrose deliveries per second. None of the neuronal populations showed activity that is significantly correlated with reward rate (Figure S3).
Figure 2. A population of Pf neurons represent ipsiversive velocity.
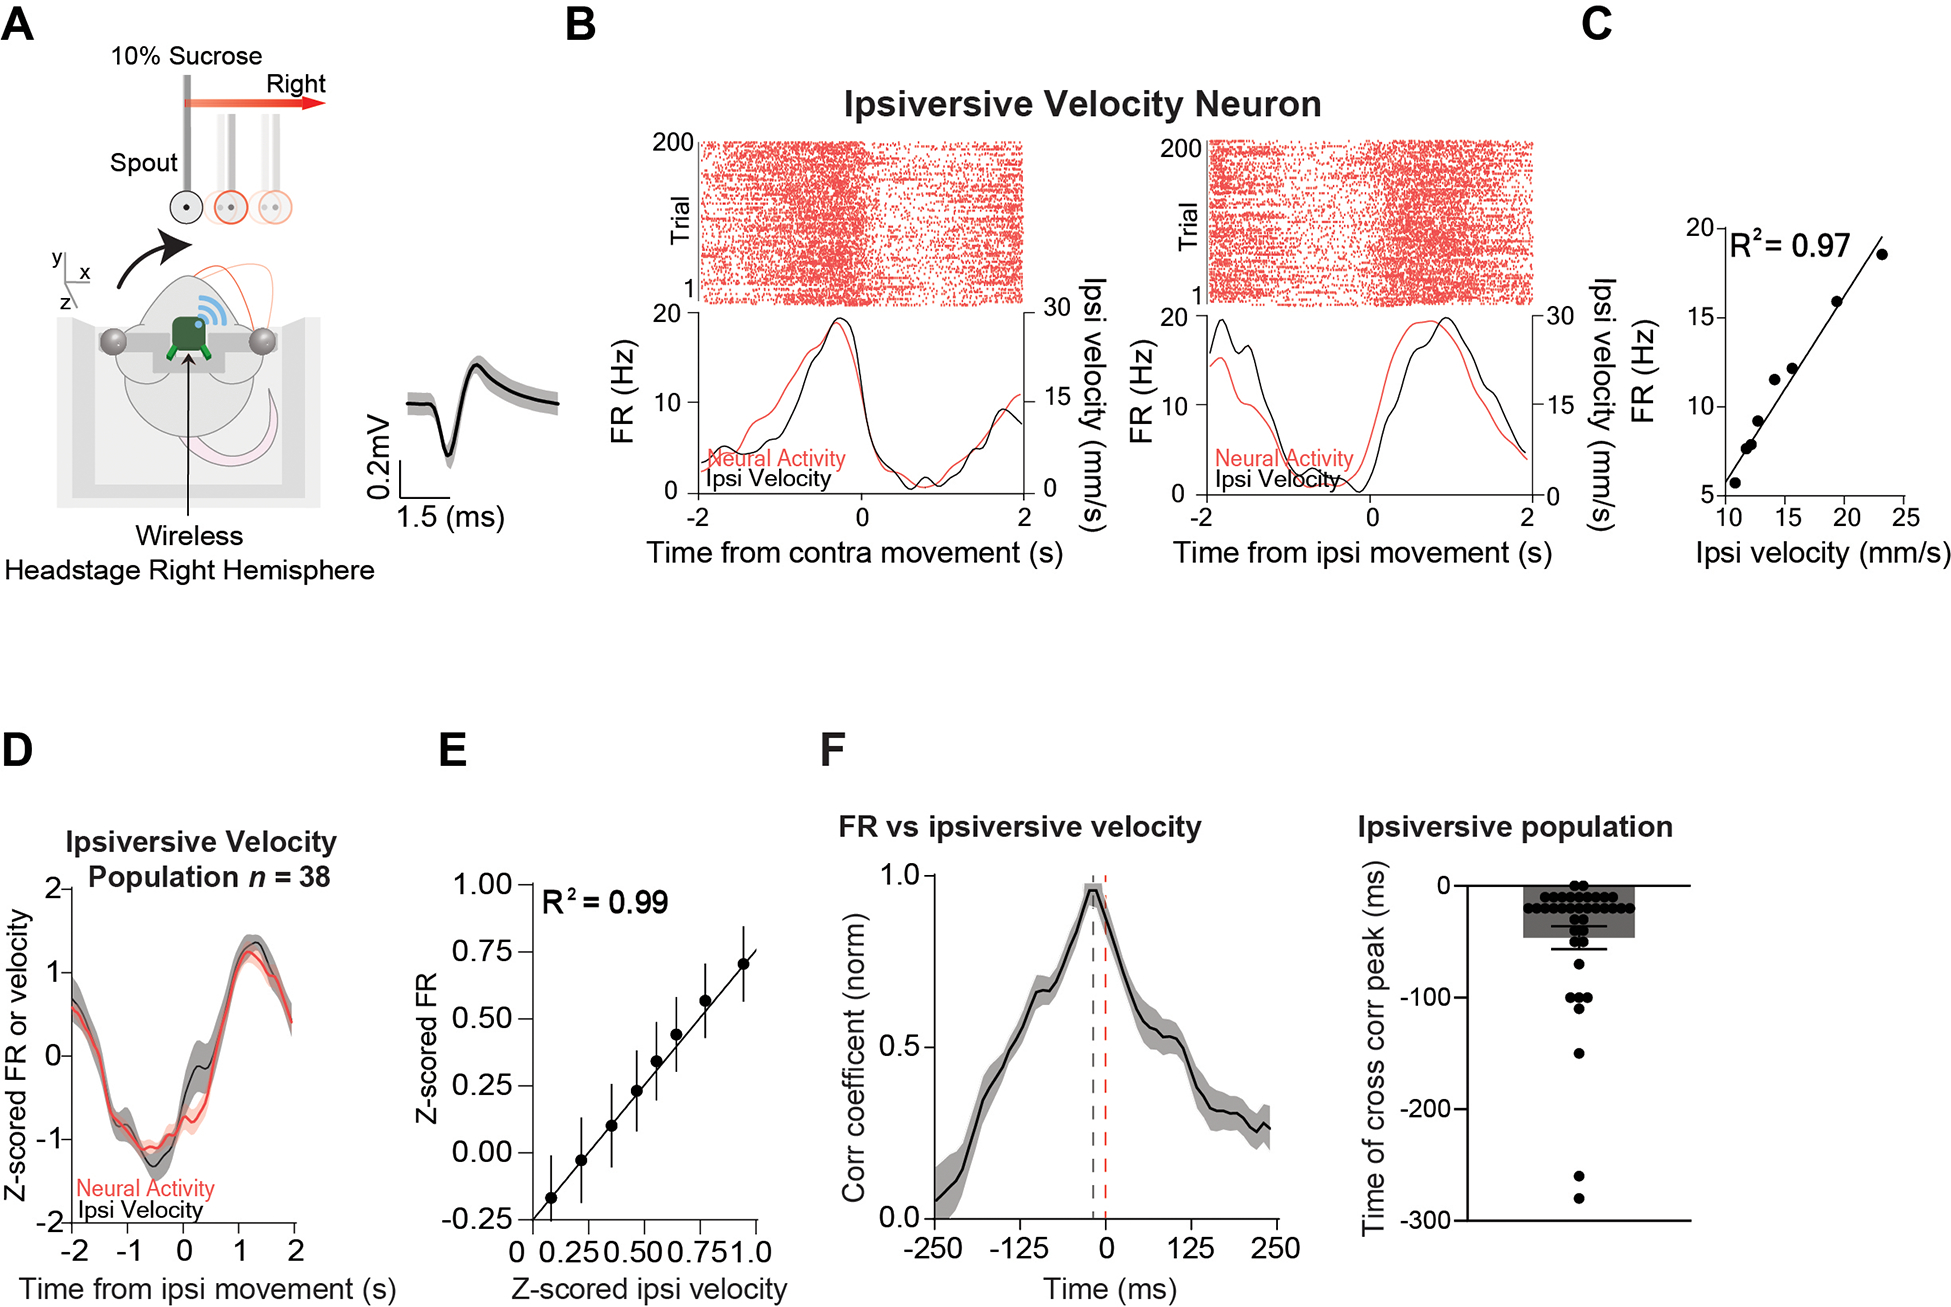
A) Illustration of a mouse tracking the reward in the direction ipsiversive to the electrode implant. The average wave form of the ipsiversive population. B) Representative Pf ipsiversive velocity neuron showing high correlation with ipsiversive velocity. Left: Peri-event raster plot of a representative Pf ipsiversive velocity neuron showing the neural activity and the corresponding velocity when the target was moving contraversive (0 to 2 seconds). Right: Peri-event raster plot of the same Pf neuron and the corresponding velocity when the target was moving ipsiversive (0 to 2 seconds). C) There was a high correlation between the ipsiversive velocity and the firing rate of the representative neuron. Correlation (p < 0.0001). D) The population of ipsiversive velocity neurons (n = 38) increased their firing rate during ipsiversive movement and decreased during contraversive movement. E) There was a high positive correlation between Pf firing rate and velocity Correlation (p < 0.0001). F) Cross-correlation between activity of ipsiversive velocity neurons and ipsiversive velocity shows that neural activity preceded the behavior. Error bars indicate mean ± SEM. See also Figures S1–S2.
Figure 5. Correlations with other behavioral variables.
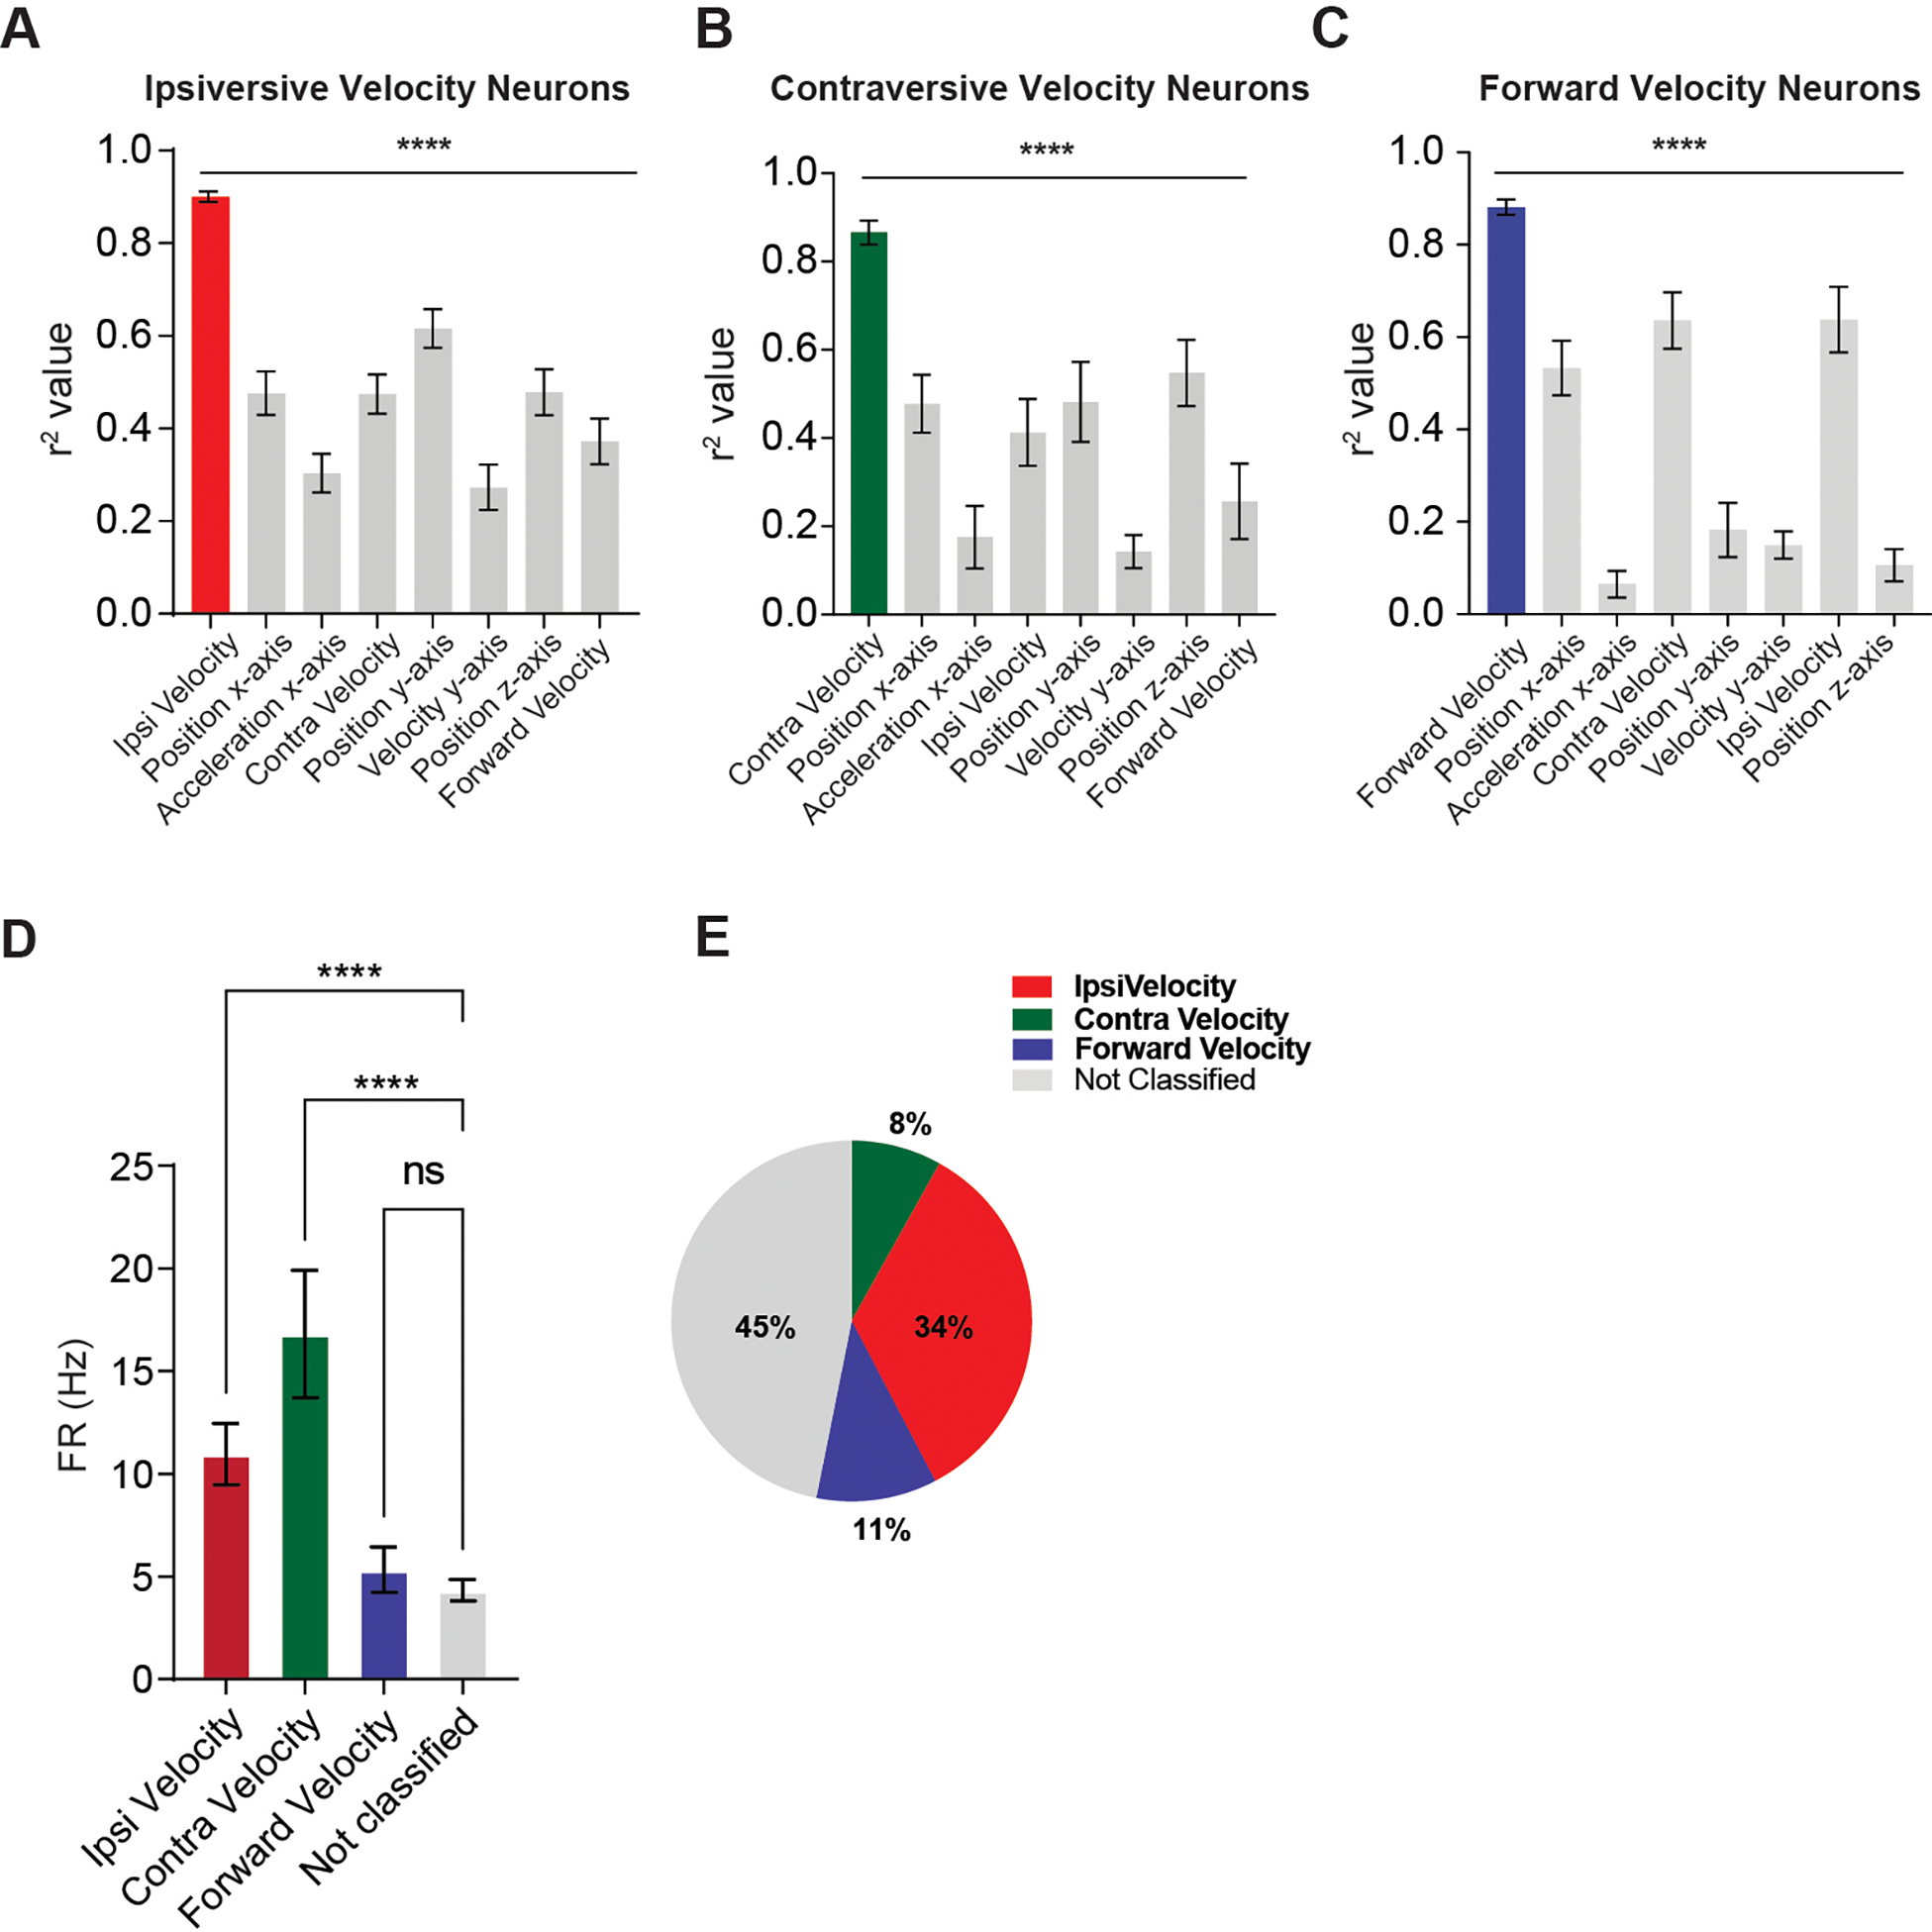
A) Ipsiversive velocity neurons have significantly higher positive correlation with ipsiversive velocity than all other kinematic variables (One-way ANOVA, main effect of kinematic variable F(7, 296) = 18.79, p < 0.0001). Dunnett’s post hoc comparison revealed that all other correlations are significantly lower than ipsiversive velocity (ps < 0.0001). B) Contraversive velocity neurons have significantly higher positive correlation with contraversive velocity than other kinematic variables (One-way ANOVA, main effect F(7, 64) = 8.23, p < 0.0001). Dunnett’s post hoc comparisons revealed that other correlations are significantly lower than contraversive velocity (ps < 0.0001). C) Forward velocity neurons have significantly higher positive correlation with forward velocity than other kinematic variables (One-way ANOVA, main effect F (7, 88) = 43.67, p < 0.0001). Dunnett’s post hoc comparison revealed that all other correlations are significantly lower than forward velocity except for ipsiversive velocity (ps < 0.0001, ipsiversive velocity ps = 0.11). D) One-way ANOVA revealed a significant main effect of group in firing rates of the classified neurons (F(3,107) = 13.71, p < 0.0001). Ipsiversive and contraversive velocity neurons had significantly higher firing rates than unclassified neurons (Dunnett’s, p < 0.0001). E) Percent of each population of neurons. Error bars indicate mean ± SEM. **** p < 0.0001. See also Figures S3–S4.
Figure 3. A population of Pf neurons represent contraversive velocity.
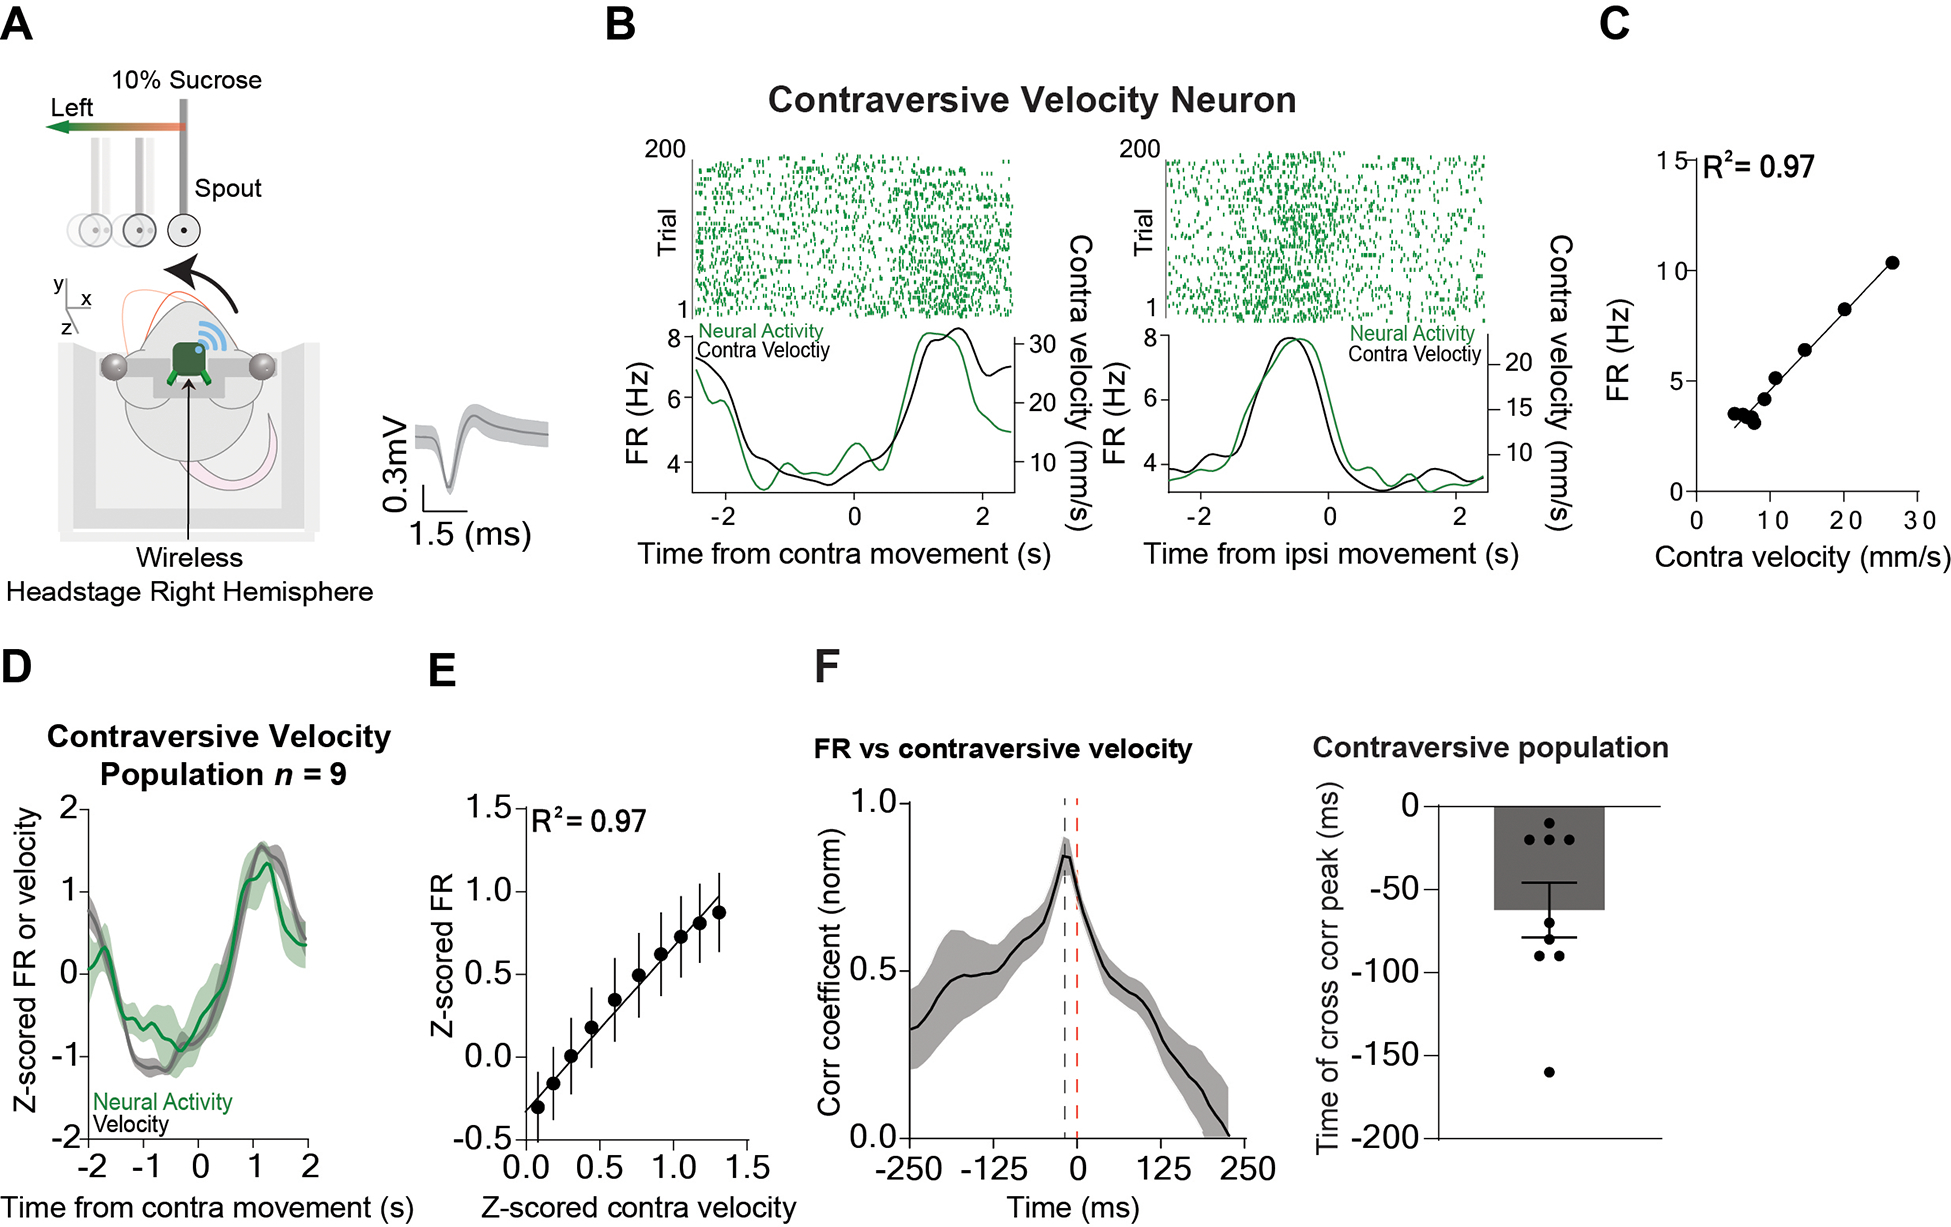
A) Illustration of a mouse tracking the reward in the direction contraversive to the electrode implant. The average wave form of the contraversive population. B) Representative Pf contraversive velocity neuron showing a high positive correlation with ipsiversive velocity. Left: Peri-event raster plot of a representative neuron aligned to the target moving contraversive (0 to 2 seconds) and the corresponding velocity. Right: Peri-event raster plot of the same Pf neuron and the corresponding velocity when the target was moving ipsiversive (0 to 2 seconds). C) There was a high positive correlation between the contraversive velocity and the firing rate of the representative neuron. Correlation (p < 0.0001). D) The population of contraversive velocity neurons (n = 9) increased their firing rate during contraversive movement and decreased during ipsiversive movement. E) There was a high positive correlation between the firing rate of the contraversive velocity population and contraversive velocity. Correlation (p < 0.0001). F) Cross-correlation between activity of contraversive velocity neurons and contraversive velocity shows that neural activity preceded the behavior. Error bars indicate mean ± SEM. See also Figures S1–S2.
Figure 4. A population of Pf neurons represent forward velocity.
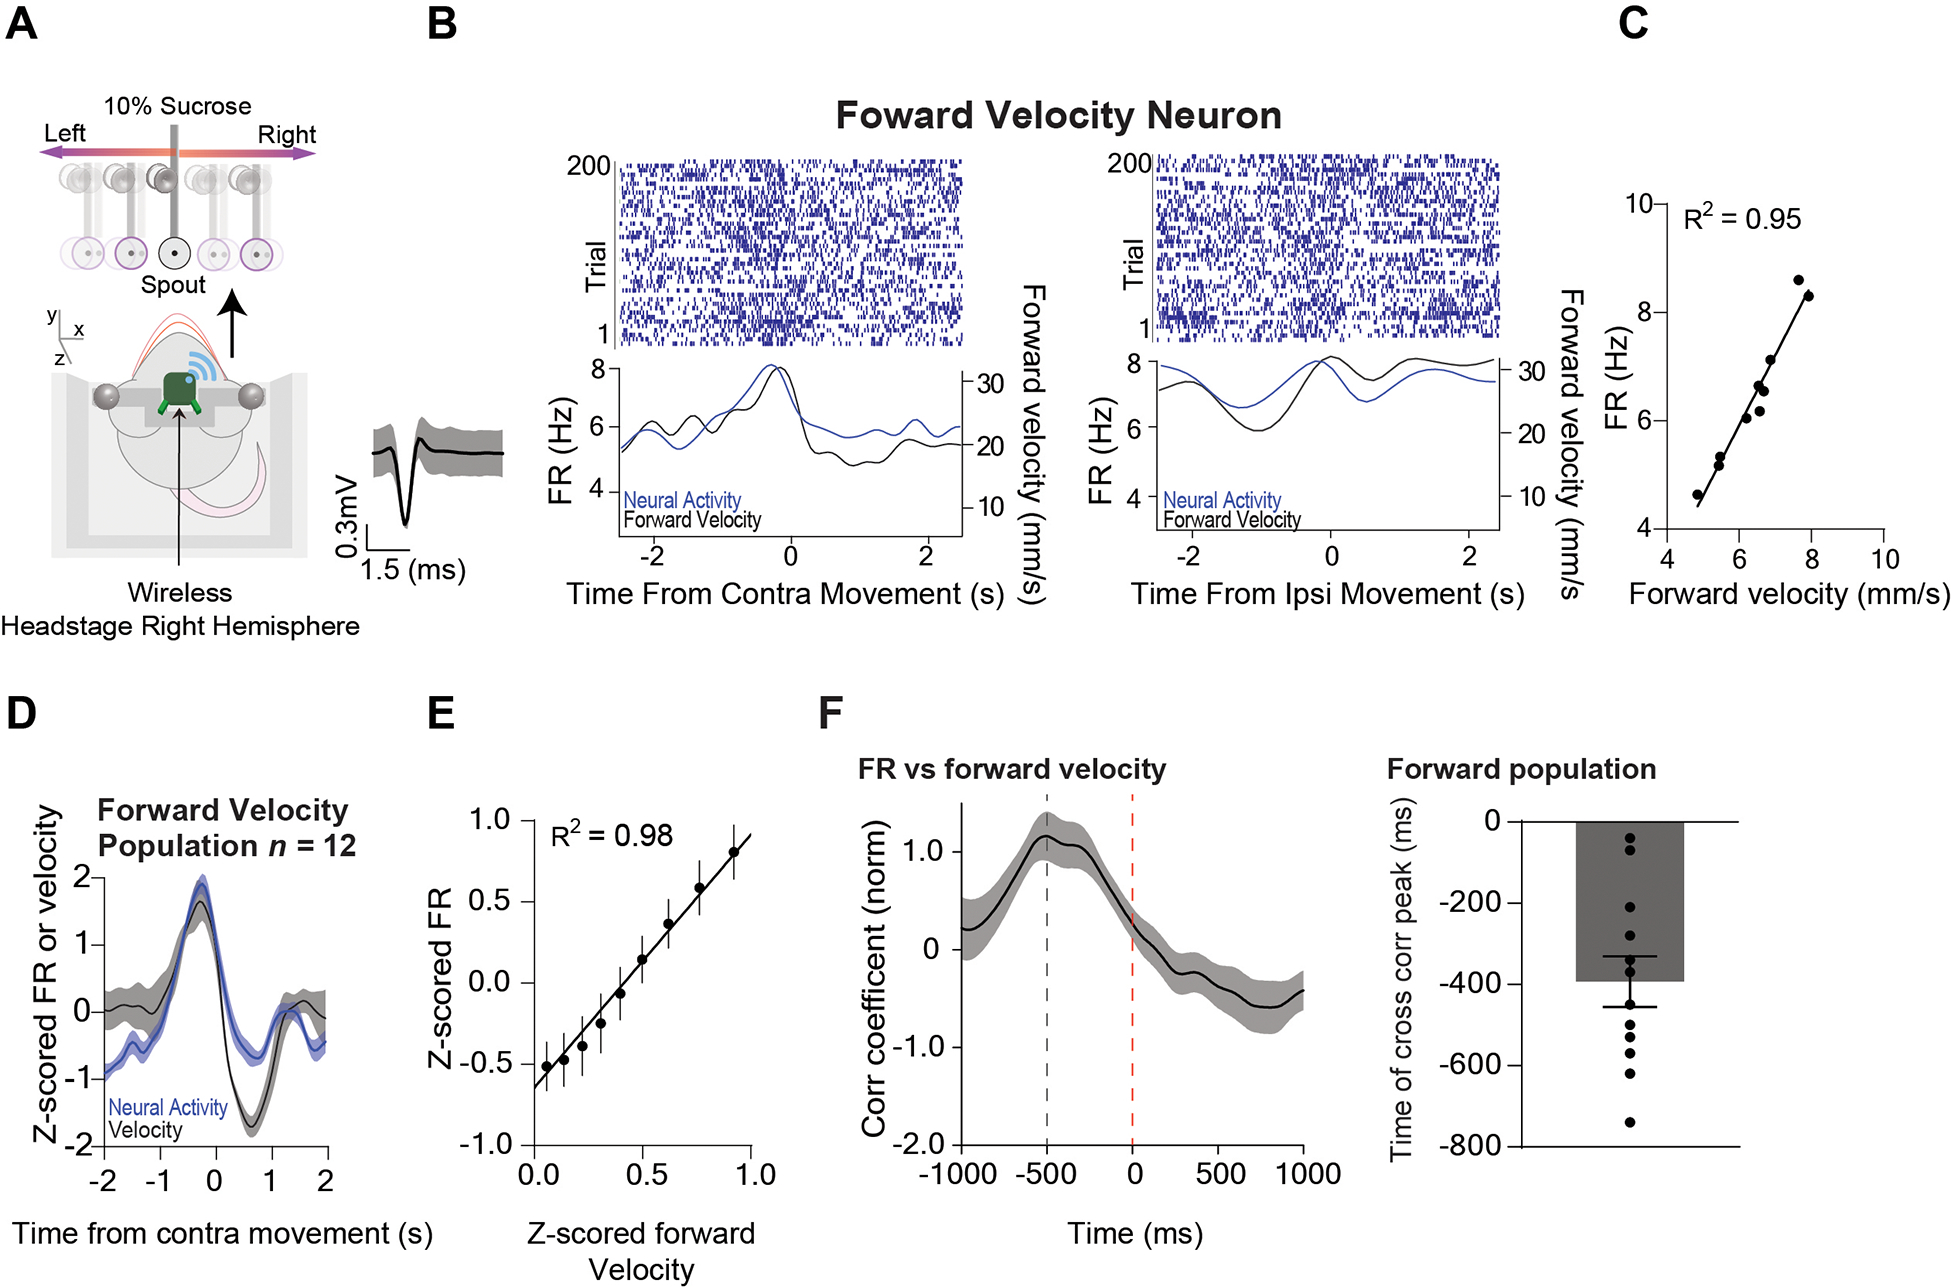
A) Illustration of a mouse moving forward while tracking the reward left and right. The average wave form of the forward velocity population. B) Representative Pf forward velocity neuron showing high correlation with forward velocity. Left: Peri-event raster plot of a representative Pf forward velocity neuron showing the neural activity and the corresponding velocity when the target was moving contraversive (0 to 2 seconds). Right: Peri-event raster plot of the same Pf neuron and the corresponding velocity when the target was moving ipsiversive (0 to 2 seconds). As the mouse increased its velocity forward, the Pf neuron’s firing rate would correspondingly increase. C) There was a high positive correlation between the velocity and the firing rate of the representative neuron. Correlation (p < 0.0001). D). The population of Pf forward velocity neurons (n = 12) increased their firing rate during forward movement and decreased during backward movement. E) There was a high positive correlation between Pf firing rate and forward velocity across all neurons. Correlation (p < 0.0001). F) Cross-correlation between activity of forward velocity neurons and forward velocity shows that neural activity preceded the behavior. Error bars indicate mean ± SEM. See also Figures S1–S2.
We used a high threshold for classifying neurons as representing velocity: neurons were only classified if r2 is 0.7 or higher across the recording session. Ipsiversive velocity neurons were more common (34%) than contraversive velocity neurons (8%) or forward velocity neurons (11%) (Figure 5E). The population distribution was similar between sexes (Figure S4). All velocity populations showed significantly higher correlation with their classified behavioral variable than with other kinematic variables (Figures 5A–C). The ipsiversive and contraversive velocity neurons had significantly higher firing rates than unclassified neurons (Figure 5D).
The changes in the firing rates of the Pf velocity neurons appeared to precede changes in velocity, as confirmed by cross correlation analysis (Figures 2–4). Because neural activity generally preceded behavior, we hypothesized that Pf neurons could directly command the turning and orienting behavior. To test the causal role of Pf in behavior, we used optogenetics to selectively excite and inhibit Pf neurons in Vglut2-Cre mice while they were engaged in the reward tracking task14,15. Most Pf projection neurons are known to express vesicular glutamate transporter 2 (vGlut2)10,16. We therefore injected either the Cre-dependent excitatory channelrhodopsin (ChR2) (Figure 6A; Vglut2::ChR2Pf; n = 4) or the inhibitory channelrhodopsin (StGtACR2) into the Pf of Vglut2-Cre mice (Figure 7A; Vglut2::stGtACR2Pf; n = 6). Histological examination showed that the opsins were expressed in Vglut2+ neurons (Figure S5A–B).
Figure 6. Optogenetic excitation produces ipsiversive turning.
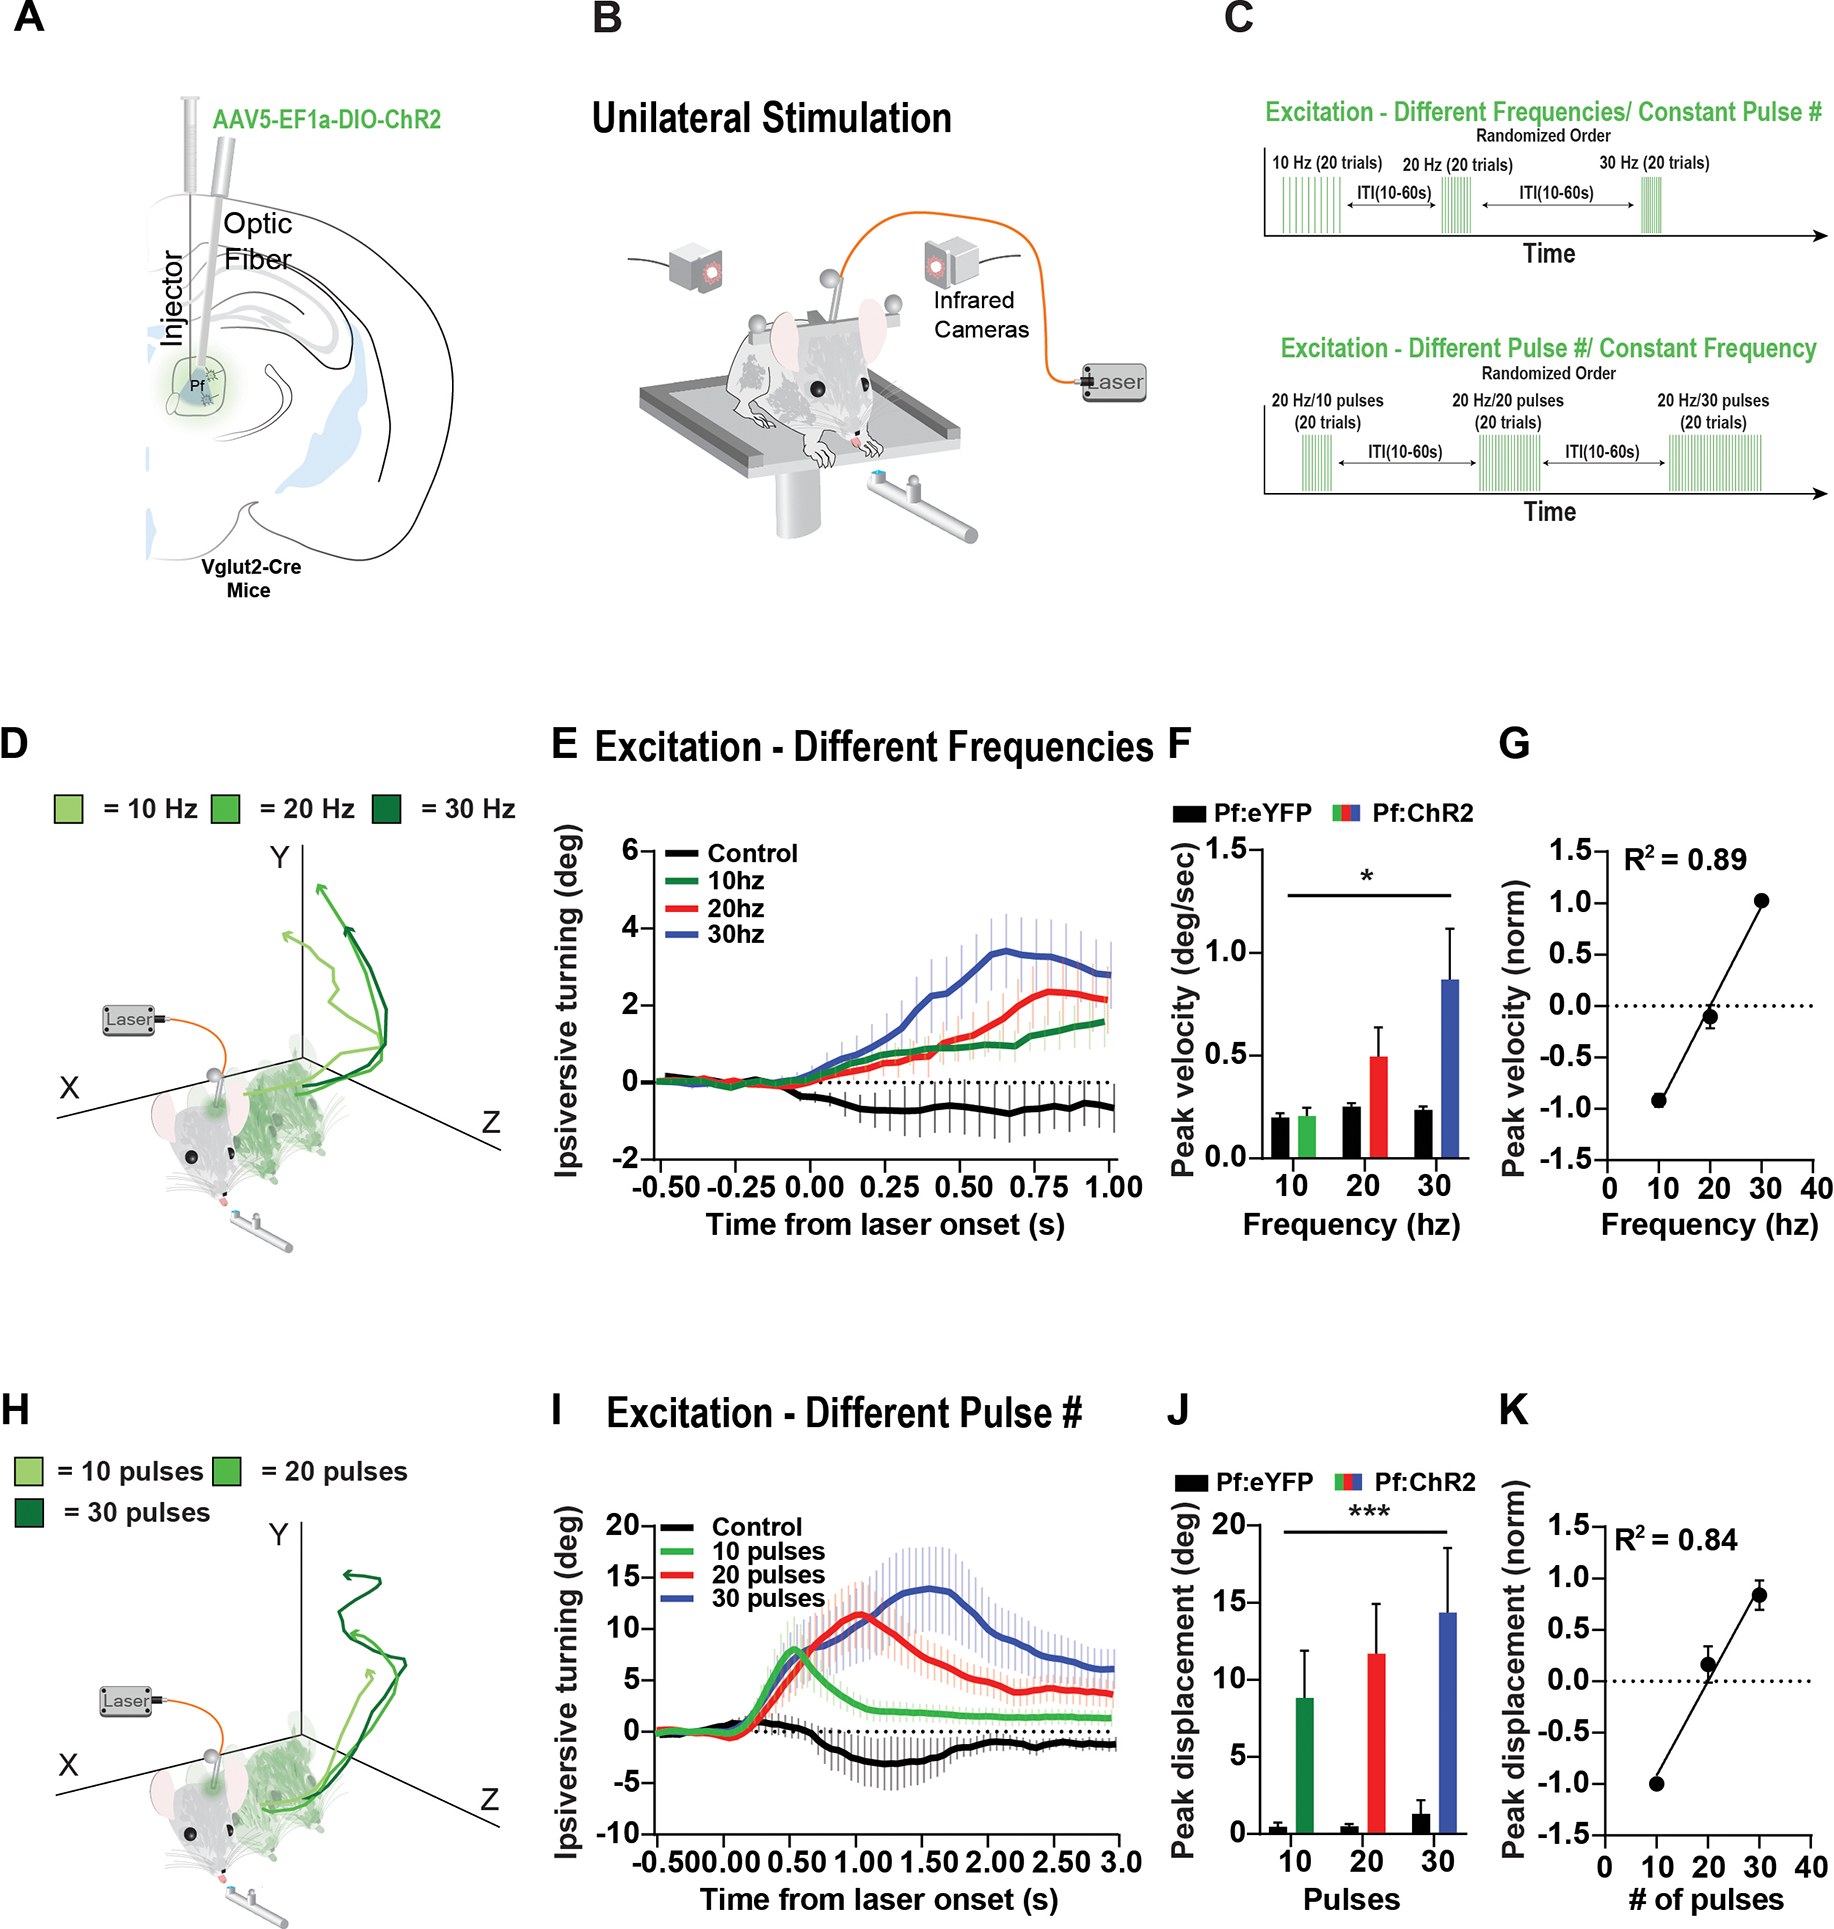
A) For optogenetic excitation, the Cre-dependent excitatory opsin DIO-ChR2 was injected into the Pf of Vglut2-Cre mice. Controls received injections of eYFP. Optic fibers were placed above the Pf. B) Mice received unilateral optogenetic stimulation while engaged in the reward-tracking task. C) Either the stimulation frequency was varied with a fixed number of pulses (Top: 10 pulses for 10 Hz, 20 Hz and 30 Hz) or the frequency was held constant, and the number of pulses was varied (Bottom: 20 Hz with 10, 20 and 30 pulses). Stimulation was delivered with a random inter-trial interval (ITI). D) Head position traces of a representative animal from optogenetic excitation using different frequencies with the same number of pulses (10, 5ms pulses). Excitation would produce ipsiversive head turning. In addition to horizontal head movement, they would also slightly move their head up and forward. E) Stimulation at different frequencies caused ipsiversive head turning (control = Pf:eYFP 30hz). F) Stimulation significantly increased ipsiversive velocity in Pf:ChR2 mice relative to Pf:eYFP controls (2-way ANOVA, Virus [ChR2 or eYFP] × Frequency, main effect of virus F(1,24) 6.169, p = 0.0204, no effect of frequency F(2,24) = 2.879, p = 0.0757, and no interaction F(2, 24) = 2.366, p = 0.1154). (Pf:ChR2 n = 6 hemispheres, Pf:eYFP n = 4 hemispheres). G) Ipsiversive velocity increased linearly with stimulation frequency (Linear regression, p < 0.0001). H) Head position traces of a representative animal from optogenetic excitation using different pulse numbers with the same frequency (20hz, 5ms pulses). I) Stimulation at different number of pulses caused ipsiversive head turning (control = Pf:eYFP 30pulses). J) Stimulation significantly increased ipsiversive displacement in Pf:ChR2 mice relative to Pf:eYFP controls (2-way ANOVA, Virus [ChR2 or eYFP] × Pulses, main effect of virus F(1,24) = 18.19, p = 0.0003, no effect of pulses, F(2,24) = 8.0.5252, p = 0.5981, and no interaction F(2,24) = 0.2886, p = 0.7519). (Pf:ChR2 n = 6 hemispheres, Pf:eYFP n = 4 hemispheres). K) Ipsiversive displacement increased linearly with stimulation pulse number (Linear regression, p < 0.0001). Error bars indicate mean ± SEM. *p < 0.05, ***p < 0.001 See also Figures S5–S6.
Figure 7. Optogenetic inhibition produces downward head movement.
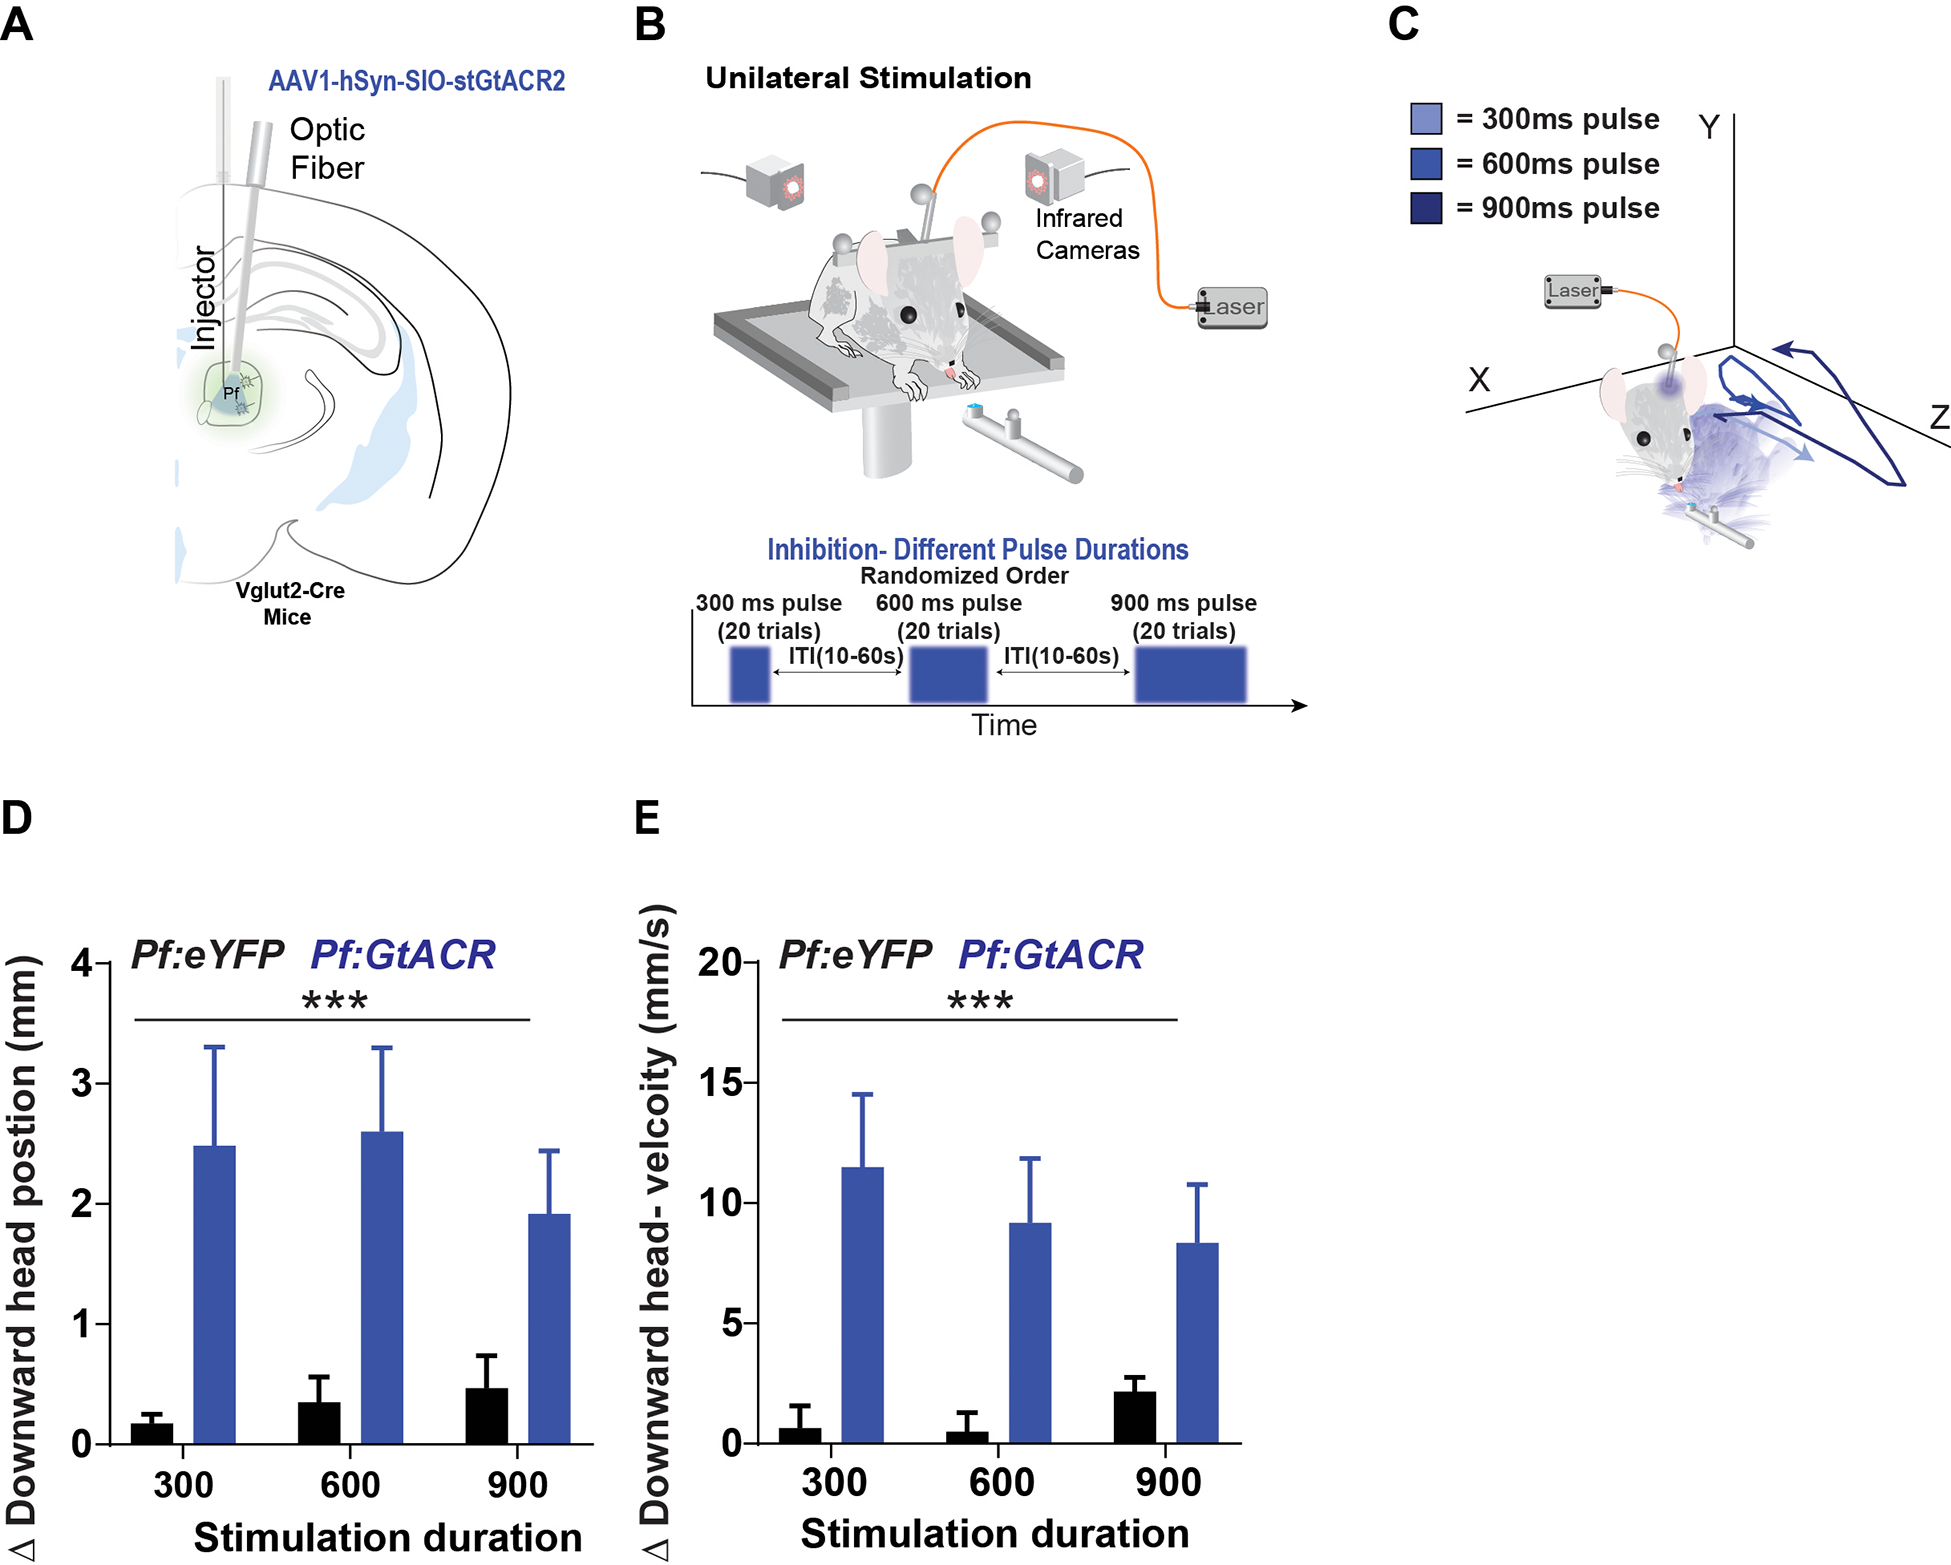
A). For optogenetic inhibition, the Cre-dependent inhibitory opsin SIO-StGtACR2 was injected into the Pf of Vglut2-Cre mice. Controls received injections of eYFP. Optic fibers were placed above the Pf. B) Mice received unilateral optogenetic stimulation while engaged in the reward-tracking task. The duration of the pulses was varied (Bottom: 300ms, 600ms and 900ms pulses) and was delivered with a random ITI. C) Head position traces of a representative animal from optogenetic inhibition using different durations. Inhibition would cause their head to move downwards followed by a pause in movement. D) Photo-stimulation produced downward head movement, as indicated by downward position change (2-way ANOVA, Virus [GtACR or eYFP] × Duration, significant main effect of virus, F(1,24) = 15.49, p = 0.0006, no significant effect of duration, F(2,24) = 0.1041, p = 0.9015, no significant interaction F(2,24) = 0.2963, p = 0.7462). E) Stimulation significantly increased downward head velocity (2-way ANOVA, Virus × Duration, significant main effect of virus F(1,24) = 18.23, p = 0.0003, no significant effect of duration F(2,24) = 0.1324, p = 0.8766, no significant interaction F(2,24) = 0.4542 p = 0.6403). (Pf:GtACR n = hemispheres, Pf:eYFP n = 4 hemispheres). Error bars indicate mean ± SEM. *** p < 0.001. See also Figures S5 and S7.
We observed that optogenetic excitation produced ipsiversive turning during the reward-tracking task. To quantify their turning behavior due to stimulation, we measured stimulation-induced behavior while the spout was stationary (Figure 6). When exciting Vglut2::ChR2Pf neurons, we first manipulated the frequency while keeping the pulse number constant (10 pulses). Mice received stimulation while licking the reward spout, and in a random order of frequency and number of pulses (Figure 6C). We found that optogenetic excitation produced ipsiversive turning as well as upward and forward head movements. This is not surprising given our finding of predominantly ipsiversive velocity neurons in the Pf. Stimulation significantly increased ipsiversive velocity (Figure 6D–6F). Next, we optogenetically excited Vglut2::ChR2Pf by manipulating the pulse number (10, 20, and 30 pulses), but kept the frequency constant (20 Hz; Figure 6G–I). Stimulation significantly increased ipsiversive movement and the number of pulses was correlated with ipsiversive changes in position or displacement.
Finally, to test whether stimulation would produce ipsiversive turning in a different context, we optogenetically excited Pf neurons in a separate cohort of mice in the open field. We found that unilateral stimulation significantly increased ipsiversive turning relative to eYFP controls (30–40 hz, Figure S6).
To determine how inhibition of Pf neurons may affect behavior, we used an inhibitory opsin to inhibit Vglut2::stGtACR2Pf neurons and manipulated pulse duration (300 ms, 600 ms, and 900 ms; Figure 7B). Mice received stimulation while licking the stationary reward spout with a random ITI, and in a random order of simulation durations (Figure 7B). The stimulation protocol is different from the ChR2 experiments, because using pulse trains with brief pulse durations may not produce sustained silencing of neurons15. Using whole-cell patch clamp recording in brain slices, we verified that Pf neurons can be effectively silenced using our stimulation protocol (Figure S7). Action potentials were generated in current clamp mode during which slices were injected with current that was adjusted to evoke action potentials (50 – 150 pA); photo-stimulation prevented the generation of action potentials. Using similar stimulation parameters, we showed that optogenetic inhibition during reward delivery paused turning behavior, produced downward movements (Figure 7C). Inhibition significantly increased the downward head movements compared to controls (Figure 7D–E).
Discussion
Our results suggest that many Pf neurons play a key role in generating orienting and steering behavior. They are recruited when mice orient to salient stimuli and generate high-level commands that specify detailed kinematic parameters for turning. We found distinct populations of Pf neurons that precisely represent turning velocity, as shown in Figure 2–4. There are opponent classes of neurons that increase firing depending on the direction of head movement. One class increases firing when turning ipsiversively and decreases firing when turning contraversively (Figure 2). The second class increases firing during contraversive turning and decreases during ipsiversive turning (Figure 3). The third class increases firing before forward movements (Figure 4). Pf neurons show an ipsiversive preference: ipsiversive velocity neurons are by far the most common population (~34% of all recorded neurons), whereas contraversive velocity neurons (8%) and forward velocity neurons are relatively rare (11%) (Figure 5). Together these constitute over half of all recorded Pf neurons.
Since the neural activity representing kinematics usually leads observed kinematic measures (Figures 2F, 3F, and 4F), our electrophysiological results strongly suggest that Pf neurons play a role in generating orienting movements, especially in the ipsiversive direction. Interestingly, in the forward velocity neurons, the increase in firing rate significantly precedes forward velocity (393 ms, Figure 4F), unlike the ipsiversive and contraversive neurons which show activity that precedes kinematics slightly (~48 ms for ipsiversive, and ~62 ms for contraversive). Optogenetic stimulation also produced forward movement as well as ipsiversive turning, in agreement with the electrophysiological rsults. But it remains unclear why the timing of neural activity in relation to kinematics is so different for the forward velocity neurons. It is possible that they generate movements indirectly, via distinct downstream targets, but this possibility remains to be tested. Since ipsiversive velocity neurons are the most common in the Pf, it is not surprising that the net effect of optogenetic excitation is ipsiversive turning.
These conclusions are further corroborated by our optogenetic results. We found that unilateral optogenetic excitation produced ipsiversive turning (Figure 6). Turning behavior was limited to the head when brief stimulation was used. With more sustained stimulation, the whole body would turn as well (Figure 6I–J and Figure S7). We could also pause turning behavior and cause a downward head movement with optogenetic inhibition (Figure 7).
Previous work showed that Pf neurons respond to salient stimuli, suggesting that they may play a role in attentional orienting and flexible behavioral switching17. Our results are broadly in accord with this claim, but additionally reveal a major function of Pf output neurons in generating ipsiversive orienting behavior. Although Pf neurons represented velocity outside of the task (Figure S4), the correlation between firing rate and velocity was much higher when the mouse was actively engaged in the reward tracking task (Figures 2–4 & S4), suggesting attention to the target may enhance kinematic representation in the Pf and modulate orienting behavior. Our results also agree with work showing that Pf output provides top-down signals for action selection17,18. But they further reveal an unexpected role in controlling the velocity, amplitude, and direction of actions; that is, the role of the Pf output is not only restricted to action initiation, but also includes specification of action parameters (e.g. direction and velocity).
The Pf receives major inputs from the somatosensory cortex, superior colliculus, vestibular nuclei, motor cortex and substantia nigra pars reticulata (SNr); in turn it projects to the striatum and subthalamic nucleus (STN) 19–22. In particular, vestibular inputs are critical in updating head direction signals in the absence of landmark cues 23; they may be needed to adjust head position for orienting and steering during locomotion.
Recent work has shown that basal ganglia nuclei could provide precise representations of kinematic variables like position or velocity 13,24,25. Given the prominent connectivity between the Pf and these basal ganglia nuclei, it is possible that Pf neurons could be one upstream source of signals related to kinematics. However, striatal projection neurons most commonly represent contraversive velocity, and stimulation of the direct pathway (striatonigral) neurons usually generates contraversive turning 13,26,27. It is unlikely that the most common ipsiversive velocity neurons in the Pf drive the SPNs that represent contraversive velocity. Previously, many Pf neurons that project to the striatum were found to be related to the latency to initiate pressing in a lever pressing task 7. Given that Pf-striatum activity was increased during the transition between the port and the lever, it is possible these neurons also represent ipsiversive movement velocity as found here. This possibility remains to be tested in an operant task.
A separate population of Pf neurons also project to the STN 10,19,28,29. Prior work has shown that optogenetic stimulation of Pf-STN projections produces ipsiversive turning, while stimulation of Pf-striatum projections does not. Pf projections to the STN have also been shown to be critical for movement initiation during dopamine depletion10. This pathway bypasses the striatum. STN neurons that receive afferents from the Pf also target downstream regions involved in posture, locomotion, and turning, such as the SNr and mesencephalic locomotor region (MLR) 30,31. Recent work has also shown that selective stimulation of the STN also produces ipsiversive turning movements 32. It is therefore possible that the ipsiversive velocity neurons observed here also project to the STN.
Although our results show that different populations of Pf neurons represent different components of movement velocity, it is currently unknown whether these populations are topographically organized, express unique molecular markers, or have specific projection targets. The function of the remaining Pf neurons, which do not represent kinematics, also remains obscure. Recent work has found that the Pf contains different sub-regions that participate in distinct cortico-thalamo-striatal loops corresponding to the limbic, associative and sensorimotor circuits of the basal ganglia 16. It is possible that the velocity-related Pf neurons participate in the sensorimotor circuits, whereas those neurons that are not related to movement kinematics may participate in limbic or associative circuits, and contribute to cognitive processes such as behavioral switching33. Such a possibility remains to be determined.
STAR METHODS
Resource availability
Lead contact
Further information and requests for resources and reagents should be directed to and will be fulfilled by the lead contact, Henry Yin (hy43@duke.edu). This study did not generate new unique reagents.
Materials availability
All of the materials used in the experimental procedures are available upon request.
Data and Code Availability
All data reported in this paper is located here: https://figshare.com/s/4afa6c3ab5185866b774.
This paper does not report original code.
Any additional information required to reanalyze the data reported in this paper is available from the lead contact upon request.
Experimental model and subject details
Mice
All experimental and surgical procedures were conducted in accordance with standard ethical guidelines and were approved by the Duke University Institutional Animal Care and Use Committee. Both Wild-type (n = 17, 7 male and 10 female) and Vglut2-ires-Cre C57BL/6J mice (n = 9, 5 female and 4 male) were used. Adult Vglut2-ires-Cre mice were randomly assigned to Vglut2::ChR2Pf (n = 5), Vglut2::stGtACR2Pf (n = 4). WT mice were assigned to WT::eYFPPf (n = 6), WT::EphysPf (n = 7), and WT::ChR2Pf (n = 4) groups. All mice were between 2–8 months old, group housed with 3–5 animals per cage on a 12:12 light cycle and tested during the light phase. group. For experiments, mice were put on water restriction and maintained at 85–90% of their initial body weights. Animals received 2 hours of free access to water following the experimental sessions.
Method Details
Viral Constructs
pAAV5-EF1a-DIO-hChR2(E123T/T159C)-eYFP was obtained from Addgene (35509). rAAV5-hSyn-eYFP was obtained from the UNC Core. pAAV-hSyn1-SIO-stGtACR2-FusionRed was purchased from Addgene (105677).
Surgery
Mice were initially anesthetized with 2.0 to 3.0% isoflurane and maintained at 1.0 to 1.5 % during surgical procedures. They were placed into a stereotactic frame (David Kopf Instruments, Tujunga, CA) and administered Meloxicam (2 mg/kg) and bupivacaine (0.20 mL) before surgical incisions. Craniotomies were made bilaterally above the Pf. The virus was then injected (0.4 μL) with a microinjector (Nanoject 3000, Drummond Scientific) through a glass pipette into the Pf (Relative to bregma: AP: −2.30 – 2.50 mm, ML: ± 0.60 – 0.75 mm, DV: −3.70 – 3.40 mm from skull surface). For electrophysiology experiments a prefabricated 4×4 electrode array (Innovative Neurophysiology, 150 μm electrode and row spacing) was slowly lowered into the Pf (AP: −2.30 mm, ML: ± 0.65 mm, DV: 3.30 mm) over the course of 30 minutes. After insertion of optic fibers or electrode array, screws were inserted into the skull and dental acrylic was used to secure the implant. Mice were allowed to recover for two weeks before training and experimentation began.
Reward tracking task
The continuous reward tracking allows us to record neural activity in freely moving mice as well as continuous kinematic variables with high temporal and spatial resolution13. Mice were placed on a custom designed elevated (40cm tall) platform that allowed access to a motorized reward spout (Bipolar, 56.3 × 56.3 mm, DC 1.4A, 2.9Ω, 1.8 degree / step, Oriental motor, USA) that was placed approximately 4 cm away from the front of the platform. Mice were trained for 4 to 6 days to follow the moving spout from left to right. Experimental sessions were conducted when the mice would follow the reward spout for the majority of the testing session (>70%). During recordings, the spout was set to travel a total of 4.5m. To measure the behavior of the mice, infrared reflective markers (B&L Engineering) were placed on a metal head bar extending from the left and right side of the animal’s dental cement head cap. A third marker was placed on either the wireless electrode head stage or the fiber optic patch cord. A reflective marker was attached to a connected arm extending ~20mm from the spout to track the spout location. The positions of the reflective markers were detected by six Raptor-H Digital infrared cameras encircling the platform and recorded in Cortex at 100FPS (Motion Analysis, CA) as Cartesian coordinates. The reward was delivered (12 μl of 10% condensed milk solution) every ~700 milliseconds when the mouse is tracking the reward spout (head marker with an area surrounding the reward spout - X axis: 30mm, Y axis: 20mm, Z axis: 30mm). Contingent reward delivery as well as movement of the reward spout were controlled by custom MATLAB scripts. Behavioral data was then post-processed in Cortex. Timestamps for neural activity, reward delivery, and optogenetic stimulation were recorded using a Cerebrus Blackrock data acquisition system. Behavioral data and timestamps were then aligned and analyzed using Neuroexplorer (Nexus).
Wireless in vivo Electrophysiology Recordings
A 128-Channel neural signal data acquisition system (Cerebus, Blackrock Microsystems) recorded action potentials through a miniaturized wireless head stage (Triangle Biosystems) interfaced to electrode arrays (Innovative Neurophysiology). Data were filtered with both analog and digital bandpass filters before being sampled as previously described 31,34,35. Collected neural data was sorted offline with OfflineSorter (Plexon) and analyzed in Neuroexplorer (Nexus). Discharges with a signal-to-noise ratio of at least 3:1 were time-stamped at a resolution of 0.1 ms. Waveforms were classified as single units using the following criteria: 1) a signal to noise ratio of at least 3:1; 2) consistent waveforms throughout the recording session; 3) refractory period of at least 800 μs.
Whole-cell patch clamp recording
For whole-cell patch-clamp recordings (Figure S7), 2 Vglut2-Cre animals were used. Virus (stGtACR2) was injected into the Pf bilaterally and the mice were sacrificed 4 weeks post-injection. The brain was removed then left in an ice-cold solution bubbled with 95% O2–5% CO2 containing the following (in mM): 194 sucrose, 30 NaCl, 2.5 KCl, 1 MgCl2, 26 NaHCO3, 1.2 NaH2PO4, and 10 D-glucose. After approximately 5 minutes, the brain was cut in 250 μm coronal sections placed in 35.5°C oxygenated artificial cerebrospinal fluid (aCSF) solution containing (in mM): 2.5 KCl, 124 NaCl, 2 CaCl2, 26 NaHCO3, 1 MgCl2, 1.2 NaH2PO4, and 10 D-glucose. The slices were left in aCSF at ~22−23°C for a minimum of 30 min before the experiment. Whole-cell patch clamp recordings were then performed in current clamp mode with continuous perfusion of aCSF at 29–30°C. The internal solution contains (in mM): 150 potassium gluconate, 2 MgCl2, 10 HEPES, 3 sodium ATP, 1.1 EGTA and 0.2 sodium GTP.
During recording, slices were injected with current that was adjusted to evoke action potentials (50 – 150 pA). Current was kept on for 2 seconds. Slices were stimulated with 470-nm light from an LED (Thor Labs) 500 ms after the start of the current injection. Stimulation at different frequencies (5 ms pulses at 5, 10, 25, 50 and 100 Hz; MASTER-8) was delivered with an LED current driver (Thor Labs; ~2 mW/mm2) to the entire 40× field. Action potentials were recorded for 500 ms after light delivery. All recordings were performed with a MultiClamp 700B amplifier (Molecular Device). They were filtered at 10 kHz and digitized at 20 kHz with a Digidata 1440A digitizer (Molecular Devices).
Optogenetic stimulation
Unilateral optogenetic stimulation experiments were conducted using bilaterally implanted Vglut2::ChR2Pf, Vglut2::stGtACR2Pf, and WT::eYFPPf mice. For open field stimulation experiments, bilaterally implanted Vglut2::ChR2Pf, WT::ChR2Pf, and WT::eYFPPf mice were used. For each animal, left and right hemisphere stimulation occurred on separate days. Prior to the experimental session, optical fiber (105-μm core diameter, 0.22 NA Precision Fiber Products) power output was measured (PM120VA, ThorLabs) to obtain ~5mW, ~8mW, and ~7mW for Vglut2::stGtACR2Pf, Vglut2::ChR2Pf, and WT::ChR2Pf mice, respectively. During the reward tracking task, 473 nm DPSS laser output (Shanghai Laser & Optics) was triggered by a MATLAB program interfaced to a National Instruments DAQ when the animal’s head entered an experimentally defined region surrounding the stationary reward spout (x-axis: 20 mm; Y-axis: 20 mm; Z-axis: 15 mm). Upon head entry into the defined region, stimulation occurred randomly with an inter-stimulation interval ranging 8–16 seconds. For open field stimulation, 473 nm DPSS laser output (Shanghai Laser & Optics) was triggered by a custom Arduino script 25 times randomly across the recording session. For stimulation during reward, timestamps for stimulation, video frames and reward delivery were recorded in a Cerebrus Blackrock data acquisition system. For stimulation in the open field, timestamps for stimulation and video frames were recorded on a Open Ephys acquisition board. Behavioral data and timestamps were analyzed in Neuroexplorer (Nexus) and GraphPad (Prisim).
Histology
Mice were first anesthetized and perfused with 20 ml of 0.1M PBS followed by 20 ml of 4% paraformaldehyde. For mice with fiber implants, the head and skull cap were left intact and were stored in 4% paraformaldehyde for 2–3 days at 4 °C to aid histological verification of fiber placement. Brains were then removed and fixed in 30% sucrose. After 2 days, brains were sliced at 60 μm along the coronal plane using a Leica CM1850 cryostat.
For electrophysiological experiments, sections were stained for cytochrome oxidase to visualize electrode tracks. Sections were rinsed in 0.1M PB before incubating in a diaminobenzidine, cytochrome C, and sucrose solution for ~2 hours at room temperature. For immunohistochemistry, 30 μm free-floating sections were rinsed three times in TBS with 0.2% Triton-X 100 (TBST; Roche, Switzerland) at room temperature for 10 min. Sections were blocked in 5% Normal Goat Serum (NGS) in TBST for 1 h at room temperature. Sections were then incubated with a primary antibody (polyclonal guinea pig anti-VGlut2; 1:5000 dilution; Synaptic System; catalog no. 135 404) in blocking solution overnight at 4 °C. Sections were then rinsed three times in TBST for 10 min before being placed in a secondary antibody used to visualize VGlut2 colocalization with either stGtACR2 conjugated with fusionRed (goat anti-guinea pig Alexa Fluor 488, 1:200 dilution; Invitrogen; catalog no. A-11073) or ChR2 conjugated with YFP (Alexa Fluor 594, 1:200 dilution; Thermo Fisher; catalog no. A-11076) for 2 hr at room temperature. Fiber placement and injection site visualization was further aided by DAPI staining in the mounting medium (Fluoromount-G).
Quantification and statistical analysis
For main electrophysiological experiments, data from time windows when the mice were engaged in the task were analyzed (~75% of the whole sessions). For supplemental electrophysiological experiments both data from time windows when the mice were engaged and disengaged in the task were analyzed. The Cartesian coordinates for the position of the head were obtained from the motion capture data (Cortex software) and were then further processed offline to take derivatives of position. Data were imported into Neuroexplorer (Nexus) for further analysis and comparison with neural data. Data were binned using 50 millisecond time bins and Gaussian smoothed over 5 bins. Neural and behavioral data were also imported into Graphpad Prism 9 for statistical analyses. For electrophysiological experiments, correlation (Pearson’s r) between firing rates and behavioral variables was calculated by comparing the binned data’s averages for the neural activity and the corresponding behavioral measures. When classifying a neuron as representing a particular movement variable, a criterion of r2 > 0.7 was used and also needed to be greater than all other movement comparisons. Neuroexplorer (Nexus) was then utilized to perform cross-correlation analyses. Latencies were determined by finding the lag to the maximum value of the cross-correlation for positively correlated neurons. Cross-correlations were normalized and averaged together across all animals to obtain population data. For the optogenetic experiments, the body turn angle was computed from behavioral tracking data and imported into Neuroexplorer (Nexus) for further analysis. Data were binned using 50 millisecond time bins and aligned to stimulation. The average peak angular velocity or displacement following stimulation were computed for each mouse. A Two-way ANOVA was used to determine the effects of reward stimulation. For open field experiments, mouse behavior videos were analyzed using DeepLabCut (DeepLabCut software) and further processed using a custom MATLAB script to convert values to millimeters (MATLAB 2022b). Body turn angle was then computed. The peak angular displacement during the start of stimulation to 2.5 seconds following was computed. A Two-way ANOVA was used to determine the effects of open field stimulation.
Supplementary Material
Video S1. 3D video of mouse tracking the reward spout. Related to Figure 1. Markers represent the left, right and top of the mouses head, and the arm extending above the moving spout.
Key resources table.
| REAGENT or RESOURCE | SOURCE | IDENTIFIER |
|---|---|---|
| Antibodies | ||
| Polyclonal guinea pig anti-VGlut2 | Synaptic System | Cat#: 135404 |
| Goat anti-Guinea Pig IgG (H+L) Highly Cross-Adsorbed Secondary Antibody, Alexa Fluor™ 488 | Invitrogen | Cat#: A-11073 |
| Goat anti-Guinea Pig IgG (H+L) Highly Cross-Adsorbed Secondary Antibody, Alexa Fluor™ 594 | Thermo Fisher | Cat#: A-11076 |
| Bacterial and virus strains | ||
| pAAV5-EF1a-DIO-hChR2(E123T/T159C)-eYFP | Addgene | Cat#: 35509 |
| rAAV5-hSyn-eYFP | UNC Core | N/A |
| pAAV-hSyn1-SIO-stGtACR2-FusionRed | Addgene | Cat#: 105677 |
| Experimental models: Organisms/strains | ||
| Vglut2-ires-Cremice | Jackson Labs | Mouse Strain: 016963 |
| Wild type mice (C57BL/6J) | Jackson Labs | Mouse Strain: 000664 |
| Software and algorithms | ||
| MATLAB 2022b | MathWorks | https://www.mathworks.com/products/matlab.html |
| Cerebus Central Suite - Fiber Optic | Blackrock Neurotech | https://blackrockneurotech.com/research/support/software/ |
| Offline Sorter 3.0 | Plexon | https://plexon.com/products/offline-sorter/ |
| NeuroExplorer 5.414 | Nex Technologies | http://www.neuroexplorer.com/downloadspage/ |
| GraphPad Prism 9 | GraphPad | https://www.graphpad.com/scientific-software/prism/ |
| Cortex 5.0 | MotionAnalysis | http://ftp.motionanalysis.com/html/industrial/cortex.html |
| DeepLabCut | GitHub | https://github.com/DeepLabCut/DeepLabCut |
| Deposited data | ||
| Raw and analyzed data | This paper | https://figshare.com/s/4afa6c3ab5185866b774 |
| Other | ||
| DAPI Fluoromount-G | Southern Biotech | Cat# 0100-20 |
Highlights.
During tracking, many Pf neurons represent vector components of head velocity.
Optogenetic stimulation of Pf neurons produces ipsiversive head turning.
Prolonged optogenetic stimulation Pf neurons results in full body turns.
Inhibition of Pf neurons stops turning and produces downward movements.
Acknowledgements
We would like to thank Fengxia Allen, Konstantin Bakhurin, Alexander Friedman, and Guozhong Yu for their technical assistance and support. This work was supported by NIH grant NS121253 to H.H.Y.
Inclusion and Diversity
We support inclusive, diverse, and equitable conduct of research.
Footnotes
Declaration of interests
The authors report no conflicts of interest.
Publisher's Disclaimer: This is a PDF file of an unedited manuscript that has been accepted for publication. As a service to our customers we are providing this early version of the manuscript. The manuscript will undergo copyediting, typesetting, and review of the resulting proof before it is published in its final form. Please note that during the production process errors may be discovered which could affect the content, and all legal disclaimers that apply to the journal pertain.
References
- 1.Lacey CJ, Bolam JP, and Magill PJ (2007). Novel and distinct operational principles of intralaminar thalamic neurons and their striatal projections. Journal of Neuroscience 27, 4374–4384. [DOI] [PMC free article] [PubMed] [Google Scholar]
- 2.Smith Y, Surmeier DJ, Redgrave P, and Kimura M (2011). Thalamic contributions to basal ganglia-related behavioral switching and reinforcement. Journal of Neuroscience 31, 16102–16106. [DOI] [PMC free article] [PubMed] [Google Scholar]
- 3.Alloway KD, Smith JB, and Watson GD (2014). Thalamostriatal projections from the medial posterior and parafascicular nuclei have distinct topographic and physiologic properties. Journal of neurophysiology 111, 36–50. [DOI] [PMC free article] [PubMed] [Google Scholar]
- 4.Orem J, Schlag-Rey M, and Schlag J (1973). Unilateral visual neglect and thalamic intralaminar lesions in the cat. Experimental Neurology 40, 784–797. [DOI] [PubMed] [Google Scholar]
- 5.Matsumoto N, Minamimoto T, Graybiel AM, and Kimura M (2001). Neurons in the thalamic CM-Pf complex supply striatal neurons with information about behaviorally significant sensory events. Journal of neurophysiology 85, 960–976. [DOI] [PubMed] [Google Scholar]
- 6.Van der Werf YD, Witter MP, and Groenewegen HJ (2002). The intralaminar and midline nuclei of the thalamus. Anatomical and functional evidence for participation in processes of arousal and awareness. Brain research. Brain research reviews 39, 107–140. [DOI] [PubMed] [Google Scholar]
- 7.Díaz-Hernández E, Contreras-López R, Sánchez-Fuentes A, Rodríguez-Sibrían L, Ramírez-Jarquín JO, and Tecuapetla F (2018). The thalamostriatal projections contribute to the initiation and execution of a sequence of movements. Neuron 100, 739–752. e735. [DOI] [PubMed] [Google Scholar]
- 8.Bradfield LA, and Balleine BW (2017). Thalamic Control of Dorsomedial Striatum Regulates Internal State to Guide Goal-Directed Action Selection. The Journal of neuroscience : the official journal of the Society for Neuroscience 37, 3721–3733. 10.1523/JNEUROSCI.3860-16.2017. [DOI] [PMC free article] [PubMed] [Google Scholar]
- 9.Bradfield LA, Bertran-Gonzalez J, Chieng B, and Balleine BW (2013). The Thalamostriatal Pathway and Cholinergic Control of Goal-Directed Action: Interlacing New with Existing Learning in the Striatum. Neuron. [DOI] [PMC free article] [PubMed] [Google Scholar]
- 10.Watson GD, Hughes RN, Petter EA, Fallon IP, Kim N, Severino FPU, and Yin HH (2021). Thalamic projections to the subthalamic nucleus contribute to movement initiation and rescue of parkinsonian symptoms. Science Advances 7, eabe9192. [DOI] [PMC free article] [PubMed] [Google Scholar]
- 11.Hughes RN, Watson GD, Petter EA, Kim N, Bakhurin KI, and Yin HH (2019). Precise Coordination of Three-Dimensional Rotational Kinematics by Ventral Tegmental Area GABAergic Neurons. Current Biology 29, 3244–3255. e3244. [DOI] [PMC free article] [PubMed] [Google Scholar]
- 12.Kim N, Li HE, Hughes RN, Watson GDR, Gallegos D, West AE, Kim IH, and Yin HH (2019). A striatal interneuron circuit for continuous target pursuit. Nature communications 10, 2715. 10.1038/s41467-019-10716-w. [DOI] [PMC free article] [PubMed] [Google Scholar]
- 13.Bartholomew RA, Li H, Gaidis EJ, Stackmann M, Shoemaker CT, Rossi MA, and Yin HH (2016). Striatonigral control of movement velocity in mice. The European journal of neuroscience 43, 1097–1110. 10.1111/ejn.13187. [DOI] [PubMed] [Google Scholar]
- 14.Boyden ES, Zhang F, Bamberg E, Nagel G, and Deisseroth K (2005). Millisecond-timescale, genetically targeted optical control of neural activity. Nature neuroscience 8, 1263–1268. [DOI] [PubMed] [Google Scholar]
- 15.Mahn M, Gibor L, Patil P, Cohen-Kashi Malina K, Oring S, Printz Y, Levy R, Lampl I, and Yizhar O (2018). High-efficiency optogenetic silencing with soma-targeted anion-conducting channelrhodopsins. Nature communications 9, 4125. 10.1038/s41467-018-06511-8. [DOI] [PMC free article] [PubMed] [Google Scholar]
- 16.Mandelbaum G, Taranda J, Haynes TM, Hochbaum DR, Huang KW, Hyun M, Venkataraju KU, Straub C, Wang W, and Robertson K (2019). Distinct cortical-thalamic-striatal circuits through the parafascicular nucleus. Neuron 102, 636–652. e637. [DOI] [PMC free article] [PubMed] [Google Scholar]
- 17.Minamimoto T, and Kimura M (2002). Participation of the thalamic CM-Pf complex in attentional orienting. Journal of neurophysiology 87, 3090–3101. 10.1152/jn.2002.87.6.3090. [DOI] [PubMed] [Google Scholar]
- 18.Minamimoto T, Hori Y, and Kimura M (2009). Roles of the thalamic CM-PF complex-Basal ganglia circuit in externally driven rebias of action. Brain research bulletin 78, 75–79. 10.1016/j.brainresbull.2008.08.013. [DOI] [PubMed] [Google Scholar]
- 19.Feger J, Bevan M, and Crossman A (1994). The projections from the parafascicular thalamic nucleus to the subthalamic nucleus and the striatum arise from separate neuronal populations: a comparison with the corticostriatal and corticosubthalamic efferents in a retrograde fluorescent double-labelling study. Neuroscience 60, 125–132. [DOI] [PubMed] [Google Scholar]
- 20.Sidibé M, Paré JF, and Smith Y (2002). Nigral and pallidal inputs to functionally segregated thalamostriatal neurons in the centromedian/parafascicular intralaminar nuclear complex in monkey. Journal of Comparative Neurology 447, 286–299. [DOI] [PubMed] [Google Scholar]
- 21.Sadikot AF, and Rymar VV (2009). The primate centromedian–parafascicular complex: anatomical organization with a note on neuromodulation. Brain research bulletin 78, 122–130. [DOI] [PubMed] [Google Scholar]
- 22.Stiles L, and Smith PF (2015). The vestibular–basal ganglia connection: Balancing motor control. Brain research 1597, 180–188. [DOI] [PubMed] [Google Scholar]
- 23.Taube JS (2007). The head direction signal: origins and sensory-motor integration. Annual review of neuroscience 30, 181–207. 10.1146/annurev.neuro.29.051605.112854. [DOI] [PubMed] [Google Scholar]
- 24.Barter JW, Li S, Sukharnikova T, Rossi MA, Bartholomew RA, and Yin HH (2015). Basal ganglia outputs map instantaneous position coordinates during behavior. Journal of Neuroscience 35, 2703–2716. [DOI] [PMC free article] [PubMed] [Google Scholar]
- 25.Kim N, Barter JW, Sukharnikova T, and Yin HH (2014). Striatal firing rate reflects head movement velocity. The European journal of neuroscience 40, 3481–3490. 10.1111/ejn.12722. [DOI] [PubMed] [Google Scholar]
- 26.Zhang J, Hughes RN, Kim N, Fallon IP, Bakhurin K, Kim J, Severino FPU, and Yin HH (2022). A one-photon endoscope for simultaneous patterned optogenetic stimulation and calcium imaging in freely behaving mice. Nature Biomedical Engineering, 1–12. [DOI] [PubMed] [Google Scholar]
- 27.Kravitz AV, Freeze BS, Parker PR, Kay K, Thwin MT, Deisseroth K, and Kreitzer AC (2010). Regulation of parkinsonian motor behaviours by optogenetic control of basal ganglia circuitry. Nature 466, 622–626. nature09159 [pii] 10.1038/nature09159. [DOI] [PMC free article] [PubMed] [Google Scholar]
- 28.Mouroux M, and Feger J (1993). Evidence that the parafascicular projection to the subthalamic nucleus is glutamatergic. Neuroreport 4, 613–615. [DOI] [PubMed] [Google Scholar]
- 29.Mouroux M, Hassani O-K, and Feger J (1995). Electrophysiological study of the excitatory parafascicular projection to the subthalamic nucleus and evidence for ipsi-and contralateral controls. Neuroscience 67, 399–407. [DOI] [PubMed] [Google Scholar]
- 30.Takakusaki K, Oohinata-Sugimoto J, Saitoh K, and Habaguchi T (2004). Role of basal ganglia–brainstem systems in the control of postural muscle tone and locomotion. Progress in brain research 143, 231–237. [DOI] [PubMed] [Google Scholar]
- 31.Barter JW, Castro S, Sukharnikova T, Rossi MA, and Yin HH (2014). The role of the substantia nigra in posture control. European Journal of Neuroscience 39 (9), 1465–1473. [DOI] [PubMed] [Google Scholar]
- 32.Friedman AD, and Yin HH (2022). Selective activation of subthalamic nucleus output quantitatively scales movements. bioRxiv. [DOI] [PMC free article] [PubMed] [Google Scholar]
- 33.Kimura M, Minamimoto T, Matsumoto N, and Hori Y (2004). Monitoring and switching of cortico-basal ganglia loop functions by the thalamo-striatal system. Neuroscience research 48, 355–360. [DOI] [PubMed] [Google Scholar]
- 34.Fan D, Rossi MA, and Yin HH (2012). Mechanisms of action selection and timing in substantia nigra neurons. The Journal of neuroscience : the official journal of the Society for Neuroscience 32, 5534–5548. 32/16/5534 [pii] 10.1523/JNEUROSCI.5924-11.2012. [DOI] [PMC free article] [PubMed] [Google Scholar]
- 35.Fan D, Rich D, Holtzman T, Ruther P, Dalley JW, Lopez A, Rossi MA, Barter JW, Salas-Meza D, Herwik S, et al. (2011). A wireless multi-channel recording system for freely behaving mice and rats. PLoS One 6, e22033. 10.1371/journal.pone.0022033 PONE-D-11–06511 [pii]. [DOI] [PMC free article] [PubMed] [Google Scholar]
Associated Data
This section collects any data citations, data availability statements, or supplementary materials included in this article.
Supplementary Materials
Video S1. 3D video of mouse tracking the reward spout. Related to Figure 1. Markers represent the left, right and top of the mouses head, and the arm extending above the moving spout.
Data Availability Statement
All data reported in this paper is located here: https://figshare.com/s/4afa6c3ab5185866b774.
This paper does not report original code.
Any additional information required to reanalyze the data reported in this paper is available from the lead contact upon request.