

Abstract
The adult zebrafish brain, unlike mammals, has a remarkable regenerative capacity. Although inflammation in part hinders regeneration in mammals, it is necessary for zebrafish brain repair. Microglia are resident brain immune cells that regulate the inflammatory response. To explore the microglial role in repair, we used liposomal clodronate or colony stimulating factor-1 receptor (csf1r) inhibitor to suppress microglia after brain injury, and also examined regeneration in two genetic mutant lines that lack microglia. We found that microglial ablation impaired telencephalic regeneration after injury. Microglial suppression attenuated cell proliferation at the intermediate progenitor cell amplification stage of neurogenesis. Notably, the loss of microglia impaired phospho-Stat3 (signal transducer and activator of transcription 3) and ß-Catenin signaling after injury. Furthermore, the ectopic activation of Stat3 and ß-Catenin rescued neurogenesis defects caused by microglial loss. Microglial suppression also prolonged the post-injury inflammatory characterized by neutrophil accumulation, likely hindering the resolution of inflammation. These findings reveal specific roles of microglia and inflammatory signaling during zebrafish telencephalic regeneration that should advance strategies to improve mammalian brain repair.
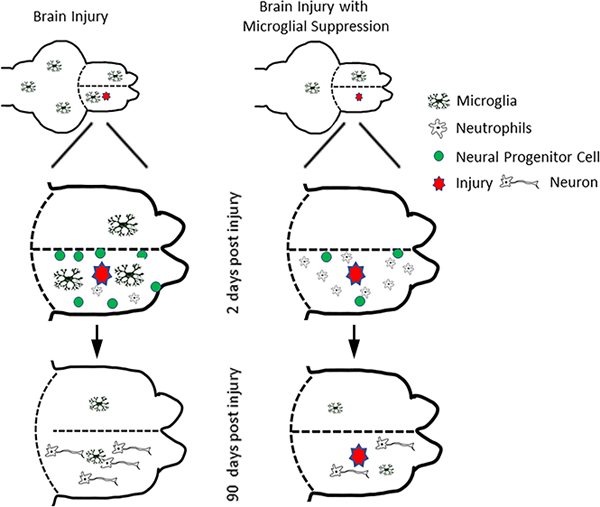
Graphical Abstract
1. Introduction
Unlike the limited regenerative capacity of the adult mammalian brain, zebrafish show robust repair after brain injury (Baumgart et al., 2012; Kishimoto et al., 2012; Kizil, Kaslin, et al., 2012; Kroehne et al., 2011; Kyritsis et al., 2012; März et al., 2011; Schmidt et al., 2014; Skaggs et al., 2014). This restorative capacity is not limited to brain as zebrafish are also used to model tissue regeneration in heart, retina, fin and spinal cord (Alunni & Bally-Cuif, 2016; Becker & Becker, 2008; Goldman, 2014; Poss et al., 2002; Sehring et al., 2016; Veldman et al., 2010). Although the reasons underlying the differential brain restorative responses between fish and mammals are unclear, one factor likely involves adult neurogenesis. The mammalian central nervous system (CNS) has ongoing adult neurogenesis mainly in two forebrain regions, the subventricular zone (SVZ) and the dentate gyrus (DG) of the hippocampal formation (Altman, 1969; Altman & Das, 1965). The adult neural stem cells (aNSCs) of the SVZ and DG generate new neurons that either fail to survive or do not replace dying neurons to achieve repair (Ming & Song, 2011; Parent et al., 2002; Peretto & Bonfanti, 2014).
The CNS of both mammals and zebrafish harbor radial glia that act as aNSCs. These cells are largely quiescent to maintain the aNSC pool (Alunni & Bally-Cuif, 2016; Baumgart et al., 2012; Kizil, Kaslin, et al., 2012; Skaggs et al., 2014). Unlike in mammals, fish aNSCs constitutively generate neurons in multiple regions for CNS expansion. Zebrafish aNSCs respond to CNS injury and cell death by proliferating to generate more neurons that, unlike in mammals, can restore lost tissue (Barbosa & Ninkovic, 2016; Barbosa et al., 2015; Cheung & Rando, 2013; Katz et al., 2016; Kroehne et al., 2011; Skaggs et al., 2014; Than-Trong & Bally-Cuif, 2015).
Another difference between mammals and zebrafish involves inhibitory factors in the mammalian CNS that block regeneration, such as those derived from reactive gliosis and non-CNS inflammatory cells (Fitch & Silver, 2008; Gerlach et al., 2016). Although, a recent report showed the presence of astrocyte-like cells in larval zebrafish spinal cord and midbrain (Chen et al., 2020), adult zebrafish do not have parenchymal astrocytes that induce glial scarring or express molecules that inhibit brain repair (Baumgart et al., 2012; Ghosh & Hui, 2016; Zambusi & Ninkovic, 2020; Zupanc & Sirbulescu, 2011). The CNS inflammatory response to injury also differs between mammals and zebrafish (Bosak et al., 2018). Mammalian inflammatory responses have been shown to play opposing roles in repair depending upon the injury context, and failure of inflammation resolution inhibits tissue regeneration in multiple CNS injury models (Ekdahl et al., 2003; Fitch & Silver, 2008; Iosif et al., 2006; Monje et al., 2003). In contrast, acute inflammation appears necessary for promoting regeneration after injury in zebrafish (Kyritsis et al., 2012). Inflammatory mediators implicated in the zebrafish CNS pro-regenerative response include: leukotrienes in brain (Kyritsis et al., 2012); tnfα (Nelson et al., 2013), interleukin (il) 6, il11 and leptin in retina (Wan et al., 2014; Zhao et al., 2014); and tnfα and Il1β in spinal cord (Tsarouchas et al., 2018).
Inflammation is a complex process involving various immune cell types and multiple signaling molecules secreted or induced by immune cells. The interaction between different immune cells also determines the outcome of the inflammatory process. As the resident macrophages of the CNS, microglia rapidly respond to brain injury and accumulate around the injury site. When activated, they secrete various cytokines and chemokines to attract other cell types and regulate inflammation (Ekdahl et al., 2009; Jin & Yamashita, 2016). Outside the CNS, macrophages are critical for regeneration of fin, spinal cord, and heart in zebrafish (Huang et al., 2012; Nguyen-Chi et al., 2015; Petrie et al., 2014; Sanz-Morejon et al., 2019). Macrophages/microglia influence both CNS development and the CNS inflammatory response. They are essential for larval and adult retinal neurogenesis (Goldman, 2014; Huang et al., 2012; White et al., 2017) and for retinal pigment epithelium (RPE) regeneration in zebrafish (Leach LL et al., 2021).
Several studies have shown a robust microglial accumulation after CNS injury in zebrafish (Baumgart et al., 2012; Kishimoto et al., 2012; Kyritsis et al., 2012; März et al., 2011; Schmidt et al., 2014; Skaggs et al., 2014). Prior work has shown that CNS regeneration is reduced by eliminating mpeg1-positive cells, by pharmacologically inhibiting the immune response, or in genetic mutants that lack an immune response (Kyritsis et al., 2012; Maria & David, 2022; van Ham et al., 2014). However, mpeg1 is not specific to microglia/macrophages, as it is also expressed in a subpopulation of B cells (Ferrero et al., 2020) and other lymphoid cells (Moyse & Richardson, 2020). Further, leukocyte elimination reduced brain regeneration in a neurodegenerative disease model in zebrafish (Bhattarai et al., 2016). In contrast, other work suggests that microglia (4C4 positive) are not necessary for murine axonal regeneration after optic nerve crush (Hilla et al., 2017) or spinal cord repair in zebrafish (Tsarouchas et al., 2018). Thus, the specific role of microglia and other inflammatory cell types, and the downstream signaling pathways that are most important for injury-induced brain regeneration in zebrafish remain unclear.
2. MATERIALS AND METHODS
2.1. Animal care and transgenic fish lines.
Fish were kept under standard conditions in accordance with guidelines and approval of the Institutional Animal Care & Use Committee at the University of Michigan as previously described (Skaggs et al. 2014). AB lines were used as wild type and the following transgenic lines or mutants were used in this study: Tg(gfap:GFP)(Kassen et al., 2007) and Tg(olig2:GFP) (provided by Bruce Appel, University of Colorado Denver (Park et al., 2007)), Tg(1016tuba1a:GFP) (Fausett & Goldman, 2006b), Tg(gfap:stat3-GFP) (Zhao & Goldman, 2014), Tg (ascl1a:GFP) (Wan et al., 2012), Tg(tcf7miniP:dGFP) (Shimizu et al., 2012), Tg(mpeg1:GFP) (F. Ellett et al., 2011) gl22, Tg(mpeg1:mcherry)(Felix Ellett et al., 2011) gl23, Tg(hsp70l:ascl1a) (Elsaeidi et al., 2018), Tg(her4.1:CreERT2) (Boniface et al., 2016), Tg(ß-actin2:loxP-mCherry-loxP-GFP) (Ramachandran et al., 2010), Tg(mfap4:dLanYFP-CAAX)(Walton et al., 2015), Tg(mfap4:TdTomato)(Walton et al., 2015) and irf8st95 (Shiau et al., 2015). The csf1r double mutant line was generated by crossing csf1raj4e1 (Parichy et al., 2000) and csf1rbre01 mutants (double mutant progeny are referred to as csf1rDM )(Oosterhof et al., 2018).
2.2. Generating transgenic zebrafish.
ß-Catenin activity is regulated by protein stability that is controlled by phosphorylation at Ser33, Ser37, Thr41 and Ser45 to tag it for degradation (V. S. Li et al., 2012; MacDonald et al., 2009). We created the constitutively active protein by mutating four sites (S33A, S37A, T41A and S45A) by site-directed mutagenesis to block their degradation (Baba et al., 2006; Barth et al., 1997). In Contrast, Stat3 phosphorylation at Y705 stimulates its activation by dimerization (Bromberg et al., 1999; Levy & Darnell, 2002). By forcing dimerization using cysteine substitutions in its carboxyl terminus (A662C and N664C), we created a constitutively active Stat3 C terminus that does not require Y705 phosphorylation. Tg(hsp70l:CA- ß-catenin) and Tg(hsp70l:CA-stat3) lines were created using standard recombinant DNA technology using Tol2 vector backbone. Expression constructs were injected into the embryo as previously described (Fausett & Goldman, 2006b).
2.3. Brain injury model, 4-hydroxy-tamoxifen (4-OH-TMX) treatment, RNA isolation and real-time PCR
The brain injury model and 4-OH-TMX treatment were performed as previously described by injecting -OH-TMX while inducing brain injury and then intraperitoneally (IP) once daily for two days (Skaggs et al., 2014). Male and female fish (6–8 months old) were used for the experiments in this study, unless reported otherwise. RNA was isolated from the telencephalon using RNeasy kit (Qiagen). Total RNA was used for cDNA synthesis using iScript kit and real-time qRT-PCR (quantitative real-time PCR) was done in triplicate with AB PowerSYBR green mix on an iCycler (Bio-Rad). The primers used for qRT-PCR are listed in Table 1.
Table 1.
Primers used in this study:
| Gene | Forward | Reverse |
|---|---|---|
| tnfα | TCACGCTCCATAAGACCCAG | GATGTGCAAAGACACCTGGC |
| il1b | ATGGCGAACGTCATCCAAGA | GAGACCCGCTGATCTCCTTG |
| il6 | GTTCAGCAGTATGGGGGAACTATCCG | GTCGTTCACCAGGACTGAGGTCAG |
| il12a | TGCCGCCAGATCTCTGCTCAG | CTGTGCTCTCCGGAGGCGATG |
| il11a | GAGAGAGGGAGACCAACTCTGGAG | CGAAGTCACTGGCTCTGCTGC |
| arg1 | GGGAATAATAGGCGCTCCGTTCTCC | GATGAGGTAAGACATCGGCTGGC |
| nos2 | CACACCTTCCCCAGATGACATGC | CATGCCCTTCATCTGTTCTCTGAGGG |
| il13 | TGGAAGCTGTGTTAGTCAATCCCCC | TCTTCTAGGTCTTCATCAGCAGCGTG |
| stat3 | GGAGCAGCTGTATCACCTGTACAGCG | GGACGTTGTTCTCCTGCAGGAAGC |
| socs3b | GCTTGACAGCGCCATGAGCAGC | CTGGGGGCTCGGAGCTCAGC |
| ascl1a | ATCCGCGCGCTGCAGCAGCTTCTGGACG | CGAGTGCTGATATTTTTAAGTTTCCTTTTAC |
| lin28a | TAACGTGCGGATGGGCTTCGGATTTCTGTC | ATTGGGTCCTCCACAGTTGAAGCATCGATC |
| myca | TTTCAGAGAGACTGGCGTCTTTGCACGCG | CTCATCCTCTTCTTCTTCATCTTCTGAATC |
| b-actin | CACTGAGGCTCCCCTGAATCCC | CGTACAGAGAGAGCACAGCCTGG |
2.4. Pharmacological experiments
Fish were treated with 500 nM PLX3397 (MedChem Express), a Csf1r inhibitor, delivered through fish water beginning 7 days before injury through 2 days after injury. The fish water was replaced daily during PLX3397 treatment, and the fish were fed every day for two hours. DMSO (0.05%) was used as the vehicle control for PLX3397 experiments.
2.5. Clodronate liposome and heat-shock treatment
A 2.5 μl solution containing 5 mg/ml liposomes carrying clodronate in PBS or PBS only (Liposoma Research) was injected into the right telencephalon during brain lesioning using a Hamilton syringe with a 30G needle. For tracking liposomes, we used a fluoro-liposome kit (Encapsula) in which liposomes carry a red fluorescent marker. The fluoro-liposome solution was delivered as described above and fluorescence was imaged in brain sections after fixation. Heat shock was done by immersing the fish in pre-heated water at 37 °C for 2 h followed by return to their regular temperature. The heat shock was done for 2 h periods three times per day for two days, after injury.
2.6. Tissue preparation and histological assays
Tissue preparation, immunohistochemistry, EdU (5-ethynyl-2’-deoxyuridine) labeling and TUNEL (Terminal deoxynucleotidyl transferase dUTP nick end labeling) were performed as described previously (Skaggs et al., 2014). Primary antibodies used were mouse anti (α)-4C4 (1:250, provided by Peter Hitchcock, University of Michigan, Ann Arbor), mouse α-glutamine synthetase (1:500, Chemicon MAB302), mouse α-HuC/D (1:250, Molecular Probes A-21271), rabbit α-GFP (1:2000, Molecular Probes A-11122), mouse α-chondroitin sulfate (1:50, Abcam AB11570), rabbit α-Gfap (1:250, Dako Z0334), rabbit α-Mpx (1:200), mouse α-mCherry (1:500), mouse α-PCNA (1:500 with antigen retrieval, Dako M087901), rabbit α-L-Plastin (1:1000, provided by Ji Feng, University of Edinburgh, UK) and rabbit α-Sox2 (1:500, Abcam AB97959). Secondary antibodies used were α-mouse or -rabbit Alexa Fluor 488-conjugate raised in goat (1:300, Invitrogen A-11001 or A-11008, respectively), and α-mouse or rabbit Alexa Fluor 594-conjugate raised in goat (1:300, Invitrogen A-11032 or A-11037, respectively). Bisbenzimide was used for nuclear staining.
2.7. Microscopy and quantification of immunohistochemistry
Images were obtained using a Leica DMI 6000B epifluorescence microscope equipped with a Hamamatsu digital camera or on an Olympus FLUOVIEW FV1000 inverted confocal microscope. Images were processed using ImageJ Fiji plugin. For stacked confocal images, light attenuation was adjusted using the Stack Contrast Adjustment plugin. For high-resolution confocal images, stitching was done using the Stitch Grid of Images plugin. All quantifications were done using a minimum of five brains per condition and averaging across at least five 12-µm sections per brain located approximately 60 µm apart. The observer was blinded to experimental condition for all image quantification. Any brightness or contrast changes were applied uniformly across all images for a given quantification. All normalizations to telencephalic area or VZ length were performed using ImageJ.
For calculating GFP intensity, images were quantified using Fiji software (Schindelin et al., 2012). Images were used to measure Raw Integrated Density of the selected region of interest after normalization of the background reading using three selected regions with no visible staining. The corrected fluorescence intensity was calculated using the following formula: Corrected total cellular fluorescence (CTCF) = Integrated density – (Area of selected cell x Mean fluorescence of background readings). The whole right or left hemi-telencephalon was selected to quantify the intensity, and multiple images at different depths of the section were included from a minimum of 5 different animals for quantification. The CTCF from the clodronate injured brain was compared to the control.
For microglial immunoreactivity, the average background grey value was multiplied by 1.5 and set as a threshold. Area past threshold stained for 4C4 was then normalized to total telencephalic area. The area of microglial immunoreactivity, EdU-positive cell numbers, TUNEL-positive cell numbers and counts of other immunoreactive cell numbers were all calculated using ImageJ software. For persistent tissue disruption at 60 or 90 dpl, bisbenzimide-stained tissues were scored in a blinded fashion for the presence of altered tissue morphology, such as a cavity or other tissue disruption consistent with a persistent lesion. To be conservative, only brains with obvious disruptions were counted, and all others were considered as fully regenerated.
2.8. Statistical analyses
All statistical analyses were conducted using GraphPad or Prism 8.0. ANOVA with Tukey’s post-hoc test, Chi-square and t-test were used where appropriate to analyze statistical difference between groups. All the experiments were done in triplicate and 5 animals per experiment were used, unless stated otherwise. All values are displayed as mean ± standard error of mean unless otherwise stated in the figure legends. In graphs, p-values are represented as follows: ns - not significant (p-value > 0.05); *, p-value ≤ 0.01; **, p-value ≤ 0.001; ***, p-value ≤ 0.0001.
3. RESULTS
3.1. Liposomal clodronate attenuates the microglial response to brain injury.
Brain injury induces microglial activation and inflammation in both the zebrafish and mammalian CNS. We previously found that injection of the excitotoxin quinolinic acid into the adult zebrafish telencephalon induced larger lesions and more microglial accumulation compared to vehicle injections, yet neurogenesis and repair were accelerated (Skaggs et al., 2014). This finding suggested a role for microglia in promoting brain repair and led us to explore post-injury inflammation in more detail, and to manipulate the microglial response in the setting of adult zebrafish telencephalic injury. We first generated a stab wound in the right telencephalon and analyzed cellular responses at different times after injury (Fig. 1a, b). The left (contralateral) telencephalon provided an internal uninjured control, and unlesioned fish provided additional controls. We used a macrophage reporter line that expresses green fluorescent protein (GFP) under the macrophage expressed gene 1 promoter, mpeg1:GFP, and 4C4 immunostaining to label microglia (GFP+, 4C4+) and macrophages (GFP+, 4C4-) after injury. The 4C4 antibody binds to a paralog of the Galectin 3 binding protein (Lgals3bpb) expressed selectively by microglia in the adult zebrafish brain (Rovira et al., 2022). We found that macrophages began to accumulate 2 hours post lesion (hpl), the increase in macrophages peaked at 1 day post lesion (dpl) and then macrophage numbers declined sharply at 2 dpl but remained significantly elevated compared to the control through 4 dpl (Figs. 1c, 1d and S1a). In contrast, ipsilesional 4C4/mpeg reporter double-labeled microglia began to accumulate slightly later at 16 hpl, the numbers peaked at 2 dpl, and then declined but remained significantly higher than in the uninjured brain at 3 dpl (Figs. 1c, 1d and S1a). The percentage of GFP+ cells that were co-labeled by the 4C4 antibody also peaked at 2 dpl (Fig. S1b). Less marked increases in GFP+/4C4- cells and GFP+/4C4+ cells with similar time courses were seen contralaterally compared to uninjured controls (Figs. 1c and S1a, c).
Figure 1. Liposomal clodronate suppresses activated microglia after telencephalic injury.
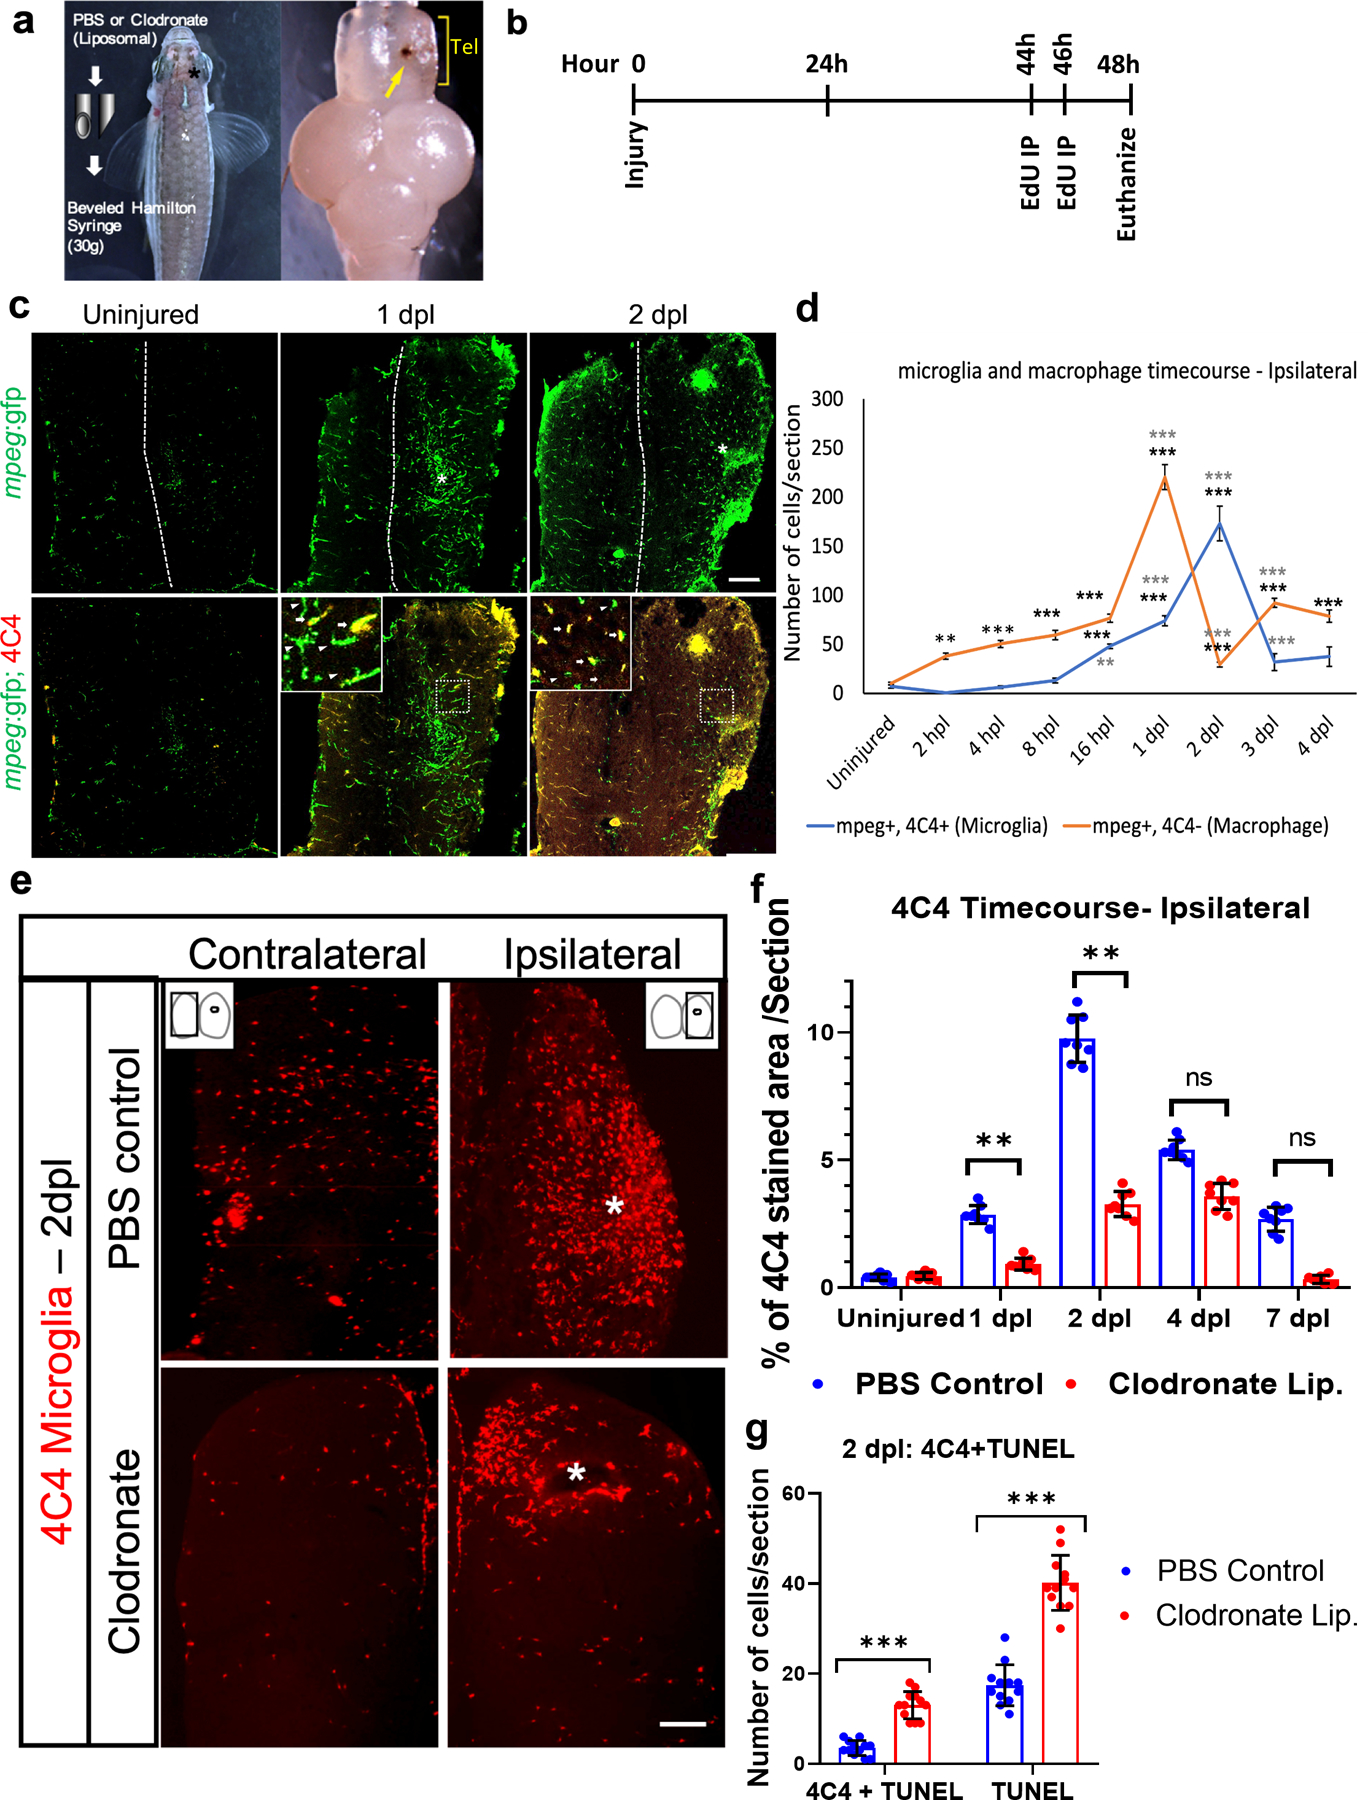
a. Description of the lesioning method and injury location in the right telencephalon (asterisk, left panel), and an example of a dissected zebrafish brain showing the injury (yellow arrow, right panel). Tel, telencephalon. b. Timeline of lesioning, EdU labeling and euthanasia for the 2-day time point. c. Microglial response after injury at 1 and 2 days post lesion (dpl) as measured by tg(mpeg:GFP) reporter expression alone (green, top panels) or after double-labeling with 4C4 antibody to identify activated microglia (red, bottom panels). The midline is indicated by the dotted lines and injured regions by asterisks in the top panels. d. Quantification of mpeg:GFP/4C4 double-positive microglia (blue line) or mpeg:GFP+/4C4- macrophages (red line) from 2 hours post lesioning (hpl) to 4 dpl. **, p<0.001 and ***, p<0.0001 by repeated measures ANOVA followed by Tukey’s post-hoc test. Comparisons for each curve were made between uninjured animals (the first points on the curve) and lesioned fish at each timepoint with statistical significance denoted by black asterisks, and between lesioned fish at a given timepoint versus the previous timepoint, with gray asterisks denoting significant differences. e. 4C4 immunolabeling at 2 dpl after injection of control (top panels) or clodronate (bottom panels) liposomes. * Indicates the site of injury. f. Quantification of 4C4+ microglia in the ipsilesional telencephalon at 1, 2, 4 and 7 dpl in control and clodronate groups. n=12, **, p<0.001 by repeated measure ANOVA with Tukey’s post-hoc test. g. Quantification of 4C4 and TUNEL labeling at 2 dpl in control and clodronate groups. ***, p<0.0001 by t-test. Scale bar = 10 µm for c and e; error bars indicate SEM for all graphs.
We next injected the phagocytic cell toxin liposomal clodronate at the time of brain lesioning to attenuate the microglial response. This eliminated about 80% of the activated (phagocytic) microglia compared to control (PBS-containing) liposomes by 1 dpl, and the significant decrease persisted at 2 dpl (Figs. 1e–f and S1d). We also found significantly reduced GFP+ cells in clodronate treated mpeg1:GFP fish at 2 dpl (Fig. S1e). The contralateral hemisphere did not show significant differences (Fig. S1f and g). Terminal deoxynucleotidyl transferase dUTP nick-end labeling (TUNEL) combined with 4C4 immunostaining showed more microglial cell death after liposomal clodronate injection compared to control liposomes (Figs. 1g, S1h–h‘), confirming that clodronate eliminates activated microglia efficiently in the first 2 dpl.
3.2. Microglia are necessary for injury-induced brain regeneration.
We next investigated the consequences of microglial ablation on brain repair by examining brain regeneration at 1, 2, 4, 7 and 90 dpl. Brains injected with clodronate or control liposomes were labeled with a nuclear stain (Bisbenzimide) at 90 dpl to assess brain repair. Remarkably, microglial ablation at the time of injury was sufficient to prevent brain repair as evidenced by the persistence of a lesion at 90 dpl in two-thirds of clodronate-treated fish, while control fish failed to show any signs of injury at 90 days (Fig. 2a–g). Quantification of the lesion size after injury provided further evidence that microglial ablation prevents brain repair (Fig. 2h). We also examined whether the lack of repair is associated with a glial scar that resembles those seen after mammalian brain injury. Accumulation of glial fibrillary acidic protein (GFAP) and chondroitin sulfate proteoglycan (CSPG) deposition at injury sites are hallmarks of a mammalian glial scar. Interestingly, we did not observe either of these characteristics in gfap:GFP reporter fish (Fig. 2i, j) or after CSPG immunolabeling (data not shown). These data corroborate previous findings that the zebrafish telencephalic parenchyma is devoid of astrocytes that give rise to glial scarring (Silver & Miller, 2004). Taken together, our findings suggest that microglia are necessary for successful regeneration, and the lack of regeneration after suppression of microglia does not induce a glial scar.
Figure 2. Microglial ablation inhibits brain regeneration.
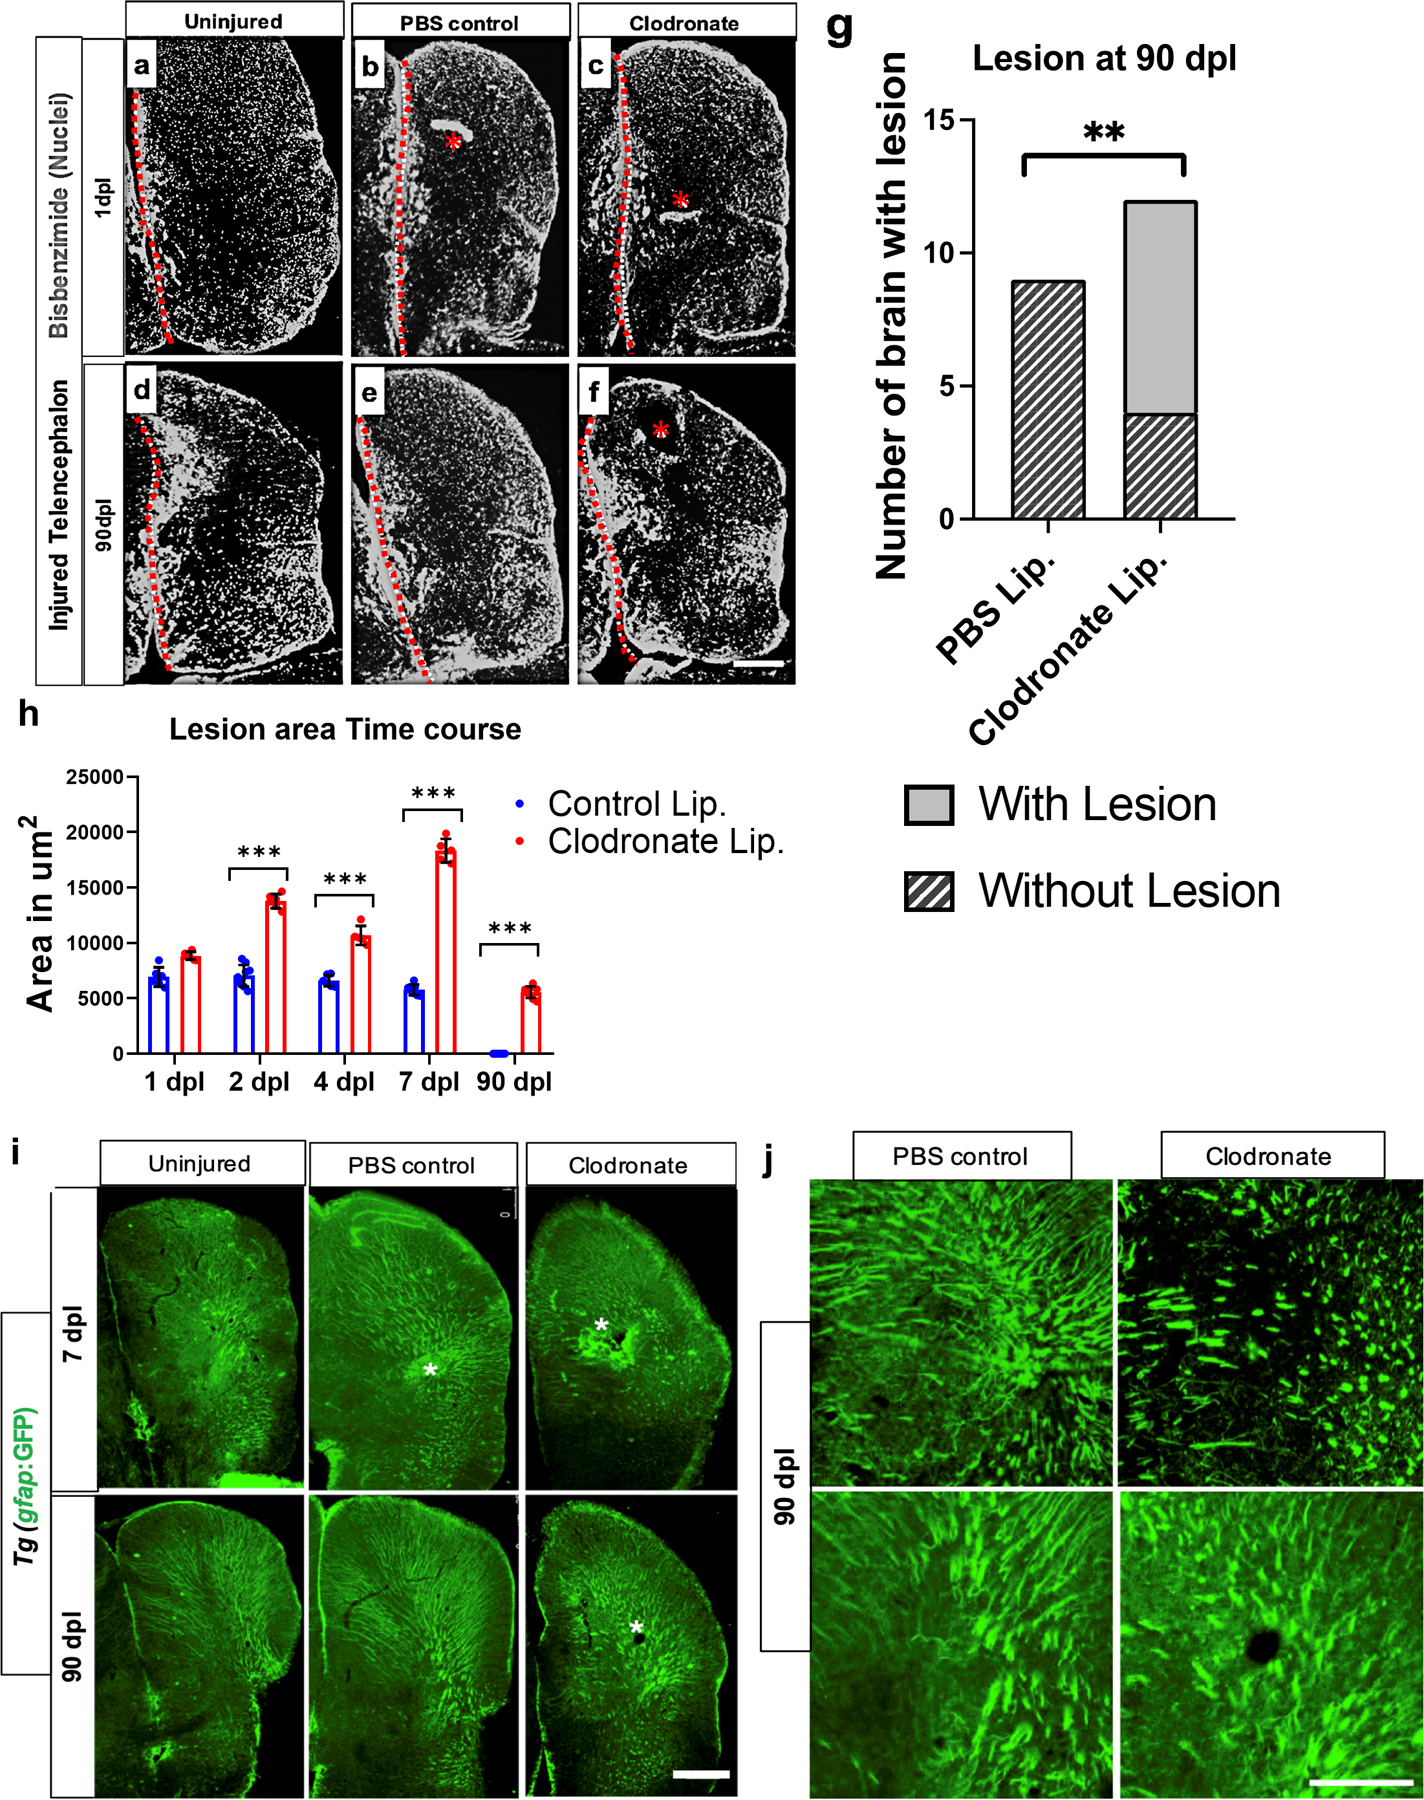
a-f. Nuclear staining with bisbenzimide in the right telencephalon at 1 (a-c) or 90 (d-f) dpl of uninjured (a, d), control lesioned (b, e) or clodronate-lesioned (c, f) fish. Asterisks in b, c and f denote acute (b, c) or residual (f) damage. The dotted line in each panel denotes the midline. g. Comparisons of the proportion of brains with or without residual damage at 90 dpl in control or liposomal clodronate groups. **, p = 0.003 by Chi-Square test. h. Quantification of lesion size in control and clodronate groups at different time points. ***, p<0.0001 by repeated measures ANOVA with Tukey’s post-hoc test. i. Tg(gfap:GFP) reporter expression to assess astrocytic hypertrophy or scar-like structures at 7 and 90 dpl. Asterisks show the lesioned area/residual damage. j. Higher magnification views of gfap-driven reporter expression in additional fish from the 90 dpl injured control and clodronate groups. Scale bars = 100 µm.
3.3. Microglia are essential for injury-induced adult neurogenesis.
Because microglial ablation impairs brain regeneration, we next sought to determine whether the lack of repair results from a decrease in adult neurogenesis. We performed pulse-chase labeling with EdU on day 2 after injury and identified new neurons by double labeling for EdU and the neuronal marker HuC/D at 14 or 21 dpl. We found a 50% decrease in the number of EdU+ and HuC/D+ co-labeled cells at 14 and 21 dpl in brains exposed to clodronate compared to controls (Fig. 3a–d). The decrease in neurogenesis was associated with a similar percentage decrease in overall cell proliferation (Figs. 3d and S2a), indicating that neuronal differentiation was not impaired. The contralateral telencephalon did not show any significant differences at either time point (Fig. S2a–c). Thus, our data indicate that suppressing microglia attenuates injury-induced adult neurogenesis, which likely contributes to impaired brain regeneration.
Figure 3. Microglial suppression impairs injury-induced adult neurogenesis.
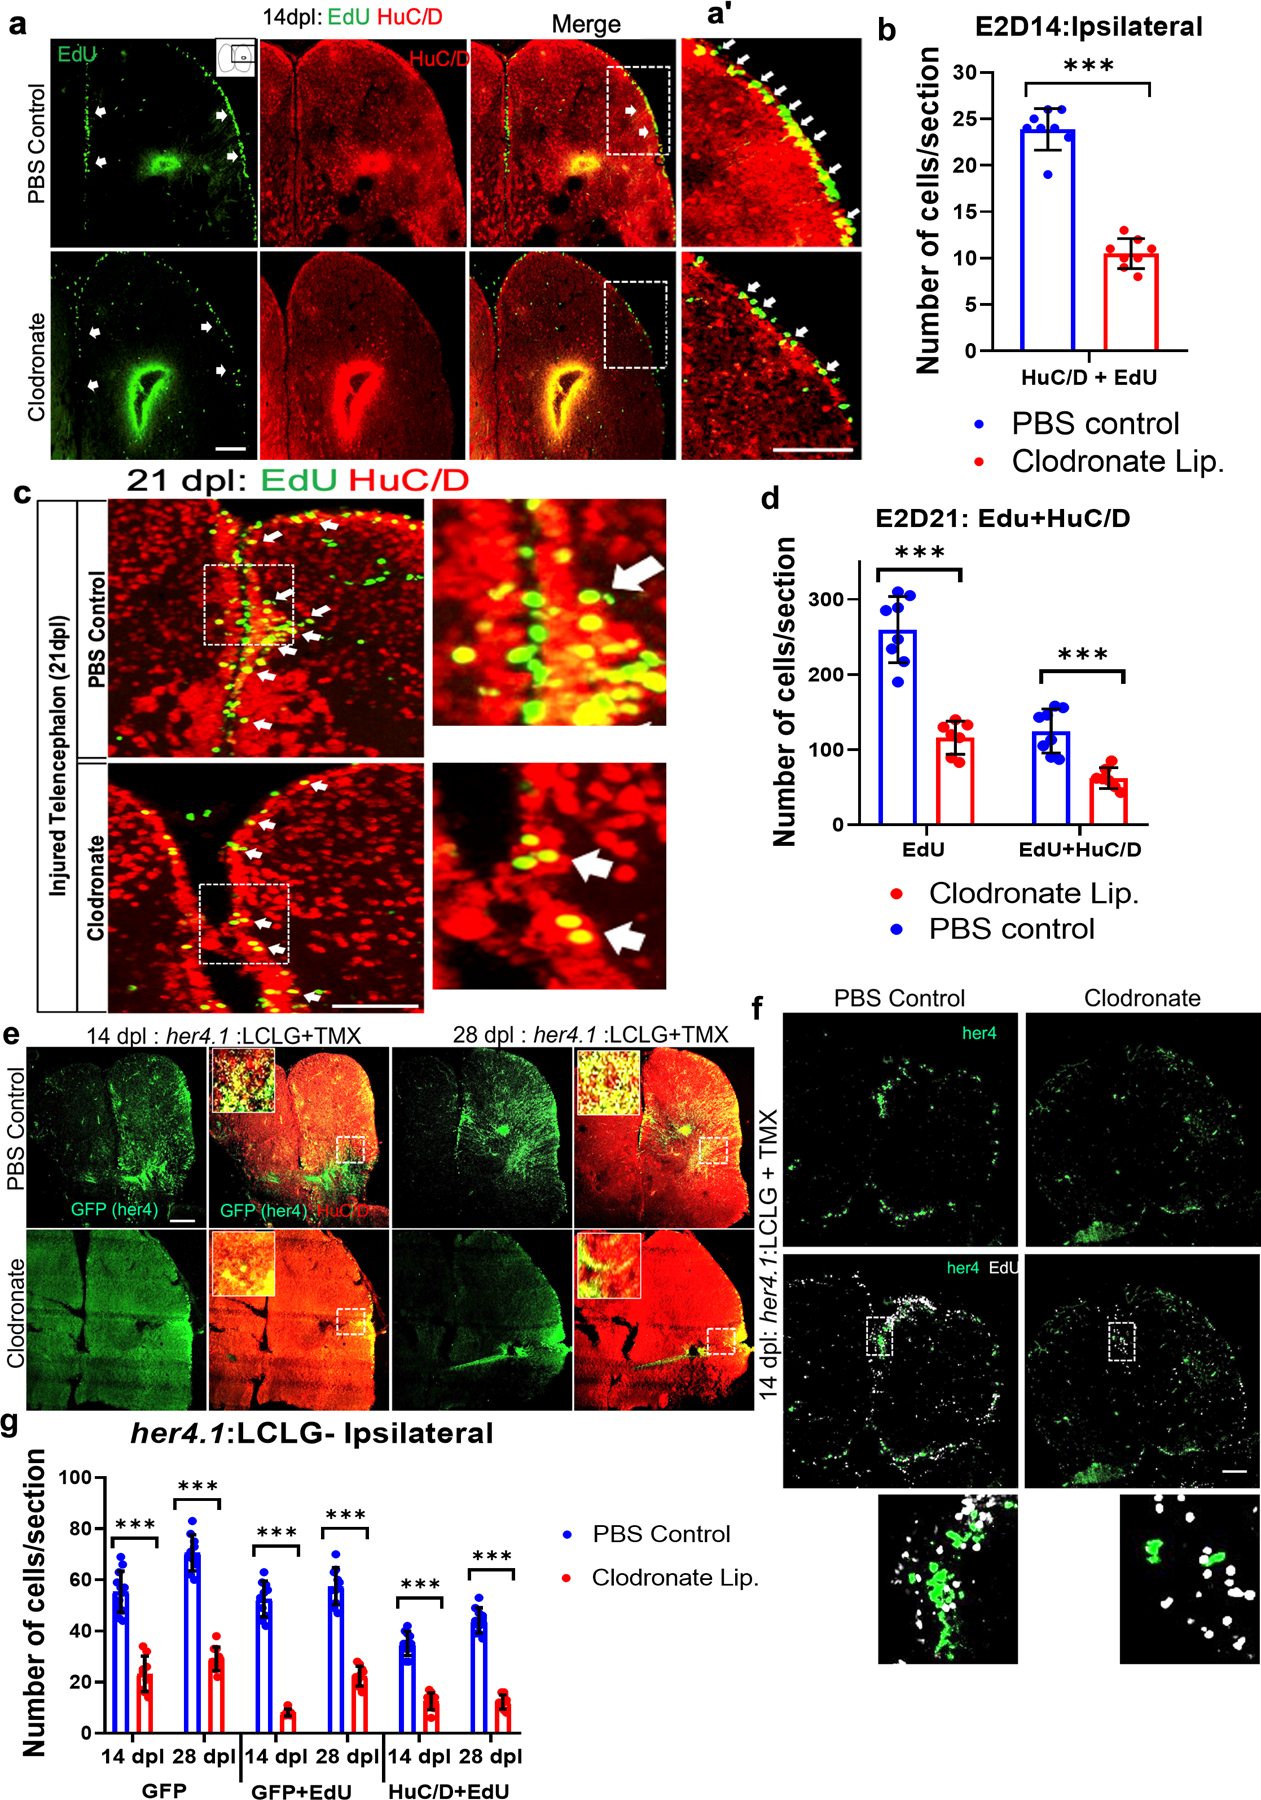
a. Confocal images of EdU staining, HuC/D immunolabeling and double labeling for EdU and HuC/D in the injured hemi-telencephala at 14 dpl after EdU administration at 2 dpl from control (top row) and clodronate injected (bottom row) brains. The arrows denote EdU+ cells in VZ regions. a’. Higher magnification images of the boxed regions in a. Note more double-labeled cells (arrows) are present in the control (Lam et al.) than the clodronate-treated fish (bottom). The strong signal at the injury site is non-specific labeling of damaged brain. b. Quantification of EdU and HuC/D double labeling at 14 dpl. ***, p<0.0001 by t-test. c. Confocal images of EdU and HuC/D double labeling in telencephala at 21 dpl (EdU was given at 2 dpl). Right panels show higher magnification views of the boxed regions, and the arrows indicate double labeled cells. d. Quantification of EdU+ cells (green) and cells co-labeled for EdU and HuC/D (magenta outline) in injured hemi-telencephala at 21 dpl (EdU was given at 2 dpl) shows proportionally fewer cells in the clodronate-treated group. **, p<0.001 for EdU only; and ***, p<0.0001 for double-labeled cells. e. Confocal images of her4.1(GFP) and HuC/D labeling of telencephala at 14 dpl (left 4 panels) or 28 dpl (right 4 panels) from fish treated with control (top row) or clodronate (bottom row) liposomes show decreased GFP labeling and double-labeled cells in the clodronate group. Insets at right in double-labeled panels show higher magnification views of the boxed areas. f. Confocal images of telencephala show decreased labeling for her4.1-GFP and EdU in the clodronate-treated fish at 14 dpl. The bottom panel shows a higher magnification view of double-labeled cells in the control. 4-OH-TMX was given at the time of lesioning for both f and g, and EdU was administered at 2 dpl. g. Quantification of her4.1-GFP, her4.1-GFP/EdU co-labeling and her4.1-GFP/HuC/D co-labeling at 14 and 28 dpl. *** p<0.0001. Scale bars = 100 µm for all image panels and the error bars indicate SEM.
her4.1 is a Notch regulated gene selectively expressed by proliferating radial glia in zebrafish (Kroehne et al., 2011; Skaggs et al., 2014). To lineage trace radial glial stem cell progeny, we used a double transgenic line consisting of Tg(her4.1:CreERT2) and Tg(ß-actin2:loxp-mCherry-loxp-GFP), referred to as (ß-actin2:LCLG) (Ramachandran et al., 2010). We induced recombination by injecting 4-OH-TMX both IP and directly into the brain during the injury to increase recombination efficiency. GFP+ cells were quantified at 2, 14 or 28 dpl in both control liposome- and clodronate liposome-injected fish. We observed some GFP expression in the VZ on day 1 that increased by 2 dpl (Fig. S2e). By day 14, GFP-positive cell numbers increased further, and the cells appeared at the injury zone to a much greater extent in controls than in the clodronate group (Fig. 3e, g). Fish not receiving 4-OH-TMX or the contralesional telencephalon after 4-OH-TMX injection did not display substantial numbers of GFP+ cells after injury (Fig. S2d and f).
To investigate whether microglial ablation affected the proliferation of her4-GFP lineage-traced cell progeny, we injected EdU at 2 dpl and quantified GFP/EdU double-labeled cells after 14 or 28 days. We observed that proliferating her4-positive cell progeny decreased significantly with clodronate treatment vs. controls by 14 and 28 dpl in the ipsilesional hemisphere (Fig. 3f, g), with no difference between groups in the contralateral hemisphere (Fig. S2f). To determine whether clodronate lesioning influenced the differentiation of her4+ radial glial cell progeny into neurons, we assayed GFP-positive cells for co-expression of the neuronal marker HuC/D at 14 or 28 dpl. As expected, we found that clodronate injected fish had significantly reduced GFP and HuC/D double-positive cells on the side of the injury (Fig. 3e, g), while the contralateral hemisphere showed no difference (Fig. S2f). These results further support the idea that microglia are critical for injury-induced neurogenesis.
3.4. Microglial suppression with clodronate impairs injury-induced aIPC, but not aNSC, proliferation.
The radial glial aNSCs in the VZ proliferate in response to injury. Because we found that microglial ablation impairs regeneration, we asked whether microglia are necessary for aNSC proliferation after injury. We first examined overall cell proliferation and found that microglial ablation did not change cell proliferation at 1 dpl but significantly reduced total proliferating (EdU pulse-labeled) cells in the ipsilesional hemisphere of clodronate injected brains compared to controls at 2 dpl (Fig. 4a, b). Interestingly, proliferation subsequently increased in the clodronate group at 4 and 7 dpl (Fig. 4b), suggesting that suppressing microglia early after brain injury either delays the peak of the injury-induced progenitor proliferative response or the finding reflects proliferation of other cell types, such as immune cells. No significant differences between groups were seen contralaterally at any timepoint (Fig. S2g, h). Further analyses revealed that the reduced proliferation in the clodronate group at 2 dpl was not seen in the VZ but was limited to the SVZ plus parenchymal regions (Fig. S2i, j). In contrast, the later increase in cell proliferation at 4 and 7 dpl in the clodronate injected brains was seen mainly in the SVZ plus parenchymal regions on day 4, and in all 3 areas on day 7 (Fig. S2i, j).
Figure 4. Microglia are dispensable for adult neural stem cell proliferation.
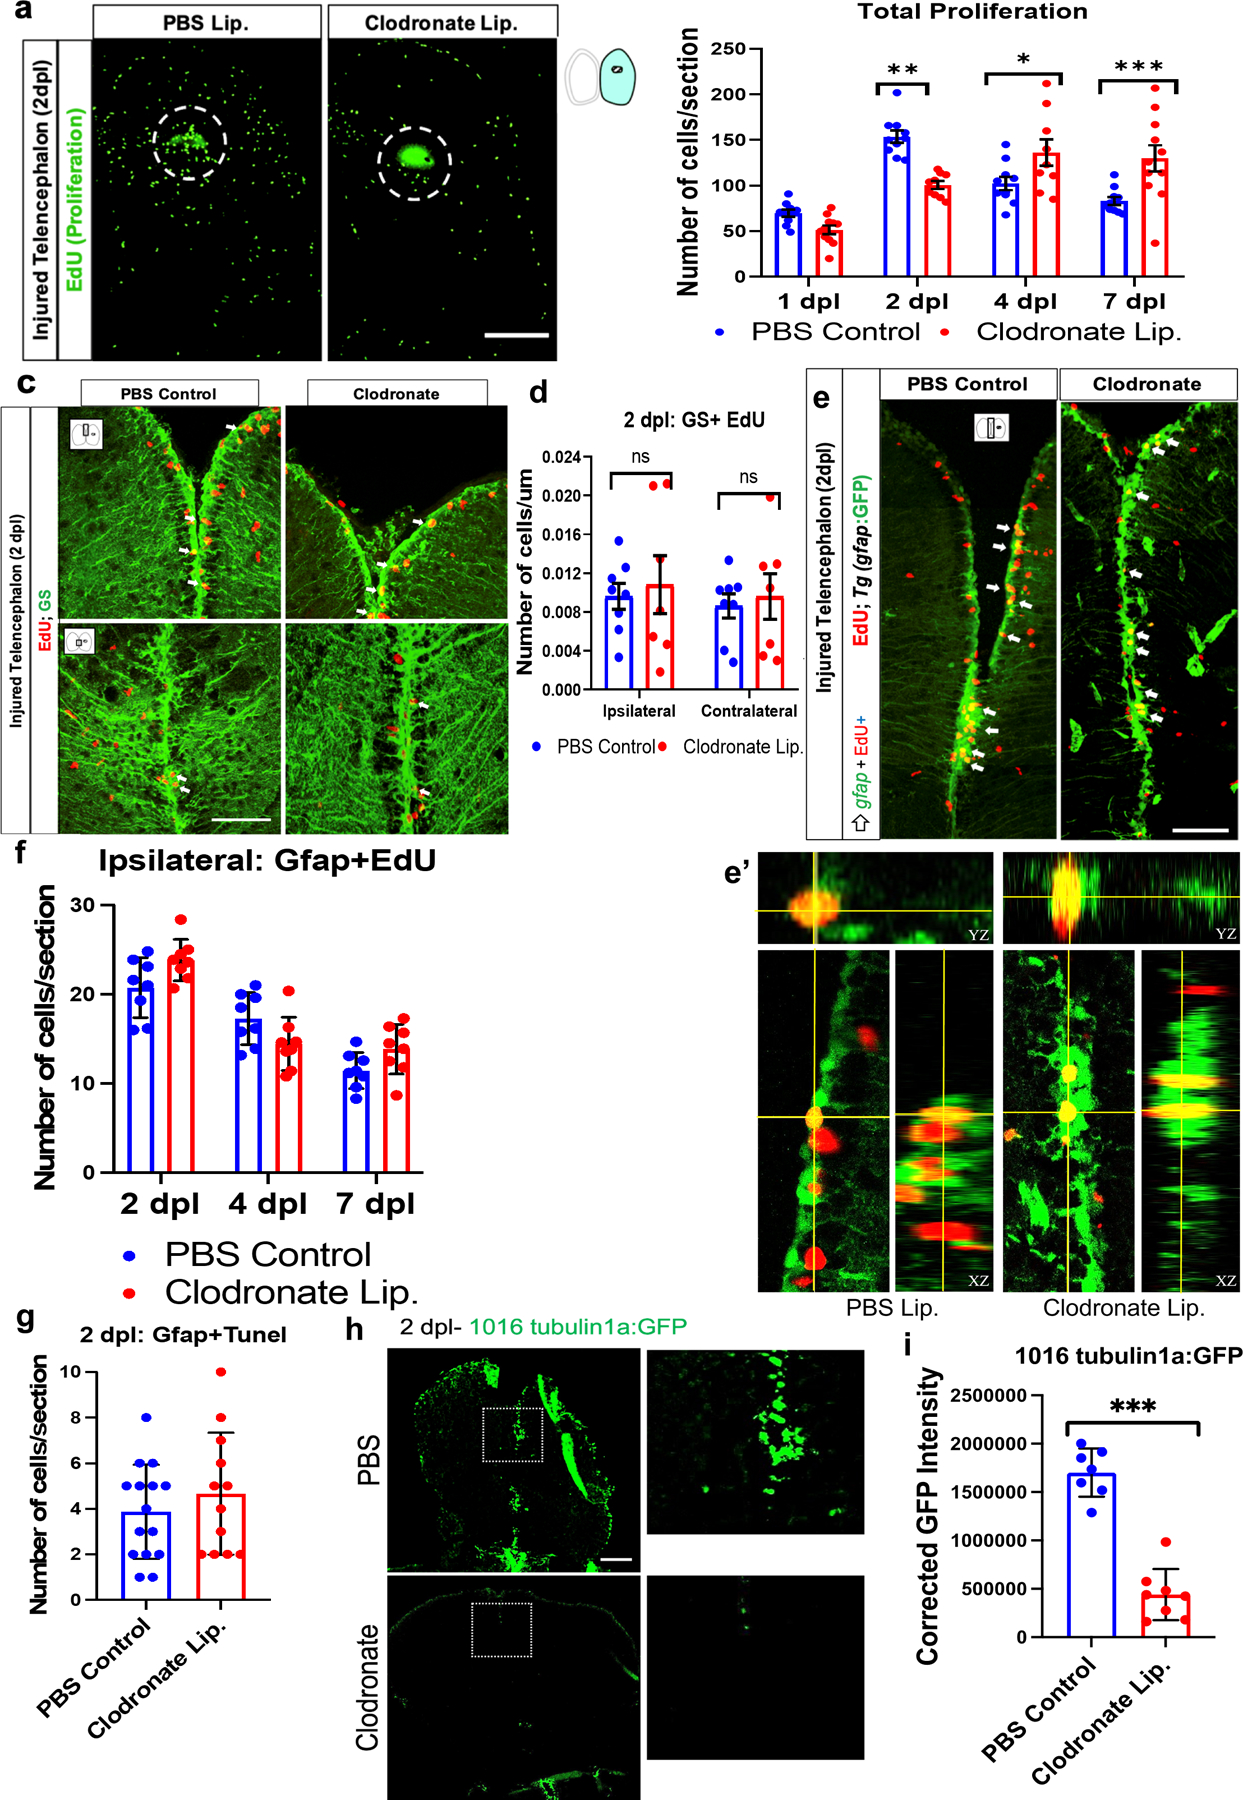
a. EdU labeling of the ipsilesional telencephalon of control or clodronate injected brains at 2 dpl. The dashed circle marks the injury site. The strong green stain at the poke site is non-specific labeling of injured tissue. b. EdU quantification in the ipsilesional telencephala at 1, 2, 4 and 7 dpl. n=8/group/timepoint, ***, p<0.0001; **, p<0.001; *, p<0.01, repeated measures ANOVA with Tukey’s post-hoc test. c. Confocal images of Glutamine synthetase (GS) and EdU co-immunolabeling at 2 dpl showing anterior (top row) and more posterior (bottom row) telencephalic regions. The small cartoon insets show the image location in the telencephalon. d. Quantification of double labeling for GS and EdU in both ipsilesional and contralateral telencephalic hemispheres. e. Confocal images of gfap-driven GFP reporter and EdU co-labeling of midline telencephala at 2 dpl from clodronate and control liposome-treated fish. Arrows indicate double labeled cells. e’. Orthogonal views of single optical sections from z-stacks of GFP and EdU labeling for colocalization. f. Quantification of ipsilesional Gfap/EdU co-labeled cells at 2, 4 and 7 dpl at the ventricular zone revealed no significant differences between groups. g. Quantification of VZ gfap-driven GFP reporter/TUNEL double-positive cells at 2 dpl showed no significant difference between groups. h. GFP-labeled images of telencephala from a 1016tuba1a-GFP reporter line at 2 dpl after injection of control or clodronate liposomes. Note the marked reduction of GFP in the clodronate-treated fish. The boxed areas are shown at higher magnification in the right panels. i. Quantification of relative corrected total cell fluorescence (CTCF) intensity of 1016tuba1a-GFP reporter expression. ***, p<0.0001. Scale bars = 100 µm in all image panels, and the error bars indicate SEM.
To specifically investigate if injury-induced aNSC proliferation is affected, we quantified EdU pulse-labeled cells that co-expressed the aNSC markers glutamine synthetase (Gs) or Gfap. We first examined EdU and Gs co-expression and surprisingly found that clodronate lesioning did not significantly alter aNSC proliferation at 2 dpl (Fig. 4c, d). Similarly, no difference in proliferating aNSCs labeled with the Tg(gfap:GFP) reporter line were present at 2 dpl (Fig. 4e, e’ and f). We also found no significant increase in EdU/Gfap double-labeled cells vs. controls at 4 and 7 dpl (Fig. 4f). Given the lack of changes in aNSC proliferation at 2 dpl, it is unlikely that clodronate induced aNSC death. Consistent with this idea, no significant difference arose in VZ Gfap/TUNEL double-labeled cells between control and clodronate groups (Figs. 4g, S3a). Moreover, fluorescently labeled control liposome injection during injury revealed that the liposomes minimally crossed the midline to the contralateral side, and they appeared to be only rarely taken up by aNSCs (Fig. S3b–c). As predicted, we observed that most fluorescent liposomes were observed within or adjacent to mpeg1-GFP-positive microglia/macrophages (Fig. S3d), consistent with the idea that clodronate liposomes are specifically taken up by these phagocytic cells. Together, these findings indicate that microglial suppression with clodronate does not attenuate aNSC proliferation and suggest that clodronate does not induce aNSC death.
Given the lack of changes in aNSCs after clodronate treatment, we next examined if clodronate affected the aNSC-derived progenitors in the VZ/SVZ. For this, we first took advantage of tg(1016tuba1a:GFP) transgenic fish that restrict GFP expression to injury activated/proliferating aNSCs and their neuronal progenitor progeny in the developing and regenerating CNS (Fausett & Goldman, 2006a; Senut et al., 2004; Skaggs et al., 2014). In the uninjured brain, GFP expression is minimal and localizes to a few cells in the VZ (data not shown); by day 2 after injury, however, strong VZ GFP expression is induced (Fig. 4h). We quantified GFP fluorescence intensity in clodronate-treated vs. control lesioned brains and found significantly reduced GFP expression in the clodronate group (Figs. 4h, I). This finding indicates that microglia are necessary for inducing injury responsive promoter activity like that seen in retina regeneration and implies that injury-induced progenitor cell expansion is impaired after microglial suppression (Goldman & Ding, 2000; Goldman et al., 2001).
To directly examine proliferation in non-radial glial progenitors, we assayed EdU incorporation in Gfap-negative (Gfap−) progenitors in the VZ/SVZ. We found a 30% decrease in Gfap−/EdU+ cells in the VZ/SVZ of clodronate-injected brains (Fig. 5a, b). We asked whether the Gfap− dividing cells that are decreased by microglial ablation comprise the Sox2-positive aIPC population. We quantified Sox2/EdU double-labeled cells at 2 dpl and found that the clodronate-treated group had a greater than 50% reduction in proliferating Sox2+ cells (Figs. 5c, c’ and d), likely accounting for the reduction in Gfap-negative cell proliferation. Furthermore, Sox2+ aIPC proliferation remained suppressed at 4 and 7 dpl (Figs. 5d, S3e), and the total number of Sox2+ cells was significantly decreased in the clodronate group at both 2 and 4 dpl (Fig. 5e, f). To explore whether the reduction of total Sox2-labeled aIPCs reflected progenitor cell death, we used TUNEL staining and found no significant difference in the small numbers of Sox2/TUNEL double-positive cells between control and clodronate groups (Figs. 5g, S3f). Together, these findings indicate that microglial ablation reduces the post-injury aIPC population through reduced expansive proliferation of Sox2+ aIPCs.
Figure 5. Microglial ablation impairs injury-induced amplifying intermediate progenitor cell (aIPC) expansion.
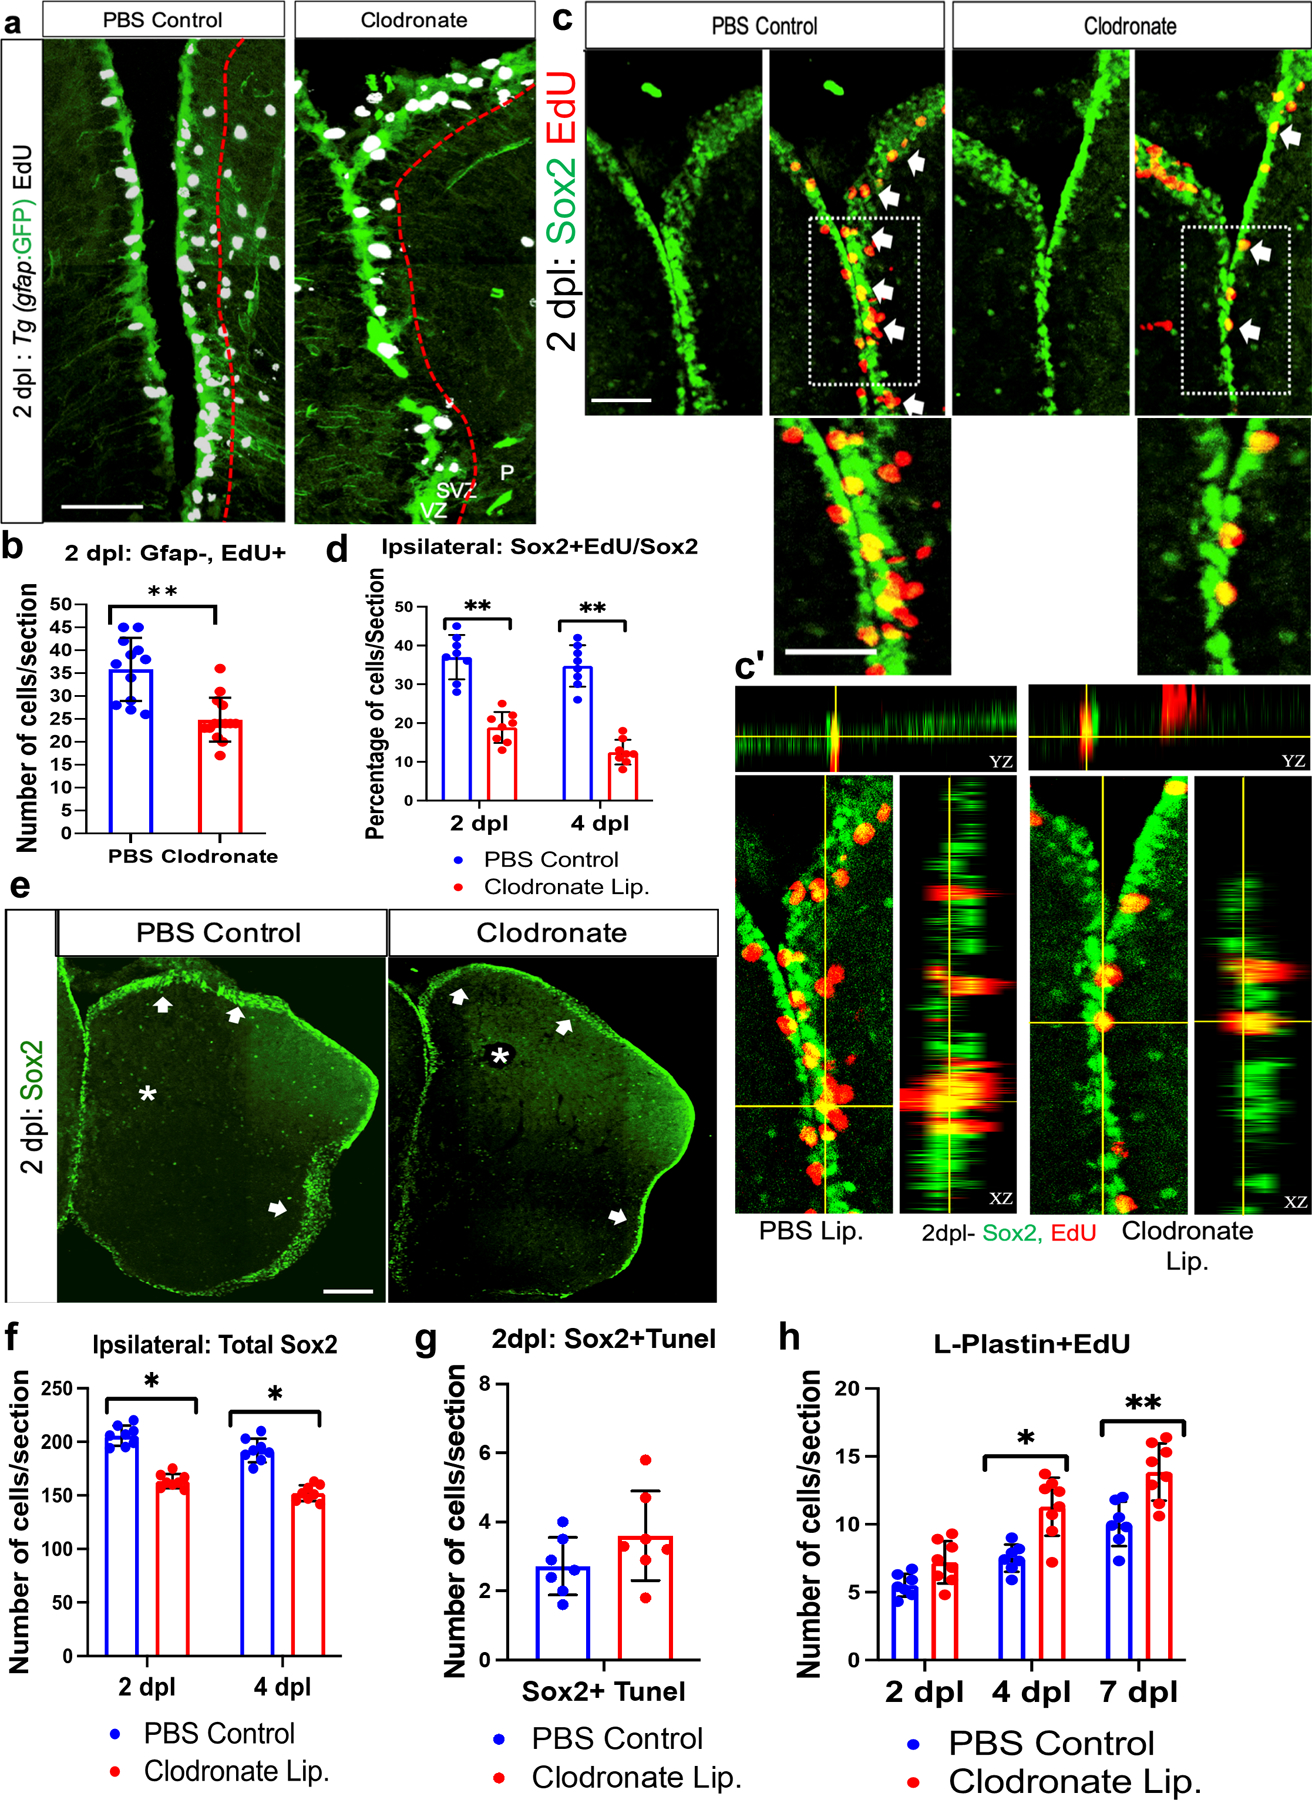
a. Confocal images of midline telencephalic sections from clodronate and control liposome injected fish double labeled for a gfap-driven GFP reporter (green) and EdU (white) at 2 dpl. The dashed red lines divide the VZ + SVZ (left of the lines) from the parenchyma (P). b. Quantification of gfap-driven GFP reporter-negative/EdU-positive cells at 2 dpl in the VZ plus SVZ. **, p<0.001 by t-test. c. Confocal images of double labeling for Sox2 (green) and EdU (red) at 2 dpl in the VZ+SVZ at the midline telencephalon. Arrows indicate double-positive cells, and the boxed areas are shown at higher magnification below. c’. Orthogonal views of single optical sections from z-stack images of Sox2 and EdU labeling. d. Quantification of percentages of Sox2+ cells that co-labeled with EdU in the ipsilesional telencephalon at 2 and 4 dpl. **, p<0.001 by t-test. e. Sox2 immunolabeling of lesioned control liposome and clodronate liposome treated fish telencephala at 2 dpl. Arrows indicate labeled progenitor cells in the VZ/SVZ and asterisks denote the damaged regions. f. Quantification of Sox2-labeled cells in control and clodronate injured brains at 2 and 4 dpl. *, p<0.01 by t-test. g. Quantification of Sox2/TUNEL co-labeled cells at 2 dpl in control and clodronate groups. h. Quantification of L-Plastin and EdU double-labeled cells at 2, 4 and 7 dpl in control and clodronate injected groups revealed significantly increased double-labeled cell numbers in the clodronate group at 4 and 7 dpl. **, p<0.001; *, p<0.01. Scale bar = 100 µm for all image panels except 50 µm for the higher magnification images in panel c; error bars indicate SEM.
We next explored whether clodronate treatment influenced the proliferation of non-progenitor populations in the brain parenchyma by double-labeling for EdU and other cell-type specific markers. We found no difference in the percentage of proliferating 4C4+ microglia at 2 dpl (Fig. S4a, b), albeit with fewer total numbers of activated microglia in the clodronate group (Fig. 1f). The percentage of proliferating microglia also showed no significant difference at 4 or 7 dpl (Fig. S4b). Similarly, we did not observe any significant difference in olig2+ oligodendrocyte proliferation or cell death in clodronate-injected vs. control fish (Fig. S4c–e). Interestingly, the clodronate group displayed significantly increased proliferation of L-plastin-positive leukocytes at 4 and, to an even greater extent, 7 dpl (Fig. 5h). The increase in leukocyte proliferation on days 4 and 7 may explain in part the increased overall cell proliferation at these timepoints in the clodronate group (Fig. 4b), especially in the parenchymal region. Together, our findings show that microglial suppression attenuates aIPC expansion and stimulates leukocyte proliferation after brain injury.
3.5. Pharmacological and genetic depletion of microglia impair the brain injury-induced regenerative response.
To provide further evidence that the clodronate effects on regeneration resulted from microglial ablation, we used a pharmacological csf1r inhibitor, PLX3397, to examine the effects of suppressing microglia on telencephalic injury-induced inflammation and cell proliferation. PLX3397 treatment markedly reduced 4C4- and L-Plastin-immunoreactive cells at 2 dpl compared to vehicle-treated fish (Fig. S5a, c, g, h). We next quantified the number of proliferating cells with EdU and found a significant reduction in PLX3397-treated fish (Fig. S5b, c). As expected, the overall numbers of 4C4-, L-Plastin- and EdU-labeled cells were lower in the contralateral hemispheres and showed similar percentage reductions after PLX3397 exposure (Fig. S5e, f). PLX3397 treatment also significantly reduced aIPC proliferation at 2 dpl and neurogenesis at 28 dpl (S5i, j). The contralateral hemispheres showed similar differences, albeit with lower overall numbers (Fig. S5k, l).
We then validated both clodronate and PLX3397 data with two different genetic mutants that are devoid of microglia. Interferon-8 (irf8st95/st95, referred as irf8−/−) is essential for microglial specification and the mutants show very few microglia and an increase in neutrophils (Li et al., 2011; Shiau et al., 2015), while colony stimulating factor 1 receptor (csf1ra&b) is necessary for microglial development, colonization and survival (Oosterhof et al., 2018). Here we used irf8−/− homozygous and irf8+/− heterozygous mutants as experimental and control groups, respectively, and a csf1rDM (double mutant) line that is mutant for both csf1ra and csf1rb. Both irf8 loss of function and csf1rDM fish lines showed very few microglia in the uninjured brain, and a drastic reduction in microglia and EdU-positive proliferating cells after injury compared to control lines (Fig. 6a–e). Importantly, irf8 mutants and PLX3397-treated fish show failure to repair the injured tissue at 60 dpl compared to controls (Fig. S4f), similar to what we found at 90 days in clodronate treated fish (Fig. 2a–g). We also found that both mutants show significantly reduced Sox2-positive progenitor proliferation at 2 dpl and significantly reduced HuC/D and EdU double-positive cells at 21 dpl (Fig. 6f, S4g), confirming the clodronate result. Interestingly, unlike after clodronate, the mutants and PLX3397-treated fish also showed reduced Gfap+/EdU+ cells, likely due to the fact that they already lack microglia at the time of injury compared to wild type fish treated with clodronate. Together with the findings from the clodronate-mediated microglial suppression experiments, these results support a strong pro-regenerative role of microglia after telencephalic injury.
Figure 6. Reduced injury-induced proliferation after genetic depletion of microglia, and persistent macrophages after clodronate suppression of microglia.
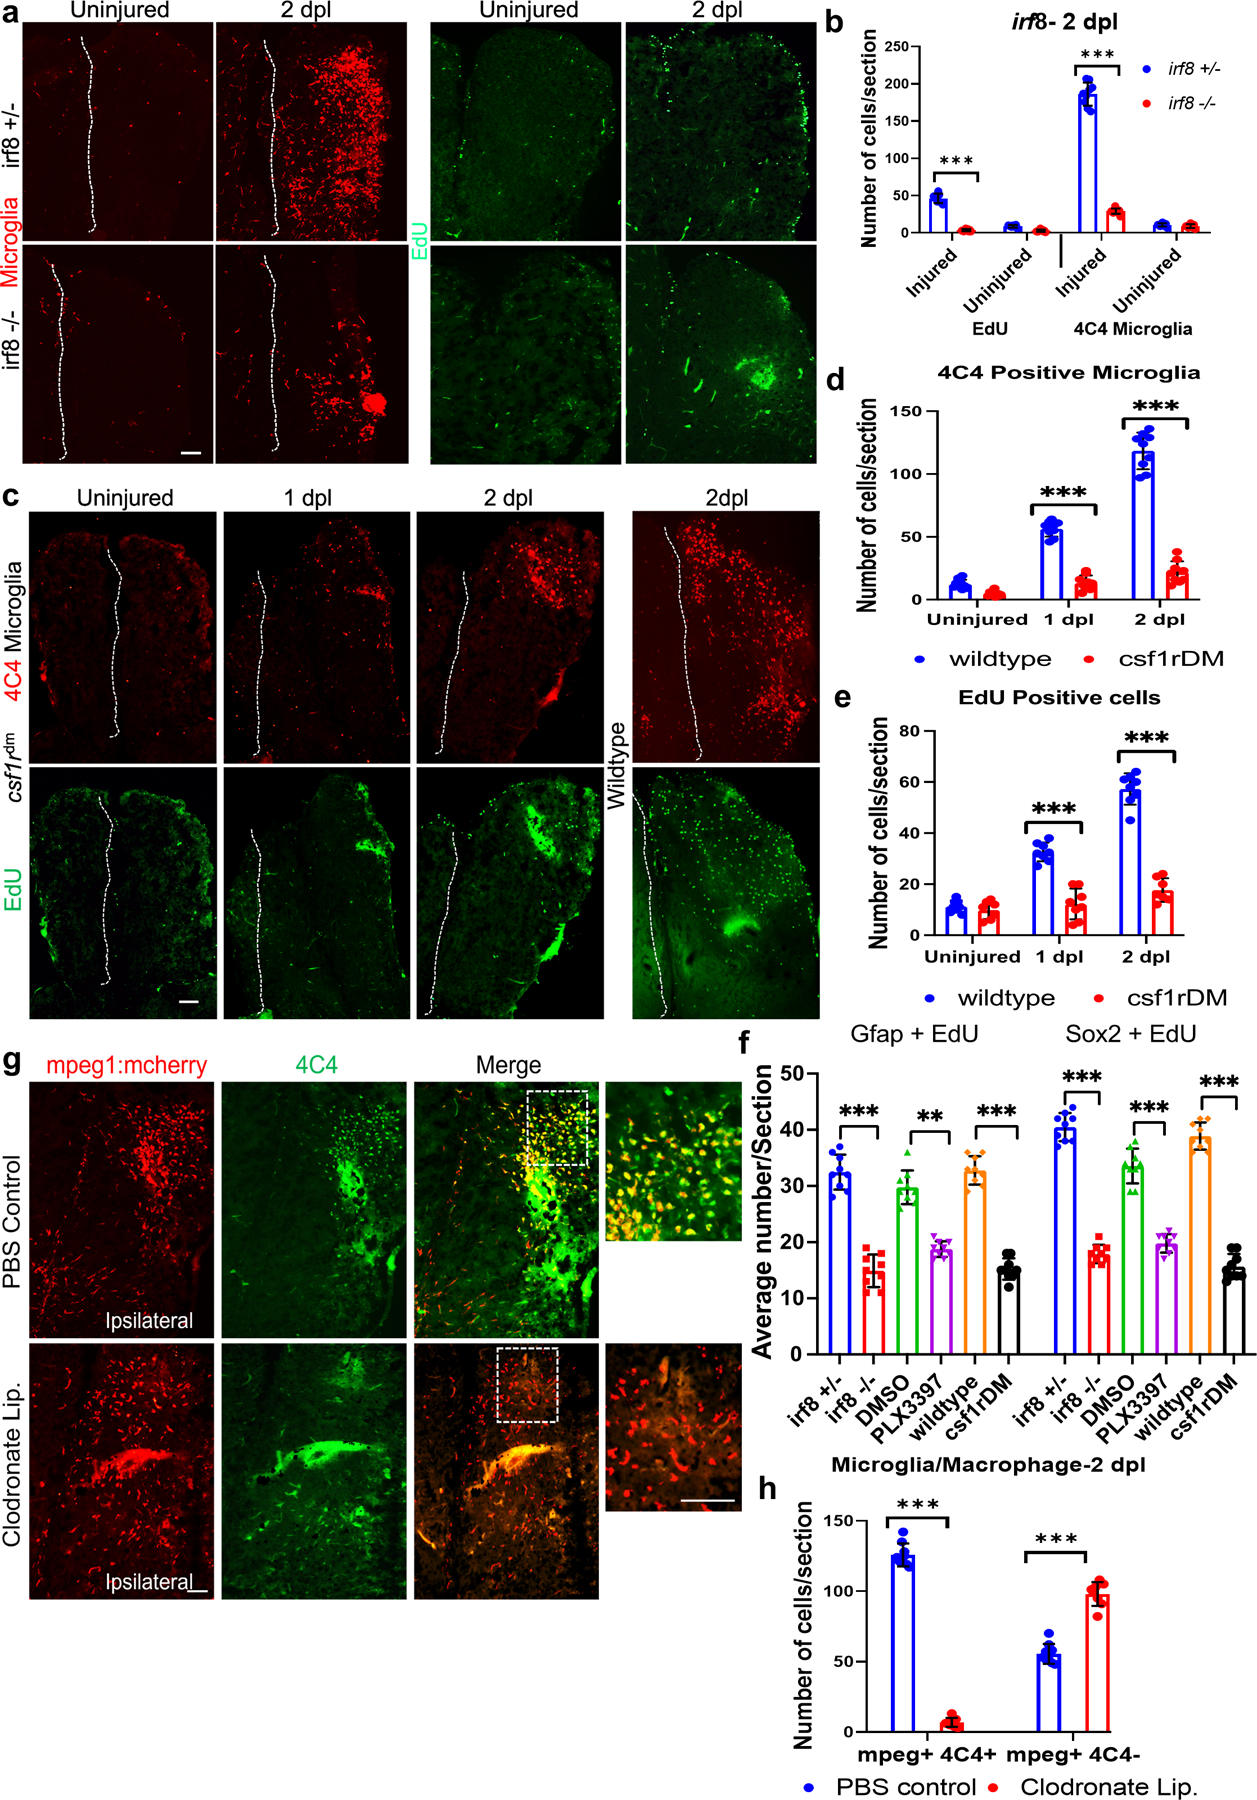
a. Immunostaining for 4C4 (microglia, red) and EdU (proliferating cells, green) in irf8+/− vs. irf8−/− fish telencephala with or without injury at 2dpl. b. Quantification of microglia and EdU-positive cells in irf8 mutants and controls without injury or at 2 dpl. c. Staining for 4C4 (red) and EdU (green) in csf1rDM mutant (left panels) and wildtype (right panels) brains with or without injury. Dashed lines indicate the midline in a and c. d. Quantification of microglia in csf1rDM and wildtype brains. e. EdU-positive cell quantification in csf1rDM and wildtype brains. f. Quantification of cells double-labeled for Gfap/EdU or Sox2/EdU in mutant fish (irf8−/− and csf1rDM lines) and fish treated with PLX3397 compared to control lines (irf8+/−, DMSO and wildtype) at 2 dpl. g. Double immunolabeling of telencephala for mCherry to label mpeg1-positive cells (red) from mpeg1:mcherry reporter fish and 4C4 (green) for microglia in control and clodronate injected fish. The images are ipsilesional, and the dotted boxes are shown at higher magnification on the right. h. Quantification of microglia (mpeg+, 4C4+) and macrophages (mpeg+, 4C4-) in control and clodronate brains at 2 dpl. ***, p < 0.0001 for all graphs. Scale bars = 100 µm for all image panels, and the error bars indicate SEM.
3.6. Macrophages are not sufficient to induce brain regeneration without microglia.
As described above, we found that macrophages enter the CNS within a few hours after telencephalic injury, peaking at 1 dpl, but their numbers sharply decreased by 2 dpl (Fig. 1c, d) during aIPC expansion. Because macrophages are necessary for regeneration of spinal cord, fin and heart in zebrafish (Lai et al., 2017; Tsarouchas et al., 2018), we next explored the relative impact of clodronate on the macrophage vs. microglial response after telencephalic injury. We found that while clodronate treatment drastically reduces microglia (mpeg+/4C4+), macrophage numbers (mpeg+/4C4-) were elevated at 2 dpl (Fig. 6g, h) despite a decrease in total mpeg+ cells after clodronate liposome injection (Fig. S1e). We also performed injury on the macrophage-specific reporter line mfap4:dLanYFP-CAAX (Walton et al., 2015) and found that clodronate treatment only slightly, albeit significantly, reduced macrophage numbers at 2 dpl (Fig. S5m, n). These results suggest that the macrophage response alone is not sufficient to induce regeneration after injury, and that microglia play a more critical role in stimulating the reparative process.
3.7. Suppressing microglia after brain injury attenuates pro-regenerative signaling pathways.
Inflammatory cytokines and signaling molecules such as stat3, ascl1a, lin28 and ß-catenin are known to play a crucial role during regeneration of zebrafish fin, heart and retina (Becker & Becker, 2015; Elsaeidi et al., 2018; Yi Fang et al., 2013; Fausett et al., 2008; Lotan & Schwartz, 1994; Wan et al., 2014; Wehner et al., 2014; Zhao et al., 2014). We therefore examined whether microglia are necessary to activate these pro-regenerative signaling pathways to promote repair in the brain. Gene expression analysis via qRT-PCR at 1 dpl showed that clodronate-treated brains had reduced expression of several pro-inflammatory cytokines, most notably tnfa, and the signaling molecules stat3, ascl1a, lin28a, c-myc (myca) and socs3b (Fig. 7a). Timecourse analysis of gene expression via qRT-PCR for stat3, ascl1a, c-myc and gata3 (Kizil, Kyritsis, et al., 2012) in microglial-depleted (either via clodronate or in mutant lines) versus control fish showed significantly reduced expression of all transcripts with microglial depletion (Fig. 7b–e). We validated the altered expression for a subset using transgenic reporter lines for activated Stat3 [Tg(gfap:stat3-GFP)], ascl1a [Tg(ascl1a:GFP)] and Wnt/ß-Catenin signaling [Tg(tcf7miniP:2dGFP)], and confirmed that microglial ablation strongly reduces Stat3 and ß-Catenin signaling, while ascl1a was more modestly decreased (Figs. 7f, g and S6a). Moreover, the radial glial reporter line Tg(gfap:GFP) showed no significant changes after clodronate injection (Figs. 7g and S6a), consistent with our results above (Fig. 4e, e’ and f). These findings show that microglia are required for the upregulation of several specific pro-regenerative signaling pathways after brain injury.
Figure 7. Microglial ablation after brain injury attenuates pro-regenerative signaling.
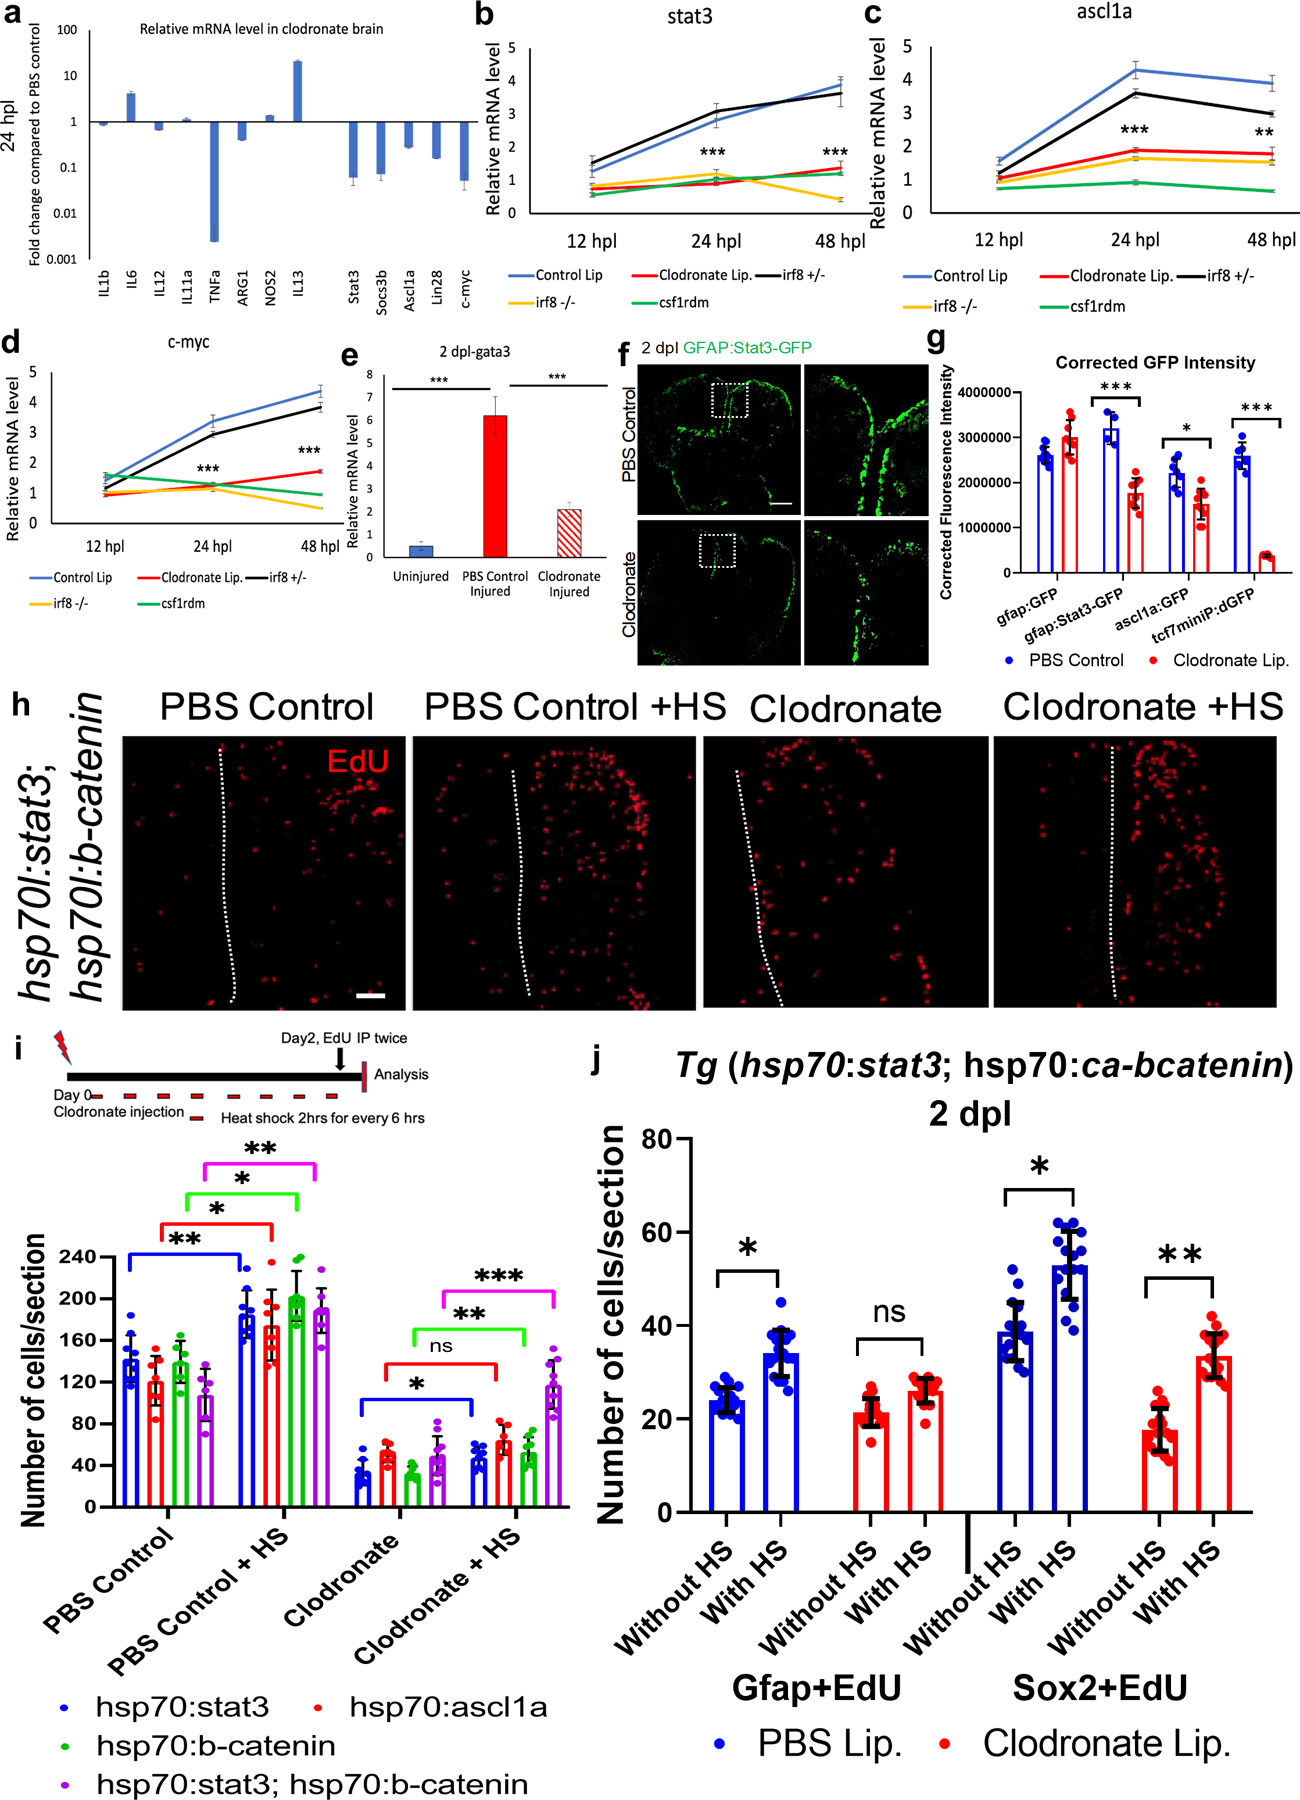
a. qRT-PCR showing relative mRNA levels of different inflammatory cytokines or regenerative signaling molecules. Two pooled hemi-telencephala (injured side) per condition (clodronate-treated vs. control lesioned) were used, and the Y axis is log fold change. b-e. Post-injury qRT-PCR timecourse analysis of gene expression for stat3 (b), ascl1a (C) c-myc (d) or gata3 (e) in injured hemi-telencephala from fish receiving control or clodronate liposomes, or in irf8+/− (control), irf8−/− and csf1rDM mutant brains. f. GFP labeling of telencephala from a pStat3 signaling reporter line at 2 dpl after control or clodronate liposome injections. The boxed areas in the left panels are shown at higher magnification at right. g. Quantification of corrected GFP fluorescence intensity of right (injured) telencephala from tg(gfap:GFP), tg(stat3-GFP), tg(ascl1a:GFP) and tg(tcf7miniP:dGFP) reporter fish at 2 dpl after clodronate injury compared to controls. h. EdU labeling of control and clodronate injected brains at 2 dpl with or without heat shock (HS) to induce stat3 and ß-catenin transgene expression. i. Quantification of EdU+ cells at 2 dpl after ectopic activation of stat3, ascl1a, ß-catenin and stat3+ ß-catenin with or without HS treatment in control and clodronate injured fish. The schematic above shows the experimental design. j. Quantification of cells double-labeled cells for Gfap/EdU or Sox2/EdU in brains from the double transgenic stat3 and constitutively active-beta-catenin (ca-bcatenin) overexpression fish with control and clodronate injury, and with and without heat shock (HS). NS, not significant; ***, p<0.0001; **, p<0,001; *, p<0.01 by ANOVA with Tukey’s post-hoc test in c, g, i and j. Scale bars = 100 µm for image panels, and error bars indicate SD.
3.8. Stat3 or ß-Catenin pathway activation rescues impaired injury-induced cell proliferation caused by microglial suppression.
Given our findings suggesting that microglia are upstream of Stat3, Ascl1a and ß-Catenin signaling pathways, we sought to determine whether ectopic activation of these pathways alone or in combination would rescue the proliferation defect seen after microglial ablation. We overexpressed constitutively-active (CA) Stat3 [Tg(hsp70l:CA-stat3)], Ascl1a [Tg(hsp70l:ascl1a)] or ß-catenin [Tg(hsp70l:CA-ß-catenin)] with multiple heat-shocks for two days after injury in control and clodronate liposome-injected fish. Additional control liposome and clodronate injury groups without heat shock were also examined. Individually, overexpression of CA-stat3 or CA-ß-catenin, but not CA-Ascl1a, induced a modest but significant increase in proliferation at 2 dpl in heat shock-treated clodronate-injured brains compared to those without heat shock (Figs. 7i, and S6b). We next used a double Tg line [Tg(hsp70l:CA-stat3; hsp70l:CA-ß-catenin)] to ask whether combined CA-stat3 and CA-ß-catenin overexpression would reverse the clodronate-induced proliferation defect after injury. Indeed, we found a more marked increase in cell proliferation in the double transgenic line with heat-shock compared to no heat-shock, restoring it to control levels at 2 dpl (Fig. 7h, i). We further quantified the proliferating cells by phenotype in the overexpression lines by double labeling for EdU and either Gfap or Sox2 at 2dpl. The quantification showed significant increases in Gfap positive stem cells and Sox2 positive progenitor cell proliferation in the controls, with or without HS, and a more marked increase in proliferation of Sox2+ cells in clodronate-treated fish (Fig. 7j). Importantly, CA-stat3 or CA-ß–catenin overexpression did not influence microglial numbers in control- or clodronate-lesioned fish, with or without injury (Fig. S6c, f). We further confirmed that the overexpression lines indeed expressed the intended genes after heat shock via qRT-PCR (Fig. S6d). Together, these results show that Stat3 and ß–Catenin signaling are activated by microglia and in combination are sufficient to rescue the cell proliferation defect caused by microglial ablation.
3.9. Microglia are crucial for resolution of the post-brain injury inflammatory response.
Given that the resolution of inflammation typically dictates the degree of repair, we next explored whether microglia are necessary to remove proinflammatory peripheral immune cells (neutrophils) to attenuate ongoing inflammation. Because we showed above that L-plastin-expressing cells proliferate more in the telencephalic parenchyma after clodronate-mediated suppression of microglia compared to control fish (Fig. 5h), we wondered whether this led to leukocyte accumulation. We found that ipsilesional telencephalic leukocyte numbers increased at 2 dpl after microglia suppression via clodronate treatment (Fig. 8a and S6e). Further, to understand if microglia play a role in neutrophil clearance needed to suppress prolonged inflammation after 1 dpl, which is one of the major steps in resolution of the inflammatory response, we used Mpx immunolabeling to identify neutrophils after clodronate treatment or in irf8st95 and csf1rDM fish with microglial depletion. Indeed, we discovered that the decrease in microglia leads to a strong accumulation of neutrophils from 2–4 dpl (Fig. 8b–e). This enhanced neutrophil accumulation is expected to prolong the pro-inflammatory phase and impair regeneration, as is seen with manipulation of the regenerative response in other tissues (Lai et al., 2017).
Figure 8. Persistence of neutrophils when microglia are ablated in the setting of brain injury.
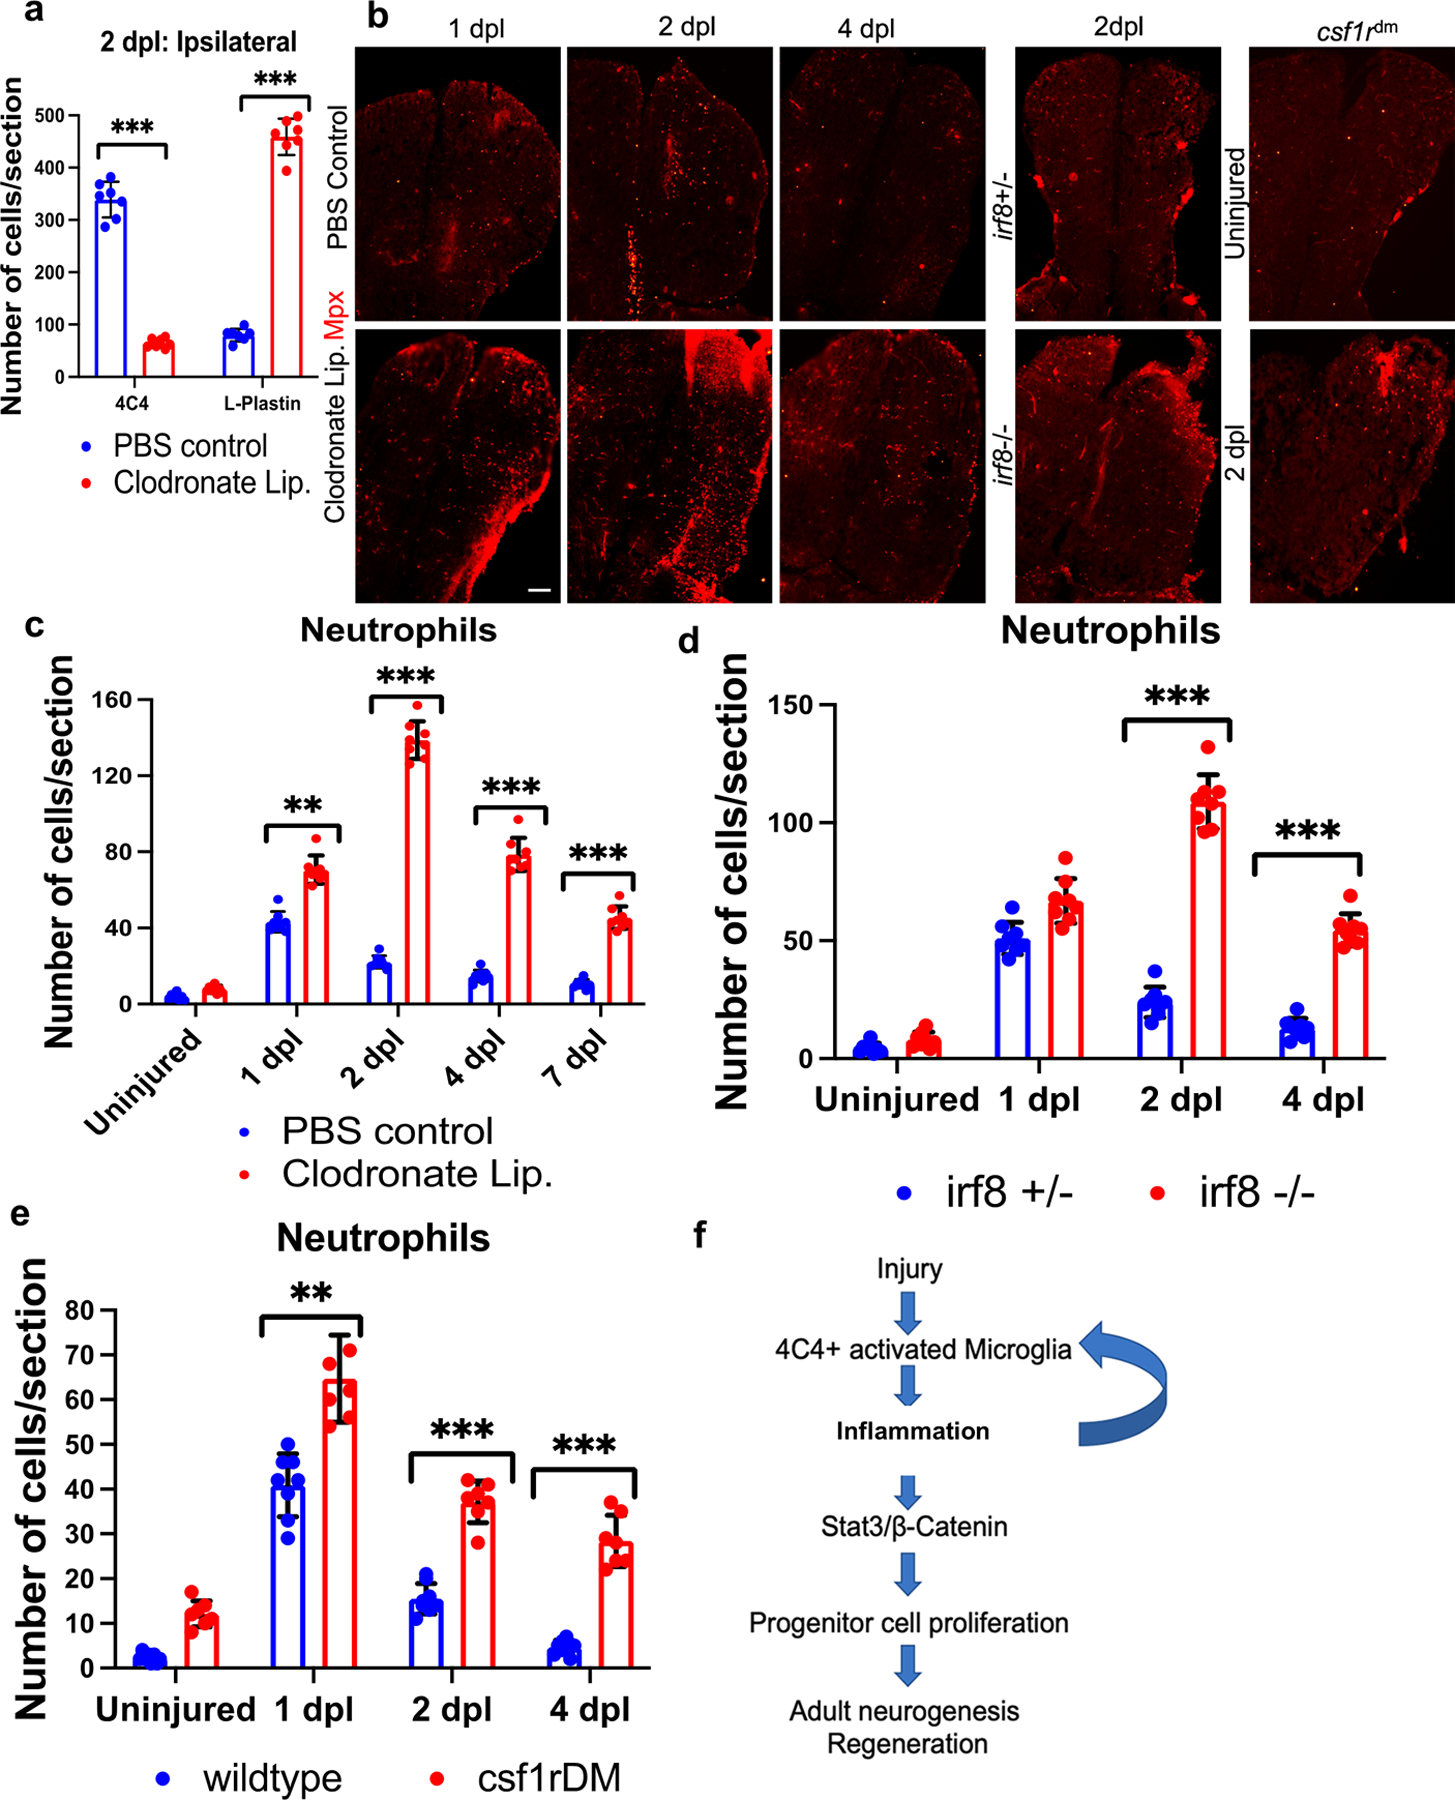
a. Quantification of microglia (4C4) and leukocytes (L-Plastin) in the ipsilesional hemi-telencephala of control or clodronate liposome injected fish at 2 dpl. b. Confocal images of fish telencephala from PBS control and clodronate treated at 1–4 dpl, and irf8+/− (control), irf8−/− and csf1rDM groups at 2 dpl, all immunolabeled for an Mpx-mcherry reporter (neutrophils). c-e. Quantification of Mpx reporter-positive neutrophils from control, clodronate treated, irf8 and csf1rDM mutant brains. f. Proposed model of the microglia-induced signaling pathway during injury-induced telencephalic regeneration in zebrafish. ***, p<0.0001; **, p<0.001; *, p<0.01 by t-test for panels a, c, d and e. Scale bars = 100 µm, and the error bars indicate SD.
4. DISCUSSION
Given the robust regenerative capacity of the zebrafish brain, a critical issue is to understand the unique mechanisms underlying injury-induced brain repair in zebrafish with the anticipation that it will inform us of strategies for repairing the injured or diseased human brain. Here we focused on the inflammatory response after brain injury and its role in regulating neural stem cell behavior. Using an adult zebrafish telencephalic injury model, we found that suppressing activated microglia impaired brain regeneration and often led to persistent lesions, comparable to the chronic damage seen after mammalian brain injury, but notably in the absence of a glial scar. The latter may reflect the lack of parenchymal astrocytes in zebrafish as the recent finding of astrocyte-like cells in developing zebrafish brain (Chen et al., 2020) has yet to be described in the adult telencephalon. Alternatively, some innate system may exist to overcome scarring despite the presence of a persistent lesion. Importantly, the lack of brain repair following microglial depletion was associated with reduced neutrophil clearance that prolongs the inflammatory response, and decreased aIPC proliferation that is associated with reduced activity of pro-regenerative signaling pathways, in particular Stat3 and β-Catenin signaling. Thus, our findings suggest that macrophages and neutrophils are not sufficient for regeneration and demonstrate the requirement of microglia for adequate brain repair through anti-inflammatory and pro-regenerative mechanisms.
As resident immune cells of the CNS, microglia respond to injury and modulate the inflammatory response. Constitutive microglia (ramified) are suggested to be pro-inflammatory, while activated microglia (ameboid) are thought to be anti-inflammatory and neuroprotective after mammalian brain injury (Martinez & Gordon, 2014; Ransohoff, 2016). With current transcriptomics data, however, we now know that microglia/macrophages are far more diverse and dynamic in nature based upon the specific context. Unlike in our brain injury model, macrophages are necessary for zebrafish cardiac and fin regeneration (Lai et al., 2017; Li et al., 2012), and their absence leads to a persistent inflammatory response after cardiac injury in zebrafish and medaka (Lai et al., 2017). After telencephalic injury, we find that 4C4+ microglia accumulate by 1 dpl and peak at 2 dpl. A minority of these microglia express tnfα (data not shown), suggesting that 4C4+ microglia might identify a subtype that favors regeneration. In rodents, microglia promote neurogenesis in the early postnatal forebrain SVZ (Shigemoto-Mogami et al., 2014) and macrophages are required for cardiac repair after ischemia (Aurora et al., 2014; Lorchner et al., 2015). In contrast, microglia are not required for axonal regeneration after spinal cord injury in zebrafish or for optic nerve regeneration in mouse (Hilla et al., 2017; Tsarouchas et al., 2018), where macrophages are required. Thus, while we find that activated microglia are critical for brain repair in zebrafish, their contribution to CNS regeneration appears to differ based upon the specific region or species.
Our data indicate that microglial ablation reduces aIPC amplification and neurogenesis and is associated with an impaired regenerative response that is unable to heal the lesioned brain. Consistent with this, a live imaging study of neurogenesis in the intact and injured adult zebrafish brain demonstrated that zebrafish use symmetric cell divisions of Sox2 positive aIPCs to amplify the daughter cells and induce robust neurogenesis after injury (Barbosa et al., 2015). These symmetric divisions do not occur in the intact brain, suggesting that this specific type of cell division promotes injury-induced proliferation and neurogenesis, while the aNSC divides only once in both the intact and injured brain (Barbosa et al., 2015). In the mammalian brain, microglia accumulate near the stem cell niches in the SVZ and hippocampus during development to maintain NPC/aIPC proliferation, and blocking the chemokine CX3CL2 or ablating microglia negatively affects progenitor cells in the cortex (Arnò et al., 2014). Microglial IGF1 and TGF-ß are also necessary to induce NPC proliferation after seizures or brain ischemia (Ali et al., 2015; Choi et al., 2017; Choi et al., 2008). Finally, microglia actively remodel adult hippocampal neurogenesis by maintaining the NPC population in mice (Diaz-Aparicio et al., 2020; Sierra et al., 2010). These reports are consistent with our findings that microglia regulate NPCs during reparative neurogenesis.
Stat3 and β-Catenin signaling are necessary for aNSC/NPC proliferation in many tissues. Our work indicates that microglial activation is necessary to stimulate these signaling factors to initiate the regenerative response (Fig. 8f). Stat3 is necessary for fin, retina and heart regeneration in fish and other animals (Y. Fang et al., 2013; Liang et al., 2012; Nelson et al., 2012; Sun et al., 2011; Zhao et al., 2014). For example, Stat3 activates retinal Müller glia to promote regeneration, and Stat3 inhibition blocks both retina and heart repair (Nelson et al., 2012; Zhao et al., 2014). Jak/Stat and Wnt/ß-Catenin signaling promotes stem cell self-renewal (Goldman, 2015; Richmond et al., 2018; Shimizu et al., 2018; Todd et al., 2016; Zhao et al., 2014) and blocking negative regulators of Jak/Stat signaling or treating with Wnt/ß-Catenin inhibitors is sufficient to stimulate cell proliferation in uninjured tissue (Goldman, 2015; Hao et al., 2006; Ramachandran et al., 2011). Notably, Stat3 and ß-Catenin are induced by many inflammatory cytokines that are secreted by microglia during inflammation (Liu et al., 2013; Mori et al., 2011; Wan et al., 2014), consistent with our findings in brain regeneration.
Microglial ablation leads to persistent neutrophil accumulation at the lesion, suggesting that activated microglia regulate neutrophil persistence/clearance after brain injury. Studies have found that neutrophil accumulation extends the proinflammatory state in a zebrafish fin inflammation model (Mathias et al., 2007) and during cardiac regeneration (de Preux Charles et al., 2016; Lai et al., 2017). In Medaka, cardiac regeneration was impaired with delayed macrophage recruitment and neutrophil accumulation, but inducing early macrophage recruitment improved regeneration, neutrophil clearance, and scar resolution (Lai et al., 2017). Furthermore, inducing neutrophil apoptosis resolved inflammation in zebrafish during tail fin regeneration (Hoodless et al., 2016), and in mice, microglia prevented the accumulation of neutrophils to suppress inflammation in an Alzheimer’s disease model (Unger et al., 2018). All these results are in line with our finding that microglial recruitment is crucial in the CNS for removing pro-inflammatory neutrophils to resolve injury-induced inflammation. Whether neutrophil persistence alone is sufficient to prevent brain repair and the potential signaling pathways involved are unknown.
Taken together, our data show that microglia are necessary for successful brain regeneration, and that microglial dependent activation of Stat3 and ß-Catenin promotes aIPC expansion and neurogenesis. Notably, our findings suggest that depletion of microglia permits recruitment of inflammatory neutrophils that persist at the injury site and likely contribute to suppression of the regenerative response by sustaining a pro-inflammatory environment. Hence, the current study underscores the need to delineate specific inflammatory processes that promote regeneration in zebrafish, as well as those that inhibit regeneration in the mammalian brain. Further study to identify the microglial signaling molecules responsible for promoting regeneration or resolving inflammation in zebrafish should provide candidates to test in rodent injury models and lead to strategies for repairing the injured mammalian brain.
Supplementary Material
Figure S1. Liposomal clodronate efficiently suppresses activated microglia. a. Confocal images of telencephala after reporter labeling for macrophages Tg(mpeg:GFP; green; top panels) alone or with co-immunolabeling for activated microglia (4C4; red; bottom panels) at 3 and 4 dpl. The dashed line indicates the midline. b. Quantification of the percentages of mpeg:GFP-labeled cells expressing 4C4 at different time points. ***p<0.0001. c. Quantification of mpeg:GFP/4C4 double-positive microglia (blue line) or mpeg:GFP+/4C4- macrophages (red line) from the contralateral hemi-telencephala at different time points after injury and in uninjured fish. The asterisks indicate statistical significance compared to uninjured. **p<0.001, ***p<0.0001. d. 4C4 immunostaining of ipsilesional hemi-telencephala from control (top row) and clodronate-treated fish (bottom row) at 1, 4 or 7 dpl. The far-right panels display 4C4 immunolabeling of uninjured hemi-telencephala. e. Quantification of mpeg:GFP+ cells in the ipsilesional hemisphere at 2 dpl in control and clodronate groups. ***, p < 0.0001. f. Quantification of 4C4 immunoreactivity from uninjured fish and the contralateral hemi-telencephala at different time points after injury. g. Quantification of mpeg:GFP+ cells from the contralateral hemisphere at 2 dpl in PBS control and clodronate groups. h. Confocal images of the injured hemi-telencephala after double labeling for 4C4 (green) and TUNEL stain (red) at 2 dpl in control liposome or clodronate liposome treated fish. Arrows shows double-positive cells and arrowheads show cells positive for TUNEL stain only. h’. Magnified images of injury region and insets showing a cell double-positive for both TUNEL and 4C4. Scale bars = 100 μm and the error bars indicate SEM.
Figure S2. Microglial ablation alters post-injury cell proliferation. a. Quantification of EdU+ cells from the ipsilesional telencephalic hemispheres at 14 dpl in control and clodronate groups. ***, p <0.0001. b, c. Quantification of EdU+ cells and EdU/HuC/D double-labeled cells from the contralesional side at 14 (b) and 21 (c) dpl. d. GFP immunolabeling of the contralesional hemispheres from her4.1:GFP reporter fish at 2 dpl with (right) or without (left) 4-OH-TMX treatment. The dashed lines outline the hemispheres. e. GFP immunolabeling of telencephala from her4.1:GFP reporter fish at 1 (1 brain) and 2 (2 brains) dpl after 4-OH-TMX treatment. Dashed lines denote the midline, and the injured hemisphere is on the right. f. Quantification of cells labeled for GFP, GFP+EdU and GFP+HuC/D in the contralateral hemi-telencephala at 14 and 28 dpl in control liposome or clodronate liposome treated fish. g. EdU labeling of the contralateral side at 2 dpl in representative hemi-telencephala from control and clodronate groups. h. Quantification of EdU+ cells in the contralateral hemi-telencephala at 1, 2, 4 and 7 dpl. i. Quantification of EdU+ cells in the ventricular zone (blue outline in inset) of the ipsilesional hemi-telencephala at 1, 2, 4 and 7 dpl. ***, p<0.0001. j. Quantification of EdU+ cells in the subventricular zone (SVZ) and the parenchymal region (blue label in inset) of the ipsilesional hemi-telencephala at 1, 2, 4 and 7 dpl. **, p <0.001; ***, p<0.0001. Scale bars = 100 μm and error bars indicate SEM.
Figure S3. Microglial ablation inhibits progenitor cell amplification. a. Confocal images of telencephalic sections co-labeled for gfap-driven GFP reporter and TUNEL stain at 2 dpl at the midline VZ of control and clodronate treated fish. Arrows denote double-labeled cells. b. Images show red fluorescent liposomes at 1 and 2 dpl. The telencephala are outlined by dotted lines and the dotted circles mark the injury sites. c. Double labeling for radial glia with GFAP immunolabeling (green) and red fluorescent liposomes at 2 dpl. The boxed area is shown at higher magnification on the right. Note minimal uptake of red fluorescent liposomes by radial glia. d. Staining for macrophages/microglia (mpeg:GFP) and red fluorescent liposomes at 2 dpl. The dashed lines outline the injured hemi-telencephala and the boxed area in the merged image is shown at higher magnification on the right. e. Confocal images from the anterior midline telencephala show double labeling for Sox2 and EdU in control (top row) and clodronate groups (bottom row) at 4 and 7 dpl. EdU was administered at 2 dpl. Boxed areas are shown at higher magnification on the right of each pair of images. f. Confocal images displaying Sox2 and TUNEL double labeling at 2 dpl in control and clodronate groups. The right-sided panels show higher magnification views of the boxed regions. Scale bars = 100 μm.
Figure S4. Microglial and oligodendrocyte proliferation after injury. a. Double labeling for 4C4 and EdU in the ipsilateral hemi-telencephala at 2 dpl in control and clodronate groups. Arrows indicate double-labeled cells. The insets at upper right show higher magnification views of the boxed areas. b. Quantification of the percentage of 4C4+ cells at 2, 4 and 7 dpl in the injured hemi-telencephala of control and clodronate groups that had incorporated EdU at 2 dpl. c. Double labeling for Olig2 and EdU in the ipsilateral hemi-telencephala at 2 dpl. The insets at bottom left show higher magnification views of the boxed areas. d. Double labeling for Olig2 and TUNEL at 2 dpl from the ipsilesional side in control and clodronate groups. Arrows indicate rare Olig2/TUNEL double-positive cells. The insets at bottom left show higher magnification views of the boxed areas. e. Quantification of the percentages of proliferating (EdU+) and apoptotic (TUNEL+) Olig2+ cells. f. Quantification of the number of brain with and without lesions in DMSO vs. PLX3397 treated fish, and irf8−/− mutant fish compared to irf8+/− controls. g. Quantification of cells double-labeled for HuC/D and EdU at 21 dpl from irf8 mutants and csf1rDM mutants compared to controls. Scale bars = 100 μm and error bars indicate SEM.
Figure S5. Csf1r inhibition with PLX3397 attenuates injury-induced progenitor cell proliferation and adult neurogenesis. a. Schematic of the experimental design and time course. Red lines are PLX3397 (PLX)-treated groups and blue lines represent DMSO-treated controls. b. Confocal images of immunolabeling to identify proliferating cells (EdU+, red) at 2 dpl in telencephala from injured fish treated with DMSO or PLX3397. The dotted lines outline the injured hemisphere. c. Quantification of cells labeled for EdU incorporation, 4C4 or L-Plastin at 2 dpl after treatment with DMSO or PLX3397. Note the increased numbers of labeled cells seen in the control lesioned group (2 dpl DMSO) but not in the PLX3397-treated, lesioned group (2 dpl PLX). ***, p<0.0001 by t-test. d. Confocal images of EdU labeling in the telencephala of uninjured fish treated with vehicle (DMSO) or PLX3397. EdU was administered at 2 dpl (2 hours prior to euthanasia) after a 9-day exposure to PLX3397 or DMSO. The dashed lines denote the midline. e. Quantification of 4C4- and L-Plastin-positive cells in uninjured fish or the contralesional hemi-telencephala of injured fish at 2 dpl after treatment with DMSO or PLX3397. *, p < 0.01; **, p <0.001. f. Quantification of EdU+ cells in uninjured fish or the contralesional hemi-telencephala at 2 dpl of fish treated with vehicle (DMSO) or PLX3397. *, p < 0.01; **, p < 0.001. g, h. Confocal images of immunolabeling to identify activated microglia (4C4; green in g) or leukocytes (L-Plastin; white in h) at 2 dpl in telencephala from uninjured or injured fish treated with DMSO or PLX3397. Dashed lines indicate the midline. i, j. Quantification of EdU/Sox2 double-labeled cells at 2 dpl (i) and EdU/HuC/D double-labeled cells from the ipsilateral side at 21 dpl (j). ***, p < 0.0001. k. Quantification of the percentage of Sox2+ cells that incorporated EdU in the contralesional side at 2 dpl. **, p < 0.001. l. Quantification of HuC/D and EdU double-labeled cells in the contralesional side at 21 dpl. *, p <0.01. EdU was administered at 2 dpl. m. Images of telencephala from the mfap4 reporter line for macrophages at 2 dpl after control or clodronate treatment. n. Quantification of mfap4 reporter intensity corrected for area using imageJ. Scale bar = 100 μm and error bars indicate SEM.
Figure S6. Microglia are necessary to induce pro-regenerative signaling after injury. a. GFP immunostaining of reporter lines for gfap, ascl1a and Wnt signaling (tcf7) at 2 dpl in control and clodronate groups. b. EdU labeling at 2 dpl for rescue analysis with or without heat shock (HS) in both control liposome and clodronate liposome treated groups. HS induces the HS promoter (hsp) activating stat3, wnt signaling (tcf7) or ascl1a. c. Quantification of EdU- or 4C4-labeled cells from wildtype brains at 2 dpl with or without HS shows that HS alone has no effect on cell numbers. d. qRT-PCR for ascl1a, stat3 and b-catenin in brains from the heat shock experiments. e. immunolabelling for 4C4 and L-Plastin at 2 dpl after control or clodronate treatment. f. Quantification of 4C4-immunolabeled cells at 2 dpl after injury with or without HS in the clodronate rescue experiments. ***, p = 0.0001. Scale bars = 100 μm; error bars indicate SEM in c and SD in d.
Acknowledgements
This work is supported by the A. Alfred Taubman Medical Research Institute at the University of Michigan Medical School (J.P), the Global ischemia foundation (K.P. and J.P.), the NEI (D.G.), and a National Science Foundation graduate research fellowship (J.C.). We would like to thank Dr. Bruce Appel for providing the Tg(olig2:GFP) fish, Dr. Peter Hitchcock for providing 4C4 antibody, Dr. David Tobin for providing mafp4 reporter lines, Dr. Celia Shiau for providing irf8 mutant fish, Dr. Tjakka van Ham for providing csf1rDM fish, Dr. Diana M. Mitchell for providing mpeg1:mcherry fish, and Dr. Yi Feng for providing the L-Plastin antibody. We also would like to thank Muchu Zhou and Zachary Rakowski for assistance with fish care and maintenance.
Footnotes
Competing interests
The authors declare no competing interests.
Data Availability
The data sets generated and analyzed in this study are available upon request.
REFERENCES
- Ali I, Chugh D, & Ekdahl CT (2015). Role of fractalkine-CX3CR1 pathway in seizure-induced microglial activation, neurodegeneration, and neuroblast production in the adult rat brain. Neurobiol Dis, 74, 194–203. 10.1016/j.nbd.2014.11.009 [DOI] [PubMed] [Google Scholar]
- Altman J (1969). Autoradiographic and histological studies of postnatal neurogenesis. IV. Cell proliferation and migration in the anterior forebrain, with special reference to persisting neurogenesis in the olfactory bulb. J Comp Neurol, 137(4), 433–457. 10.1002/cne.901370404 [DOI] [PubMed] [Google Scholar]
- Altman J, & Das GD (1965). Autoradiographic and histological evidence of postnatal hippocampal neurogenesis in rats. J Comp Neurol, 124(3), 319–335. [DOI] [PubMed] [Google Scholar]
- Alunni A, & Bally-Cuif L (2016). A comparative view of regenerative neurogenesis in vertebrates. Development, 143(5), 741–753. 10.1242/dev.122796 [DOI] [PMC free article] [PubMed] [Google Scholar]
- Arnò B, Grassivaro F, Rossi C, Bergamaschi A, Castiglioni V, Furlan R, … Muzio L (2014). Neural progenitor cells orchestrate microglia migration and positioning into the developing cortex [Research]. Nature Communications, 5, 5611. 10.1038/ncomms6611 [DOI] [PubMed] [Google Scholar]
- Aurora AB, Porrello ER, Tan W, Mahmoud AI, Hill JA, Bassel-Duby R, … Olson EN (2014). Macrophages are required for neonatal heart regeneration. J Clin Invest, 124(3), 1382–1392. 10.1172/jci72181 [DOI] [PMC free article] [PubMed] [Google Scholar]
- Baba Y, T Y, H S, KP G, S H, & PW K (2006). Constitutively active beta-catenin promotes expansion of multipotent hematopoietic progenitors in culture. J Immunol, 177(4). 10.4049/jimmunol.177.4.2294 [DOI] [PubMed] [Google Scholar]
- Barbosa JS, & Ninkovic J (2016). Adult neural stem cell behavior underlying constitutive and restorative neurogenesis in zebrafish. Neurogenesis (Austin), 3(1), e1148101. 10.1080/23262133.2016.1148101 [DOI] [PMC free article] [PubMed] [Google Scholar]
- Barbosa JS, Sanchez-Gonzalez R, Giaimo RD, Baumgart EV, Theis FJ, Götz M, & Ninkovic J (2015). Live imaging of adult neural stem cell behavior in the intact and injured zebrafish brain. Science 10.1126/science.aaa2729 [DOI] [PubMed]
- Bartels CF, Scacheri C, White L, Scacheri PC, & Bale S (2010). Mutations in the CHD7 gene: the experience of a commercial laboratory. Genet Test Mol Biomarkers, 14(6), 881–891. 10.1089/gtmb.2010.0101 [DOI] [PMC free article] [PubMed] [Google Scholar]
- Barth A, AL P, Y A, KE M, & WJ N (1997). NH2-terminal deletion of beta-catenin results in stable colocalization of mutant beta-catenin with adenomatous polyposis coli protein and altered MDCK cell adhesion. The Journal of cell biology, 136(3). 10.1083/jcb.136.3.693 [DOI] [PMC free article] [PubMed] [Google Scholar]
- Baumgart EV, Barbosa JS, Bally-Cuif L, Gotz M, & Ninkovic J (2012). Stab wound injury of the zebrafish telencephalon: a model for comparative analysis of reactive gliosis. Glia, 60(3), 343–357. 10.1002/glia.22269 [DOI] [PubMed] [Google Scholar]
- Becker CG, & Becker T (2008). Adult zebrafish as a model for successful central nervous system regeneration. Restor Neurol Neurosci, 26(2–3), 71–80. [PubMed] [Google Scholar]
- Becker CG, & Becker T (2015). Neuronal regeneration from ependymo-radial glial cells: cook, little pot, cook! Dev Cell, 32(4), 516–527. 10.1016/j.devcel.2015.01.001 [DOI] [PubMed] [Google Scholar]
- Bhattarai P, Thomas AK, Cosacak MI, Papadimitriou C, Mashkaryan V, Froc C, … Kizil C (2016). IL4/STAT6 Signaling Activates Neural Stem Cell Proliferation and Neurogenesis upon Amyloid-beta42 Aggregation in Adult Zebrafish Brain. Cell Rep, 17(4), 941–948. 10.1016/j.celrep.2016.09.075 [DOI] [PubMed] [Google Scholar]
- Boniface EJ, Lu J, Victoroff T, Zhu M, & Chen W (2016). FlEx‐based transgenic reporter lines for visualization of Cre and Flp activity in live zebrafish 10.1002/dvg.20526 [DOI] [PMC free article] [PubMed]
- Bosak V, Murata K, Bludau O, & Brand M (2018). Role of the immune response in initiating central nervous system regeneration in vertebrates: learning from the fish. Int J Dev Biol, 62(6-7-8), 403–417. 10.1387/ijdb.180033vb [DOI] [PubMed] [Google Scholar]
- Bromberg J, MH W, G, D., Y, Z., RG, P., C, A., & JE, D. (1999). Stat3 as an oncogene. Cell, 98(3). 10.1016/s0092-8674(00)81959-5 [DOI] [PubMed] [Google Scholar]
- Chen J, Poskanzer KE, Freeman MR, & Monk KR (2020). Live-imaging of astrocyte morphogenesis and function in zebrafish neural circuits [OriginalPaper]. Nature Neuroscience, 1–10. 10.1038/s41593-020-0703-x [DOI] [PMC free article] [PubMed]
- Cheung TH, & Rando TA (2013). Molecular regulation of stem cell quiescence. Nat Rev Mol Cell Biol, 14(6). 10.1038/nrm3591 [DOI] [PMC free article] [PubMed] [Google Scholar]
- Choi JY, Kim JY, Park J, Lee WT, & Lee JE (2017). M2 Phenotype Microglia-derived Cytokine Stimulates Proliferation and Neuronal Differentiation of Endogenous Stem Cells in Ischemic Brain. Exp Neurobiol, 26(1), 33–41. 10.5607/en.2017.26.1.33 [DOI] [PMC free article] [PubMed] [Google Scholar]
- Choi YS, Cho HY, Hoyt KR, Naegele JR, & Obrietan K (2008). IGF-1 Receptor-Mediated ERK/MAPK Signaling Couples Status Epilepticus to Progenitor Cell Proliferation in the Subgranular Layer of the Dentate Gyrus. Glia, 56(7), 791–800. 10.1002/glia.20653 [DOI] [PMC free article] [PubMed] [Google Scholar]
- de Preux Charles AS, Bise T, Baier F, Marro J, & Jazwinska A (2016). Distinct effects of inflammation on preconditioning and regeneration of the adult zebrafish heart. Open Biol, 6(7). 10.1098/rsob.160102 [DOI] [PMC free article] [PubMed] [Google Scholar]
- Diaz-Aparicio I, Paris I, Sierra-Torre V, Plaza-Zabala A, Rodriguez-Iglesias N, Marquez-Ropero M, … Sierra A (2020). Microglia Actively Remodel Adult Hippocampal Neurogenesis through the Phagocytosis Secretome. J Neurosci, 40(7), 1453–1482. 10.1523/JNEUROSCI.0993-19.2019 [DOI] [PMC free article] [PubMed] [Google Scholar]
- Ekdahl CT, Claasen JH, Bonde S, Kokaia Z, & Lindvall O (2003). Inflammation is detrimental for neurogenesis in adult brain. Proc Natl Acad Sci U S A, 100(23), 13632–13637. 10.1073/pnas.2234031100 [DOI] [PMC free article] [PubMed] [Google Scholar]
- Ekdahl CT, Kokaia Z, & Lindvall O (2009). Brain inflammation and adult neurogenesis: the dual role of microglia. Neuroscience, 158(3), 1021–1029. 10.1016/j.neuroscience.2008.06.052 [DOI] [PubMed] [Google Scholar]
- Ellett F, Pase L, Hayman JW, Andrianopoulos A, & Lieschke GJ (2011). mpeg1 promoter transgenes direct macrophage-lineage expression in zebrafish. Blood, 117(4), e49–56. 10.1182/blood-2010-10-314120 [DOI] [PMC free article] [PubMed] [Google Scholar]
- Ellett F, Pase L, Hayman JW, Andrianopoulos A, & Lieschke GJ (2011). mpeg1 promoter transgenes direct macrophage-lineage expression in zebrafish 10.1182/blood-2010-10-314120 [DOI] [PMC free article] [PubMed]
- Elsaeidi F, Macpherson P, Mills EA, Jui J, Flannery JG, & Goldman D (2018). Notch suppression collaborates with Ascl1 and Lin28 to unleash a regenerative response in fish retina, but not in mice. J Neurosci 10.1523/jneurosci.2126-17.2018 [DOI] [PMC free article] [PubMed]
- Fang Y, Gupta V, Karra R, Holdway JE, Kikuchi K, & Poss KD (2013). Translational profiling of cardiomyocytes identifies an early Jak1/Stat3 injury response required for zebrafish heart regeneration. Proc Natl Acad Sci U S A, 110(33), 13416–13421. 10.1073/pnas.1309810110 [DOI] [PMC free article] [PubMed] [Google Scholar]
- Fang Y, Gupta V, Karra R, Holdway JE, Kikuchi K, & Poss KD (2013). Translational profiling of cardiomyocytes identifies an early Jak1/Stat3 injury response required for zebrafish heart regeneration 10.1073/pnas.1309810110 [DOI] [PMC free article] [PubMed]
- Fausett BV, & Goldman D (2006a). A role for alpha1 tubulin-expressing Muller glia in regeneration of the injured zebrafish retina. J Neurosci, 26(23), 6303–6313. 10.1523/JNEUROSCI.0332-06.2006 [DOI] [PMC free article] [PubMed] [Google Scholar]
- Fausett BV, & Goldman D (2006b). A role for alpha1 tubulin-expressing Müller glia in regeneration of the injured zebrafish retina. J Neurosci, 26(23), 6303–6313. 10.1523/JNEUROSCI.0332-06.2006 [DOI] [PMC free article] [PubMed] [Google Scholar]
- Fausett BV, Gumerson JD, & Goldman D (2008). The proneural basic helix-loop-helix gene ascl1a is required for retina regeneration. J Neurosci, 28(5), 1109–1117. 10.1523/jneurosci.4853-07.2008 [DOI] [PMC free article] [PubMed] [Google Scholar]
- Ferrero G, Gomez E, Lyer S, Rovira M, Miserocchi M, Langenau DM, … Wittamer V (2020). The macrophage-expressed gene (mpeg) 1 identifies a subpopulation of B cells in the adult zebrafish. J Leukoc Biol 10.1002/jlb.1a1119-223r [DOI] [PMC free article] [PubMed]
- Fitch MT, & Silver J (2008). CNS injury, glial scars, and inflammation: Inhibitory extracellular matrices and regeneration failure. Exp Neurol, 209(2), 294–301. 10.1016/j.expneurol.2007.05.014 [DOI] [PMC free article] [PubMed] [Google Scholar]
- Gerlach J, Donkels C, Munzner G, & Haas CA (2016). Persistent Gliosis Interferes with Neurogenesis in Organotypic Hippocampal Slice Cultures. Front Cell Neurosci, 10, 131. 10.3389/fncel.2016.00131 [DOI] [PMC free article] [PubMed] [Google Scholar]
- Ghosh S, & Hui SP (2016). Regeneration of Zebrafish CNS: Adult Neurogenesis. Neural Plast, 2016, 5815439. 10.1155/2016/5815439 [DOI] [PMC free article] [PubMed] [Google Scholar]
- Goldman D (2014). Muller glial cell reprogramming and retina regeneration. Nat Rev Neurosci, 15(7), 431–442. 10.1038/nrn3723 [DOI] [PMC free article] [PubMed] [Google Scholar]
- Goldman D (2015). Retinal Injury, Growth Factors, and Cytokines Converge on β-Catenin and pStat3 Signaling to Stimulate Retina Regeneration: Cell Reports http://www.cell.com/cell-reports/abstract/S2211-1247(14)00724–4 [DOI] [PMC free article] [PubMed]
- Goldman D, & Ding J (2000). Different regulatory elements are necessary for alpha1 tubulin induction during CNS development and regeneration [Research Support, Non-U.S. Gov’t]. Neuroreport, 11(17), 3859–3863. [DOI] [PubMed] [Google Scholar]
- Goldman D, Hankin M, Li Z, Dai X, & Ding J (2001). Transgenic zebrafish for studying nervous system development and regeneration. Transgenic Res, 10(1), 21–33. [DOI] [PubMed] [Google Scholar]
- Hao J, Li TG, Qi X, Zhao DF, & Zhao GQ (2006). WNT/beta-catenin pathway up-regulates Stat3 and converges on LIF to prevent differentiation of mouse embryonic stem cells. Dev Biol, 290(1), 81–91. 10.1016/j.ydbio.2005.11.011 [DOI] [PubMed] [Google Scholar]
- Hilla AM, Diekmann H, & Fischer D (2017). Microglia Are Irrelevant for Neuronal Degeneration and Axon Regeneration after Acute Injury. J Neurosci, 37(25), 6113–6124. 10.1523/jneurosci.0584-17.2017 [DOI] [PMC free article] [PubMed] [Google Scholar]
- Hoodless LJ, Lucas CD, Duffin R, Denvir MA, Haslett C, Tucker CS, & Rossi AG (2016). Genetic and pharmacological inhibition of CDK9 drives neutrophil apoptosis to resolve inflammation in zebrafish in vivo. Sci Rep, 5, 36980. 10.1038/srep36980 [DOI] [PMC free article] [PubMed] [Google Scholar]
- Huang T, Cui J, Li L, Hitchcock PF, & Li Y (2012). The role of microglia in the neurogenesis of zebrafish retina. Biochemical and Biophysical Research Communications, 421(2), 214–220. 10.1016/j.bbrc.2012.03.139 [DOI] [PMC free article] [PubMed] [Google Scholar]
- Iosif RE, Ekdahl CT, Ahlenius H, Pronk CJ, Bonde S, Kokaia Z, … Lindvall O (2006). Tumor necrosis factor receptor 1 is a negative regulator of progenitor proliferation in adult hippocampal neurogenesis. J Neurosci, 26(38), 9703–9712. 10.1523/jneurosci.2723-06.2006 [DOI] [PMC free article] [PubMed] [Google Scholar]
- Jin X, & Yamashita T (2016). Microglia in central nervous system repair after injury. J Biochem, 159(5), 491–496. 10.1093/jb/mvw009 [DOI] [PubMed] [Google Scholar]
- Kassen SC, Ramanan V, Montgomery JE, T Burket C, Liu CG, Vihtelic TS, & Hyde DR (2007). Time course analysis of gene expression during light-induced photoreceptor cell death and regeneration in albino zebrafish. Dev Neurobiol, 67(8), 1009–1031. 10.1002/dneu.20362 [DOI] [PubMed] [Google Scholar]
- Katz S, Cussigh D, Urban N, Blomfield I, Guillemot F, Bally-Cuif L, & Coolen M (2016). A Nuclear Role for miR-9 and Argonaute Proteins in Balancing Quiescent and Activated Neural Stem Cell States. Cell Rep, 17(5), 1383–1398. 10.1016/j.celrep.2016.09.088 [DOI] [PMC free article] [PubMed] [Google Scholar]
- Kishimoto N, Shimizu K, & Sawamoto K (2012). Neuronal regeneration in a zebrafish model of adult brain injury. Dis Model Mech, 5(2), 200–209. 10.1242/dmm.007336 [DOI] [PMC free article] [PubMed] [Google Scholar]
- Kizil C, Kaslin J, Kroehne V, & Brand M (2012). Adult neurogenesis and brain regeneration in zebrafish. Dev Neurobiol, 72(3), 429–461. 10.1002/dneu.20918 [DOI] [PubMed] [Google Scholar]
- Kizil C, Kyritsis N, Dudczig S, Kroehne V, Freudenreich D, Kaslin J, & Brand M (2012). Regenerative neurogenesis from neural progenitor cells requires injury-induced expression of Gata3. Dev Cell, 23(6), 1230–1237. 10.1016/j.devcel.2012.10.014 [DOI] [PubMed] [Google Scholar]
- Kroehne V, Freudenreich D, Hans S, Kaslin J, & Brand M (2011). Regeneration of the adult zebrafish brain from neurogenic radial glia-type progenitors. Development, 138(22), 4831–4841. 10.1242/dev.072587 [DOI] [PubMed] [Google Scholar]
- Kyritsis N, Kizil C, Zocher S, Kroehne V, Kaslin J, Freudenreich D, … Brand M (2012). Acute inflammation initiates the regenerative response in the adult zebrafish brain. Science, 338(6112), 1353–1356. 10.1126/science.1228773 [DOI] [PubMed] [Google Scholar]
- Lai SL, Marín-Juez R, Moura PL, Kuenne C, Lai JKH, Tsedeke AT, … Stainier D Y. (2017). Reciprocal analyses in zebrafish and medaka reveal that harnessing the immune response promotes cardiac regeneration. Elife, 6. 10.7554/eLife.25605 [DOI] [PMC free article] [PubMed] [Google Scholar]
- Lam RS, Topfer FM, Wood PG, Busskamp V, & Bamberg E (2017). Functional Maturation of Human Stem Cell-Derived Neurons in Long-Term Cultures. PLoS One, 12(1), e0169506. 10.1371/journal.pone.0169506 [DOI] [PMC free article] [PubMed] [Google Scholar]
- Leach LL NJH, G. SM, G. AE, & G. JM (2021). The immune response is a critical regulator of zebrafish retinal pigment epithelium regeneration. Proceedings of the National Academy of Sciences of the United States of America, 118(21). 10.1073/pnas.2017198118 [DOI] [PMC free article] [PubMed] [Google Scholar]
- Levy D, & Darnell J (2002). Stats: transcriptional control and biological impact. Nature reviews. Molecular cell biology, 3(9). 10.1038/nrm909 [DOI] [PubMed] [Google Scholar]
- Li, S. YQ, WQ Z, & W. ZL (2012). Live imaging reveals differing roles of macrophages and neutrophils during zebrafish tail fin regeneration. The Journal of biological chemistry, 287(30). 10.1074/jbc.M112.349126 [DOI] [PMC free article] [PubMed] [Google Scholar]
- Li L, Jin H, Xu J, Shi Y, & Wen Z (2011). Irf8 regulates macrophage versus neutrophil fate during zebrafish primitive myelopoiesis. Blood, 117(4), 1359–1369. 10.1182/blood-2010-06-290700 [DOI] [PubMed] [Google Scholar]
- Li VS, SS N, PJ B, TY L, WR K, JP G, … C. H (2012). Wnt signaling through inhibition of β-catenin degradation in an intact Axin1 complex. Cell, 149(6). 10.1016/j.cell.2012.05.002 [DOI] [PubMed] [Google Scholar]
- Liang J, Wang D, Renaud G, Wolfsberg TG, Wilson AF, & Burgess SM (2012). The stat3/socs3a pathway is a key regulator of hair cell regeneration in zebrafish. [corrected]. J Neurosci, 32(31), 10662–10673. 10.1523/jneurosci.5785-10.2012 [DOI] [PMC free article] [PubMed] [Google Scholar]
- Liu K, Jiang M, Lu Y, Chen H, Sun J, Wu S, … Que J (2013). Sox2 Cooperates with Inflammation-Mediated Stat3 Activation in the Malignant Transformation of Foregut Basal Progenitor Cells. Cell Stem Cell, 12(3), 304–315. 10.1016/j.stem.2013.01.007 [DOI] [PMC free article] [PubMed] [Google Scholar]
- Lorchner H, Poling J, Gajawada P, Hou Y, Polyakova V, Kostin S, … Braun T (2015). Myocardial healing requires Reg3beta-dependent accumulation of macrophages in the ischemic heart. Nat Med, 21(4), 353–362. 10.1038/nm.3816 [DOI] [PubMed] [Google Scholar]
- Lotan M, & Schwartz M (1994). Cross talk between the immune system and the nervous system in response to injury: implications for regeneration. FASEB J, 8(13), 1026–1033. [DOI] [PubMed] [Google Scholar]
- MacDonald BT, K, T., & X, H. (2009). Wnt/beta-catenin signaling: components, mechanisms, and diseases. Developmental Cell, 17(1). 10.1016/j.devcel.2009.06.016 [DOI] [PMC free article] [PubMed] [Google Scholar]
- Maria I, & David H (2022). Different inflammation responses modulate Müller glia proliferation in the acute or chronically damaged zebrafish retina. Frontiers in cell and developmental biology, 10. 10.3389/fcell.2022.892271 [DOI] [PMC free article] [PubMed]
- Martinez FO, & Gordon S (2014). The M1 and M2 paradigm of macrophage activation: time for reassessment. F1000Prime Rep, 6, 13. 10.12703/p6-13 [DOI] [PMC free article] [PubMed] [Google Scholar]
- Mathias JR, Dodd ME, Walters KB, Rhodes J, Kanki JP, Look AT, & Huttenlocher A (2007). Live imaging of chronic inflammation caused by mutation of zebrafish Hai1. J Cell Sci, 120(Pt 19), 3372–3383. 10.1242/jcs.009159 [DOI] [PubMed] [Google Scholar]
- Ming GL, & Song H (2011). Adult neurogenesis in the mammalian brain: significant answers and significant questions. Neuron, 70(4), 687–702. 10.1016/j.neuron.2011.05.001 [DOI] [PMC free article] [PubMed] [Google Scholar]
- Monje ML, Toda H, & Palmer TD (2003). Inflammatory blockade restores adult hippocampal neurogenesis. Science, 302(5651), 1760–1765. 10.1126/science.1088417 [DOI] [PubMed] [Google Scholar]
- Mori T, Miyamoto T, Yoshida H, Asakawa M, Kawasumi M, Kobayashi T, … Yoshimura A (2011). IL-1beta and TNFalpha-initiated IL-6-STAT3 pathway is critical in mediating inflammatory cytokines and RANKL expression in inflammatory arthritis. Int Immunol, 23(11), 701–712. 10.1093/intimm/dxr077 [DOI] [PubMed] [Google Scholar]
- Moyse, & Richardson. (2020). A Population of Injury-Responsive Lymphoid Cells Expresses mpeg1.1 in the Adult Zebrafish Heart. ImmunoHorizons, 4(8). 10.4049/immunohorizons.2000063 [DOI] [PubMed] [Google Scholar]
- März M, Schmidt R, Rastegar S, & Strähle U (2011). Regenerative response following stab injury in the adult zebrafish telencephalon. Developmental dynamics : an official publication of the American Association of Anatomists, 240(9). 10.1002/dvdy.22710 [DOI] [PubMed] [Google Scholar]
- Nelson CM, Ackerman KM, O’Hayer P, Bailey TJ, Gorsuch RA, & Hyde DR (2013). Tumor necrosis factor-alpha is produced by dying retinal neurons and is required for Muller glia proliferation during zebrafish retinal regeneration. J Neurosci, 33(15), 6524–6539. 10.1523/jneurosci.3838-12.2013 [DOI] [PMC free article] [PubMed] [Google Scholar]
- Nelson CM, Gorsuch RA, Bailey TJ, Ackerman KM, Kassen SC, & Hyde DR (2012). Stat3 defines three populations of Muller glia and is required for initiating maximal muller glia proliferation in the regenerating zebrafish retina. J Comp Neurol, 520(18), 4294–4311. 10.1002/cne.23213 [DOI] [PMC free article] [PubMed] [Google Scholar]
- Nguyen-Chi M, Laplace-Builhe B, Travnickova J, Luz-Crawford P, Tejedor G, Phan QT, … Djouad F (2015). Identification of polarized macrophage subsets in zebrafish. Elife, 4, e07288. 10.7554/eLife.07288 [DOI] [PMC free article] [PubMed] [Google Scholar]
- Oosterhof N, Kuil LE, van der Linde HC, Burm SM, Berdowski W, van Ijcken WFJ, … van Ham TJ (2018). Colony-Stimulating Factor 1 Receptor (CSF1R) Regulates Microglia Density and Distribution, but Not Microglia Differentiation In Vivo. Cell Rep, 24(5), 1203–1217.e1206. 10.1016/j.celrep.2018.06.113 [DOI] [PubMed] [Google Scholar]
- Parent JM, Valentin VV, & Lowenstein DH (2002). Prolonged seizures increase proliferating neuroblasts in the adult rat subventricular zone-olfactory bulb pathway. J Neurosci, 22(8), 3174–3188. https://doi.org/20026296 [DOI] [PMC free article] [PubMed] [Google Scholar]
- Parichy DM, Ransom DG, Paw B, Zon LI, & Johnson SL (2000). An orthologue of the kit-related gene fms is required for development of neural crest-derived xanthophores and a subpopulation of adult melanocytes in the zebrafish, Danio rerio. Development, 127(14), 3031–3044. 10.1242/dev.127.14.3031 [DOI] [PubMed] [Google Scholar]
- Park HC, Shin J, Roberts RK, & Appel B (2007). An olig2 reporter gene marks oligodendrocyte precursors in the postembryonic spinal cord of zebrafish. Dev Dyn, 236(12), 3402–3407. 10.1002/dvdy.21365 [DOI] [PubMed] [Google Scholar]
- Peretto P, & Bonfanti L (2014). Major unsolved points in adult neurogenesis: doors open on a translational future? Front Neurosci, 8. 10.3389/fnins.2014.00154 [DOI] [PMC free article] [PubMed] [Google Scholar]
- Petrie TA, Strand NS, Yang CT, Rabinowitz JS, & Moon RT (2014). Macrophages modulate adult zebrafish tail fin regeneration. Development, 141(13), 2581–2591. 10.1242/dev.098459 [DOI] [PMC free article] [PubMed] [Google Scholar]
- Poss KD, Wilson LG, & Keating MT (2002). Heart regeneration in zebrafish. Science, 298(5601), 2188–2190. 10.1126/science.1077857 [DOI] [PubMed] [Google Scholar]
- Ramachandran R, Reifler A, Parent JM, & Goldman D (2010). Conditional gene expression and lineage tracing of tuba1a expressing cells during zebrafish development and retina regeneration. J Comp Neurol, 518(20), 4196–4212. 10.1002/cne.22448 [DOI] [PMC free article] [PubMed] [Google Scholar]
- Ramachandran R, Zhao XF, & Goldman D (2011). Ascl1a/Dkk/beta-catenin signaling pathway is necessary and glycogen synthase kinase-3beta inhibition is sufficient for zebrafish retina regeneration. Proc Natl Acad Sci U S A, 108(38), 15858–15863. 10.1073/pnas.1107220108 [DOI] [PMC free article] [PubMed] [Google Scholar]
- Ransohoff RM (2016). A polarizing question: do M1 and M2 microglia exist? Nat Neurosci, 19(8), 987–991. 10.1038/nn.4338 [DOI] [PubMed] [Google Scholar]
- Richmond CA, Rickner H, Shah MS, Ediger T, Deary L, Zhou F, … Breault DT (2018). JAK/STAT-1 Signaling Is Required for Reserve Intestinal Stem Cell Activation during Intestinal Regeneration Following Acute Inflammation. Stem Cell Reports, 10(1), 17–26. 10.1016/j.stemcr.2017.11.015 [DOI] [PMC free article] [PubMed] [Google Scholar]
- Rovira M, M M, A M, L H, L C, J P, … V W (2022). Zebrafish Galectin 3 binding protein is the target antigen of the microglial 4C4 monoclonal antibody. Developmental dynamics : an official publication of the American Association of Anatomists 10.1002/dvdy.549 [DOI] [PubMed]
- Sanz-Morejon A, Garcia-Redondo AB, Reuter H, Marques IJ, Bates T, Galardi-Castilla M, … Mercader N (2019). Wilms Tumor 1b Expression Defines a Pro-regenerative Macrophage Subtype and Is Required for Organ Regeneration in the Zebrafish. Cell Rep, 28(5), 1296–1306.e1296. 10.1016/j.celrep.2019.06.091 [DOI] [PMC free article] [PubMed] [Google Scholar]
- Schindelin J, Arganda-Carreras I, Frise E, Kaynig V, Longair M, Pietzsch T, … Cardona A (2012). Fiji: an open-source platform for biological-image analysis. Nat Methods, 9(7), 676–682. 10.1038/nmeth.2019 [DOI] [PMC free article] [PubMed] [Google Scholar]
- Schmidt R, Beil T, Strähle U, & Rastegar S (2014). Stab wound injury of the zebrafish adult telencephalon: a method to investigate vertebrate brain neurogenesis and regeneration. J Vis Exp(90), e51753. 10.3791/51753 [DOI] [PMC free article] [PubMed] [Google Scholar]
- Sehring IM, Jahn C, & Weidinger G (2016). Zebrafish fin and heart: what’s special about regeneration? Curr Opin Genet Dev, 40, 48–56. 10.1016/j.gde.2016.05.011 [DOI] [PubMed] [Google Scholar]
- Senut MC, Gulati-Leekha A, & Goldman D (2004). An element in the alpha1-tubulin promoter is necessary for retinal expression during optic nerve regeneration but not after eye injury in the adult zebrafish. J Neurosci, 24(35), 7663–7673. 10.1523/JNEUROSCI.2281-04.2004 [DOI] [PMC free article] [PubMed] [Google Scholar]
- Shiau CE, Kaufman Z, Meireles AM, & Talbot WS (2015). Differential requirement for irf8 in formation of embryonic and adult macrophages in zebrafish. PLoS One, 10(1), e0117513. 10.1371/journal.pone.0117513 [DOI] [PMC free article] [PubMed] [Google Scholar]
- Shigemoto-Mogami Y, Hoshikawa K, Goldman JE, Sekino Y, & Sato K (2014). Microglia enhance neurogenesis and oligodendrogenesis in the early postnatal subventricular zone. J Neurosci, 34(6), 2231–2243. 10.1523/jneurosci.1619-13.2014 [DOI] [PMC free article] [PubMed] [Google Scholar]
- Shimizu N, Kawakami K, & Ishitani T (2012). Visualization and exploration of Tcf/Lef function using a highly responsive Wnt/beta-catenin signaling-reporter transgenic zebrafish. Dev Biol, 370(1), 71–85. 10.1016/j.ydbio.2012.07.016 [DOI] [PubMed] [Google Scholar]
- Shimizu Y, Ueda Y, & Ohshima T (2018). Wnt signaling regulates proliferation and differentiation of radial glia in regenerative processes after stab injury in the optic tectum of adult zebrafish. Glia 10.1002/glia.23311 [DOI] [PubMed]
- Sierra A, Encinas JM, Deudero JJ, Chancey JH, Enikolopov G, Overstreet-Wadiche LS, … Maletic-Savatic M (2010). Microglia shape adult hippocampal neurogenesis through apoptosis-coupled phagocytosis. Cell Stem Cell, 7(4), 483–495. 10.1016/j.stem.2010.08.014 [DOI] [PMC free article] [PubMed] [Google Scholar]
- Silver J, & Miller JH (2004). Regeneration beyond the glial scar. Nature Reviews Neuroscience, 5(2), 146–156. 10.1038/nrn1326 [DOI] [PubMed] [Google Scholar]
- Skaggs K, Goldman D, & Parent JM (2014). Excitotoxic brain injury in adult zebrafish stimulates neurogenesis and long-distance neuronal integration. Glia, 62(12), 2061–2079. 10.1002/glia.22726 [DOI] [PMC free article] [PubMed] [Google Scholar]
- Sun F, Park KK, Belin S, Wang D, Lu T, Chen G, … He Z (2011). Sustained axon regeneration induced by co-deletion of PTEN and SOCS3. Nature, 480(7377), 372–375. 10.1038/nature10594 [DOI] [PMC free article] [PubMed] [Google Scholar]
- Than-Trong E, & Bally-Cuif L (2015). Radial glia and neural progenitors in the adult zebrafish central nervous system. Glia, 63(8), 1406–1428. 10.1002/glia.22856 [DOI] [PubMed] [Google Scholar]
- Todd L, Squires N, Suarez L, & Fischer AJ (2016). Jak/Stat signaling regulates the proliferation and neurogenic potential of Muller glia-derived progenitor cells in the avian retina. Sci Rep, 6, 35703. 10.1038/srep35703 [DOI] [PMC free article] [PubMed] [Google Scholar]
- Tsarouchas D,W, L C, T M, K. M, L. M, … CG B (2018). Dynamic control of proinflammatory cytokines Il-1β and Tnf-α by macrophages in zebrafish spinal cord regeneration. Nature communications, 9(1). 10.1038/s41467-018-07036-w [DOI] [PMC free article] [PubMed] [Google Scholar]
- Unger MS, Schernthaner P, Marschallinger J, Mrowetz H, & Aigner L (2018). Microglia prevent peripheral immune cell invasion and promote an anti-inflammatory environment in the brain of APP-PS1 transgenic mice. J Neuroinflammation, 15(1), 274. 10.1186/s12974-018-1304-4 [DOI] [PMC free article] [PubMed] [Google Scholar]
- van Ham TJ, Brady CA, Kalicharan RD, Oosterhof N, Kuipers J, Veenstra-Algra A, … Giepmans BN (2014). Intravital correlated microscopy reveals differential macrophage and microglial dynamics during resolution of neuroinflammation. Dis Model Mech, 7(7), 857–869. 10.1242/dmm.014886 [DOI] [PMC free article] [PubMed] [Google Scholar]
- Veldman MB, Bemben MA, & Goldman D (2010). Tuba1a gene expression is regulated by KLF6/7 and is necessary for CNS development and regeneration in zebrafish. Mol Cell Neurosci, 43(4), 370–383. 10.1016/j.mcn.2010.01.004 [DOI] [PMC free article] [PubMed] [Google Scholar]
- Walton EM, Cronan MR, Beerman RW, & Tobin DM (2015). The Macrophage-Specific Promoter mfap4 Allows Live, Long-Term Analysis of Macrophage Behavior during Mycobacterial Infection in Zebrafish. PLoS One, 10(10), e0138949. 10.1371/journal.pone.0138949 [DOI] [PMC free article] [PubMed] [Google Scholar]
- Wan J, Ramachandran R, & Goldman D (2012). HB-EGF is necessary and sufficient for Muller glia dedifferentiation and retina regeneration. Dev Cell, 22(2), 334–347. 10.1016/j.devcel.2011.11.020 [DOI] [PMC free article] [PubMed] [Google Scholar]
- Wan J, Zhao XF, Vojtek A, & Goldman D (2014). Retinal injury, growth factors, and cytokines converge on β-catenin and pStat3 signaling to stimulate retina regeneration. Cell Rep, 9(1), 285–297. 10.1016/j.celrep.2014.08.048 [DOI] [PMC free article] [PubMed] [Google Scholar]
- Wehner D, Cizelsky W, Vasudevaro MD, Ozhan G, Haase C, Kagermeier-Schenk B, … Weidinger G (2014). Wnt/beta-catenin signaling defines organizing centers that orchestrate growth and differentiation of the regenerating zebrafish caudal fin. Cell Rep, 6(3), 467–481. 10.1016/j.celrep.2013.12.036 [DOI] [PubMed] [Google Scholar]
- White DT, S S, MT S, Q X, J H, D D, … JS M (2017). Immunomodulation-accelerated neuronal regeneration following selective rod photoreceptor cell ablation in the zebrafish retina. Proceedings of the National Academy of Sciences of the United States of America, 114(18). 10.1073/pnas.1617721114 [DOI] [PMC free article] [PubMed] [Google Scholar]
- Zambusi A, & Ninkovic J (2020). Regeneration of the central nervous system-principles from brain regeneration in adult zebrafish. World J Stem Cells, 12(1), 8–24. 10.4252/wjsc.v12.i1.8 [DOI] [PMC free article] [PubMed] [Google Scholar]
- Zhao XF, & Goldman D (2014). A new transgenic line reporting pStat3 signaling in glia. Zebrafish, 11(6), 588–589. 10.1089/zeb.2014.1502 [DOI] [PMC free article] [PubMed] [Google Scholar]
- Zhao XF, Wan J, Powell C, Ramachandran R, Myers MG, & Goldman D (2014). Leptin and IL-6 family cytokines synergize to stimulate Müller glia reprogramming and retina regeneration. Cell Rep, 9(1), 272–284. 10.1016/j.celrep.2014.08.047 [DOI] [PMC free article] [PubMed] [Google Scholar]
- Zupanc GK, & Sirbulescu RF (2011). Adult neurogenesis and neuronal regeneration in the central nervous system of teleost fish. Eur J Neurosci, 34(6), 917–929. 10.1111/j.1460-9568.2011.07854.x [DOI] [PubMed] [Google Scholar]
Associated Data
This section collects any data citations, data availability statements, or supplementary materials included in this article.
Supplementary Materials
Figure S1. Liposomal clodronate efficiently suppresses activated microglia. a. Confocal images of telencephala after reporter labeling for macrophages Tg(mpeg:GFP; green; top panels) alone or with co-immunolabeling for activated microglia (4C4; red; bottom panels) at 3 and 4 dpl. The dashed line indicates the midline. b. Quantification of the percentages of mpeg:GFP-labeled cells expressing 4C4 at different time points. ***p<0.0001. c. Quantification of mpeg:GFP/4C4 double-positive microglia (blue line) or mpeg:GFP+/4C4- macrophages (red line) from the contralateral hemi-telencephala at different time points after injury and in uninjured fish. The asterisks indicate statistical significance compared to uninjured. **p<0.001, ***p<0.0001. d. 4C4 immunostaining of ipsilesional hemi-telencephala from control (top row) and clodronate-treated fish (bottom row) at 1, 4 or 7 dpl. The far-right panels display 4C4 immunolabeling of uninjured hemi-telencephala. e. Quantification of mpeg:GFP+ cells in the ipsilesional hemisphere at 2 dpl in control and clodronate groups. ***, p < 0.0001. f. Quantification of 4C4 immunoreactivity from uninjured fish and the contralateral hemi-telencephala at different time points after injury. g. Quantification of mpeg:GFP+ cells from the contralateral hemisphere at 2 dpl in PBS control and clodronate groups. h. Confocal images of the injured hemi-telencephala after double labeling for 4C4 (green) and TUNEL stain (red) at 2 dpl in control liposome or clodronate liposome treated fish. Arrows shows double-positive cells and arrowheads show cells positive for TUNEL stain only. h’. Magnified images of injury region and insets showing a cell double-positive for both TUNEL and 4C4. Scale bars = 100 μm and the error bars indicate SEM.
Figure S2. Microglial ablation alters post-injury cell proliferation. a. Quantification of EdU+ cells from the ipsilesional telencephalic hemispheres at 14 dpl in control and clodronate groups. ***, p <0.0001. b, c. Quantification of EdU+ cells and EdU/HuC/D double-labeled cells from the contralesional side at 14 (b) and 21 (c) dpl. d. GFP immunolabeling of the contralesional hemispheres from her4.1:GFP reporter fish at 2 dpl with (right) or without (left) 4-OH-TMX treatment. The dashed lines outline the hemispheres. e. GFP immunolabeling of telencephala from her4.1:GFP reporter fish at 1 (1 brain) and 2 (2 brains) dpl after 4-OH-TMX treatment. Dashed lines denote the midline, and the injured hemisphere is on the right. f. Quantification of cells labeled for GFP, GFP+EdU and GFP+HuC/D in the contralateral hemi-telencephala at 14 and 28 dpl in control liposome or clodronate liposome treated fish. g. EdU labeling of the contralateral side at 2 dpl in representative hemi-telencephala from control and clodronate groups. h. Quantification of EdU+ cells in the contralateral hemi-telencephala at 1, 2, 4 and 7 dpl. i. Quantification of EdU+ cells in the ventricular zone (blue outline in inset) of the ipsilesional hemi-telencephala at 1, 2, 4 and 7 dpl. ***, p<0.0001. j. Quantification of EdU+ cells in the subventricular zone (SVZ) and the parenchymal region (blue label in inset) of the ipsilesional hemi-telencephala at 1, 2, 4 and 7 dpl. **, p <0.001; ***, p<0.0001. Scale bars = 100 μm and error bars indicate SEM.
Figure S3. Microglial ablation inhibits progenitor cell amplification. a. Confocal images of telencephalic sections co-labeled for gfap-driven GFP reporter and TUNEL stain at 2 dpl at the midline VZ of control and clodronate treated fish. Arrows denote double-labeled cells. b. Images show red fluorescent liposomes at 1 and 2 dpl. The telencephala are outlined by dotted lines and the dotted circles mark the injury sites. c. Double labeling for radial glia with GFAP immunolabeling (green) and red fluorescent liposomes at 2 dpl. The boxed area is shown at higher magnification on the right. Note minimal uptake of red fluorescent liposomes by radial glia. d. Staining for macrophages/microglia (mpeg:GFP) and red fluorescent liposomes at 2 dpl. The dashed lines outline the injured hemi-telencephala and the boxed area in the merged image is shown at higher magnification on the right. e. Confocal images from the anterior midline telencephala show double labeling for Sox2 and EdU in control (top row) and clodronate groups (bottom row) at 4 and 7 dpl. EdU was administered at 2 dpl. Boxed areas are shown at higher magnification on the right of each pair of images. f. Confocal images displaying Sox2 and TUNEL double labeling at 2 dpl in control and clodronate groups. The right-sided panels show higher magnification views of the boxed regions. Scale bars = 100 μm.
Figure S4. Microglial and oligodendrocyte proliferation after injury. a. Double labeling for 4C4 and EdU in the ipsilateral hemi-telencephala at 2 dpl in control and clodronate groups. Arrows indicate double-labeled cells. The insets at upper right show higher magnification views of the boxed areas. b. Quantification of the percentage of 4C4+ cells at 2, 4 and 7 dpl in the injured hemi-telencephala of control and clodronate groups that had incorporated EdU at 2 dpl. c. Double labeling for Olig2 and EdU in the ipsilateral hemi-telencephala at 2 dpl. The insets at bottom left show higher magnification views of the boxed areas. d. Double labeling for Olig2 and TUNEL at 2 dpl from the ipsilesional side in control and clodronate groups. Arrows indicate rare Olig2/TUNEL double-positive cells. The insets at bottom left show higher magnification views of the boxed areas. e. Quantification of the percentages of proliferating (EdU+) and apoptotic (TUNEL+) Olig2+ cells. f. Quantification of the number of brain with and without lesions in DMSO vs. PLX3397 treated fish, and irf8−/− mutant fish compared to irf8+/− controls. g. Quantification of cells double-labeled for HuC/D and EdU at 21 dpl from irf8 mutants and csf1rDM mutants compared to controls. Scale bars = 100 μm and error bars indicate SEM.
Figure S5. Csf1r inhibition with PLX3397 attenuates injury-induced progenitor cell proliferation and adult neurogenesis. a. Schematic of the experimental design and time course. Red lines are PLX3397 (PLX)-treated groups and blue lines represent DMSO-treated controls. b. Confocal images of immunolabeling to identify proliferating cells (EdU+, red) at 2 dpl in telencephala from injured fish treated with DMSO or PLX3397. The dotted lines outline the injured hemisphere. c. Quantification of cells labeled for EdU incorporation, 4C4 or L-Plastin at 2 dpl after treatment with DMSO or PLX3397. Note the increased numbers of labeled cells seen in the control lesioned group (2 dpl DMSO) but not in the PLX3397-treated, lesioned group (2 dpl PLX). ***, p<0.0001 by t-test. d. Confocal images of EdU labeling in the telencephala of uninjured fish treated with vehicle (DMSO) or PLX3397. EdU was administered at 2 dpl (2 hours prior to euthanasia) after a 9-day exposure to PLX3397 or DMSO. The dashed lines denote the midline. e. Quantification of 4C4- and L-Plastin-positive cells in uninjured fish or the contralesional hemi-telencephala of injured fish at 2 dpl after treatment with DMSO or PLX3397. *, p < 0.01; **, p <0.001. f. Quantification of EdU+ cells in uninjured fish or the contralesional hemi-telencephala at 2 dpl of fish treated with vehicle (DMSO) or PLX3397. *, p < 0.01; **, p < 0.001. g, h. Confocal images of immunolabeling to identify activated microglia (4C4; green in g) or leukocytes (L-Plastin; white in h) at 2 dpl in telencephala from uninjured or injured fish treated with DMSO or PLX3397. Dashed lines indicate the midline. i, j. Quantification of EdU/Sox2 double-labeled cells at 2 dpl (i) and EdU/HuC/D double-labeled cells from the ipsilateral side at 21 dpl (j). ***, p < 0.0001. k. Quantification of the percentage of Sox2+ cells that incorporated EdU in the contralesional side at 2 dpl. **, p < 0.001. l. Quantification of HuC/D and EdU double-labeled cells in the contralesional side at 21 dpl. *, p <0.01. EdU was administered at 2 dpl. m. Images of telencephala from the mfap4 reporter line for macrophages at 2 dpl after control or clodronate treatment. n. Quantification of mfap4 reporter intensity corrected for area using imageJ. Scale bar = 100 μm and error bars indicate SEM.
Figure S6. Microglia are necessary to induce pro-regenerative signaling after injury. a. GFP immunostaining of reporter lines for gfap, ascl1a and Wnt signaling (tcf7) at 2 dpl in control and clodronate groups. b. EdU labeling at 2 dpl for rescue analysis with or without heat shock (HS) in both control liposome and clodronate liposome treated groups. HS induces the HS promoter (hsp) activating stat3, wnt signaling (tcf7) or ascl1a. c. Quantification of EdU- or 4C4-labeled cells from wildtype brains at 2 dpl with or without HS shows that HS alone has no effect on cell numbers. d. qRT-PCR for ascl1a, stat3 and b-catenin in brains from the heat shock experiments. e. immunolabelling for 4C4 and L-Plastin at 2 dpl after control or clodronate treatment. f. Quantification of 4C4-immunolabeled cells at 2 dpl after injury with or without HS in the clodronate rescue experiments. ***, p = 0.0001. Scale bars = 100 μm; error bars indicate SEM in c and SD in d.
Data Availability Statement
The data sets generated and analyzed in this study are available upon request.