

Abstract
Multi-parametric MRI (mpMRI) technology enables non-invasive and quantitative assessments of the structural, molecular, and functional characteristics of various neurological diseases. Despite the recognized importance of studying spinal cord pathology, mpMRI applications in spinal cord research have been somewhat limited, partly due to technical challenges associated with spine imaging. However, advances in imaging techniques and improved image quality now allow longitudinal investigations of a comprehensive range of spinal cord pathological features by exploiting different endogenous MRI contrasts. This review summarizes the use of mpMRI techniques including blood oxygenation level-dependent (BOLD) functional MRI (fMRI), diffusion tensor imaging (DTI), quantitative magnetization transfer (qMT), and chemical exchange saturation transfer (CEST) MRI in monitoring different aspects of spinal cord pathology. These aspects include cyst formation and axonal disruption, demyelination and remyelination, changes in the excitability of spinal grey matter and the integrity of intrinsic functional circuits, and non-specific molecular changes associated with secondary injury and neuroinflammation. These approaches are illustrated with reference to a nonhuman primate (NHP) model of traumatic cervical spinal cord injuries (SCI). We highlight the benefits of using NHP SCI models to guide future studies of human spinal cord pathology, and demonstrate how mpMRI can capture distinctive features of spinal cord pathology that were previously inaccessible. Furthermore, the development of mechanism-based MRI biomarkers from mpMRI studies can provide clinically useful imaging indices for understanding the mechanisms by which injured spinal cords progress and repair. These biomarkers can assist in the diagnosis, prognosis, and evaluation of therapies for SCI patients, potentially leading to improved outcomes.
Keywords: cervical spinal cord, nonhuman primate, hand, sensorimotor, multi-parametric MRI, BOLD, DTI, QMT, CEST
1. Introduction
Traumatic spinal cord injury (SCI) results in sensory, autonomic, and/or motor function impairments and is a leading cause of early disability. The prevalence of SCI in the United States is estimated to affect approximately 1.5 million people [1, 2], while the global burden of disease was estimated to be 780,000 to 1.16 million new cases of SCI worldwide in 2016 [3, 4]. The estimated incidence of SCI in the US is 91,556 cases annually [4]. The compromised quality of life and disability caused by SCI pose significant burdens on patients, their families, and society. Currently, there are limited, clinically validated therapeutic and rehabilitation tools available to facilitate recovery and restoration of lost functions [5–9]. While some lost functions recover over time, others remain permanently impaired, and the underlying mechanisms of spontaneous repairs are not fully understood. However, studies of SCI in animal models have led to considerable progress in understanding the underlying pathology of injury reactions and subsequent repair processes. Several novel therapeutic interventions that showed efficacy in preclinical animal SCI models have been extended to clinical trials [10–15]. Although behavioral assessments are the primary outcome measures used to evaluate the effectiveness of therapeutic interventions, recent clinical trials have shown that behavioral measures alone are inadequate. Diagnoses and prognoses can be challenging to predict without additional, subject-specific information regarding the extent, nature, and heterogeneity of underlying damage and pathological changes. The lack of adequate measures of the composition, structure, and residual function of the injured spinal cord (SC) exacerbates the difficulties in translating promising therapeutics from animal models to human subjects.
The technical and knowledge gaps in SCI research may be partially bridged by preclinical studies in animal models using clinically applicable tools such as MRI. The use of multi-parametric MRI (mpMRI) in non-human primate (NHP) models of SCI is particularly well-suited to address several critical questions that may be difficult to study in human patients. These include understanding how SCI progresses over time, how far from the injury center detectable pathology extends, and how grey matter (GM) and white matter (WM) interact during tissue repair and functional recovery. Additionally, it is important to understand the relationship between MRI metrics and underlying pathological processes in order to interpret imaging information, especially when attempting to use quantitative measues as biomarkers of treatment effects.
This review summarizes the main findings obtained from studies using quantitative mpMRI methods in an NHP model of SCI, and discusses the potential applications of these findings to human subjects with SCI and other pathological conditions. While this review focuses on our studies of NHPs, more comprehensive reviews of MRI methodology and the application of MRI to the human SC have recently been published [16, 17]. For example, Freund et al. (2019) described the application of quantitative MRI measures, including magnetization transfer (MT), magnetic resonance relaxation mapping, diffusion imaging, as well as functional MRI (fMRI) [16]. These methods revealed unique features of the transition from edema and hemorrhage into a cyst that may be missed using only conventional T2-weighted MRI. Their longitudinal studies have shown that while clinical recovery plateaus around 2 years after SCI, quantitative microstructural changes associated with demyelination and degeneration continue for a longer period [16].
2. SCI and repair: dynamic and interconnected pathophysiological processes
Traumatic injury to the SC can cause cell death and create tissue cavities, while subsequent reactions, including inflammation, may stimulate destructive and reparative processes, leading to edema, cyst formation, and demyelination [18–20]. SCI also culminates in glial scarring, which may contain secreted and transmembrane molecular inhibitors of axon growth and serve as a physical barrier that prevents regenerated axons from reaching their targets [21]. Although impaired functions may recover over time through different mechanisms at both the SC and brain levels [22–24], the process of SC response to traumatic injury is dynamic and typically occurs in three phases: acute, subacute, and chronic (for review [25]). Some studies subdivide the phases into four or more periods [26, 27], but these represent continuously evolving and interconnected processes.
Figure 1 presents a schematic illustration of the key pathological processes that occur during each phase of SCI, alongside corresponding mpMRI techniques that may be used to evaluate them [24, 28]. Following the immediate effects of a primary injury, the acute phase is characterized by a cascade of events that can lead to a secondary injury, typically occurring within the first few hours but clinically considered the first 48 hours [27]. Reducing the impact of secondary injury and protecting spared healthy tissues can significantly impact subsequent outcomes and functions [29]. During the acute phase, the secondary injury cascade is characterized by immediate swelling of the cord and the release of cytotoxic metabolites (e.g., glutamate) from disrupted neural tissues, which can substantially compound the initial mechanical damage by harming or killing neighboring cells. Thus, it is critical to quantify the degree of swelling and the release of the main cytotoxic chemicals. The subacute phase spans the next few weeks [27]. Longitudinal clinical studies often begin in the chronic phase after one month or more [30, 31]. In later subacute and chronic phases, an expanding region of necrotic tissue leads to degeneration of both descending and ascending axons, disrupting short- (local and inter-segmental) and long-range (spinocortical) functional connections [24, 32]. Additionally, a cavity or cyst may be formed, and glial scar tissue can act as a physical barrier, preventing axonal growth. These processes have been major targets for developing therapeutic interventions aimed at promoting axonal regeneration, remyelination, and restoration of balanced neural activity and disrupted functional connections [27]. The amount of spared SC tissue and endogenous repairs, such as local nerve fiber sprouting and regeneration around the injured SC, can determine the extent of spontaneous recovery [33–36]. Therefore, assessing these processes is critical.
Figure 1. Illustration of the dynamic and spontaneous recovery following a partial lesion of the spinal cord.
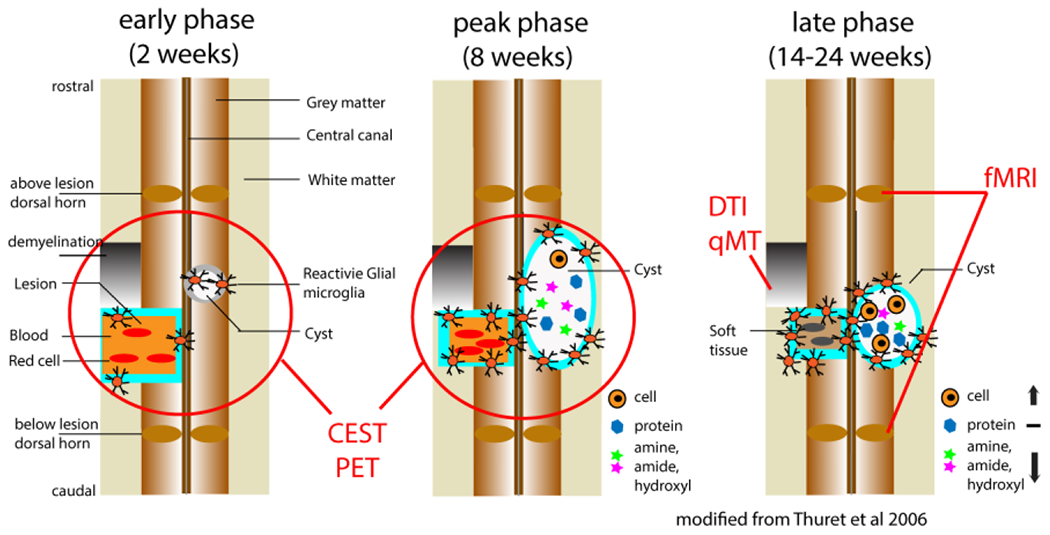
The changes are illustrated on coronal images in three phases: acute, subacute, and chronic. The red lines and circles on the images indicate the pathological processes that each MRI method is sensitive to. Modified from Fig. 1 in [28], from [24].
3. Studying SCI in NHP models
An NHP model of SCI is irreplaceable for SCI research for several reasons. Unlike cats and rodents, the functional and structural regions of the NHP sensorimotor systems share considerable homology with humans. Therefore, studies of monkeys provide a crucial link [37–40] (for a review, see [41]) between the extensive existing literature of animal data obtained with invasive methods and human imaging data [42, 43]. This is particularly true for the cervical SC, which mediates primate-unique dexterous hand uses.
SCI models in NHPs offer an irreplaceable translational model for the development and testing therapies [44–48]. In particular, the dexterous manipulation of objects, a hallmark of primate sensorimotor ability [49–55], is primarily modulated and executed by the cervical SC, which serves as the first central station engaged in this process.
Supported by studies in primates, there is growing recognition that sensory feedback is critical for skilled hand use and recovery after injury. For example, patients with SCI who have residual sensory function recover faster and to greater extents [56, 57]. Multimodal studies have revealed the presence of much more complex functional (as well as anatomical) networks within the cervical cord of monkeys (see Figures 1 and 7), including interactions between sensory and motor components within and across spinal segments [58].
Figure 7. Schematics of intraspinal circuits.
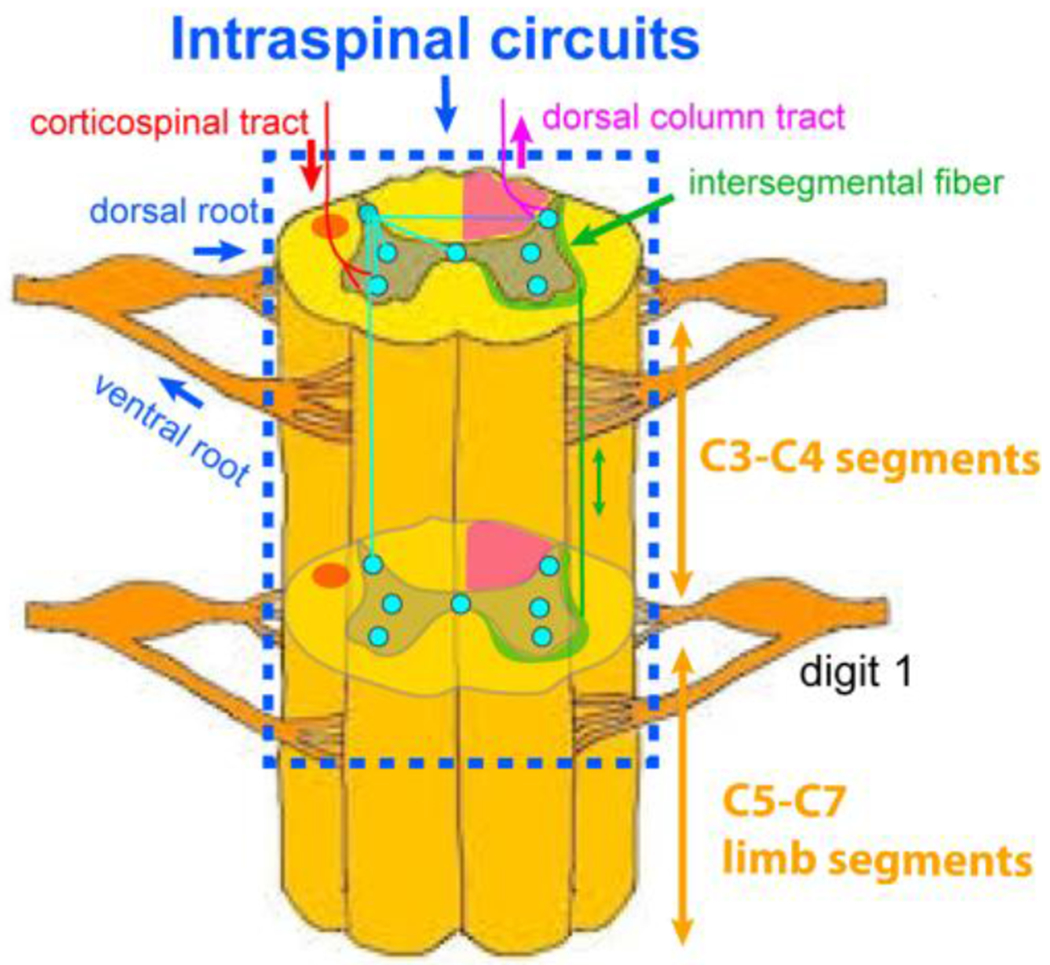
Green stripps indicate the location of intersegmental white matter fibers.
The skilled hand use in monkeys involves sensorimotor systems during the performance of dexterous tasks and in their daily in-cage activities. These behaviors can be quantified and used as objective indicators of the changes in SC circuits. Though a targeted transectional injury such as a unilteral transection of the dorsal column (also known as the dorsal column lesion or DCL SCI model) in the cervical SC of monkeys may not represent the most clinically relevant type of injury, it provides an advantage in separating sensory and motor functions and in connecting specific pathological processes in GM and WM to particular behavior changes. A DCL in the cervical SC of monkeys disrupts the primary ascending pathway of discriminative touch input from one hand, with the extent of injury correlating with impairments in manual dexterity [59–61]. Unlike in rodents, the dorsal column pathway for touch sensation in primates is separate from the primary motor control pathway [23]. Our studies in monkeys with DCL have shown a correlation between the extent of the injury and impairments in manual dexterity [59–61], further attesting to the value of this model for translational studies.
4. The role of non-invasive mpMRI in monitoring SCI progression and recovery
Preclinical mpMRI studies enable a comprehensive investigation of the repair and recovery of a damaged SC. This method allows for visualization, assessment, and tracking of functional, structural, cellular, and molecular changes over time, granting access to a level of detail previously unattainable [62]. Such nuanced information is typically not easily accessible in patients with SCI or other SC pathologies. These studies carry significant clinical relevance as they shed light on the pathological processes causing structural disruption, the formation of glial barriers, and hindering axon regeneration, leading to functional loss. Furthermore, these processes serve as therapeutic targets for promoting neurological recovery.
Animal models of SCI enable more flexible data acquisition and repeated mpMRI measurements over the recovery course. Such models also exhibit a relatively homogeneous pathophysiology. In this review, we concentrate on four mpMRI methods that elucidate illustrate the distinctive yet interrelated pathological responses to traumatic injuries, along with the ensuring subsequent spontaneous repair and recovery processes.
The four mpMRI methods reviewed are (a) blood oxygenation level dependent (BOLD) functional MRI (fMRI), (b) diffusion imaging, particularly diffusion tensor imaging (DTI), (c) quantitative magnetization transfer (qMT) imaging, and (d) chemical exchange saturation transfer (CEST) MRI. Each method captures different tissue properties, thereby providing complementary information about SC pathology. BOLD fMRI allows us to study spinal GM, the integrity of intrinsic functional circuits, and the reorganization of functional connectivity post-injury [58, 63]. DTI and qMT track tissue cavities, the evolution of edema, scar formation, and cyst development [28], axonal disruption, demyelination, and remyelination of WM fiber bundles [59, 64]. CEST MRI monitors molecular changes, such as the releases of neurotransmitters (e.g., glutamate) and byproducts associated with secondary injury [25] and neuroinflammation [28]. Together, these methods have unveiled the distinctive and interconnected pathological reactions to traumatic injuries and the subsequent spontaneous repair and recovery processes. In the following sections, we use data from squirrel monkeys to illustrate the utility of mpMRI in revealing the dynamic and multifaceted process following a SCI. We review each MRI method’s application in monitoring key pathological processes, including the formation of injury-induced tissue cavities, disruptions to descending and ascending WM tracts, changes in GM functional connectivity [58, 63], the evolution of edema and cysts [65], changes in myelination [59, 64], and glial scar formation [65]. Each MRI method and related findings are discussed in the subsequent sections.
4.1. Magnetization Transfer Contrast (MTC) image for revealing SC anatomy
In standard clinical SC scans at 3T [66], 3D T1-weighted (T1W) or T2-weighted (T2W) images are frequently acquired for injury assessment in patients. These conventional images typically have a resolution ranging from 0.8-1 mm isotropic and require 5-10 minutes for acquisition. They offer high contrast between the SC and cerebrospinal fluid (CSF), simplifying the identification of any compression or damage to the SC by assessing cross-sectional area and volume. However, these images usually exhibit poor GM and WM contrast. MRI scanners can also acquire multi-echo gradient echo images to enhance GM and WM contrast by combining echoes, which allows for GM segmentation [66]. Additionally, the open-source human “Spinal Cord Toolbox” [67], developed by Cohen-Adad’s team, has also become a valuable resource for conducting atlas-based group analysis.
However, a well-established and validated atlas for monkeys does not yet exist. Instead, we generated a cervical cord template using MTC contrast. With a high magnetic field strength of 9.4T, a 2D MT-prepared gradient echo sequence with a short repetition time (TR) and a Gaussian radiofrequency (RF) saturation pulse (RF offset 5000 Hz, saturation flip angle 820°, and duration 10 ms) can be acquired. This provides in-plane resolution at 0.333x0.333 mm2 and thickness as low as 0.5 mm, maintaining a good signal-to-noise ratio (SNR) [28, 68]. The MTC preparation pulse selectively reduces the signal more from WM than GM, enhancing the contrast between the two tissue types. Note this effect differs from brain studies. In the spine, the GM appears brighter than the WM, even with very short echo times and short TR values . Images with MTC contrast can clearly separate GM and WM, thus serving as an excellent template for NHP mpMRI studies, as shown in Figure 2A.
Figure 2.
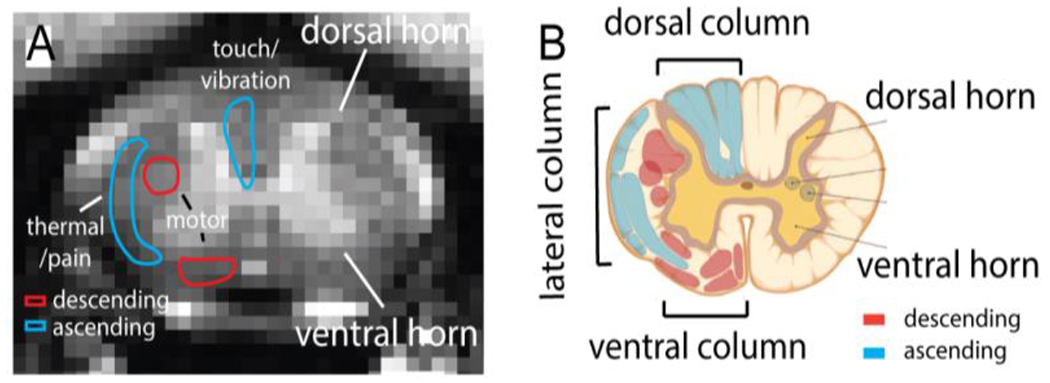
Magnetization Transfer Contrast (MTC) MRI image (A) and schematic illustration (B) of spinal cord, showcasing the butterfly-shaped grey matter (highlighted in yellow), as well as the ascending (depicted in blue) and descending (shown in red) white matter tracts.
Figure 3 [28] depicts MTC images of a normal SC in three planes (a: sagittal, b: transaxial, c: coronal). These images provide a clear visualization of the volumes of GM and WM, including the butterfly-shaped GM region in the transaxial image, and enable easy localization of WM tracts and GM horns. Figure 3C shows MTC and T1W images of a SC 10 weeks after a DCL. Both MTC and T1W images show a signal void corresponding to the spinal cord lesion, as indicated by the red arrows. However, a high-intensity abnormal tissue volume (AV), likely a cyst, was more readily distinguishable in the MTC images than on the T1W images (Figure 3C, c–d). The contrast between cyst and WM in the MTC images is approximately 100% stronger than that in the T1W images, enabling a more accurate evaluation of the SC deformation and quantification of the size of the cyst formation [28].
Figure 3. Magnetization Transfer Contrast (MTC) images reveal spinal cord injury and AV (cyst) at the C4 location in one representative subject.
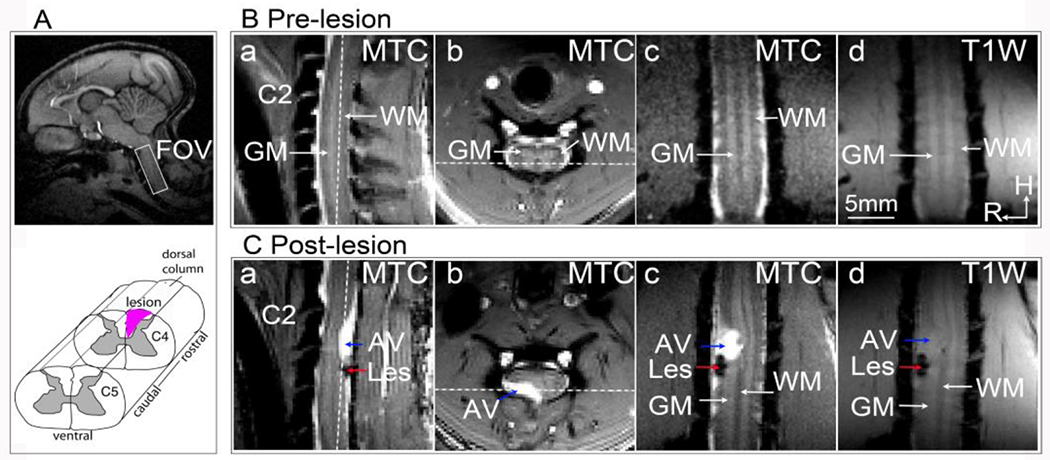
(A) Top: The white box on the sagittal brain image indicates the imaging field of view over the cervical spinal cord. Bottom: A schematic illustration of the targeted lesion of the unilateral dorsal column (represented by the black patch). (B) Pre-lesion MTC images on sagittal (a), transverse (b), and coronal (c) views, and a T1-weighted image on the coronal view (d). C2 indicates the nerve bundle entering the 2nd cervical segment. GM: grey matter; WM: white matter. H: head; R: right. (C) MTC (a, b, c) and T1-weighted (d) images obtained at 10 weeks after the lesion. Les: lesion. White dotted lines in a and b indicate the location of coronal imaging plane. Modified from Fig. 1 [28]
4.2. BOLD fMRI
BOLD is a hemodynamic signal associated with neuronal activity that can be examined in both task and resting states [58, 69–76]. BOLD fMRI has become a widely used method for studying the function and circuitry organization of the SC and brain in humans and animals, both in health and diseases. Our group and others have pioneered the use of fMRI for mapping SC’s responses to peripheral innocuous and noxious stimuli (e.g., tactile or painful) in healthy animals [77–80] and humans [81–87], as well as under pathological conditions [76, 88, 89]. This mapping enables the assessment of functional plasticity and changes in neural excitability after injury. Conversely, resting-state fMRI (rsfMRI) allows for the evaluation of the intrinsic functional organization and functional integrity of the SC after injury, without the need for external stimuli [58, 83, 90]. The rsfMRI signals have also been used to explore the intrinsic functional architecture of SC circuits and how they change under the influence of pathologies such as Multiple Sclerosis and SCI [69, 76]. For comprehensive reviews, see [82, 91, 92].
For clinical SC imaging at 3T, multi-shot 3D gradient echo (GRE, 3D FFE on Philips MRI scanner) images exhibit less signal drop-out and weaker geometric distortion than one-shot 2D multi-slice EPI [93]. For animal studies at 9.4T, we adopted the same approach and acquired 2D GRE fMRI data to reduce susceptibility artifacts in T2*-weighted images caused by local magnetic field inhomogeneities. These GRE images can achieve sufficient SNR [68, 94], with an in-plane resolution of 0.5x0.5 mm2 and a thickness of 3 mm, which is the length of one cervical SC segment. Typically, one stimulus-driven fMRI run, consisting of 150 image volumes, is robust for detecting tactile or heat stimulus-evoked BOLD signal changes at the dorsal horns. One rsfMRI run typically consists of 300 image volumes [58]. Multi-shot EPI can also be used for high-resolution fMRI of small animal SC at high fields [95]. In the context of using BOLD fMRI to study SC function and circuits, we focus on reviewing findings from two perspectives: during the processing of peripheral stimulation and in a resting state.
4.2.1. fMRI of SC during task conditions
In one study, with an in-plane resolution of 0.33x0.33 mm2, we were able to separate heat versus tactile stimulation-evoked BOLD activations in the superficial versus deeper laminae of the dorsal horns [94]. Figure 4 [94] illustrates the probability (frequency) maps for different runs (across-run) within a single imaging session (Fig. 4A) and for different subjects (across-subject) (Fig. 4B). Using laminar parcellation lines as a reference, it was evident that the heat activation foci were located in the more superficial parts (layer I-III) of the dorsal horn (Fig. 4A & 4D), with the dark red voxels representing the most reproducible activation focus. In contrast, tactile activation foci were located in the more middle part of the dorsal horn (Fig. 4B & 4E). The composite maps (Fig. 4C for across-run and Fig. 4F for across-subject) showed the separation of heat (red outlines) and tactile (green outlines) activations and their dorsal to ventral organization. These data indicate that fMRI activations detected in the SC are reproducible and fMRI is capable of separating spatially nociceptive heat and tactile activation.
Figure 4. Comparison of the locations of fMRI responses to tactile versus nociceptive heat stimuli in the ipsilateral dorsal horn.
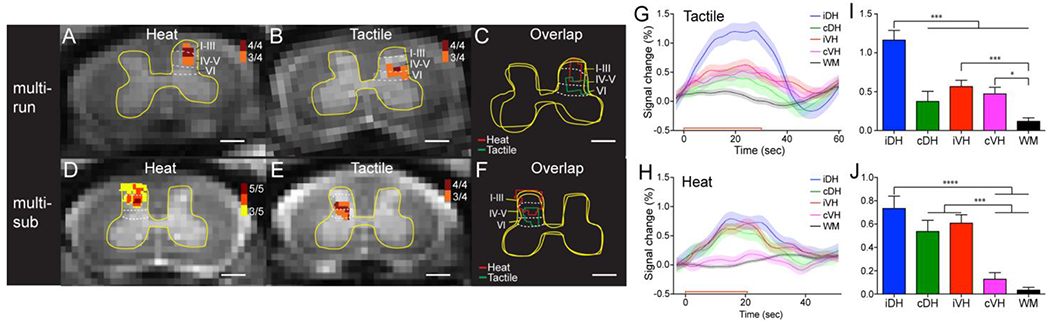
(A) Cross-run (multi-run) probability map of 47.5 °C nociceptive heat-evoked activations in the ipsilateral dorsal horn to stimulation of D2+D3 on the left in one representative monkey. 4/4 indiates four out of four runs. (B) Corresponding cross-run probability map of tactile-stimulation evoked activations in the same monkey. (C) Overlay map of the cross-run heat and tactile activations. (D) Cross-subjects (multi-sub) probability map of heat activations in the ipsilateral dorsal horn. 5/5 indicates five out of five subjects. (E) Corresponding cross-subject probability map of tactile activations. (F) Overlay map of the cross-subject heat and tactile activations. Red and green lines indicate the outlines of heat and tactile activation clusters, respectively. Yellow outlines represent the outer boundaries of the grey matter. Dotted white lines indicate the approximate borders of inter-laminar segments within the dorsal horn. Scale bars indicate 1 mm. (G, H) Time courses of fMRI signal changes to unilateral tactile (G) and nociceptive heat (H) stimulation of two distal finger pads in the iDH: ipsilateral dorsal horn; cDH: contralateral dorsal horn; iVH: ipsilateral ventral horn and cVH: contralateral ventral horn, and one WM region. Color lines and shadows indicate mean ± standard error of the percentage fMRI signal changes. The red lines near the x-axis show the stimulation periods of 30 sec for tactile and 22 sec for heat, respectively. (I, J) Statistical comparisons of the group peak magnitudes of fMRI signal changes (mean ± standard error). *p<0.05; *** p<0.005; **** p<0.001. The Figures were Modified from Figs. 3&4 in [94].
The hemodynamic response function (HRF) of BOLD signal changes evoked by heat or tactile stimuli is similar to that observed in the brain (Fig. 4G & 4H [94]), indicating that the HRF is not affected by the differences in the vasculature between the SC and brain. By mapping fMRI responses to peripheral stimulation, it is possible to assess functional plasticity and changes in neural excitability after SC or peripheral injuries.
4.2.2. fMRI of SC at resting state
In the brain, it has been shown repeatedly that the identification of patterns of highly correlated, low-frequency MRI signals from GM in a resting state offers a powerful tool for delineating and describing neural circuits and an unmatched ability for assessing how neural systems work together to achieve specific functions (Fig. 5A [70]) [42, 96–106]. These correlations represent an important level of neural organization and may play a fundamental role in the execution and maintenance of various brain functions, as evidenced by alterations in resting state connectivity in several brain disorders (Fig. 5B [70]) [99, 104, 106, 107]. Up until the early 2010s, there were significantly fewer reports of resting-state functional connectivity (rsFC) in the spinal because imaging of the SC is technically challenging due to its smaller physical size, the impact of pronounced physiological noise, and greater detrimental effects from susceptibility gradients during imaging [108, 109]. However, advances in imaging techniques, including better hardware and optimized data post-processing, have enabled robust resting state connectivity to be detected within and sometimes between the dorsal and ventral horns both in human subjects and animal models [58, 110, 111]. These observations have suggested that, like the brain, the SC exhibits characteristic reproducible, intrinsic functional architecture [90, 112, 113]. Therefore, studying rsFC in the SC may offer valuable insights into the organization and functioning of this critical part of the central nervous system.
Figure 5. Regions of Interest obtained from ICA reveal intra-slice spinal cord network.
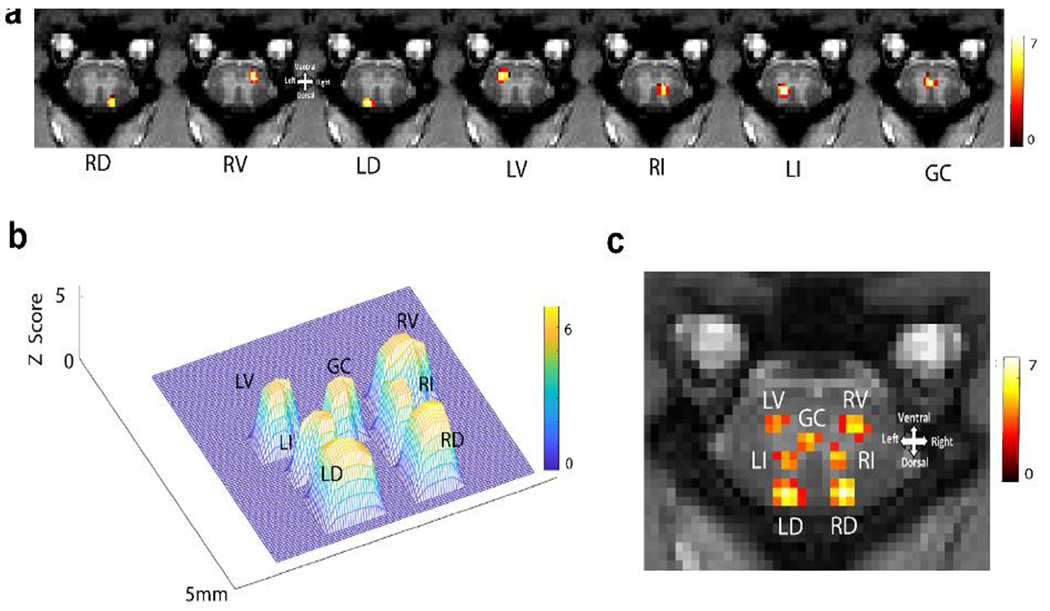
(A) The spatial representation of seven independent components from a representative slice is shown. Each column represents the spatial distribution of one independent component. Localized and highly synchronized spontaneous BOLD fluctuations at right dorsal (RD), right ventral (RV), left dorsal (LD), left ventral (LV), right intermediate (RI), left intermediate (LI), and grey commissure (GC) region are detected. Color bar represents the Z score, which was thresholded at Z=4. (B) A 3D plot represents distinct spatial distributions of the seven components from a representative slice of the spinal cord. (C) The seven components are displayed on one image for spatial reference. Modified from Fig. 2c in [70].
4.2.2.1. Intrinsic functional organization of normal SC
Both seed-based and data-driven analyses of rsfMRI signals have been employed to delineate SC circuits. Seed-based analysis relies on a priori selection of a seed region. The BOLD signal correlation of this region with other SC regions is calculated. This approach is hypothesis-driven and is useful when investigating known functional connections or circuits within the SC. In contrast, data-driven analysis is hypothesis-free and does not require prior knowledge about the components of functional circuits within any given structure. This approach is well-suited to uncover novel functional circuits that may not have previously been identified, and can be particularly useful when investigating complex and poorly understood SC functions. Furthermore, data-driven analysis methods can be used to identify patterns of functional connectivity across the large volume of the SC, and can be combined with advanced network analysis techniques to investigate the organization of SC functional networks at a systems level.
Using a seed-based approach, we first investigated whether spinal horns, which process peripheral somatic sensory inputs and descending motor controls, also demonstrate functional interconnections at rest. Placement of a seed voxel in the right ventral horn revealed distinct functional connectivity patterns both within and across image slices (Fig. 5). Within each slice, the right ventral horn showed strong connections to all other horns (left ventral horn, right and left dorsal horns), which closely resembled the activation pattern induced by noxious heat stimuli (Fig. 4). As a control, a seed in the WM did not show any connetions to the GM horns. However, a seed in the left dorsal horn showed a strong horn-to-horn connectivity pattern similar to that of the right ventral horn. These findings demonstrate robust functional interconnectivity between the ventral and dorsal horns within the same spinal segment in monkeys. Moreover, these connections were weaker but nonetheless present between horns across segments (see Fig. 6 [70] for connectivity patterns). This widespread horn-to-horn connection pattern mirrors the activation maps observed in stimulus-evoked fMRI and is consistent with functional connectivity measured by local field potential signals [111]. The agreement between rsFC and LFP connectivity supports the hypothesis that neurons simultaneously processing information exhibit strong rsFC.
Figure 6. Intra- and inter-segmental (slice) rsFC in normal spinal cord.
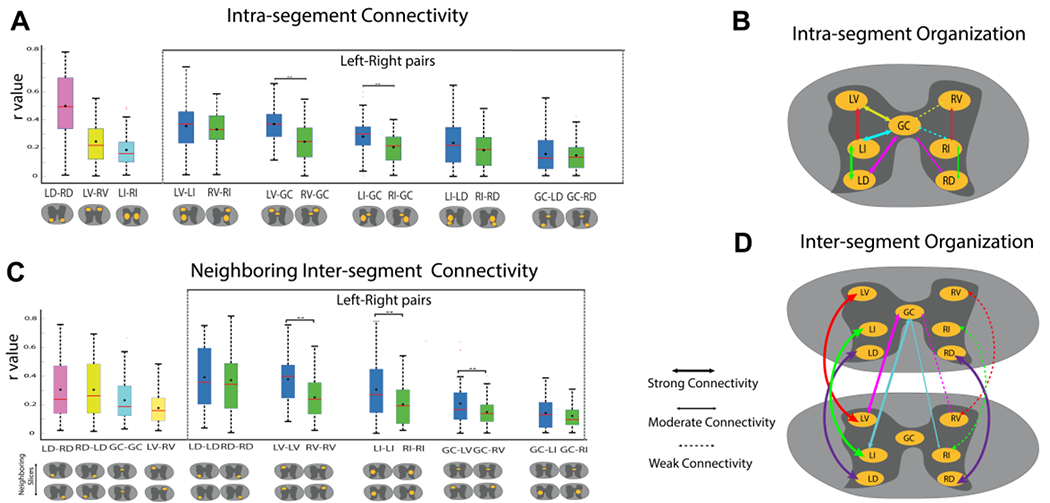
(A, C) Box plots correlation coeffiecencts (r values) between grey matter ROIs within each slice (intra-segment connectivities) (A) or between ROIs on neighboring slices (C). Left-right connectivity pairs are shown within the dotted lines and are in blue and green box-plots, respectively. Within the box-plots, the black diamond represents the mean value, and the red line repressents the median value of the distribution. Schematic views of the ROIs are shown below each box-plot. Significantly different (p<0.01) left and right box-plots (Mann-Whitney U test) are denoted by **. (B, D) Schematic illustration of the intra- (B) and inter-segmental (D) functional connectivities among grey matter horns and zones. The thickness of the arrow lines indicate the strength of the connection. Dotted arrow lines indicate significantly weakened connectivity compared to the contralateral one. LD: left dorsal horn. RD: right dorsal horn. LV: left vental horn. RV: right vental horn. LI: left intermediate zone. RI: right intermediate zon. GC: grey commissure. One slice is equal to one segment in this species. Modified from Fig. 3 in [70].
Independent Component Analysis (ICA) is a data-driven analytic approach that has also been used to delineate functional circuits of the SC in humans [63, 113, 114]. For instance, Kong et al. detected rsFC between dorsal and ventral horns [113], while San Emeterio Nateras et al. identified an additional functional cluster beyond the four main horn regions but did not investigate its connectivity with the dorsal or ventral horns [114]. We employed ICA analysis of rsfMRI signals acquired from the SC of NHPs at high MRI field (9.4T) and identified a seven-node network within each spinal segment (slice) (Fig. 5 [70]). This intraspinal network consists of left and right dorsal horns, left and right ventral horns, left and right intermediate region, and grey commissure (GC) region. The intermediate region is situated between the dorsal and ventral horns, while the GC is the thin strip of GM encircling the central canal. Figure 6A displays the spatial distribution of each independent component from a representative slice. These seven regions of interests (ROIs) are distinctly resolved spatially, as illustrated in a 3D mesh plot (Fig. 6B) and a composite map (Fig. 6C). These ROIs represent clusters of voxels that exhibit temporal synchrony in BOLD fluctuations, independent of other clusters. They may represent locally connected voxels, factoring in the spatial blurring effects of the intrinsic BOLD mechanism and imaging unsharpness [115]. As expected, the data-driven analysis revealed much more complex and interconnected intraspinal and intrasegmental networks. A comparable ICA component has been detected at the central location corresponding to the GC region in the human SC. However, the authors interpreted it as being of ‘no interest’ [113]. Therefore, in some previous human studies, there has been a brief reference to the GC as a potential functional subregion in the SC, as we found in our study [113, 114].
Pairwise correlation analysis further revealed strong intra- and inter-segmental connectivity between different ROI pairs (Fig. 6). Details of the significant intra-slice and neighboring interslice ROI pairs are provided in the Supplementary Table 1 in [70]. Within a slice, the LD-RD pair had the highest mean correlation coefficient (averaged over all slices), whereas between neighboring slices, LD-LD had the highest mean correlation value as evident from the boxplots in Fig. 6 A&C. It was also found that left sided ROI pairs show stronger connectivity i.e., higher mean correlation coefficient than their corresponding right sided ROI pairs both intra-segment as well as between neighboring segments with many of them being significant (p<0.01). Figure 6 B&D summarizes the comparison between left and right sided connectivities for intra-slice and neighboring slice respectively using a schematic. All animals included in this study were left-handed, which indicated that the spinal GM subdivisions (ROIs) on the dominant hand side (left side) have stronger intrinsic connections than the non-dominant side.
It is worth noting that in earlier studies of the human SC using ICA, Kong et al. [113] found that both dorsal and ventral components were positively correlated at the same level, but they did not find a positive correlation, or even negative correlation, at other levels. On the other hand, Nateras et al [114] reported strong and significant correlations among the immediate neighboring clusters, as well as between some more distant clusters.
4.2.2.2. SCI disrupts the integrity of intrinsic SC cicuits and leads to network reorganization
Our recent studies have used both seed-based and ICA analytic approaches to investigate the effects of unilateral sectioning of the dorsal column pathway at the C5 level on rsFC in NHP SCI models [58, 70]. These studies have found that this injury selectively and specifically weakens the rsFC between GM horns, particularly when the disruption affected the side of the lesion from which ascending inputs originated from the hand and arm, in spinal segments below the injury. However, this weakening reverts to near normal over time in a manner that correlates with functional recovery in skilled hand use [58, 112]. This finding is significant because it establishes a link between the degree of rsFC weakening with the severity of behavioral deficits, suggesting that rsFC strengths and patterns could serve as noninvasive and objective imaging biomarkers of spinal functional integrity and potentially behavioral impairment [58]. We hypothesize that the loss of descending signals from upstream supraspinal regions or more rostral segments (C3 to C4) to the GM in below-lesion segments is one possible mechanism contributing to the significantly weakended inter-horn connectivity. There is evidence supporting a modulatory influence of C3-C4 to upper limb segments [58] through inter-segmental connections that reside in the outlayer of spinal GM. Figure 7 schmatically shows the inter-segmental connections, including the connections between rostral C3-C4 segments and the cervical enlargement C5-C7 segments.
In a subsequent study, we combined ICA and graph theory analyses to examine how injury affected intra- and inter-spinal segmental connectivity and organization, as well as how these features recovered over time [70]. Our results revealed that in the normal SC (Pre-SCI), ROIs were organized in two dominant communities, as shown in Figure 8 A&B [70]. The first community was the dorsal horn community, comprising the dorsal horns (RD and LD) from all five segments, ranging from rostal to cervical enlargetment (C3-C4 and C5-C7). The second, larger, and more complex community included the ventral horns, intermediate, and grey commissure regions across all five segments, with the exception of the right ventral horn (RV) and right intermediate region (RI) of C3 (see Pre-SCI column in Fig. 8B). A distinctive feature of the normal intraspinal circuits was the strong inter-segmental connections between the GM regions. This newly identified cross-segmental intraspinal network expands on the previously proposed four-horn network [111, 113] and provides evidence supporting the strong functional connections and influences between cervival spinal segments.
Figure 8. Application of Graph Theory analysis on spinal cord ICA data of all the monkeys at pre- and post-SCI at different time points (Stage 1, Stage 2, and Stage 3).
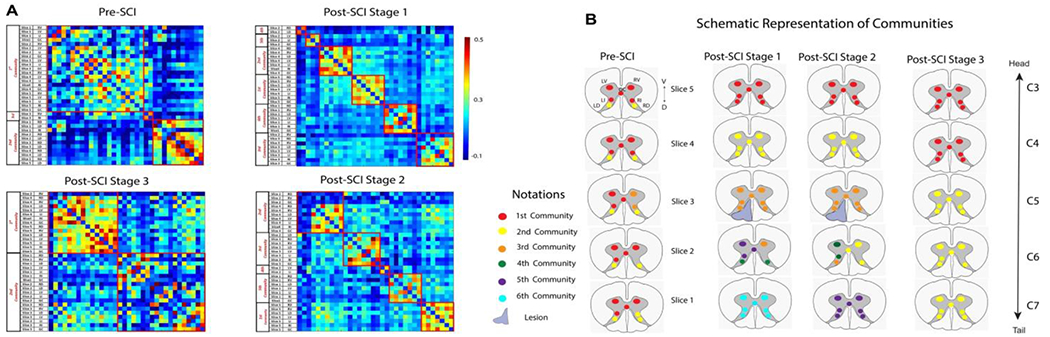
(A) Connectivity matrix of all the ROIs from all slices, arranged so that the nodes from the same community are adjacent to each other. The red boxes on the matrix highlight the communities formed and denote intra-community connectivity values. (B) Schematic diagram displaying the resulting communities in different colors from graph-theory analysis at pre- and post-SCI at different time points. The rows represent the five slices, and each slice contains the seven functional hubs or ROIs. The seven ROIs were right dorsal (RD), right ventral (RV), left dorsal (LD), left ventral (LV), right intermediate (RI), left intermediate (LI), and grey commissure (GC) region. No IR component was observed from Slice 2, and hence, it is not shown. Modified from Fig. 5 in [70].
After placing a unilateral section on the left dorsal column tract at the C5 level, animals exhibited severe behavioral deficits in their hand use. The organization of spinal GM communities was also markedly altered. The GM connection between ROIs across different segments were lost, while connections within the same segments strengthened. ROIs within the same segmental exhibited stronger connections, forming new communities. This change is evident from Figure 8B, second column (post-SCI Stage 1), where the communities reorganized and were confined to ROIs within each segment. As a result, ROIs from each of the four slices (Slice 1, 3, 4, and 5) formed a separate community. ROIs from the same community are shown in the same color in Figure 8B. This pattern remained similar at post-SCI Stage 2. However, at Stage 3, the intersegment community structure began to re-emerge. The return of strong inter-segmental connections correlated with the recovery of hand use impairments. In summary, ICA and graph theory analyses demonstrated that strong inter-segmental connections between GM regions were a defining feature of the normal SC. After SCI, this network was disrupted, resulting in the reorganization of communities within individual spinal segments. The gradual resurgence of strong inter-segmental connections over time correlated with the functional recovery of hand uses, underscoring the importance of intrinsically robust connectivity within the SC for proper function.
4.2.2.3. Technical consideration for fMRI studies
Compared to structural-based MRI studies, fMRI of the SC is more challenging due to the overall low SNR of BOLD signals and the influence of physiological noise. However, the discovery of fine-scale intra- and inter-segmental SC functional organization emphasizes the advantages of using a high MRI field and an animal model.
Firstly, the higher MRI field increases the magnitude of BOLD signals and the overall SNR in images. Secondly, motion artifacts and other noise sources may be reduced in animal models. For example, the customized neck-cervical cord coil used not only provided optimized imaging volume coverage of the cervical enlargement but also served as a neck stabilizer. Mechanical ventilation allowed for better control of respiration rates, and the use of respiration patterns as a noise regression during data preprocessing significantly improves the temporal SNR [116–118]. Thirdly, pre-processing was effective and involved the usual steps of 2D motion correction, physological noise correction, and high-pass filtering at 0.01 Hz for both animal and human studies [113]. It should be noted that while Kong et al. performed spatial smoothing using an anisotropic kernel, no such smoothing was performed on the animal data in our studies. While both human studies used the MELODIC (FSL based) package for performing ICA, the current study used GIFT (MATLAB based) for the same. However, both the human and animal study performed group ICA in which the 3D fMRI data from all the participants were temporally concatenated to create a 4D dataset. Before temporal concatenation, both human and animal data were registered to their specific anatomical space. Fourthly, the image volumes sampled in humans [113, 114] versus animals differed. While Kong et al. covered C4-T1 and Nateras et al. covered C1-C4, the animal data acquisition in our studies spanned from C3-C7 segments of the SC. Some human studies did not include the cervical enlargement, which spans from C5-T1.
4.3. DTI
DTI is highly sensitive to detecting changes in microstructural properties within the SC WM. Measures such as the axial diffusivity (λ‖ or AD), radial diffusivity (λT or RD), fractional anisotropy (FA), mean diffusivity (MD), and apparent diffusion coefficient (ADC) derived from DTI can provide information about axon size, microstructure, and WM fiber density [66, 119, 120]. These measures are more specific than other MRI measures for characterizing SC pathology [59, 65, 119].
DTI tractography is particularly sensitive to the changes in the structural integrity of WM fibers and can therefore be used to quantify the amount of intact fiber bundles at different stages of the recovery process. Numerous previous studies have used DTI to detect axonal injury and demyelination in SCs of animal models and human subjects in conditions such as traumatic brain injury [119, 121–127] and multiple sclerosis [62, 91, 128]. Metrics derived from DTI have provided new insights into the relationships between injury-induced disruptions in WM microarchitecture and neurological impairments [119, 121, 129–139].
In our studies of the NHP model of SCI using DTI, we aimed to address two important clinically relevant questions. The first pertains to the spatial extent of the injury’s affect on SC segments distant from the injury epicenter [140, 141]. This could help determine the extent of WM pathology associated with the injury, particularly in cases where the injury site is not accessible by MRI due to hardware implantation around the injury center causing significant MRI signal drop. The second question we addressed concerns whether DTI can monitor and accurately differentiate axon disruption and demyelination between sensory and motor tracts, both at the injury level and in remote segments above and below the injury. Determining the technical limitations of DTI would be clinically relevant because each tract is involved in distinct yet related functions and behaviors.
To date, most studies have focused on examining DTI parameters at various segment levels (C1-C6) of the cervical cord [141, 142], measuring regional parametric changes over all the WM in each segment without considering whether changes are dependent on distance to the center of injury. However, for aiding clinical diagnosis, DTI MRI of the SC typically provides measures on orthogonal planes to the cord [66, 143]. In NHP studies, we also used isotropic coronal sections along the cord, which allowed for higher spatial resolution along the cord to study the pathology at and beyond the injury (see examples in Fig. 9 [28]). In the following two sections, we present results of diffusion-weighted spin-echo (SE) EPI with 30 diffusion-encoded directions acquired from NHP SC in both axial (TR = 3000 ms, 4 shots, number of excitations [144] = 1, resolution 0.333x0.333x3 mm3) and coronal orientations (TR = 3000 ms, 2 shots, NEX = 8, resolution 0.5x0.5x0.5 mm3).
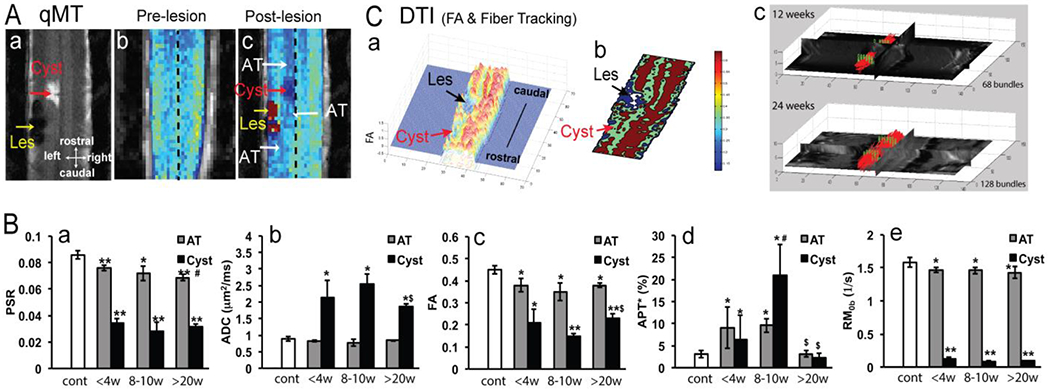
Figure 9. Longitudinal MTC and DTI (ADC and FA mapping) reveal the progression of the lesion and the development of an AV (cyst).
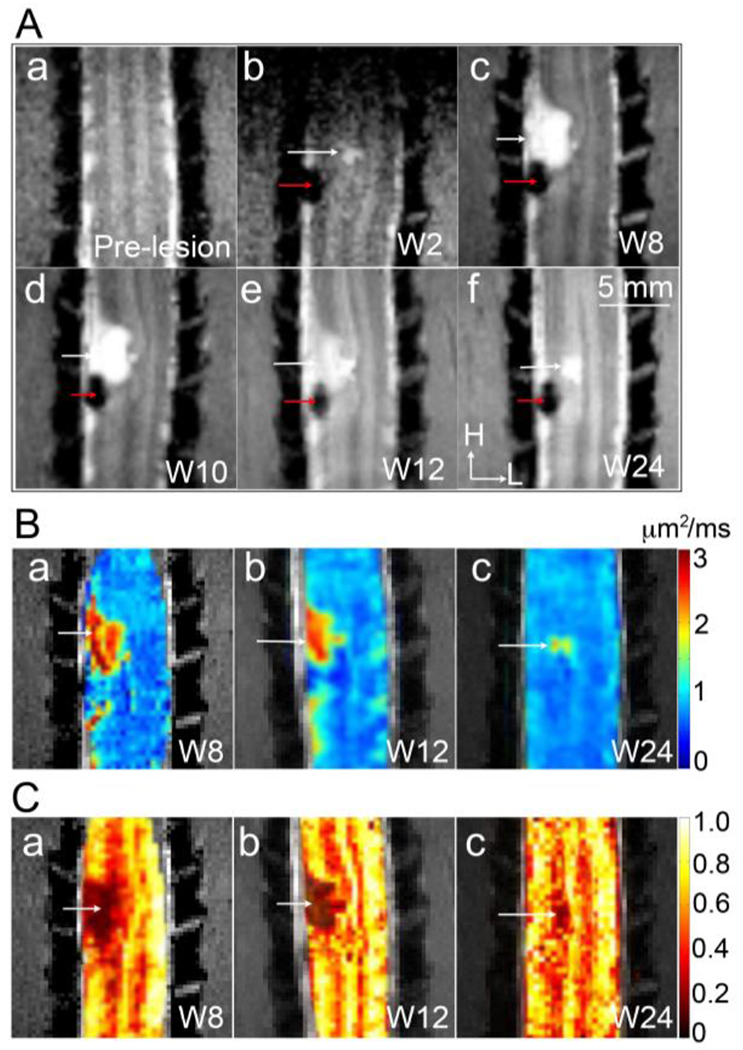
(A) Coronal MTC images obtained at pre-lesion (a), and at 2 (b), 8 (c), 10 (d), 12 (e), and 24 (f) weeks post-lesion. H: head and L: left. (B) Mean ADC maps obtained at week 8 (a), 12 (b), and 24 (c) post-lesion. (C) FA maps obtained at week 8 (a), 12 (b), and 24 (c) after lesion. White arrows indicate the formation of the cyst. Red arrows indicate the lesion sites. Adapted from Fig 2 in [28].
4.3.1. Longitudinal DTI tracked progression of the lesion and cyst formation at the injury site
We demonstrated that DTI-derived ADC values might indicate tissues cell density, while FA values are associated with various microstructural factors such as the coherence of fibers, axonal size and density, and the state of myelination. Figure 9B&C [28] show the robustness of ADC and FA maps for monitoring lesion progression and tracking cyst formation (abnormal volume, AV) at an injury site. The lesion and cyst are depicted as hypointense and hyperintense regions, respectively, on MTC images (Fig. 9Ab–f [28]). By the eight weeks after SCI, the lesion region appeared smaller, while the cyst had grown larger than it was at week 2, with lateral and rostral expansion (Fig. 9Ac). Over the subsequent 24 weeks, the cyst volume decreased markedly, and the ADC value for the cyst concomitantly decreased by about 60% (Fig. 9B). The FA value of the cyst core remained consistent, while that of the surrounding damaged tissue increased (Fig. 9C). The AV region exhibited a high ADC value, a low FA value, and an absence of MT effects. These features are consistent with reports of cyst development [145–147], in which a cyst is initially filled with fluids or semi-solids with low cellular density and few axons, but over time, the cellular density of the cyst increases. To summarize, the combination of ADC, FA, and MTC images facilitated early detection and longitudinal visualization of lesion and cyst formation with rich spatial details and specificity.
4.3.2. The correlation between changes in DTI parameters of specific spinal WM tracts and behavior recovery following SCI in NHPs
A unilateral dorsal column lesion (DCL) theoretically disrupts only the sensory pathway, while leaving the motor pathway and tracts on the opposite side intact. This model allows us to test the sensitivity of DTI parameters in revealing fiber disruption in each individual spinal WM tract and can link axonal disruption and demyelination in specific WM tracts to behavioral recovery after injury. For instance, Figure 10 [148] illustrates the relationships between the behavioral changes (Fig. 10A) and the corresponding time courses of the diffusion parameters of FA and RD from six ROIs (Fig. 10B–G). These include the lesion, dorsal column, and lateral tracts ROIs on rostral (DR and LR) and caudal (DC and LC) segments ipsilateral to the lesion side. The regression analysis uses the temporal variations of diffusion parameters as predictors to estimate the behavioral changes (normalized test scores before SCI, represented by the blue and orange dotted lines in Fig. 10A). The R2 measures how much the diffusion parameters could explain the variation in behavioral changes. Figures 9B–E show that changes in FA and RD values on the injured dorsal tract and the lesion site were good indicators of behavioral changes (R2= 0.449, 0.647, 0.781, 0.605; FA Ips_DR, FA Ips_DC, RD Ips_DC, and FA Lesion). Multivariate regression analyses using all four DTI parameters as predictors for each ROI increased R2 values (see the last row in Fig 10I), indicating more accurate predictions when all four DTI parameters are considered. The DTI parameters of the caudal segment in the lesioned dorsal tract had the closest fit and highest predictivity (R2=0.992) of behavioral recovery across all ROIs. In summary, over time, RD, FA, and AD values of the dorsal and lateral tracts on the injured side closely tracked the recovery of impaired hand use. Monkey data show that FA and RD values are sensitive measures of the effects of injury on specific tracts and segments. Diffusion parameters derived from DTI are capable of detecting WM changes and monitoring their progression during natural recovery in a tract- and segment-specific manner. The results support the conclusion that quantitative DTI metrics may be useful biomarkers for assessing recovery from injury and the effects of interventions.
Figure 10. Linear regression analysis of DTI parameters and behavioral performance during recovery.
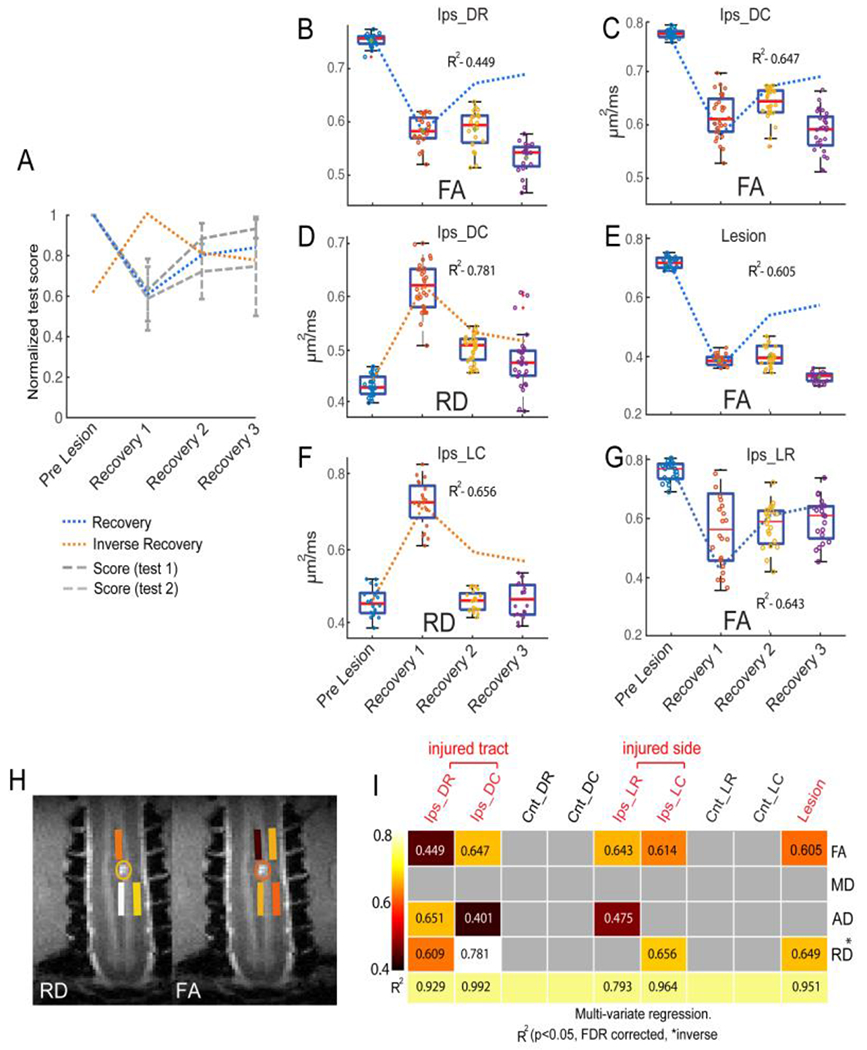
(A) Normalized test score of behavioral performance before and at three stages during recovery. Score 1: success rate. Score 2: number of flexes per successful food retrieval trial. Blue and orange dotted lines refer to model of recovery and inverse recovery, respectively, in the regression analysis. (B-G) Boxplot shows the temporal change of diffusion parameters and corresponding R2 values for FA (B&C, rostral and caudal segments), RD (D) of injured dorsal tracts (caudal), RD (F) and FA (G) of intact lateral tracts on injured side, and FA of the lesion site (E) with the behavioral recovery curves (dotted line in the background). (H) ROIs of the injured dorsal and non-injured lateral tracts with color coded and thresholded R2 (coefficient of determination) values are overlayed on coronal MTC images to show their spatial relationships to the lesion site. (I) A matrix plot of color-coded and thresholded R2 (coefficient of determination) values for all the ROIs tested. The same color code is used for both H and I. Adapted from Fig. 7 in [148].
4.4. Quantitative Magnetization Transfer
MT connotes a spin exchange between proton pools in different environments and can be used to evaluate the macromolecular content of tissue [149, 150], including the SC in humans [91, 128] and animals [59, 62, 64]. There are two main approaches to identify MT effects: semi-quantitative MT ratios (MTR) that compare images with and without an MT preparation, and qMT methods that extract numerical parameters describing the tissue from a series of MT data based on a specific model. To date, simpler metrics such as MTR [151, 152] have been the predominant approach for assessing macromolecular composition in human SC imaging [152] under clinical conditions like adrenomyeloneuropathy [97], demyelination and degeneration [152], degenerative cervical myelopathy [153], and SC lesions in multiple sclerosis [154]. Technically, MTR measures are affected by relaxation rates and MRI sequence details [155]. For example, the MRI field strengths and various experimental parameters such as saturation power and RF offset influence the magnitudes of MTR measures [155, 156]. QMT methods have been developed to provide more specific measures than MTR, particularly to estimate the ratio of immobile macromolecular protons to the free water pool, known as the pool size ratio (PSR), independent of intrinsic relaxation and exchange rates [157–159].
We employed a pulsed saturation qMT data acquisition and the simplified Henkelman-Ramani model [156, 160] for studying the SC of squirrel monkeys. Images are acquired after MT preparation pulses that vary in saturating RF power and frequency offset [59]. Multiple qMT parameters, including PSR, the transverse relaxation rates of the water and macromolecular pools (R2a and R2b), and the rate of exchange of magnetization between the pools (RM0b) are derived from the model fitting [59]. Maps of PSR reflect the concentration of macromolecules such as proteins and can detect specific changes associated with myelination of WM in the damaged SC [97, 152, 161, 162]. Figure 11 [59, 64] shows that QMT revealed regional demyelination by comparing side-by-side the myelin-stained histology sections and the corresponding PSR maps of injured SC from two representative cases. The reduction in PSR is related to demyelination in WM and loss of neuronal cell bodies, neuropil, and glial cells after injury in GM after SCI [59, 64]. Histological evaluations also confirmed the nature of the cysts in this and other animals. Our studies in primates [59, 65] have shown that qMT measures provide a specific assessment of demyelination.
Figure 11. Comparisons between myelin stains and PSR maps in subjects SM-P (A) and SM-G (B).
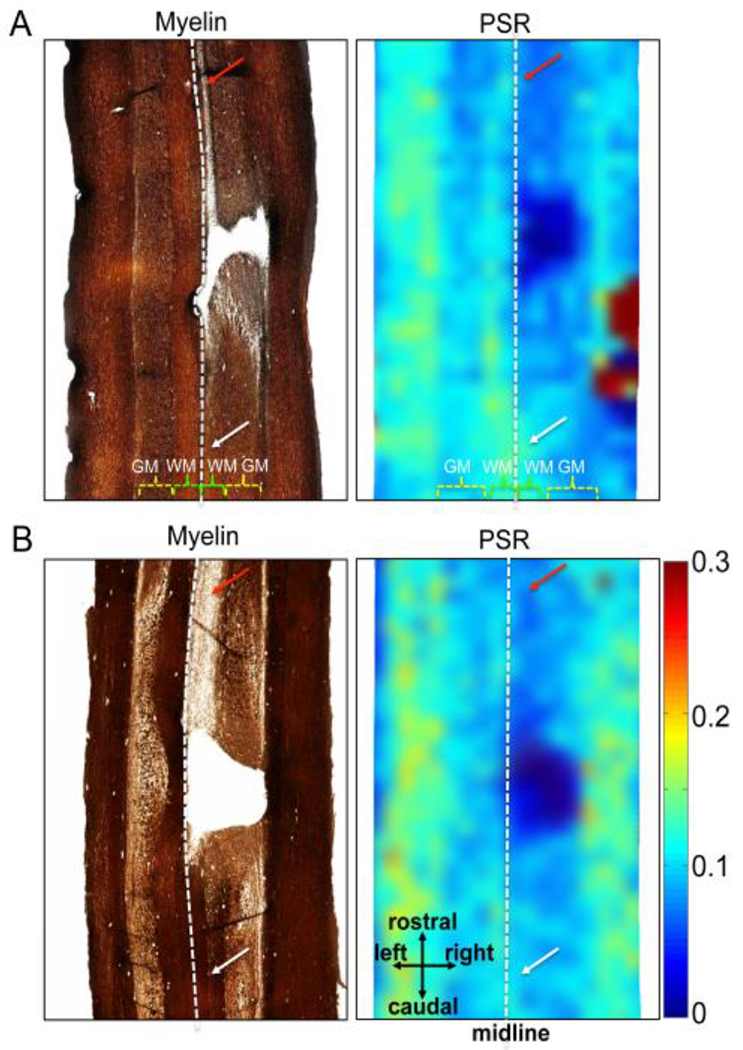
Postmortem spinal cord sections were obtained and stained at eight and three months post-lesion for SM-P and SM-G, respectively. Demyelination regions in white matter (WM) appeared longer and had a lighter stain rostral (red arrows in left images in A and B) compared to caudal (white arrows) in relation to the lesion. The white dotted lines indicate the estimated midlines. WM: white matter; GM: grey matter. Adapoted from the Supporting Figure in [59].
4.5. CEST
Both CEST(Chemical Exchange Stauration Transfer) and NOE (Nuclear Overhauser Enhancement) MRI are forms of magnetization transfer, and are sensitive to the changes that may occur in scar and cyst formation [65, 163, 164], as well as in damaged SC tissue [165]. CEST effects are sensitive to exchangeable protons of amides [166, 167], amines [168], and hydroxyls [169, 170], which are mainly found in metabolites such as glutamate, creatine, glycogen, and glucose, as well as in mobile proteins and peptides [171]. NOE effects may be produced by water interacting via cross-relaxation with cellular compounds such as macromolecules with aliphatic protons, phospholipids containing choline head groups, and mobile membrane proteins [172–174].
4.5.1. Longitudinal CEST imaging captures metabolite changes in cystic sub-regions and surrounding tissues
Several changes in CEST and NOE effects were detected in the injured SC [65, 163, 164]. It was found that different protons reside in different pools [163, 170, 175], and some of the robust pool changes were detected using CEST measures of asymmetry between two sides of a Z-spectrum (MTRasym), or 3-point amide proton transfer (APT) and NOE measures [65]. In our monkey SCI model, the Z-spectra from sub-regions of the cord exhibited several identifiable peaks that changed over time after injury (Fig. 12A [28]). MTRasym maps revealed heterogeneous low- and high-intensity sub-structures within the cyst (orange-yellow patches in Fig. 12B b–d [28]) and lesion cavity (blue patches). In the acute phase after SCI, both the cyst and the tissues around the cyst exhibited low cellular density and low protein content, but with relatively high concentrations of exchanging hydroxyl, amine, and amide protons. This was evidenced by decreased NOE effects around −3.5 and −1.6 ppm RF offsets and large CEST peaks around 1, 2, and 3.5 ppm RF offsets (Fig. 12). At the peak subacute phase, the Z-spectrum of the cyst was asymmetric with three significantly resolved peaks on the positive frequency offsets around 3.5 ppm, 2.2 ppm, and 1.2 ppm, which were related to the levels of amides, amines, and hydroxyls, respectively (Fig. 12A). Over time, the CEST effects from amide, amine, and hydroxyl protons dropped significantly but at differing rates during the recovery (Fig. 12D).
Figure 12. Longitudinal CEST imaging reveals dynamic changes in metabolites in the cyst sub-regions.
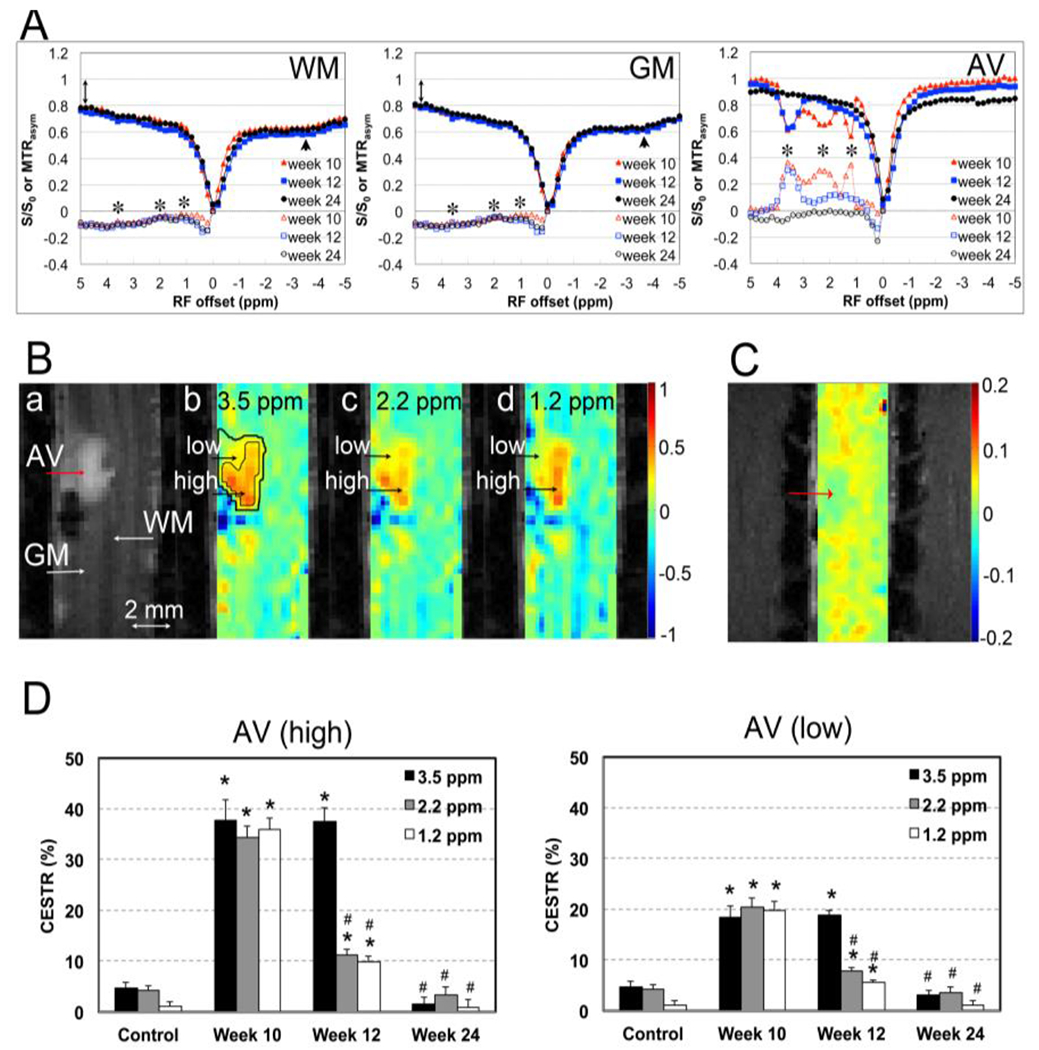
(A) Comparison of the averaged Z-spectra (solid markers) of GM, WM, and AV (cyst), derived from CEST imaging at 10, 12, and 24 weeks post-lesion. Black asterisks indicate the peaks of corresponding metabolites (hydroxyl, 1.2 ppm; amine, 2.2 ppm; and amide, 3.5 ppm). (B) Representative MTC image (a) and MTRasym maps (b-d). Two regions, the rim and core, were isolated for quantification. (C) NOE* map. (D) Time courses of the regional CEST values of high and low sub-regions at 3.5 , 2.2, and 1.2 ppm frequency offsets at 10, 12 and 24 weeks post-lesion. Modified from Fig. 4 in [28].
4.5.2. Correlation between selected MRI CEST measures and behavioral deficits
Model-based Z-spectra fitting is one approach used to separate different molecular pools after direct saturation at multiple offsets [163, 164]. This approach allows for the segmentation of distinct abnormal regions around lesion sites based on pixel-by-pixel correlations between the Z-spectra [163]. Moreover, it enables the simultaneous fitting of regional spectra to a five or six-pool Lorenzian peaks [170, 172, 176], facilitating the quantification of five to six pools of molecules. For instance, the five-pool modeling approach [163] separates non-specific MT effects from immobile macromolecules, also known as semi-solid MT, pool VI) [150, 151], as well as NOE-mediated saturation transfer effects (pool V) from other macromolecules, including membrane lipids and mobile proteins [172, 177, 178]. Furthermore, it distinguishes direct saturation on free water (pool IV) from true CEST effects (pools I-III) from mobile proteins/peptides and metabolites [167, 170, 175, 179–181].
The peak amplitudes of the proton pools reflect their respective CEST or NOE effects, which are ideally suited for characterizing SCI, as it involves altered cellular metabolism, inflammation, and apoptosis, each of which can affect each pool. We found a significant correlation between the severity of behavioral deficits and the magnitude of pool I (APT) in the cysts during recovery (Fig. 13 [163]). Two endpoint hand-use behavioral measures of food retrieval success rate and the number of finger flexes per successful trial showed expected behavioral impairments immediately after SCI, as we and others have reported [60, 73]. Importantly, our findings suggest a general association between the size of the largest cyst (as depicted in Fig. 13A), the elevated levels of pool I (Fig. 13B), and the severity of hand use impairments (Fig. 13C–D) observed during recovery. Moreover, the longitudinal changes in MRI measures correlated with behavioral deficits, as evidenced by the data presented in Figure 13E.
Figure 13. Relationships between longitudinal changes in cyst size and pool I amplitude, and behavioral recovery.
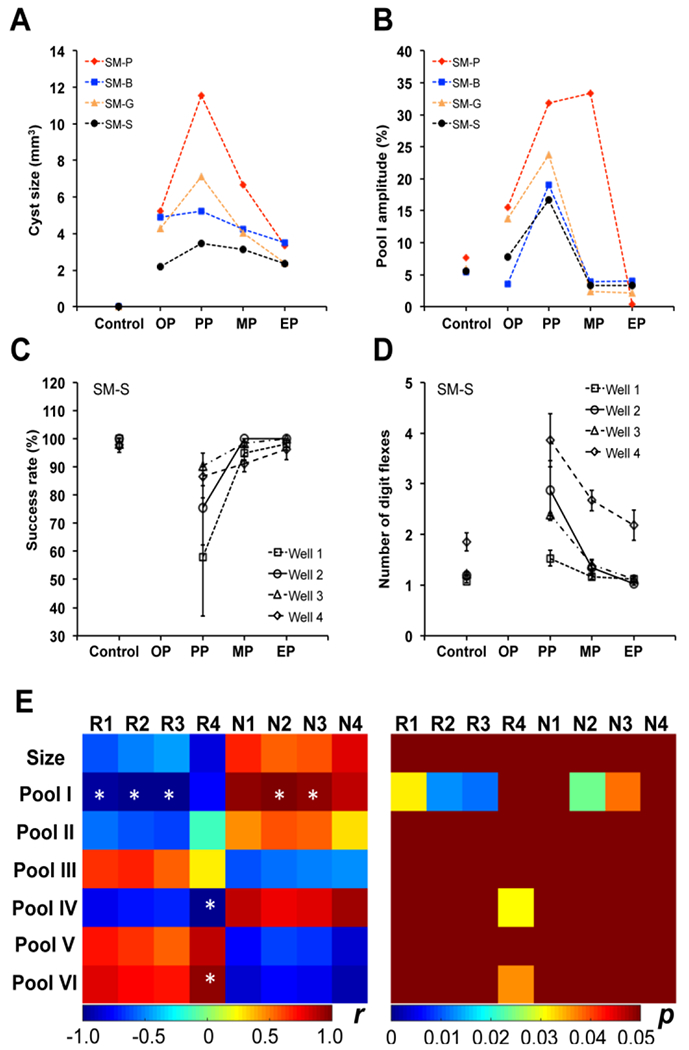
(A-B) Individual longitudinal changes in cyst size and amplitude of pool I (3.5 ppm RF offset) from MRI. The stages OP, PP, MP, and EP represent time points defined as onset point (1-2 weeks), peak point (3-10 weeks), middle point (11-18 weeks) during the recovery, and end point (19-24 weeks), respectively. Note the large individual differences in cyst progression after injury across subjects. (C-D) Success rates and number of digit flexes show the longitudinal behavior deficits for animal SM-S during recovery. (E) Correlations between cyst sizes, cyst pool amplitudes, and behavioral measures during recovery. R1-R4: Success rates for well 1-4, respectively; N1-N4: Number of digit flexes for well 1-4, respectively. * p < 0.05. The amplitudes of Pool I (3.5 ppm), Pool II (2.2 ppm), Pool III (1.2 ppm), Pool IV (0.0 ppm), Pool V (−3.3 ppm) are obtained from multi-peak Lorentzian fitting, while pool VI is the MT ratio at 5 ppm RF offset. Adapted from Fig. 10 in [163].
The high sensitivity and specificity of CEST and NOE measures make them promising for clinical applications [163, 164]. Studies in NHPs have demonstrated that CEST imaging can provide objective and complementary molecular information to describe changes associated SCI over time. CEST effects at 3.5 ppm are thought to represent amide exchange from proteins and peptides, while CEST peak at approximately 2 ppm RF offset relate to the amine groups found in protein and peptide side chains or free amino acids [163, 168, 182]. The CEST effect at ~1 ppm is likely due to the hydroxyl protons in glucose, glycogen, and glycosaminoglycan, which make up the extracellular matrix [170, 175]. The pool amplitude at 0 ppm RF offset reflects the tissue water composition, potentially indicating the presence of edema and fluid cysts. Overall, the ability of CEST imaging to detect robust changes in multiple pools underscores its power for quantifying injury-associated changes related to neurotransmitter release and breakdown, metabolic abnormalities, and neuroinflammation in the injured SC.
4.6. Comprehensive evaluation of injury progress and repair with mpMRI
One of the main goals of tracking multifaceted pathological processes in the injured SC is to identify MRI biomarkers that are both pathology-specific and behaviorally relevant. Observations from the NHP SCI model have demonstrated that different mpMRI measures indicate distinct pathological signatures during various recovery phases. For instance, Figure 14 illustrates a direct comparison between qMT-derived PSR and other qMT, DTI, and CEST-derived measures before and at multiple time points following SCI [28, 59, 148]. All qMT parameters, including PSR and RM0b, exhibited good cross-subject reproducibility and were highly sensitive in detecting changes in tissue composition following injury. Their longitudinal changes correlated highly with FA and ADC from DTI and APT measure from CEST. There is also a high level of agreement between qMT-derived PSR and DTI-derived FA and ADC measures at the lesion site, as well as in WM caudal and rostral to the lesion site. CEST measures usually peak during earlier recovery phases, and MRI measures correlate highly with behavioral assessments [64, 148]. However, to validate the specificity and sensitivity of each individual MRI measure or a combination of measures as behaviorally relevant biomarkers, it is necessary to develop multiparametric prediction models.
Figure 14. Longitudinal qMT and DTI tractography reveal a dynamic demyelination process and recovery of tractable white matter fiber bundles.
(A) Comparison of the pre- (b) and post-lesion (c) PSR maps revealed demyelinated regions (AT) at rostral and caudal locations to the cyst and lesion sites. (a) MCT map confirms the locations of these different compartments. (B) Quantification of measures from qMT (PSR, RM0b), CEST (APT*), and DTI (ADC and FA) obtained at different time points after injury showed differential recovery processes of the cyst (represented by black columns) and demyelinated regions (AT, abnormal tissue, represented by grey columns). (C) 3D and thresholded 2D representations of the FA values clearly showed the lesion and cyst sites (a-b). Tractography of DTI data showed an increasing number of fiber bundles (represented by red lines) at 12 (top image) and 24 weeks post-lesion (bottom image).
6. Technical challenges and values of quantitative MRI of SC at high field
Acquiring high-resolution, artifact-free, and co-registered data at high field is essential for reliable mpMRI of SCs in small animals. While high fields increase the SNR and image quality, there are potential artifact sources that require careful consideration. Fast imaging sequences such as EPI can enhance data acquisition speed and shorten scan time, but they can also introduce issues such as ghosting, geometry distortion, and signal drop-out are severe problems.
In NHP studies, multi-shot EPI can be used to mitigate distortion and local signal drop-out. For DTI and CEST acquisitions using spin-echo EPI, an extra navigator echo per readout train can be collected without phase encoding before the acquisition of the actual image data. This technique can improve signal stability in segmented multi-shot EPI, correct for motion-induced phase variations, and address frequency drift issues. Additionally, EPI often requires fat suppression to null high signals from subcutaneous lipids that cause motion artifacts. In DTI, respiration gating can be used to reduce motion artifacts in diffusion-weighted EPI sequences. Since CEST data acquisition requires a long pre-saturation duration and TR, making it difficult to use respiration gating, we synchronize its data acquisition with the respiration cycle. In anatomical images, qMT data, and GRE fMRI data, we apply a short TR, provide a sufficient number of acquisitions for signal averaging, and synchronize data acquisition with the respiration cycle when possible to minimize motion artifacts. Using a customized coil confined to the cervical SC can reduce unwanted signals from moving tissues located farther away and increases SNR. We also record dynamic changes in respiration and cardiac rates to correct physiological noise during fMRI data proprocessing.
Accurate and reproducible mpMRI parameters require high SNR, which must be balanced against spatial resolution and data acquisition time for each imaging method [64, 164]. Preclinical MRI allows for longer imaging sessions of up to 4-5 hours. The specificity and sensitivity of each MRI measure can be further studied in SC MRI of NHPs at different phases after injury [28, 64, 164], which can identify multiple key MRI measures for clinical applications. Although each MRI protocol needs to be adjusted for the different resolution and SNR required for human SC MRI, there is clear potential for using mpMRI to study human SCI.
7. Implications of findings in NHP SCI model for human SCI research
The findings discussed in this review carry significant implications for human SCI research. NHP SCI models have proven to be instrumental in enhancing our understanding of human SCI pathology. The mpMRI studies sin NHP models have delivered invaluable insights into the formation of cyst and scar tissue around injury sites, known to impede axon regeneration and functional recovery [21, 183, 184]. Comprehending these hurdles and tracking their progression, along with potential therapeutic interventions, is critical for improving outcomes for human SCI patients. Numerous ongoing studies and clinical trials aim to replace cysts or scar tissue with stem cells or peripheral nerves, facilitating axon growth toward their targets [185–187]; for reviews, see [10, 20, 188, 189].
Moreover, the capability to monitor the integrity of WM fiber tracts using DTI [91, 162], detect early cyst formation, and evaluate changes in tissue composition with mpMRI is likely to be instrumental in monitoring of spontaneous recovery from SCI and assessing therapeutic interventions’ impact in vivo. Axonal loss and recovery are known major outcomes of SCI, and our DTI findings have captured these axonal changes. CEST, coupled with MT and DTI, identifies changes in the cellular and molecular composition of injured SC tissue. We were able to detect early cyst formation just two weeks after SCI, indicating potential for even earlier data acquisition toward the acute phase. Despite creating each lesion in a reproducible manner, we observed that lesion progression and cyst formation varied between animals,. This underlines the importance of monitoring changes in each individual subject and characterizing individual variability. In vivo longitudinal MRI offers a unique opportunity for a systematic quantitative evaluation of inter-subject variability and its influence on behavioral and interventional outcomes at the group level. Notably, the differential recovery patterns observed via MT and CEST underscore that each animal’s cyst exhibited its own molecular signature.
Furthermore, compared to rodents, NHP SCI models are uniquely suited for studying the functional and behavioral significance of the rsFC network within cervical SC. The robust interconnectivity within the cervical enlargements in NHP, particularly on the dominant hand side, sheds light on the importance of upper limb and hand dexterity in primates’ daily life. A mechanistic understanding of the complex and dynamic progression and recovery of SCIs over time, as informed by longitudinal mpMRI, can help guide the development of new therapeutic interventions for human SCI patients, given that each MRI method provides pathological-specific information.
8. Summary
Non-invasive mpMRI has emerged as a promising tool for developing mechanism-based MRI biomarkers. In this article, we illustrate how mpMRI can offer a comprehensive view of spinal function, microstructure, and cellular-molecular properties of the SC before and after injury [59, 64, 65, 148, 163, 164]. By using a range of mpMRI techniques, including fMRI, DTI, qMT, and CEST MRI, we can evaluate several SCI-associated pathological features. These include the extent of swelling, scar formation, edema and glutamate concentration, demyelination, and disruptions of functional circuits within the damaged spinal segment and beyond, over a six months period [59, 65]. These various endogenous MRI parameters have demonstrated high sensitivity and specificity in detecting a range of SCI-related changes. Such measures can function as noninvasive, mechanism-based imaging biomarkers of tissue status, aiding in diagnosis, prognosis, and the evaluation of therapy outcomes. This could ultimately lead to more effective treatments for patients with SCI. Moreover, these mpMRI measures offer novel and critical information that cannot be obtained through other methods, thereby enabling the development of clinically relevant indices of injury and recovery.
Acknowledgements
The work is supported by the Dana Foundation, the National Institutes of Health (NS078680 to Gore and NS092961 to Gore/Chen), the Department of Defence (W81XWH-17-1-0304 to Gore), Vanderbilt Core Grant (NIH P30EY008126). We thank Mr. Ken Wilkens, Mr. Gary Drake, Dr. Ming Lu and Dr. Xinqiang Yan of the Vanderbilt University of Imaging Science (VUIIS) for customizing coils for cervical SC imaging. We thank Mrs. Chaohui Tang and Mr. Fuxue Xin of VUIIS for their assistance in animal preparation and care in MRI data collection.
Footnotes
Publisher's Disclaimer: This is a PDF file of an unedited manuscript that has been accepted for publication. As a service to our customers we are providing this early version of the manuscript. The manuscript will undergo copyediting, typesetting, and review of the resulting proof before it is published in its final form. Please note that during the production process errors may be discovered which could affect the content, and all legal disclaimers that apply to the journal pertain.
References
- 1.Armour BS, et al. , Prevalence and causes of paralysis-United States, 2013. Am J Public Health, 2016. 106(10): p. 1855–7. [DOI] [PMC free article] [PubMed] [Google Scholar]
- 2.Lo J, Chan L, and Flynn S, A systematic review of the incidence, prevalence, costs, and activity and work limitations of amputation, osteoarthritis, rheumatoid arthritis, back pain, multiple sclerosis, spinal cord injury, stroke, and traumatic brain injury in the United States: A 2019 Update. Arch Phys Med Rehabil, 2021. 102(1): p. 115–131. [DOI] [PMC free article] [PubMed] [Google Scholar]
- 3.Badhiwala JH, Wilson JR, and Fehlings MG, Global burden of traumatic brain and spinal cord injury. Lancet Neurol, 2019. 18(1): p. 24–25. [DOI] [PubMed] [Google Scholar]
- 4.Injury GBDTB and Spinal Cord Injury C, Global, regional, and national burden of traumatic brain injury and spinal cord injury, 1990-2016: a systematic analysis for the Global Burden of Disease Study 2016. Lancet Neurol, 2019. 18(1): p. 56–87. [DOI] [PMC free article] [PubMed] [Google Scholar]
- 5.Fehlings MG, et al. , A clinical practice guideline for the management of patients with acute spinal cord injury: recommendations on the type and timing of anticoagulant thromboprophylaxis. Global Spine J, 2017. 7(3 Suppl): p. 212S–220S. [DOI] [PMC free article] [PubMed] [Google Scholar]
- 6.Fehlings MG, et al. , A clinical practice guideline for the management of patients with acute spinal cord injury: recommendations on the use of methylprednisolone sodium succinate. Global Spine J, 2017. 7(3 Suppl): p. 203S–211S. [DOI] [PMC free article] [PubMed] [Google Scholar]
- 7.Rabinstein AA, Traumatic spinal cord injury. Continuum (Minneap Minn), 2018. 24(2, Spinal Cord Disorders): p. 551–566. [DOI] [PubMed] [Google Scholar]
- 8.Courtine G and Sofroniew MV, Spinal cord repair: advances in biology and technology. Nat Med, 2019. 25(6): p. 898–908. [DOI] [PubMed] [Google Scholar]
- 9.Venkatesh K, et al. , Spinal cord injury: pathophysiology, treatment strategies, associated challenges, and future implications. Cell Tissue Res, 2019. 377(2): p. 125–151. [DOI] [PubMed] [Google Scholar]
- 10.Ulndreaj A, Badner A, and Fehlings MG, Promising neuroprotective strategies for traumatic spinal cord injury with a focus on the differential effects among anatomical levels of injury. F1000Res, 2017. 6: p. 1907. [DOI] [PMC free article] [PubMed] [Google Scholar]
- 11.Fehlings MG, et al. , Rho Inhibitor VX-210 in acute traumatic subaxial cervical spinal cord injury: design of the SPinal cord injury Rho INhibition investiGation (SPRING) clinical trial. J Neurotrauma, 2018. 35(9): p. 1049–1056. [DOI] [PMC free article] [PubMed] [Google Scholar]
- 12.Kucher K, et al. , First-in-man intrathecal application of neurite growth-promoting anti-Nogo-a antibodies in acute spinal cord injury. Neurorehabil Neural Repair, 2018. 32(6-7): p. 578–589. [DOI] [PubMed] [Google Scholar]
- 13.Rosenzweig ES, et al. , Chondroitinase improves anatomical and functional outcomes after primate spinal cord injury. Nat Neurosci, 2019. 22(8): p. 1269–1275. [DOI] [PMC free article] [PubMed] [Google Scholar]
- 14.Srinivas S, Wali AR, and Pham MH, Efficacy of riluzole in the treatment of spinal cord injury: a systematic review of the literature. Neurosurg Focus, 2019. 46(3): p. E6. [DOI] [PubMed] [Google Scholar]
- 15.Kimura T, et al. , Rho/ROCK pathway and noncoding RNAs: implications in ischemic stroke and spinal cord injury. Int J Mol Sci, 2021. 22(21). [DOI] [PMC free article] [PubMed] [Google Scholar]
- 16.Freund P, et al. , MRI in traumatic spinal cord injury: from clinical assessment to neuroimaging biomarkers. Lancet Neurol, 2019. 18(12): p. 1123–1135. [DOI] [PubMed] [Google Scholar]
- 17.Barry RL, et al. , Spinal cord MRI at 7T. Neuroimage, 2018. 168: p. 437–451. [DOI] [PMC free article] [PubMed] [Google Scholar]
- 18.Croul SE and Flanders AE, Neuropathology of human spinal cord injury. Adv Neurol, 1997. 72: p. 317–23. [PubMed] [Google Scholar]
- 19.Kakulas BA, Neuropathology: the foundation for new treatments in spinal cord injury. Spinal Cord, 2004. 42(10): p. 549–63. [DOI] [PubMed] [Google Scholar]
- 20.Kwon BK, Sekhon LH, and Fehlings MG, Emerging repair, regeneration, and translational research advances for spinal cord injury. Spine (Phila Pa 1976), 2010. 35(21 Suppl): p. S263–70. [DOI] [PubMed] [Google Scholar]
- 21.Ahuja CS, et al. , Traumatic spinal cord injury-repair and regeneration. Neurosurgery, 2017. 80(3S): p. S9–S22. [DOI] [PubMed] [Google Scholar]
- 22.Jones TB, McDaniel EE, and Popovich PG, Inflammatory-mediated injury and repair in the traumatically injured spinal cord. Curr Pharm Des, 2005. 11(10): p. 1223–36. [DOI] [PubMed] [Google Scholar]
- 23.Kaas JH, et al. , Cortical and subcortical plasticity in the brains of humans, primates, and rats after damage to sensory afferents in the dorsal columns of the spinal cord. Exp Neurol, 2008. 209(2): p. 407–16. [DOI] [PMC free article] [PubMed] [Google Scholar]
- 24.Thuret S, Moon LD, and Gage FH, Therapeutic interventions after spinal cord injury. Nat Rev Neurosci, 2006. 7(8): p. 628–43. [DOI] [PubMed] [Google Scholar]
- 25.Oyinbo CA, Secondary injury mechanisms in traumatic spinal cord injury: a nugget of this multiply cascade. Acta Neurobiol Exp (Wars), 2011. 71(2): p. 281–99. [DOI] [PubMed] [Google Scholar]
- 26.Hachem LD, Ahuja CS, and Fehlings MG, Assessment and management of acute spinal cord injury: from point of injury to rehabilitation. J Spinal Cord Med, 2017. 40(6): p. 665–675. [DOI] [PMC free article] [PubMed] [Google Scholar]
- 27.Hachem LD and Fehlings MG, Pathophysiology of spinal cord injury. Neurosurg Clin N Am, 2021. 32(3): p. 305–313. [DOI] [PubMed] [Google Scholar]
- 28.Wang F, et al. , Multiparametric MRI reveals dynamic changes in molecular signatures of injured spinal cord in monkeys. Magn Reson Med, 2015. 74(4): p. 1125–37. [DOI] [PMC free article] [PubMed] [Google Scholar]
- 29.Afshari FT, Kappagantula S, and Fawcett JW, Extrinsic and intrinsic factors controlling axonal regeneration after spinal cord injury. Expert Rev Mol Med, 2009. 11: p. e37. [DOI] [PubMed] [Google Scholar]
- 30.Seif M, et al. , Quantitative MRI of rostral spinal cord and brain regions is predictive of functional recovery in acute spinal cord injury. Neuroimage Clin, 2018. 20: p. 556–563. [DOI] [PMC free article] [PubMed] [Google Scholar]
- 31.Ziegler G, et al. , Progressive neurodegeneration following spinal cord injury: Implications for clinical trials. Neurology, 2018. 90(14): p. e1257–e1266. [DOI] [PMC free article] [PubMed] [Google Scholar]
- 32.Seif M, et al. , Cervical cord neurodegeneration in traumatic and non-traumatic spinal cord injury. J Neurotrauma, 2020. 37(6): p. 860–867. [DOI] [PMC free article] [PubMed] [Google Scholar]
- 33.Fawcett JW, Overcoming inhibition in the damaged spinal cord. J Neurotrauma, 2006. 23(3-4): p. 371–83. [DOI] [PubMed] [Google Scholar]
- 34.Fawcett JW, The extracellular matrix in plasticity and regeneration after CNS injury and neurodegenerative disease. Prog Brain Res, 2015. 218: p. 213–26. [DOI] [PubMed] [Google Scholar]
- 35.Guest JD, Hiester ED, and Bunge RP, Demyelination and Schwann cell responses adjacent to injury epicenter cavities following chronic human spinal cord injury. Exp Neurol, 2005. 192(2): p. 384–93. [DOI] [PubMed] [Google Scholar]
- 36.Silver J and Miller JH, Regeneration beyond the glial scar. Nat Rev Neurosci, 2004. 5(2): p. 146–56. [DOI] [PubMed] [Google Scholar]
- 37.Harel R, et al. , Computation in spinal circuitry: lessons from behaving primates. Behav Brain Res, 2008. 194(2): p. 119–28. [DOI] [PubMed] [Google Scholar]
- 38.Vincent JL, et al. , Intrinsic functional architecture in the anaesthetized monkey brain. Nature, 2007. 447(7140): p. 83–6. [DOI] [PubMed] [Google Scholar]
- 39.Nardone R, et al. , Rodent, large animal and non-human primate models of spinal cord injury. Zoology (Jena), 2017. 123: p. 101–114. [DOI] [PubMed] [Google Scholar]
- 40.Sher Y, et al. , Spatiotemporal organization of neuronal activity in the cervical cord of behaving primates. Front Neurosci, 2010. 4: p. 195. [DOI] [PMC free article] [PubMed] [Google Scholar]
- 41.Hutchison RM and Everling S, Monkey in the middle: why non-human primates are needed to bridge the gap in resting-state investigations. Front Neuroanat, 2012. 6: p. 29. [DOI] [PMC free article] [PubMed] [Google Scholar]
- 42.Harel N, Ultra high resolution fMRI at ultra-high field. Neuroimage, 2012. 62(2): p. 1024–8. [DOI] [PMC free article] [PubMed] [Google Scholar]
- 43.Andersen AH, et al. , Functional MRI studies in awake rhesus monkeys: methodological and analytical strategies. J Neurosci Methods, 2002. 118(2): p. 141–52. [DOI] [PubMed] [Google Scholar]
- 44.Curt A, The translational dialogue in spinal cord injury research. Spinal Cord, 2012. 50(5): p. 352–7. [DOI] [PubMed] [Google Scholar]
- 45.Nout YS, et al. , Animal models of neurologic disorders: a nonhuman primate model of spinal cord injury. Neurotherapeutics, 2012. 9(2): p. 380–92. [DOI] [PMC free article] [PubMed] [Google Scholar]
- 46.Kwon BK, et al. , Large animal and primate models of spinal cord injury for the testing of novel therapies. Exp Neurol, 2015. 269: p. 154–68. [DOI] [PubMed] [Google Scholar]
- 47.Nielson JL, et al. , Leveraging biomedical informatics for assessing plasticity and repair in primate spinal cord injury. Brain Res, 2015. 1619: p. 124–38. [DOI] [PMC free article] [PubMed] [Google Scholar]
- 48.Le Corre M, et al. , A novel translational model of spinal cord injury in nonhuman primate. Neurotherapeutics, 2018. 15(3): p. 751–769. [DOI] [PMC free article] [PubMed] [Google Scholar]
- 49.Bortoff GA and Strick PL, Corticospinal terminations in two new-world primates: further evidence that corticomotoneuronal connections provide part of the neural substrate for manual dexterity. J Neurosci, 1993. 13(12): p. 5105–18. [DOI] [PMC free article] [PubMed] [Google Scholar]
- 50.Bowden JL and McNulty PA, The magnitude and rate of reduction in strength, dexterity and sensation in the human hand vary with ageing. Exp Gerontol, 2013. 48(8): p. 756–65. [DOI] [PubMed] [Google Scholar]
- 51.Bowden JL and McNulty PA, Age-related changes in cutaneous sensation in the healthy human hand. Age (Dordr), 2013. 35(4): p. 1077–89. [DOI] [PMC free article] [PubMed] [Google Scholar]
- 52.Jones L, Dextrous hands: human, prosthetic, and robotic. Presence (Camb), 1997. 6(1): p. 29–56. [DOI] [PubMed] [Google Scholar]
- 53.Kinoshita M, et al. , Genetic dissection of the circuit for hand dexterity in primates. Nature, 2012. 487(7406): p. 235–8. [DOI] [PubMed] [Google Scholar]
- 54.Hu D, Xiong CH, and Liu MJ, Exploring the existence of better hands for manipulation than the human hand based on hand proportions. J Theor Biol, 2018. 440: p. 100–111. [DOI] [PubMed] [Google Scholar]
- 55.Pettersson LG, et al. , Skilled digit movements in feline and primate--recovery after selective spinal cord lesions. Acta Physiol (Oxf), 2007. 189(2): p. 141–54. [DOI] [PubMed] [Google Scholar]
- 56.Ozdemir RA and Perez MA, Afferent input and sensory function after human spinal cord injury. J Neurophysiol, 2018. 119(1): p. 134–144. [DOI] [PMC free article] [PubMed] [Google Scholar]
- 57.Rejc E, Angeli C, and Harkema S, Effects of lumbosacral spinal cord epidural stimulation for standing after chronic complete paralysis in humans. PLoS One, 2015. 10(7): p. e0133998. [DOI] [PMC free article] [PubMed] [Google Scholar]
- 58.Chen LM, et al. , Injury alters intrinsic functional connectivity within the primate spinal cord. Proc Natl Acad Sci U S A, 2015. 112(19): p. 5991–6. [DOI] [PMC free article] [PubMed] [Google Scholar]
- 59.Wang F, et al. , Longitudinal assessment of spinal cord injuries in nonhuman primates with quantitative magnetization transfer. Magn Reson Med, 2016. 75(4): p. 1685–96. [DOI] [PMC free article] [PubMed] [Google Scholar]
- 60.Qi HX, et al. , Impairment and recovery of hand use after unilateral section of the dorsal columns of the spinal cord in squirrel monkeys. Behav Brain Res, 2013. 252: p. 363–76. [DOI] [PMC free article] [PubMed] [Google Scholar]
- 61.Reed JL, et al. , Plasticity and recovery after dorsal column spinal cord injury in nonhuman primates. J Exp Neurosci, 2016. 10(Suppl 1): p. 11–21. [DOI] [PMC free article] [PubMed] [Google Scholar]
- 62.Wu TL, et al. , Longitudinal assessment of recovery after spinal cord injury with behavioral measures and diffusion, quantitative magnetization transfer and functional magnetic resonance imaging. NMR Biomed, 2020. 33(4): p. e4216. [DOI] [PMC free article] [PubMed] [Google Scholar]
- 63.Wei P, et al. , Resting state networks in human cervical spinal cord observed with fMRI. Eur J Appl Physiol, 2010. 108(2): p. 265–71. [DOI] [PubMed] [Google Scholar]
- 64.Wang F, et al. , Spatiotemporal trajectories of quantitative magnetization transfer measurements in injured spinal cord using simplified acquisitions. Neuroimage Clin, 2019. 23: p. 101921. [DOI] [PMC free article] [PubMed] [Google Scholar]
- 65.Wang F, et al. , Multiparametric MRI reveals dynamic changes in molecular signatures of injured spinal cord in monkeys. Magn Reson Med, 2015. 74(4): p. 1125–1137. [DOI] [PMC free article] [PubMed] [Google Scholar]
- 66.Cohen-Adad J, et al. , Generic acquisition protocol for quantitative MRI of the spinal cord. Nat Protoc, 2021. 16(10): p. 4611–4632. [DOI] [PMC free article] [PubMed] [Google Scholar]
- 67.De Leener B, et al. , SCT: Spinal Cord Toolbox, an open-source software for processing spinal cord MRI data. Neuroimage, 2017. 145(Pt A): p. 24–43. [DOI] [PubMed] [Google Scholar]
- 68.Lu M, et al. , Optimization of a transmit/receive surface coil for squirrel monkey spinal cord imaging. Magn Reson Imaging, 2020. 68: p. 197–202. [DOI] [PMC free article] [PubMed] [Google Scholar]
- 69.Conrad BN, et al. , Multiple sclerosis lesions affect intrinsic functional connectivity of the spinal cord. Brain, 2018. 141(6): p. 1650–1664. [DOI] [PMC free article] [PubMed] [Google Scholar]
- 70.Sengupta A, et al. , Functional networks in non-human primate spinal cord and the effects of injury. Neuroimage, 2021. 240: p. 118391. [DOI] [PMC free article] [PubMed] [Google Scholar]
- 71.Damoiseaux JS, et al. , Consistent resting-state networks across healthy subjects. Proc Natl Acad Sci U S A, 2006. 103(37): p. 13848–53. [DOI] [PMC free article] [PubMed] [Google Scholar]
- 72.Sorg C, et al. , Selective changes of resting-state networks in individuals at risk for Alzheimer’s disease. Proc Natl Acad Sci U S A, 2007. 104(47): p. 18760–5. [DOI] [PMC free article] [PubMed] [Google Scholar]
- 73.Yang PF, et al. , Parallel functional reorganizations of somatosensory areas 3b and 1, and S2 following spinal cord injury in squirrel monkeys. J Neurosci, 2014. 34(28): p. 9351–63. [DOI] [PMC free article] [PubMed] [Google Scholar]
- 74.Wu R, et al. , High-resolution functional MRI identified distinct global intrinsic functional networks of nociceptive posterior insula and S2 regions in squirrel monkey brain. Neuroimage, 2017. 155: p. 147–158. [DOI] [PMC free article] [PubMed] [Google Scholar]
- 75.Stroman PW, et al. , Mapping of neuronal function in the healthy and injured human spinal cord with spinal fMRI. Neuroimage, 2002. 17(4): p. 1854–60. [DOI] [PubMed] [Google Scholar]
- 76.Stroman PW, et al. , Noninvasive assessment of the injured human spinal cord by means of functional magnetic resonance imaging. Spinal Cord, 2004. 42(2): p. 59–66. [DOI] [PubMed] [Google Scholar]
- 77.Zhao F, et al. , BOLD and blood volume-weighted fMRI of rat lumbar spinal cord during non-noxious and noxious electrical hindpaw stimulation. Neuroimage, 2008. 40(1): p. 133–47. [DOI] [PubMed] [Google Scholar]
- 78.Zhao F, et al. , Pain fMRI in rat cervical spinal cord: an echo planar imaging evaluation of sensitivity of BOLD and blood volume-weighted fMRI. Neuroimage, 2009. 44(2): p. 349–62. [DOI] [PubMed] [Google Scholar]
- 79.Piche M, Paquette T, and Leblond H, Tight neurovascular coupling in the spinal cord during nociceptive stimulation in intact and spinal rats. Neuroscience, 2017. 355: p. 1–8. [DOI] [PubMed] [Google Scholar]
- 80.Malisza KL and Stroman PW, Functional imaging of the rat cervical spinal cord. J Magn Reson Imaging, 2002. 16(5): p. 553–8. [DOI] [PubMed] [Google Scholar]
- 81.Summers PE, Iannetti GD, and Porro CA, Functional exploration of the human spinal cord during voluntary movement and somatosensory stimulation. Magn Reson Imaging, 2010. 28(8): p. 1216–24. [DOI] [PubMed] [Google Scholar]
- 82.Stroman PW, Spinal fMRI investigation of human spinal cord function over a range of innocuous thermal sensory stimuli and study-related emotional influences. Magn Reson Imaging, 2009. 27(10): p. 1333–46. [DOI] [PubMed] [Google Scholar]
- 83.Sprenger C, Finsterbusch J, and Buchel C, Spinal cord-midbrain functional connectivity is related to perceived pain intensity: a combined spino-cortical FMRI study. J Neurosci, 2015. 35(10): p. 4248–57. [DOI] [PMC free article] [PubMed] [Google Scholar]
- 84.Nash P, et al. , Functional magnetic resonance imaging identifies somatotopic organization of nociception in the human spinal cord. Pain, 2013. 154(6): p. 776–81. [DOI] [PubMed] [Google Scholar]
- 85.Lawrence JM, Stroman PW, and Kollias SS, Functional magnetic resonance imaging of the human spinal cord during vibration stimulation of different dermatomes. Neuroradiology, 2008. 50(3): p. 273–80. [DOI] [PubMed] [Google Scholar]
- 86.Weber KA 2nd, et al. , Functional magnetic resonance imaging of the cervical spinal cord during thermal stimulation across consecutive runs. Neuroimage, 2016. 143: p. 267–279. [DOI] [PMC free article] [PubMed] [Google Scholar]
- 87.Smith SD and Kornelsen J, Emotion-dependent responses in spinal cord neurons: a spinal fMRI study. Neuroimage, 2011. 58(1): p. 269–74. [DOI] [PubMed] [Google Scholar]
- 88.Stroman PW, et al. , Changes in pain processing in the spinal cord and brainstem after spinal cord injury characterized by functional magnetic resonance imaging. J Neurotrauma, 2016. 33(15): p. 1450–60. [DOI] [PubMed] [Google Scholar]
- 89.Majcher K, et al. , Functional magnetic resonance imaging within the rat spinal cord following peripheral nerve injury. Neuroimage, 2007. 38(4): p. 669–76. [DOI] [PubMed] [Google Scholar]
- 90.Barry RL, et al. , Resting state functional connectivity in the human spinal cord. eLife, 2014. 3: p. e02812. [DOI] [PMC free article] [PubMed] [Google Scholar]
- 91.Martin AR, et al. , Translating state-of-the-art spinal cord MRI techniques to clinical use: a systematic review of clinical studies utilizing DTI, MT, MWF, MRS, and fMRI. Neuroimage Clin, 2016. 10: p. 192–238. [DOI] [PMC free article] [PubMed] [Google Scholar]
- 92.Kolesar TA, et al. , Assessing nociception by fMRI of the human spinal cord: a systematic review. Magn Reson Insights, 2015. 8(Suppl 1): p. 31–9. [DOI] [PMC free article] [PubMed] [Google Scholar]
- 93.Barry RL, et al. , Multi-shot acquisitions for stimulus-evoked spinal cord BOLD fMRI. Magn Reson Med, 2021. 85(4): p. 2016–2026. [DOI] [PMC free article] [PubMed] [Google Scholar]
- 94.Yang PF, Wang F, and Chen LM, Differential fMRI activation patterns to noxious heat and tactile stimuli in the primate spinal cord. J Neurosci, 2015. 35(29): p. 10493–502. [DOI] [PMC free article] [PubMed] [Google Scholar]
- 95.Wu TL, et al. , Resting-state functional connectivity in the rat cervical spinal cord at 9.4 T. Magn Reson Med, 2018. 79(5): p. 2773–2783. [DOI] [PMC free article] [PubMed] [Google Scholar]
- 96.Chen L, et al. , Fine-scale functional connectivity in somatosensory cortex revealed by high-resolution fMRI. Magn Reson Imaging, 2011. 29(10): p. 1330–7. [DOI] [PMC free article] [PubMed] [Google Scholar]
- 97.Smith SA, et al. , Quantitative magnetization transfer characteristics of the human cervical spinal cord in vivo: application to adrenomyeloneuropathy. Magn Reson Med, 2009. 61(1): p. 22–7. [DOI] [PMC free article] [PubMed] [Google Scholar]
- 98.Fox MD and Raichle ME, Spontaneous fluctuations in brain activity observed with functional magnetic resonance imaging. Nat Rev Neurosci, 2007. 8(9): p. 700–11. [DOI] [PubMed] [Google Scholar]
- 99.Grandjean J, et al. , Optimization of anesthesia protocol for resting-state fMRI in mice based on differential effects of anesthetics on functional connectivity patterns. Neuroimage, 2014. 102 Pt 2: p. 838–47. [DOI] [PubMed] [Google Scholar]
- 100.Jonckers E, et al. , Different anesthesia regimes modulate the functional connectivity outcome in mice. Magn Reson Med, 2014. 72(4): p. 1103–12. [DOI] [PubMed] [Google Scholar]
- 101.Biswal B, et al. , Functional connectivity in the motor cortex of resting human brain using echo-planar MRI. Magn Reson Med, 1995. 34(4): p. 537–41. [DOI] [PubMed] [Google Scholar]
- 102.Bonhomme V, et al. , Influence of anesthesia on cerebral blood flow, cerebral metabolic rate, and brain functional connectivity. Curr Opin Anaesthesiol, 2011. 24(5): p. 474–9. [DOI] [PubMed] [Google Scholar]
- 103.Greicius MD, et al. , Functional connectivity in the resting brain: a network analysis of the default mode hypothesis. Proc Natl Acad Sci U S A, 2003. 100(1): p. 253–8. [DOI] [PMC free article] [PubMed] [Google Scholar]
- 104.Fox MD and Greicius M, Clinical applications of resting state functional connectivity. Front Syst Neurosci. 4: p. 19. [DOI] [PMC free article] [PubMed] [Google Scholar]
- 105.Fingelkurts AA and Kahkonen S, Functional connectivity in the brain--is it an elusive concept? Neurosci Biobehav Rev, 2005. 28(8): p. 827–36. [DOI] [PubMed] [Google Scholar]
- 106.Damoiseaux JS, Resting-state fMRI as a biomarker for Alzheimer’s disease? Alzheimers Res Ther, 2012. 4(2): p. 8. [DOI] [PMC free article] [PubMed] [Google Scholar]
- 107.Falgairolle M, et al. , Coordinated network functioning in the spinal cord: an evolutionary perspective. J Physiol Paris, 2006. 100(5-6): p. 304–16. [DOI] [PubMed] [Google Scholar]
- 108.Barry RL, et al. , A practical protocol for measurements of spinal cord functional connectivity. Sci Rep, 2018. 8(1): p. 16512. [DOI] [PMC free article] [PubMed] [Google Scholar]
- 109.Eippert F, et al. , Investigating resting-state functional connectivity in the cervical spinal cord at 3T. Neuroimage, 2017. 147: p. 589–601. [DOI] [PMC free article] [PubMed] [Google Scholar]
- 110.Barry RL, et al. , Reproducibility of resting state spinal cord networks in healthy volunteers at 7 Tesla. Neuroimage, 2016. 133: p. 31–40. [DOI] [PMC free article] [PubMed] [Google Scholar]
- 111.Wu TL, et al. , Intrinsic functional architecture of the non-human primate spinal cord derived from fMRI and electrophysiology. Nat Commun, 2019. 10(1): p. 1416. [DOI] [PMC free article] [PubMed] [Google Scholar]
- 112.Kinany N, et al. , Dynamic functional connectivity of resting-state spinal cord fMRI reveals fine-grained intrinsic architecture. Neuron, 2020. 108(3): p. 424–435 e4. [DOI] [PubMed] [Google Scholar]
- 113.Kong Y, et al. , Intrinsically organized resting state networks in the human spinal cord. Proc Natl Acad Sci U S A, 2014. 111(50): p. 18067–72. [DOI] [PMC free article] [PubMed] [Google Scholar]
- 114.San Emeterio Nateras O, et al. , Intrinsic Resting-State Functional Connectivity in the Human Spinal Cord at 3.0 T. Radiology, 2016. 279(1): p. 262–8. [DOI] [PMC free article] [PubMed] [Google Scholar]
- 115.Shi Z, et al. , High spatial correspondence at a columnar level between activation and resting state fMRI signals and local field potentials. Proc Natl Acad Sci U S A, 2017. 114(20): p. 5253–5258. [DOI] [PMC free article] [PubMed] [Google Scholar]
- 116.Birn RM, et al. , Separating respiratory-variation-related fluctuations from neuronal-activity-related fluctuations in fMRI. Neuroimage, 2006. 31(4): p. 1536–48. [DOI] [PubMed] [Google Scholar]
- 117.Brooks JC, et al. , Physiological noise modelling for spinal functional magnetic resonance imaging studies. Neuroimage, 2008. 39(2): p. 680–92. [DOI] [PubMed] [Google Scholar]
- 118.Biswal B, DeYoe EA, and Hyde JS, Reduction of physiological fluctuations in fMRI using digital filters. Magn Reson Med, 1996. 35(1): p. 107–13. [DOI] [PubMed] [Google Scholar]
- 119.Fujiyoshi K, et al. , In vivo tracing of neural tracts in the intact and injured spinal cord of marmosets by diffusion tensor tractography. J Neurosci, 2007. 27(44): p. 11991–8. [DOI] [PMC free article] [PubMed] [Google Scholar]
- 120.Bosma R and Stroman PW, Diffusion tensor imaging in the human spinal cord: development, limitations, and clinical applications. Crit Rev Biomed Eng, 2012. 40(1): p. 1–20. [DOI] [PubMed] [Google Scholar]
- 121.Budde MD, et al. , Toward accurate diagnosis of white matter pathology using diffusion tensor imaging. Magn Reson Med, 2007. 57(4): p. 688–95. [DOI] [PubMed] [Google Scholar]
- 122.Fujiyoshi K, et al. , Diffusion tensor imaging and tractography of the spinal cord: from experimental studies to clinical application. Exp Neurol, 2013. 242: p. 74–82. [DOI] [PubMed] [Google Scholar]
- 123.Clark CA and Werring DJ, Diffusion tensor imaging in spinal cord: methods and applications - a review. NMR Biomed, 2002. 15(7-8): p. 578–86. [DOI] [PubMed] [Google Scholar]
- 124.Wheeler-Kingshott CA, et al. , Investigating cervical spinal cord structure using axial diffusion tensor imaging. Neuroimage, 2002. 16(1): p. 93–102. [DOI] [PubMed] [Google Scholar]
- 125.Kaushal M, et al. , Diffusion tensor imaging in acute spinal cord injury: a review of animal and human studies. J Neurotrauma, 2019. 36(15): p. 2279–2286. [DOI] [PubMed] [Google Scholar]
- 126.Zaninovich OA, et al. , The role of diffusion tensor imaging in the diagnosis, prognosis, and assessment of recovery and treatment of spinal cord injury: a systematic review. Neurosurg Focus, 2019. 46(3): p. E7. [DOI] [PubMed] [Google Scholar]
- 127.Zhang J, et al. , Diffusion tensor magnetic resonance imaging of Wallerian degeneration in rat spinal cord after dorsal root axotomy. J Neurosci, 2009. 29(10): p. 3160–71. [DOI] [PMC free article] [PubMed] [Google Scholar]
- 128.Smith SA, Pekar JJ, and van Zijl PC, Advanced MRI strategies for assessing spinal cord injury. Handb Clin Neurol, 2012. 109: p. 85–101. [DOI] [PMC free article] [PubMed] [Google Scholar]
- 129.Song AW, et al. , Functional activation using apparent diffusion coefficient-dependent contrast allows better spatial localization to the neuronal activity: evidence using diffusion tensor imaging and fiber tracking. Neuroimage, 2003. 20(2): p. 955–61. [DOI] [PubMed] [Google Scholar]
- 130.Song SK, et al. , Dysmyelination revealed through MRI as increased radial (but unchanged axial) diffusion of water. Neuroimage, 2002. 17(3): p. 1429–36. [DOI] [PubMed] [Google Scholar]
- 131.Barakat N, et al. , Diffusion tensor imaging of the normal pediatric spinal cord using an inner field of view echo-planar imaging sequence. AJNR Am J Neuroradiol, 2012. 33(6): p. 1127–33. [DOI] [PMC free article] [PubMed] [Google Scholar]
- 132.Budde MD, et al. , The contribution of gliosis to diffusion tensor anisotropy and tractography following traumatic brain injury: validation in the rat using Fourier analysis of stained tissue sections. Brain, 2011. 134(Pt 8): p. 2248–60. [DOI] [PMC free article] [PubMed] [Google Scholar]
- 133.Moen KG, et al. , Traumatic axonal injury: relationships between lesions in the early phase and diffusion tensor imaging parameters in the chronic phase of traumatic brain injury. J Neurosci Res, 2016. 94(7): p. 623–35. [DOI] [PubMed] [Google Scholar]
- 134.Klawiter EC, et al. , Radial diffusivity predicts demyelination in ex vivo multiple sclerosis spinal cords. Neuroimage, 2011. 55(4): p. 1454–60. [DOI] [PMC free article] [PubMed] [Google Scholar]
- 135.Budde MD, et al. , Axial diffusivity is the primary correlate of axonal injury in the experimental autoimmune encephalomyelitis spinal cord: a quantitative pixelwise analysis. J Neurosci, 2009. 29(9): p. 2805–13. [DOI] [PMC free article] [PubMed] [Google Scholar]
- 136.Chiang CW, et al. , Quantifying white matter tract diffusion parameters in the presence of increased extra-fiber cellularity and vasogenic edema. Neuroimage, 2014. 101: p. 310–9. [DOI] [PMC free article] [PubMed] [Google Scholar]
- 137.Laitinen T, et al. , Diffusion tensor MRI of axonal plasticity in the rat hippocampus. Neuroimage, 2010. 51(2): p. 521–30. [DOI] [PubMed] [Google Scholar]
- 138.Song SK, et al. , Demyelination increases radial diffusivity in corpus callosum of mouse brain. Neuroimage, 2005. 26(1): p. 132–40. [DOI] [PubMed] [Google Scholar]
- 139.Hofling AA, et al. , Diffusion tensor imaging detects axonal injury and demyelination in the spinal cord and cranial nerves of a murine model of globoid cell leukodystrophy. NMR Biomed, 2009. 22(10): p. 1100–6. [DOI] [PMC free article] [PubMed] [Google Scholar]
- 140.Jirjis MB, Kurpad SN, and Schmit BD, Ex vivo diffusion tensor imaging of spinal cord injury in rats of varying degrees of severity. J Neurotrauma, 2013. 30(18): p. 1577–86. [DOI] [PMC free article] [PubMed] [Google Scholar]
- 141.Saksena S, et al. , Diffusion tensor imaging assessment of regional white matter changes in the cervical and thoracic spinal cord in pediatric subjects. J Neurotrauma, 2019. 36(6): p. 853–861. [DOI] [PMC free article] [PubMed] [Google Scholar]
- 142.Rasoanandrianina H, et al. , Region-specific impairment of the cervical spinal cord (SC) in amyotrophic lateral sclerosis: a preliminary study using SC templates and quantitative MRI (diffusion tensor imaging/inhomogeneous magnetization transfer). NMR Biomed, 2017. 30(12). [DOI] [PubMed] [Google Scholar]
- 143.Seif M, et al. , Guidelines for the conduct of clinical trials in spinal cord injury: neuroimaging biomarkers. Spinal Cord, 2019. 57(9): p. 717–728. [DOI] [PMC free article] [PubMed] [Google Scholar]
- 144.Feng Q, et al. , DTI for the assessment of disease stage in patients with glomerulonephritis - correlation with renal histology. European Radiology, 2015. 25(1): p. 92–98. [DOI] [PubMed] [Google Scholar]
- 145.Betz RR, et al. , Magnetic resonance imaging (MRI) in the evaluation of spinal cord injured children and adolescents. Paraplegia, 1987. 25(2): p. 92–9. [DOI] [PubMed] [Google Scholar]
- 146.Amster JL, MRI proves superiority in evaluating spinal cord. Diagn Imaging (San Franc), 1991. 13(8): p. 76–82. [PubMed] [Google Scholar]
- 147.Beslow LA, et al. , Role of diffusion MRI in diagnosis of spinal cord infarction in children. Neuropediatrics, 2008. 39(3): p. 188–91. [DOI] [PubMed] [Google Scholar]
- 148.Mishra A, et al. , Longitudinal changes in DTI parameters of specific spinal white matter tracts correlate with behavior following spinal cord injury in monkeys. Sci Rep, 2020. 10(1): p. 17316. [DOI] [PMC free article] [PubMed] [Google Scholar]
- 149.Wolff SD, et al. , Magnetization transfer contrast: MR imaging of the knee. Radiology, 1991. 179(3): p. 623–8. [DOI] [PubMed] [Google Scholar]
- 150.Wolff SD, Eng J, and Balaban RS, Magnetization transfer contrast: method for improving contrast in gradient-recalled-echo images. Radiology, 1991. 179(1): p. 133–7. [DOI] [PubMed] [Google Scholar]
- 151.Wolff SD and Balaban RS, Magnetization transfer contrast (MTC) and tissue water proton relaxation in vivo. Magn Reson Med, 1989. 10(1): p. 135–44. [DOI] [PubMed] [Google Scholar]
- 152.Cohen-Adad J, et al. , Demyelination and degeneration in the injured human spinal cord detected with diffusion and magnetization transfer MRI. Neuroimage, 2011. 55(3): p. 1024–33. [DOI] [PubMed] [Google Scholar]
- 153.Paliwal M, et al. , Magnetization transfer ratio and morphometrics of the spinal cord associates with surgical recovery in patients with degenerative cervical myelopathy. World Neurosurg, 2020. 144: p. e939–e947. [DOI] [PMC free article] [PubMed] [Google Scholar]
- 154.Rasoanandrianina H, et al. , Sensitivity of the inhomogeneous magnetization transfer imaging technique to spinal cord damage in multiple sclerosis. AJNR Am J Neuroradiol, 2020. 41(5): p. 929–937. [DOI] [PMC free article] [PubMed] [Google Scholar]
- 155.McGowan JC, Schnall MD, and Leigh JS, Magnetization-transfer imaging with pulsed off-resonance saturation - variation in contrast with saturation duty cycle. J Magn Reson Imaging, 1994. 4(1): p. 79–82. [DOI] [PubMed] [Google Scholar]
- 156.Ramani A, et al. , Precise estimate of fundamental in-vivo MT parameters in human brain in clinically feasible times. Magn Reson Imaging, 2002. 20(10): p. 721–31. [DOI] [PubMed] [Google Scholar]
- 157.Sled JG and Pike GB, Quantitative interpretation of magnetization transfer in spoiled gradient echo MRI sequences. J Magn Reson, 2000. 145(1): p. 24–36. [DOI] [PubMed] [Google Scholar]
- 158.Henkelman RM, et al. , Quantitative interpretation of magnetization transfer. Magn Reson Med, 1993. 29(6): p. 759–66. [DOI] [PubMed] [Google Scholar]
- 159.Gochberg DF and Gore JC, Quantitative imaging of magnetization transfer using an inversion recovery sequence. Magn Reson Med, 2003. 49(3): p. 501–505. [DOI] [PubMed] [Google Scholar]
- 160.Cercignani M and Barker GJ, A comparison between equations describing in vivo MT: The effects of noise and sequence parameters. J Magn Reson, 2008. 191(2): p. 171–183. [DOI] [PMC free article] [PubMed] [Google Scholar]
- 161.Zackowski KM, et al. , Sensorimotor dysfunction in multiple sclerosis and column-specific magnetization transfer-imaging abnormalities in the spinal cord. Brain, 2009. 132(Pt 5): p. 1200–9. [DOI] [PMC free article] [PubMed] [Google Scholar]
- 162.Cohen-Adad J, Microstructural imaging in the spinal cord and validation strategies. Neuroimage, 2018. 182: p. 169–183. [DOI] [PubMed] [Google Scholar]
- 163.Wang F, et al. , MRI evaluation of regional and longitudinal changes in Z-spectra of injured spinal cord of monkeys. Magn Reson Med, 2018. 79(2): p. 1070–1082. [DOI] [PMC free article] [PubMed] [Google Scholar]
- 164.Wang F, et al. , Sensitivity and specificity of CEST and NOE MRI in injured spinal cord in monkeys. Neuroimage Clin, 2021. 30: p. 102633. [DOI] [PMC free article] [PubMed] [Google Scholar]
- 165.Dula AN, et al. , Chemical exchange saturation transfer of the cervical spinal cord at 7 T. NMR Biomed, 2016. 29(9): p. 1249–57. [DOI] [PMC free article] [PubMed] [Google Scholar]
- 166.Togao O, et al. , Amide proton transfer imaging of adult diffuse gliomas: correlation with histopathological grades. Neuro Oncol, 2014. 16(3): p. 441–8. [DOI] [PMC free article] [PubMed] [Google Scholar]
- 167.Jones CK, et al. , Amide proton transfer imaging of human brain tumors at 3T. Magn Reson Med, 2006. 56(3): p. 585–92. [DOI] [PubMed] [Google Scholar]
- 168.Jin T. et al. , Magnetic resonance imaging of the Amine-Proton EXchange (APEX) dependent contrast. Neuroimage, 2012. 59(2): p. 1218–27. [DOI] [PMC free article] [PubMed] [Google Scholar]
- 169.Chen L, et al. , High-sensitivity CEST mapping using a spatiotemporal correlation-enhanced method. Magn Reson Med, 2020. 84(6): p. 3342–3350. [DOI] [PMC free article] [PubMed] [Google Scholar]
- 170.van Zijl PC, et al. , MRI detection of glycogen in vivo by using chemical exchange saturation transfer imaging (glycoCEST). Proc Natl Acad Sci U S A, 2007. 104(11): p. 4359–64. [DOI] [PMC free article] [PubMed] [Google Scholar]
- 171.van Zijl PC and Yadav NN, Chemical exchange saturation transfer (CEST): what is in a name and what isn’t? Magn Reson Med, 2011. 65(4): p. 927–48. [DOI] [PMC free article] [PubMed] [Google Scholar]
- 172.Zhang XY, et al. , A new NOE-mediated MT signal at around -1.6ppm for detecting ischemic stroke in rat brain. Magn Reson Imaging, 2016. 34(8): p. 1100–6. [DOI] [PMC free article] [PubMed] [Google Scholar]
- 173.Zu Z, et al. , Relayed nuclear Overhauser enhancement sensitivity to membrane Cho phospholipids. Magn Reson Med, 2020. 84(4): p. 1961–1976. [DOI] [PMC free article] [PubMed] [Google Scholar]
- 174.Zu Z, et al. , Chemical exchange rotation transfer imaging of phosphocreatine in muscle. NMR Biomed, 2021. 34(2): p. e4437. [DOI] [PMC free article] [PubMed] [Google Scholar]
- 175.Wang F, et al. , Mapping murine diabetic kidney disease using chemical exchange saturation transfer MRI. Magn Reson Med, 2016. 76(5): p. 1531–1541. [DOI] [PMC free article] [PubMed] [Google Scholar]
- 176.Desmond KL, Moosvi F, and Stanisz GJ, Mapping of amide, amine, and aliphatic peaks in the CEST spectra of murine xenografts at 7 T. Magn Reson Med, 2014. 71(5): p. 1841–53. [DOI] [PubMed] [Google Scholar]
- 177.van Zijl PC, et al. , Mechanism of magnetization transfer during on-resonance water saturation. A new approach to detect mobile proteins, peptides, and lipids. Magn Reson Med, 2003. 49(3): p. 440–9. [DOI] [PubMed] [Google Scholar]
- 178.Zhang XY, et al. , Assignment of the molecular origins of CEST signals at 2 ppm in rat brain. Magn Reson Med, 2017. 78(3): p. 881–887. [DOI] [PMC free article] [PubMed] [Google Scholar]
- 179.Sun PZ, et al. , Investigation of optimizing and translating pH-sensitive pulsed-chemical exchange saturation transfer (CEST) imaging to a 3T clinical scanner. Magn Reson Med, 2008. 60(4): p. 834–41. [DOI] [PMC free article] [PubMed] [Google Scholar]
- 180.Sun PZ and Sorensen AG, Imaging pH using the chemical exchange saturation transfer (CEST) MRI: correction of concomitant RF irradiation effects to quantify CEST MRI for chemical exchange rate and pH. Magn Reson Med, 2008. 60(2): p. 390–397. [DOI] [PubMed] [Google Scholar]
- 181.Zhou J, et al. , Practical data acquisition method for human brain tumor amide proton transfer (APT) imaging. Magn Reson Med, 2008. 60(4): p. 842–9. [DOI] [PMC free article] [PubMed] [Google Scholar]
- 182.Togao O, et al. , Characterization of lung cancer by amide proton transfer (APT) imaging: an in-vivo study in an orthotopic mouse model. PLoS One, 2013. 8(10): p. e77019. [DOI] [PMC free article] [PubMed] [Google Scholar]
- 183.Bradbury EJ and Burnside ER, Moving beyond the glial scar for spinal cord repair. Nat Commun, 2019. 10(1): p. 3879. [DOI] [PMC free article] [PubMed] [Google Scholar]
- 184.Rowland JW, et al. , Current status of acute spinal cord injury pathophysiology and emerging therapies: promise on the horizon. Neurosurg Focus, 2008. 25(5): p. E2. [DOI] [PubMed] [Google Scholar]
- 185.Zweckberger K, et al. , Self-assembling peptides optimize the post-traumatic milieu and synergistically enhance the effects of neural stem cell therapy after cervical spinal cord injury. Acta Biomater, 2016. 42: p. 77–89. [DOI] [PubMed] [Google Scholar]
- 186.Curt A, et al. , The damaged spinal cord is a suitable target for stem cell transplantation. Neurorehabil Neural Repair, 2020. 34(8): p. 758–768. [DOI] [PubMed] [Google Scholar]
- 187.Keirstead HS, et al. , Enhanced axonal regeneration following combined demyelination plus schwann cell transplantation therapy in the injured adult spinal cord. Exp Neurol, 1999. 159(1): p. 225–36. [DOI] [PubMed] [Google Scholar]
- 188.Khazaei M, Ahuja CS, and Fehlings MG, Induced pluripotent stem cells for traumatic spinal cord injury. Front Cell Dev Biol, 2016. 4: p. 152. [DOI] [PMC free article] [PubMed] [Google Scholar]
- 189.Wilson JR and Fehlings MG, Riluzole for acute traumatic spinal cord injury: a promising neuroprotective treatment strategy. World Neurosurg, 2014. 81(5-6): p. 825–9. [DOI] [PubMed] [Google Scholar]