

Abstract
Mitochondria are major sources of reactive oxygen species (ROS), which play important roles in both physiological and pathological processes. However, the specific contributions of different ROS production and scavenging components in the mitochondria of metabolically active tissues such as heart and kidney cortex and outer medulla (OM) are not well understood. Therefore, the goal of this study was to determine contributions of different ROS production and scavenging components and provide detailed comparisons of mitochondrial respiration, bioenergetics, ROS emission between the heart and kidney cortex and OM using tissues obtained from the same Sprague-Dawley rat under identical conditions and perturbations. Specifically, data were obtained using both NADH-linked substrate pyruvate+malate and FADH2-linked substrate succinate followed by additions of inhibitors of different components of the electron transport chain (ETC) and oxidative phosphorylation (OxPhos) and other ROS production and scavenging systems. Currently, there is limited data available for the mitochondria of kidney cortex and OM, the two major energy-consuming tissues in the body only next to the heart, and scarce quantitative information on the interplay between mitochondrial ROS production and scavenging systems in the three tissues. The findings from this study demonstrate significant differences in mitochondrial respiratory and bioenergetic functions and ROS emission among the three tissues. The results quantify the rates of ROS production from different complexes of the ETC, identify the complexes responsible for variations in mitochondrial membrane depolarization and regulations of ROS production, and quantify the contributions of ROS scavenging enzymes towards overall mitochondrial ROS emission. These findings advance our fundamental knowledge of tissue-specific and substrate-dependent mitochondrial respiratory and bioenergetic functions and ROS emission. This is important given the critical role that excess ROS production, oxidative stress, and mitochondrial dysfunction in the heart and kidney cortex and OM play in the pathogenesis of cardiovascular and renal diseases, including salt-sensitive hypertension.
Keywords: Mitochondrial metabolism, Respiration and bioenergetics, Forward and reverse electron transfer, ROS production and scavenging, ROS emission, Oxidative stress, NADPH Oxidase
Graphical Abstract
INTRODUCTION
Mitochondria and NADPH oxidases (NOX: e.g., NOX2, NOX4) are major cellular sources of reactive oxygen species (ROS: e.g., , H2O2) in humans and rodents [1–3]. Mitochondria produce and H2O2 as byproducts of metabolism and oxidative phosphorylation (OxPhos), whereas and H2O2 are direct products of NOXs on the cell membrane [4–7]. At low concentrations, ROS function as secondary messengers activating and deactivating different cell signaling pathways [8, 9]. However, when produced in high concentrations, ROS can cause oxidative stress, inflammation, apoptosis, tissue damage, and diseases [8, 9].
Mitochondria are vital cellular organelles responsible for adenosine triphosphate (ATP) production which is required for the diverse cellular functions essential for the survival of the organism. ATP is produced through mitochondrial metabolism and OxPhos with ROS as byproducts of the electron transport chain (ETC) reactions [10, 11]. The heart and kidney are the two most metabolically active organs in humans and rodents with high mitochondrial contents, basal metabolic rates, and energy requirements. Hence, excess mitochondrial ROS (mtROS) production in these organs can play a crucial role in both normal function and pathogenesis of cardiovascular and renal diseases [12–15]. As portrayed in Figure 1, the mitochondrial ETC complexes I and III (CI and CIII) are major sources of ROS [16–18]. Major mitochondrial ROS scavengers include the glutathione (GSH) and thioredoxin (TRX) systems [19, 20]. Both CI and CIII produce superoxide anion () that is converted to hydrogen peroxide (H2O2) by manganese superoxide dismutase (MnSOD), which is then reduced to H2O by the GSH and TRX systems [4, 5, 21, 22]. Recent studies have shown that complex II (CII) is another major source of ROS in the mitochondria [23, 24] [25]. Quinlan et al. found that when CI and CIII are fully inhibited and succinate concentration is low, CII produces or H2O2 in rat skeletal muscle [26]. Audi et al. showed that CII is the predominant source of H2O2 in isolated perfused rat lungs [23].
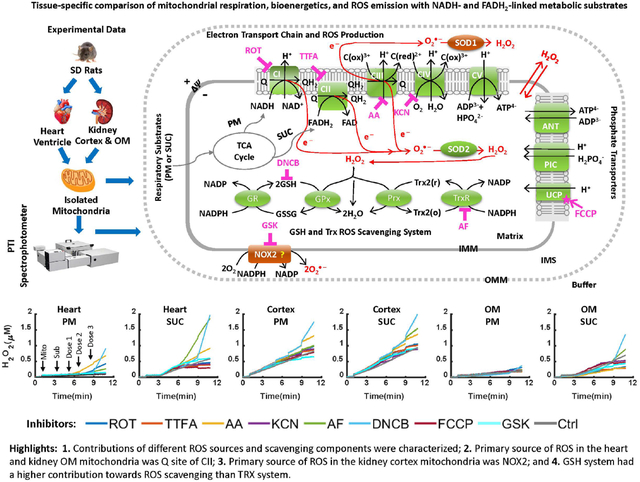
Figure 1. Schematics of the mitochondrial oxidative phosphorylation and ROS production and scavenging.
The illustrated biological system includes mitochondrial electron transport chain (ETC) reactions and ROS production; nucleotides and phosphate transporters on mitochondrial inner membrane; mitochondrial ROS scavenging systems; membrane NOX2 enzyme. Mitochondrial ETC reactions occur via complex I (CI) to complex IV (CIV) which are involved in oxidative phosphorylation (OxPhos), ATP synthesis at complex V (CV), and ROS production. In mitochondrial ROS scavenging systems, redox reactions occur via superoxide dismutase SOD2 in mitochondria and glutathione (GSH) and thioredoxin (TRX) systems. Cell membrane NOX2 which is one of the major sources of ROS production in the cytosol is involved is shown as a potential source of ROS production in the mitochondria. The potential sites of ROS production are targeted by their corresponding inhibitors including CI inhibitor ROT, CII inhibitor TTFA, CIII inhibitor AA, CIV inhibitor KCN, and NOX2 inhibitor GSK. The main components involved in ROS scavenging including TRX system is inhibited by AF and GSH system is inhibited by DNCB. The ROS-ΔΨm-uncoupling feedback loop is studied by inducing maximum uncoupling effect using FCCP. The “?” shows potential contribution of NOX2 to mtROS production.
Most studies related to mtROS production have focused on heart and skeletal muscle mitochondria [27, 28] with very limited data available for kidney mitochondria [29]. Furthermore, quantitative interplay between mtROS production and scavenging is not well-understood in any of the tissues [30–32]. This lack of understanding has been exacerbated by the presence of multiple ROS-producing sources and scavenging systems in the mitochondria, including dismutase enzyme MnSOD and H2O2 scavenging enzymes (GSH and TRX systems) [25]. In this study, we aimed to systematically and quantitatively characterize the contributions of different ROS production and scavenging components towards overall mtROS production using experimental data obtained from isolated mitochondria from cardiac muscle tissue (heart) and epithelial tissue (kidney cortex and outer medulla (OM)).
The family of cell membrane NOXs is a significant source of ROS in cells [6, 33, 34]. They play a crucial role in the cellular innate immune response by generating a relatively large amount of and H2O2 known as “respiratory burst” to kill pathogens [34]. The NOX2 and NOX4 isoforms are abundant in the heart and kidney [35, 36]. Li et al. [36] reported a progressive increase in the level of NOX subunits including p22, gp91, p67, and p47 during the progression of cardiac hypertrophy. Similarly, Cowley et al. [37] and Zheleznova et al. [38] reported significant contributions of NOX4 and NOX2 in the kidney towards the progression of salt-sensitive hypertension in salt-sensitive rats. Recent studies have shown that there is feed-forward regulation of ROS between cell membrane NOXs and mitochondria [3, 39, 40]. Studies by Ohsaki et al. [41] found evidence of feed-forward signaling from the kidney medullary thick ascending limb mitochondria to cell membrane NOXs. Dikalov et al. [3] reported that the crosstalk between mitochondria- and NOX-mediated ROS production can be pharmacologically targeted under conditions of oxidative stress. In this study, we examine the contribution of NOX2 towards overall mtROS production in isolated mitochondria from each of the three tissues and determine whether NOX2 in an inherent component of mitochondria or its presence is due to contamination during the isolation process. GSK3795039 (GSK), the first small molecule identified to inhibit NOX2 over other NOX isoforms, was used to specifically inhibit NOX2 over other isoforms in the present study [42, 43].
The mitochondrial membrane potential (ΔΨm), mtROS, and proton leak are intricately linked. ΔΨm and pH gradient (ΔpH) together determine the proton motive force (ΔP) which drives ATP synthesis [44]. In respiring mitochondria, ΔΨm is typically maintained between 150 and 200 mV and this energy is dissipated during OxPhos for ATP synthesis. Mitochondrial ROS production is triggered by the leak of electrons from the respiratory chain (ETC) and their reaction with molecular O2 resulting in production. A strong positive correlation exists between mtROS emission and ΔΨm [45]. Starkov et al. [46] reported significant increases in mtROS production when ΔΨm increased above 140 mV. Conversely, increased mtROS production has also been observed with reductions of ΔΨm found in mitochondrial disorders associated with decrease in the activity of ETC components [47, 48].
The mitochondrial proton leak fine-tunes mtROS levels through a protective feedback loop where increased ROS production enhances proton leak, and increased proton leak reduces ROS production [49]. The regulation of proton leak and electron leak has been suggested as a potential therapeutic target for many cardiovascular diseases [49], body weight regulations, and insulin secretion [50].
To date, no systematic study has integrated changes in mtROS production, ΔΨm, proton leak, and NOX-mitochondria ROS-ROS crosstalk. Therefore, the aim of the present study was to determine the sources of ROS production and scavenging in isolated mitochondria from cardiac muscle tissue (heart) and epithelial tissue (kidney cortex and OM). We sought to determine the relative contribution of ROS producing sources and antioxidant enzymes towards overall mtROS emission (see Figure 1). To achieve this, we used specific inhibitors of ETC complexes and ROS scavenging systems to systematically and quantitatively characterize the contributions of these distinct sources towards overall mtROS production. Additionally, we investigated the ETC uncoupling effect on mtROS production using the mitochondrial uncoupling agent Trifluoromethoxy Carbonylcyanide Phenylhydrazone (FCCP), and the potential NOX2 contribution towards overall mtROS generation by inhibiting NOX2 with GSK2795039.
METHODS
Male Sprague-Dawley (SD) rats (8–9 weeks old; 300–350 g) were purchased from Envigo (Madison, WI) and housed in our animal facilities. Rats were maintained at 21±2 °C with a 12:12-h light-dark cycle and were provided water and food ad libitum. The Medical College of Wisconsin (MCW) Institutional Animal Care and Use Committee (IACUC) approved the animal use and the experimental protocols described below. Rats were anesthetized with inaction 2 mL/100 gm and the heart and kidneys were harvested for mitochondrial isolation by differential centrifugation as described below with the tissue maintained at (4°C) throughout the procedures.
Heart mitochondria isolation:
Heart mitochondria were isolated through differential centrifugation method, as described previously [51, 52]. Briefly, the heart was harvested from the SD rat, and for consistency in mitochondrial yield, ~0.8 gm of the heart tissue was used for mitochondrial isolation. The heart was minced in ice-cold isolation buffer (IB) containing (in mM) 200 mannitol, 50 sucrose, 5 KH2PO4, 5 3-(N-morpholino) propane sulfonic acid (MOPS), and 1 EGTA, with 0.1% bovine serum albumin (BSA) at pH 7.15 (adjusted with KOH). The minced heart was suspended in 2.5 mL IB with 5U/mL protease which was then adjusted to 15 mL with IB and homogenized for 32 seconds. The volume of suspension was then adjusted at 25 mL with IB and centrifuged at 8000 g for 10 minutes. The supernatant was discarded, and the pellet was re-suspended in 25 mL IB and centrifuged at 8000 g for 10 minutes. The supernatant was discarded, and the pellet was again re-suspended in 25 mL IB and centrifuged at 700 g for 10 minutes. The pellet was discarded and supernatant from this step was centrifuged again at 8000g for 10 minutes to yield the final mitochondrial pellet, which was suspended in IB, transferred to an Eppendorf tube and kept on ice for measuring protein content.
Kidney mitochondria isolation:
Kidney mitochondria were isolated via differential centrifugation method with slight modification from that for the heart mitochondria, as described previously [51, 52]. Briefly, cortical and outer medullary (OM) tissues were dissected from the kidney. For consistency in mitochondrial yield, ~0.1 gm of OM tissue and ~0.8 gm of cortex tissue was used for mitochondrial isolation. Both tissues were minced in the IB and the volume was adjusted to 10 mL for cortex and 2 mL for OM which were then homogenized for 15 and 5 seconds, respectively. The volume was adjusted with IB to a total of 15 mL for cortex and 2 mL for OM which were then centrifuged at 600g for 10 minutes. The pellet was discarded, and the supernatant was centrifuged at 12,000g for 15 minutes for both tissues. The pellet was then mixed well in IB, and the volume was adjusted up to 15 mL for cortex and 2 mL for OM. This was centrifuged for the third time at 12,000 g for 15 minutes to yield the final mitochondrial pellet which was transferred to an Eppendorf tube and placed on ice for measuring protein content.
Mitochondrial protein measurement, purity, and quality assessment:
After suspension of the mitochondrial pellet in the final step, the final mitochondrial protein content was determined using BSA as the standard with Bio-Rad Quick Start Bradford Assay Kit in Thermo™ Scientific™ NanoDrop OneC spectrophotometer [53]. Mitochondrial purity was determined using western blot, and mitochondrial quality was controlled by the Respiratory Control Index (RCI). Mitochondrial RCI is defined as the O2 consumption rate (OCR) at state 3 / OCR at state 2. To obtain RCI, mitochondrial OCR was measured following the experimental protocol in Figure 2A, where pyruvate (5mM) and malate (2.5mM) were added as substrates, followed by the addition of 500 μM ADP for heart mitochondria and 250 μM ADP for kidney cortex and OM mitochondria. The RCI should be between 8 and 10 for heart mitochondria and between 5 and 8 for kidney cortex and OM mitochondria.
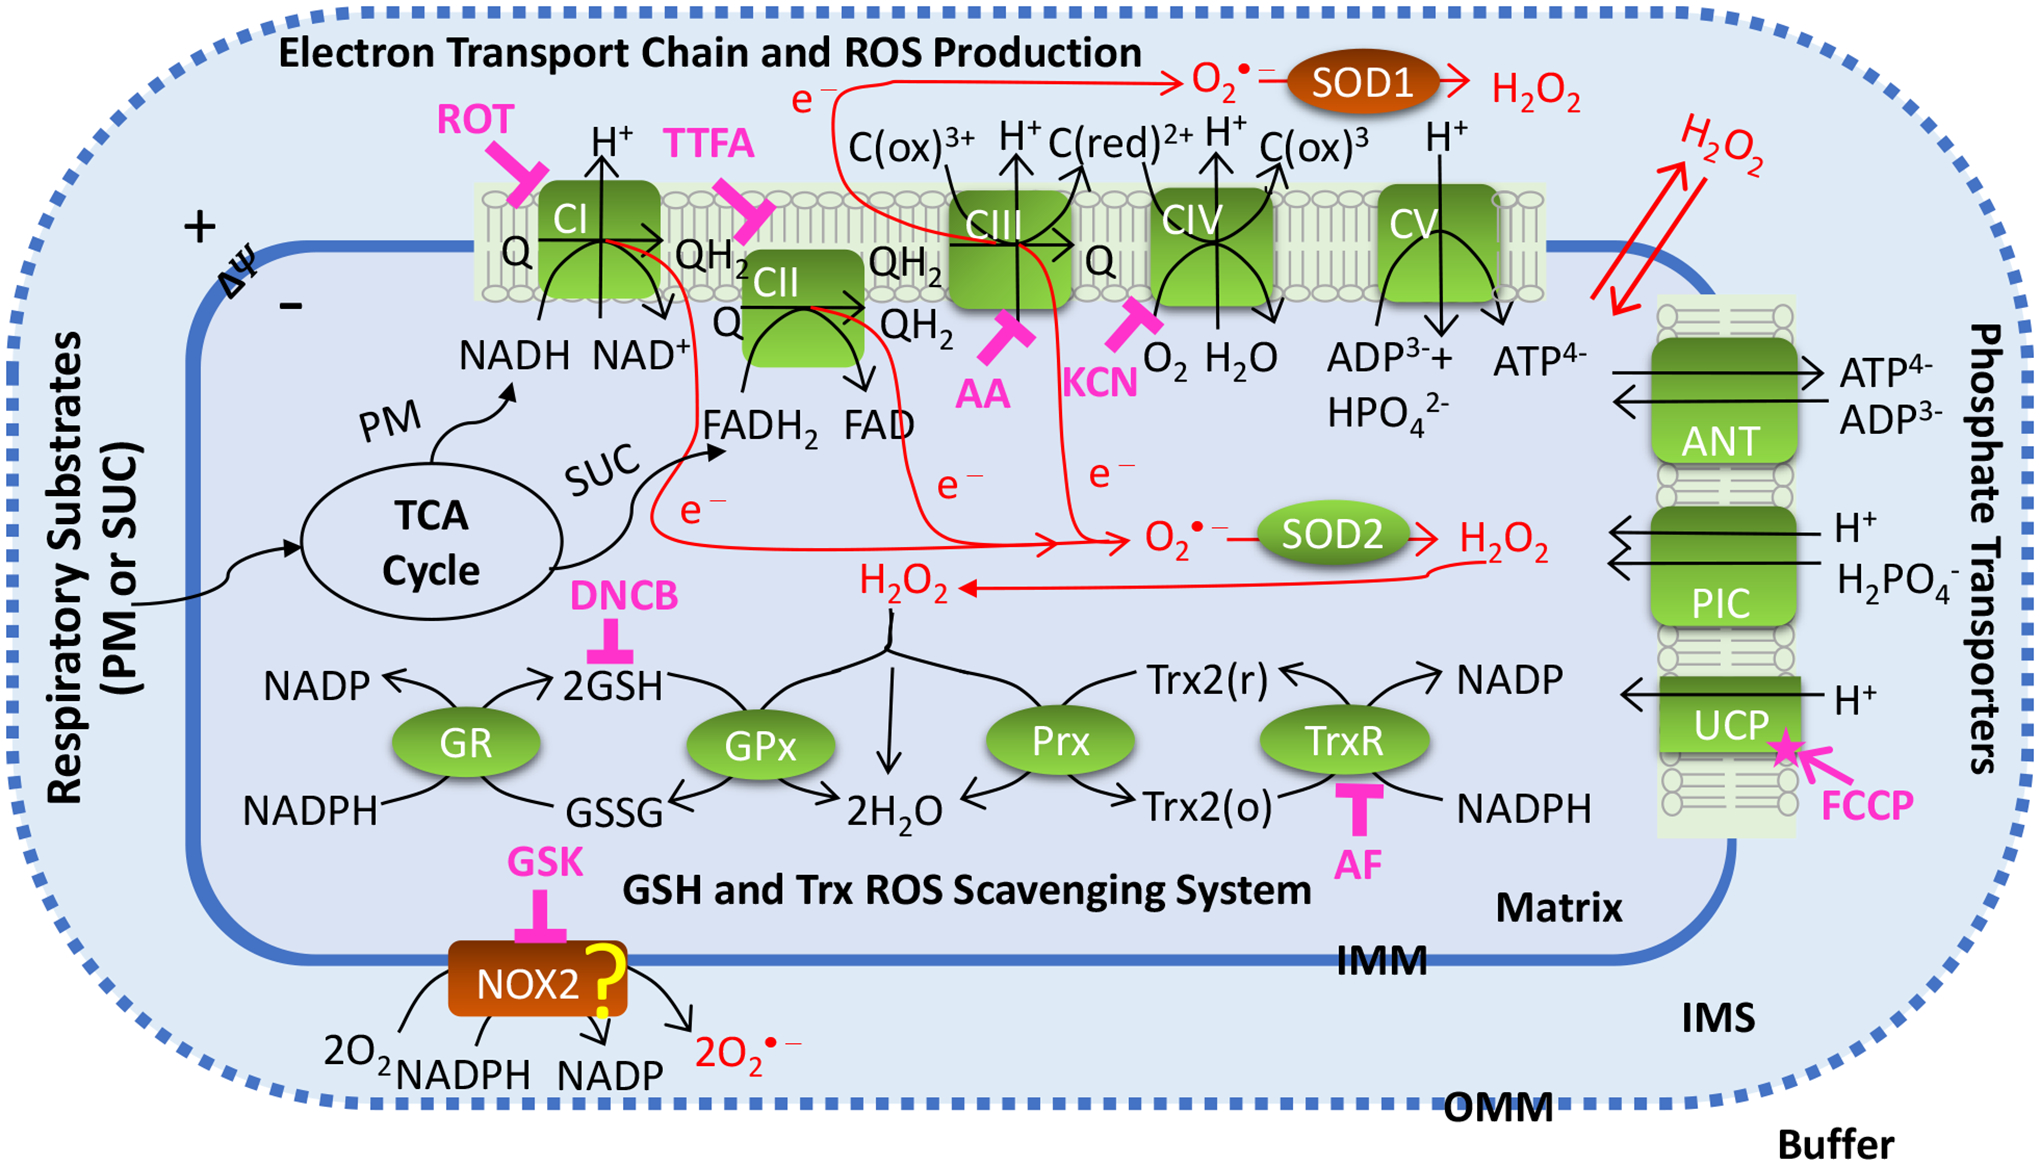
Figure 2. Timeline experimental protocols for isolated mitochondrial respiration, H2O2, and ΔΨm measurements in Sprague-Dawley (SD) rat heart and kidney cortex and OM.
(A) Protocol for measuring time-course of mitochondrial respiration and RCI. At time (t) = 0 min, 0.1 mg/mL mitochondria for heart and kidney cortex and OM were added to the respiration buffer, followed by PM (5:2.5mM) addition after 2 min, followed by 500 μM ADP addition to heart mitochondria, and 250 μM ADP addition to kidney cortex and OM mitochondria at t = 4 min. (B) Protocol for measuring time-courses of mitochondrial respiration, ΔΨ and H2O2 flux. At time (t) = 0 min, 0.1 mg/mL mitochondria for heart and kidney cortex and OM were added to the respiration or AR or R123 buffer, followed by PM (5:2.5mM) or SUC (10mM) substrates addition after 2 min, followed by 200 μM ADP addition to heart mitochondria, and 100 μM ADP addition to kidney cortex and OM mitochondria at t = 4 min. In ΔΨm and H2O2 measurements 2μM FCCP were added after ADP exhaustion. (C) Protocol for measuring time-courses of mitochondrial H2O2 emission and ΔΨm. At t = 0 min, 0.1 mg/mL mitochondria for heart and kidney cortex and OM were added to the AR buffer or R123 buffer, followed by 5:2.5 mM PM, or 10 mM SUC addition after 1:30 min. At t = 3:30 min, first concentration of Rot inhibitor (or one of the following inhibitors TTFA, AA, KCN, GSK, AF, and DNCB or FCCP uncoupler) was added followed by addition of second and third concentrations at t = 5:30, and 7:30 min.
Oxygen consumption measurement:
Isolated mitochondria from the heart and kidney cortex and OM were suspended in respiration buffer (RB) containing (in mM) 130 KCl, 5 K2HPO4, 20 MOPS, 1 EGTA, and 0.1% BSA at pH 7.15 adjusted with KOH. Mitochondrial O2 consumption (respiration) was measured using Oxygraph-2k (O2k) respirometer (Oroboros Instruments, Innsbruck, Austria) with DatLab 7 software for data acquisition and analysis. The O2k chambers were calibrated at O2 concentration of 210 μM, temperature fixed at 37 °C, and the suspension stirring at 750 rpm. The O2 concentration is acquired in μM, and the O2 consumption rate is acquired in pmol/sec/mL.
Membrane potential measurement:
Isolated mitochondria from the heart and kidney cortex and OM were suspended in the respiration buffer (RB) containing the fluorescent dye rhodamine 123 (R123; 1 μM) stirred at 1200 rpm with temperature fixed at 37 °C. R123 is a monovalent cationic dye that is sequestered electrophoretically into the mitochondrial matrix driven by ΔΨm [54]. The R123 intensity was detected using a Photon Technology International (PTI) spectrofluorometer (Horiba Scientific Inc.) with the excitation (λex) and emission (λem) wavelengths set at 500 and 529 nm, respectively. R123 is widely used for dynamic measurements of isolated mitochondrial membrane potential (ΔΨm), but quantitative interpretation of changes in the R123 fluorescence requires a nonlinear calibration method. For this purpose, we used a computational model of mitochondrial bioenergetics coupled with R123 dye transport across the inner mitochondrial membrane (IMM) and partitioning of the dye into the mitochondrial matrix [55], as used in our recent study [51].
H2O2 measurement:
Isolated mitochondria from the heart and kidney cortex and OM were suspended in the respiration buffer (RB) containing Amplex Red reagent (AR; 10-acetyl-3, 7-dihydroxyphenoxazine; 50 μM) and horseradish peroxidase enzyme (HRP; 0.1 U/ml) at 37 °C. In the presence of HRP, mitochondrial H2O2 reacts with AR to produce the fluorescent product resorufin which is detected by the PTI spectrofluorometer with the excitation and emission wavelengths set at 530 and 583 nm, respectively. Resorufin fluorescence was then calibrated to H2O2 concentration using a standard curve and linear regression as described in our recent study [51]. For the present study, the standard curve has R2 value of 0.99, and slope (AR intensity / H2O2) of 124103 (a.f.u. / μM).
Experimental Protocol:
In one set of experiments, mitochondrial O2 consumption, ΔΨm and H2O2 emission were measured following the timeline protocol in Figure 2B where mitochondria were energized with NADH-linked substrates pyruvate (5 mM) and malate (2.5 mM) or FADH2-linked substrate succinate (10 mM) followed by the addition of 200 μM ADP for heart mitochondria and 100 μM ADP for kidney cortex and OM mitochondria. In this protocol, we measured five respiratory states including state 1 after the addition of mitochondria, state 2 or leak state after the addition of substate, state 3 or OxPhos state after the addition of ADP, state 4 after ADP is phosphorylated to ATP, and state 5 or uncoupling state after FCCP (2 μM) was added. The purpose of this set of experiments was to understand mitochondrial respiration and bioenergetics in relation to ROS generation. In another set of experiments, mitochondrial ΔΨm and H2O2 emission were measured following the timeline protocol in Figure 2C where mitochondria were energized with either NADH-linked or FADH2-linked substrates followed by sequential addition of increasing doses of one of a set of 8 inhibitors of various ETC complexes, NOX2, and mtROS scavenging systems. In this protocol, we measured state 1 after the addition of mitochondria and state 2 after the addition of substrates followed by the addition of increasing doses of an inhibitor. The purpose of this experimental protocol was to study the relative contribution of mtROS production sites and scavenging enzymes to overall mtROS generation (Figure 1).
Data analysis and statistics:
MatLab and MS Excel software were used for data analysis and statistics, including the conversion of R123 fluorescence to ΔΨm in mV, the conversion of resorufin fluorescence to H2O2 concentration in μM, statistical analysis (mean, standard deviation (S.D.), and standard error (S.E.)). Students’ t-test and one-way ANOVA with p<0.05 were used for determining statistical significance. Data are shown as mean ± S.E. with 4 to 6 biological replicates.
RESULTS
To ensure the viability of isolated mitochondria, we determined the RCI (state 3 OCR / state 2 OCR) for each experimental day with pyruvate+malate (PM) substrate followed by the addition of saturating ADP concentrations (500 μM for heart and 250 μM for kidney cortex and OM), following the experimental protocol of Figure 2A. Heart samples with RCI values of less than 8 were discarded, and kidney cortex and OM samples with RCI values less than 6 were discarded. The viable heart mitochondrial RCI averaged 8.74±0.32 and the viable kidney cortex and OM mitochondrial RCI averaged 6.91±0.44 and 7.15±0.39, respectively.
After quality control assessment, we evaluated mitochondrial OCR, ΔΨm, and H2O2 emission in the presence of PM (5:2.5 mM) or succinate (SUC, 10 mM) as substrate followed by the addition of a single dose of ADP (200 μM for heart and 100 μM for kidney cortex and OM) for isolated heart and kidney cortex and OM mitochondria following the timeline protocol of Figure 2B. To quantify the contributions of mitochondrial ETC complexes and potential NOX enzymes as well as mtROS scavenging enzymes to overall H2O2 emission and bioenergetics (ΔΨm) in different tissues, the effects of the following inhibitors were assessed in isolated heart and kidney cortex and OM mitochondria using AR and HRP assay following the timeline protocol of Figure 2C. The elements of the mtROS handling system that were perturbed are represented in Figure 1 and include CI which was inhibited using rotenone (Rot), CII which was inhibited using thenoyltrifluoroacetone (TTFA), CIII which was inhibited using antimycin A (AA), CIV which was inhibited using potassium cyanide (KCN), NOX2 which was inhibited using GSK, mitochondrial uncoupling using FCCP, the TRX scavenging system which was inhibited using auranofin (AF), and the GSH scavenging system which was inhibited using dinitrochlorobenzene (DNCB). For each of the inhibitors, three increasing concentrations were added two minutes apart to the isolated mitochondria in the presence of either PM or SUC substrate to determine changes in H2O2 emission and ΔΨm.
Comparisons of mitochondrial O2 consumption, ΔΨm, and H2O2 emission in the heart and kidney cortex and OM in the presence of PM or SUC substrate.
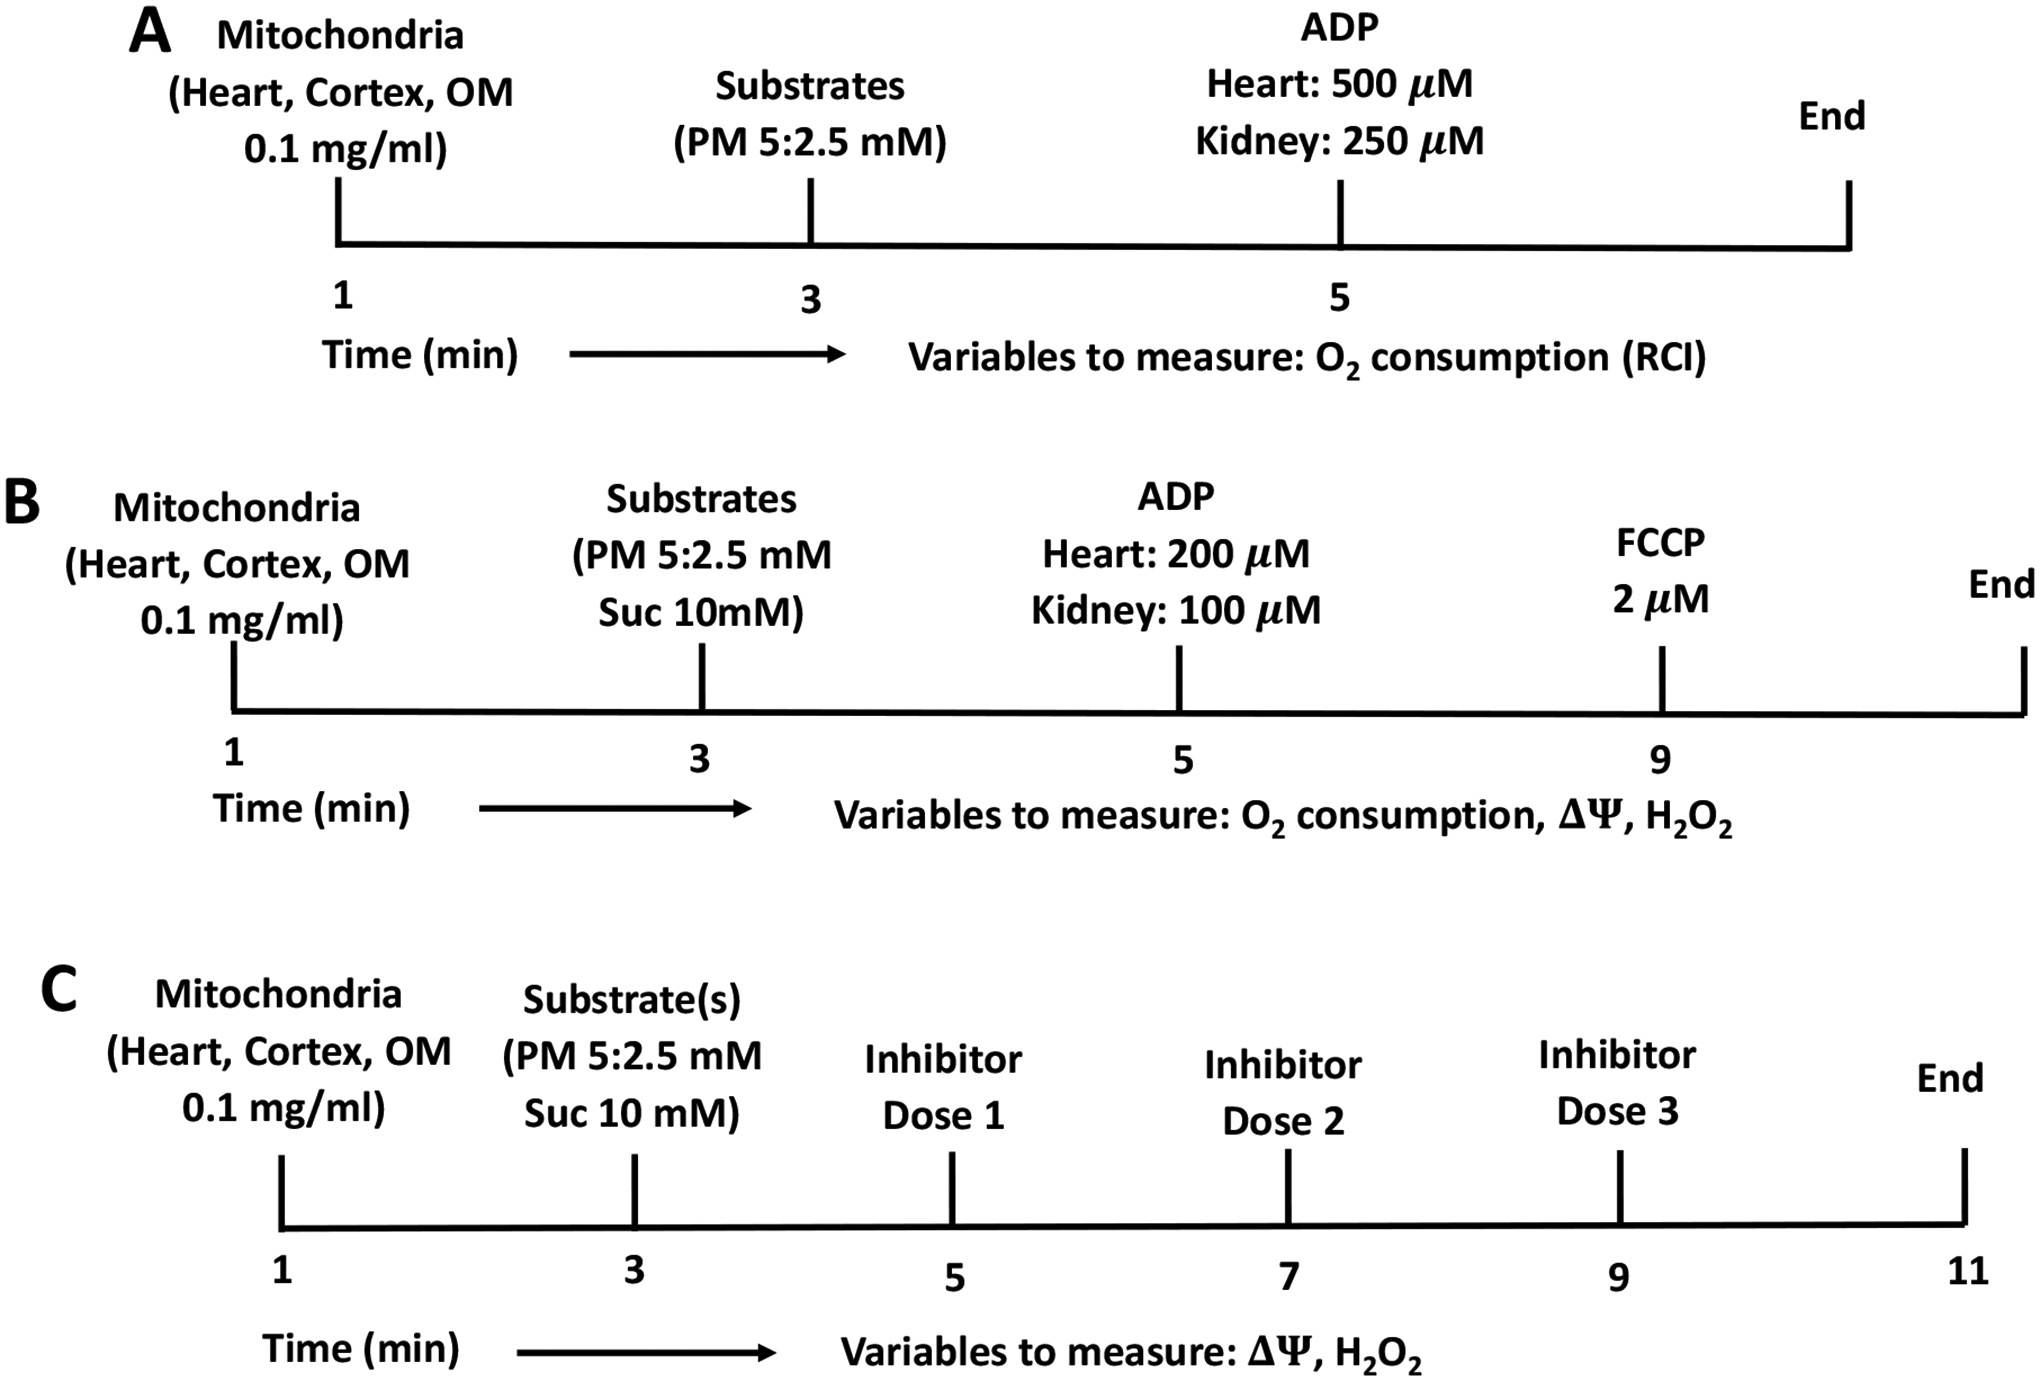
Figure 3A–O summarizes the tissue-specific O2 consumption responses of isolated mitochondria stimulated with either PM or SUC substrate followed by a single dose of ADP addition (200 μM for heart, and 100 μM for kidney cortex and OM as indicated in the experimental protocol in Figure 2B). Results show that isolated mitochondria consumed more O2 in the presence of SUC compared to PM in all three tissues (Figure 3A–C). The initial O2 concentration in the experimental chamber was about 200 μM, which decreased to 119±3.24, 170±3.57, and 179±2.08 μM in the presence of PM and 71±4.39, 136±2.86, and 153±2.30 μM in the presence of SUC in the heart, kidney cortex, and kidney OM mitochondria, respectively. The heart mitochondria exhibited a higher O2 consumption rate (OCR or JO2) than the cortex and OM mitochondria in the presence of both substrates (Figure 3D–I). Additionally, in the presence of PM, the ADP-induced state 3 duration in the OM mitochondria was longer than that in the cortex mitochondria, which was longer than that in the heart mitochondria (OM>cortex>heart). In the presence of SUC, the duration of state 3 in the heart mitochondria was longer than that in the OM mitochondria which was longer than that in the cortex mitochondria (heart>OM>cortex). For heart mitochondria, the OCRs at states 2 and 4, but not at state 3, were higher in the presence of SUC as compared to those in the presence of PM (Figure 3G, J). For kidney cortex and OM mitochondria, the data in Figure 3 (I and L, E and H) show that the OCRs at states 2, 3, and 4 were higher in the presence of SUC as compared those in the presence of PM. For all three tissues, the RCI values with sub-saturating ADP concentrations in the presence of PM were significantly higher than those in the presence of SUC (Figure 3M–O). However, the RCI values with sub-saturating ADP concentrations were similar in the heart, kidney cortex and OM mitochondria for both substrates.
Figure 3. Dynamic and static experimental data on tissue-specific and substrate-dependent measurements of mitochondrial respiration in the heart and kidney cortex and OM:
Comparison of mitochondrial O2 consumption dynamics in the presence of PM and SUC in the heart (A), kidney cortex (B), and kidney OM (C). Comparison of OCR time courses and states 1 to 5 static data in the presence of PM and SUC in the heart (G and J), kidney cortex (H and K), and kidney OM (I and L). Comparison of mitochondrial RCI in the presence of PM and SUC in the heart (M), kidney cortex (N), and kidney OM (O). These variables were collected following the experimental protocol B in Figure 2. In all measurements, concentration of PM is 5:2.5 mM, SUC is 10 mM, ADP for heart mitochondria is 200 μM, and ADP for kidney cortex and OM mitochondria is 100 μM. Data are shown as average of n = 6 biological replicates ± S.E for the heart and kidney cortex mitochondria and of n = 4 biological replicates ± S.E for the kidney OM mitochondria. To indicate the statistical difference between two sequential additions, asterisk (*) are used, with a significant level of p < 0.05.
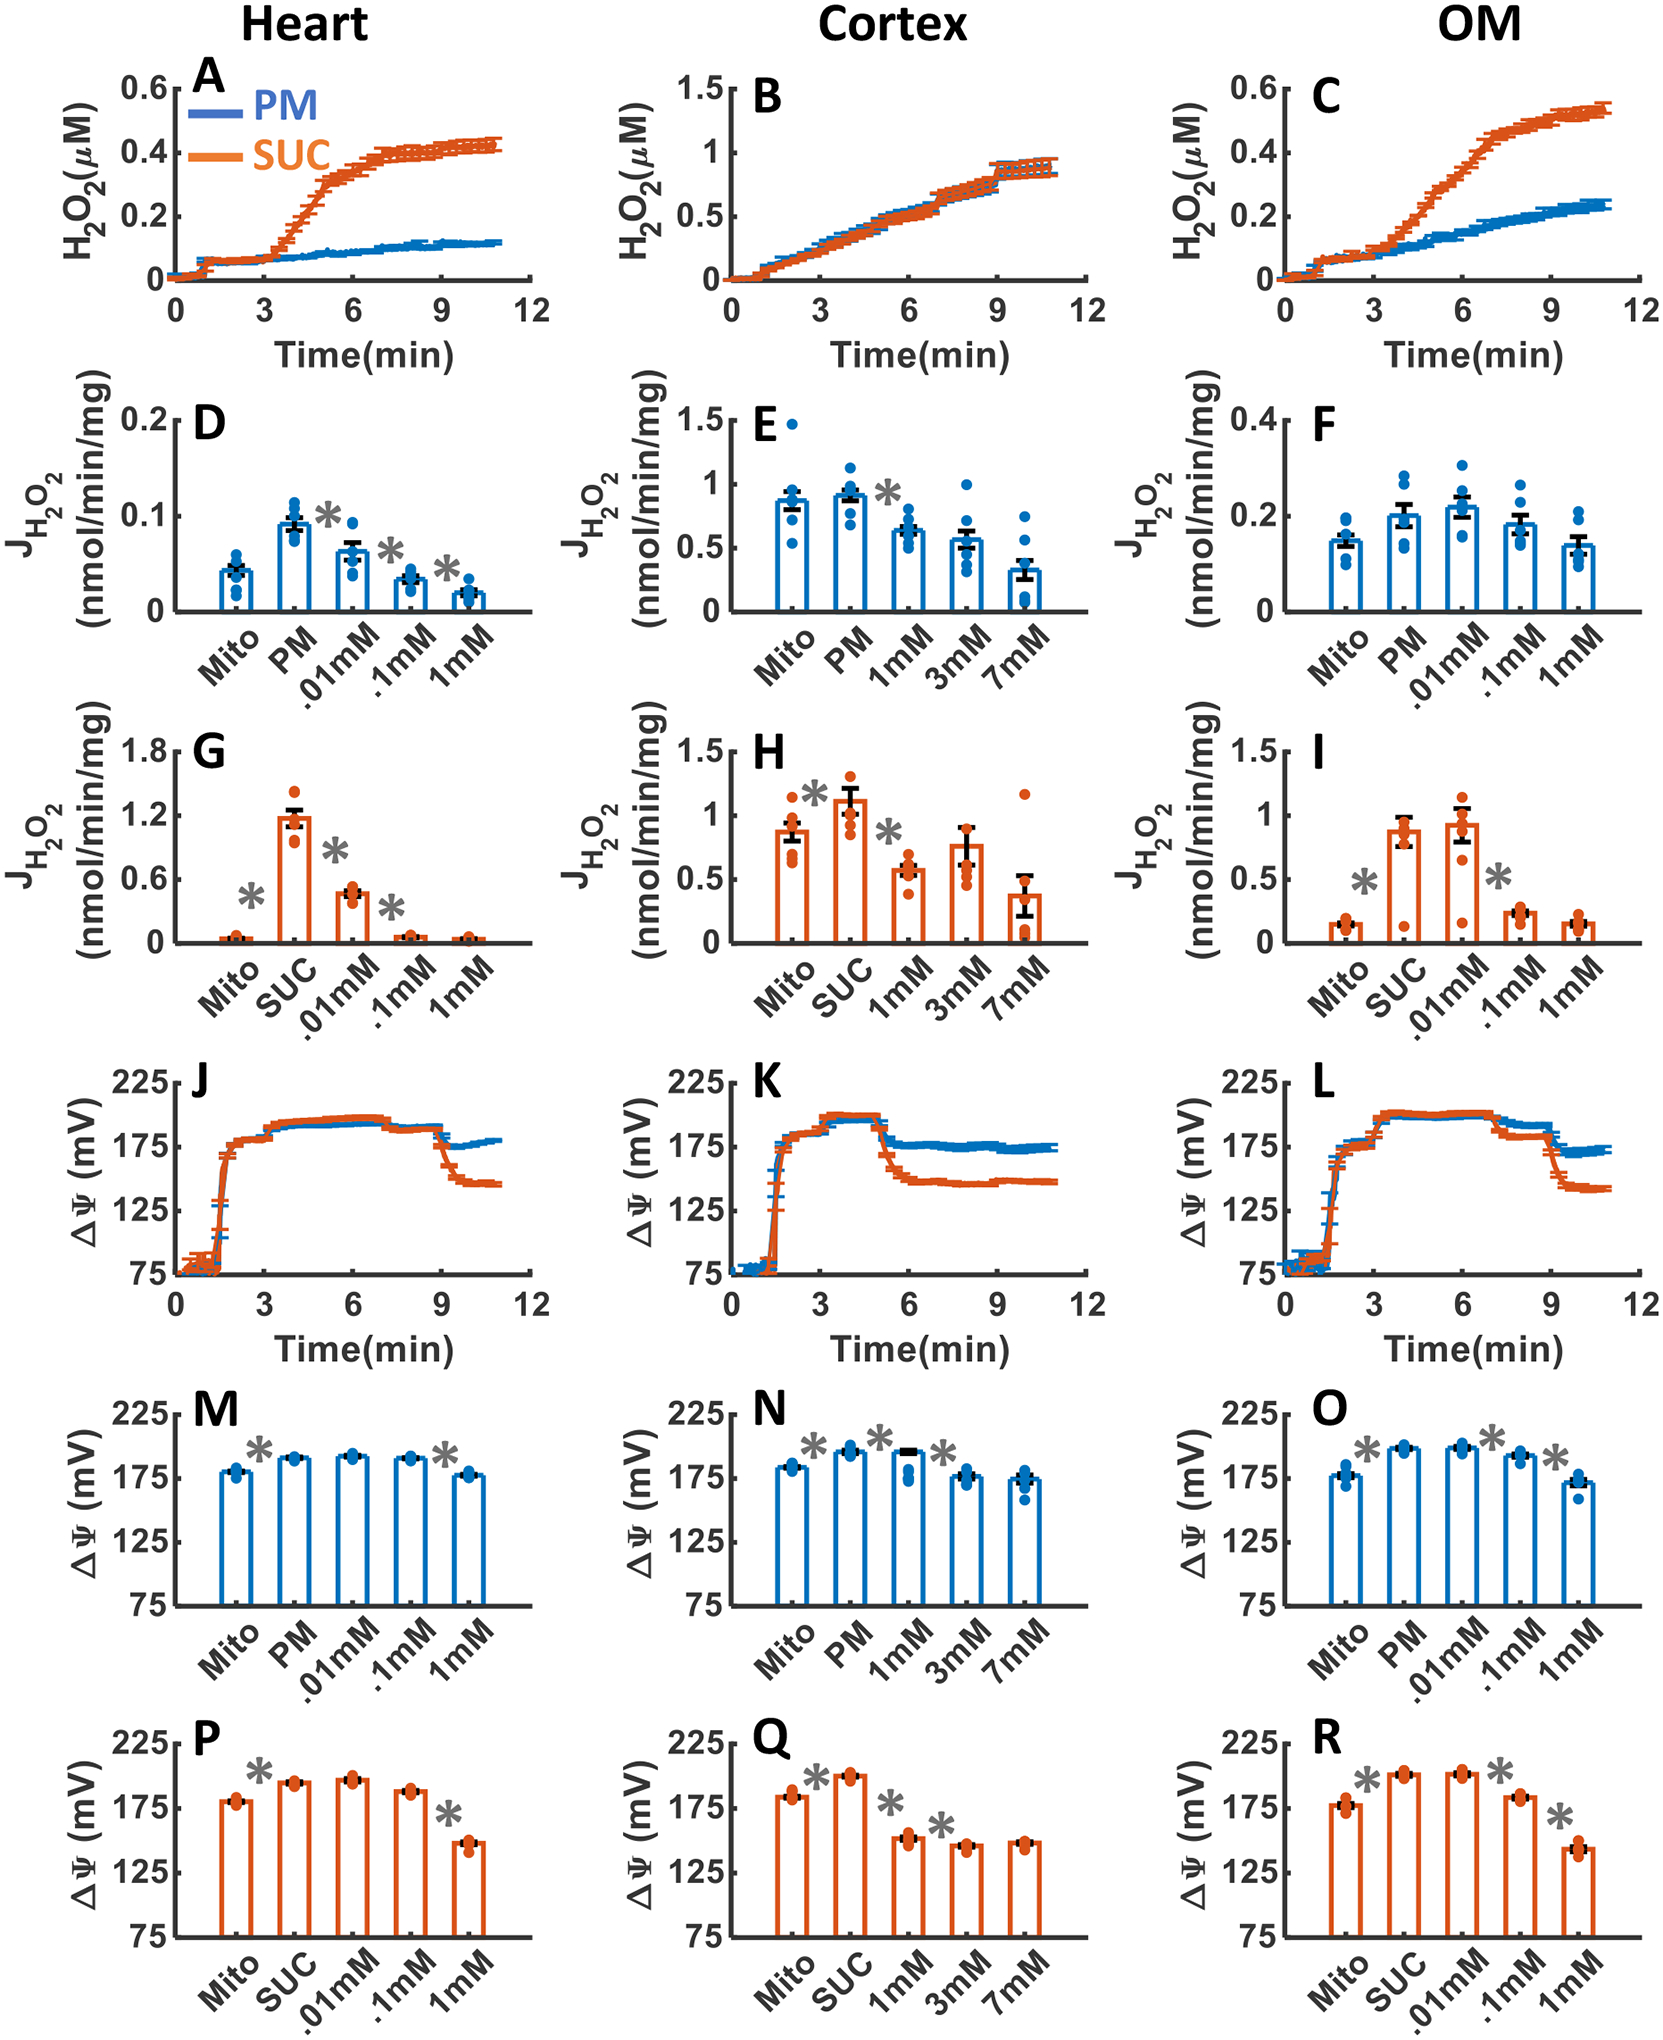
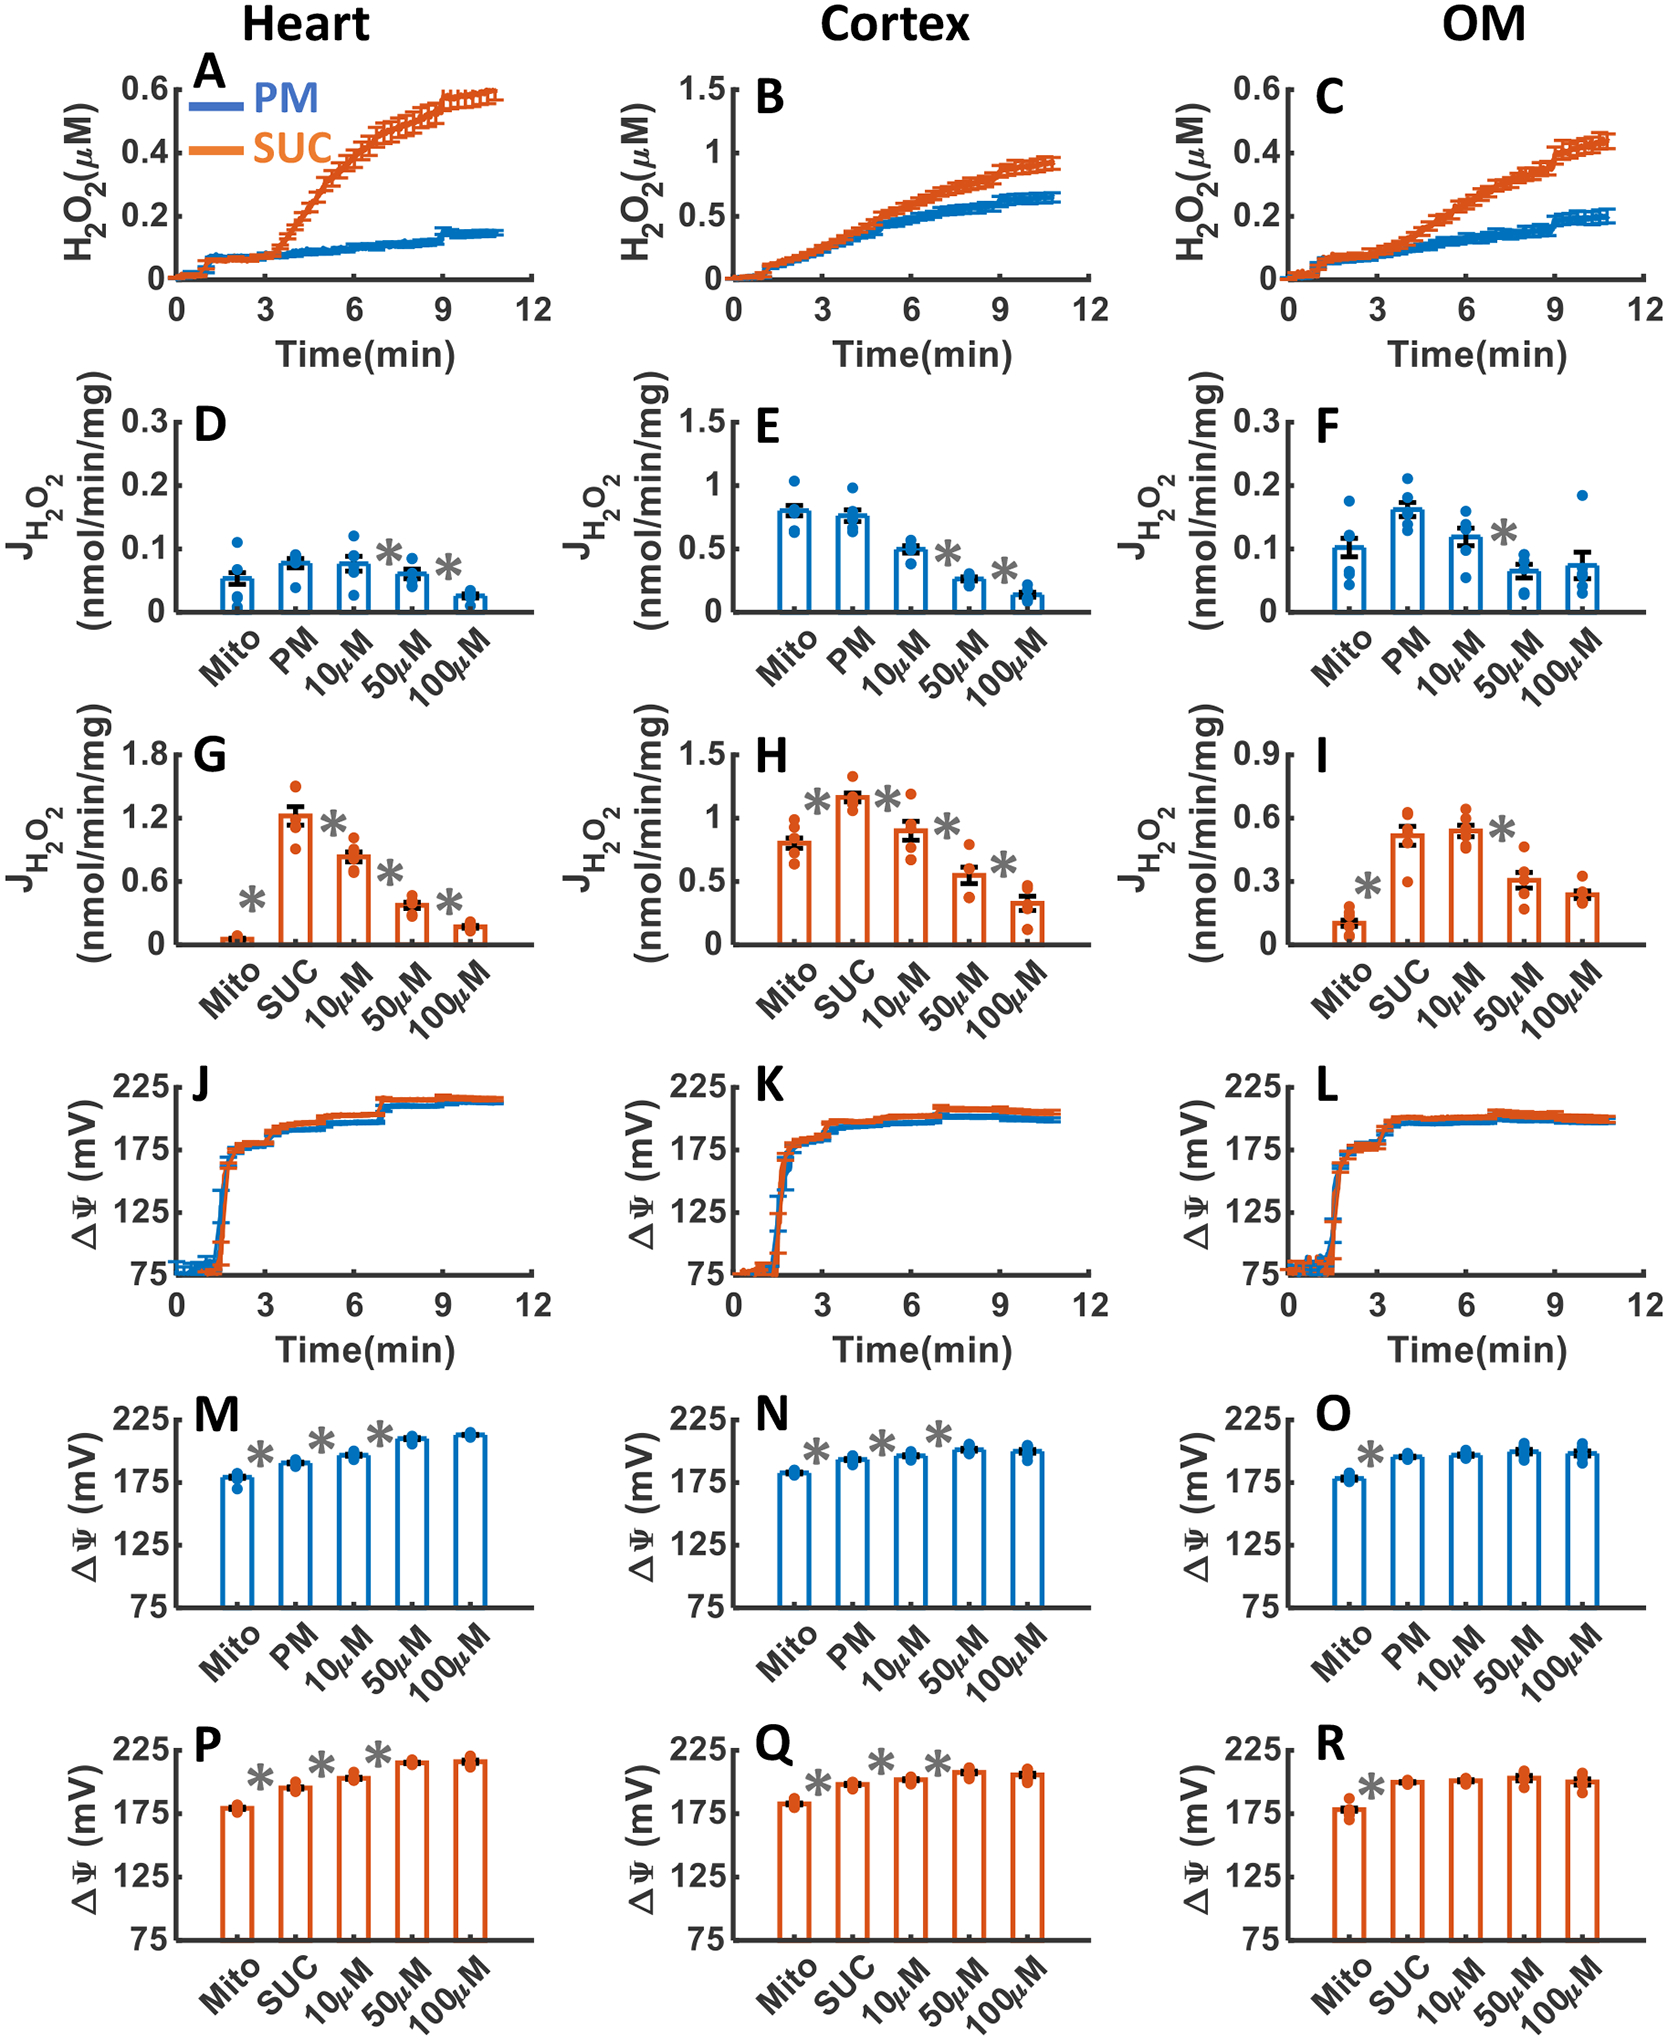
Figure 4A–R summarizes the tissue specific responses of mitochondrial H2O2 emission and ΔΨm stimulated with either PM or SUC substrate followed by the sequential addition of a single dose of ADP (200 μM for heart, and 100 μM for kidney cortex and OM) and the mitochondrial uncoupler FCCP. As shown in Figure 4A–I, H2O2 emission was greater in the presence of SUC in the heart and kidney OM mitochondria compared to PM, but not significantly different between PM and SUC in the kidney cortex mitochondria. The final concentration of H2O2 in the respiration buffer were 0.06±0.001, 0.51±0.009, and 0.15±0.006 μM in the presence of PM, and 0.21±0.003, 0.53±.016, and 0.25±0.01 μM in the presence of SUC for the heart, kidney cortex, and kidney OM mitochondria, respectively (Table 1). The rate of mitochondrial H2O2 emission did not change significantly after addition of ADP or FCCP in the three tissues in the presence of PM, as well as kidney cortex in the presence of SUC (Figure 4A–C). In contrast, in the heart and kidney OM mitochondria oxidizing SUC, the rate of H2O2 emission fell immediately after addition of ADP, then increased at state 4, and finally decreased after addition of FCCP (state 5) (Figure 4A,C). The ΔΨm in all three tissues increased after the addition of either PM or SUC then decreased (partially depolarized) after the addition of ADP with maximum depolarization occurring after the addition of FCCP (Figure 4J–R). Furthermore, the duration of ADP-induced state 3 was found to be longer in the presence of SUC in both the heart and OM mitochondria, as compared to PM, although no such distinction was observed in the cortex mitochondria. In the presence of both substrates, the duration of state 3 was higher in the OM mitochondria as compared to the heart mitochondria, which was longer as compared to that for the cortex mitochondria. These state 3 durations of ΔΨm for different substrates and different tissues were consistent with the corresponding state 3 durations of OCR in Figure 3D–F.
Figure 4. Dynamic and static experimental data on tissue-specific and substrate-dependent measurements of mitochondrial H2O2 emission and ΔΨm in the heart and kidney cortex and OM:
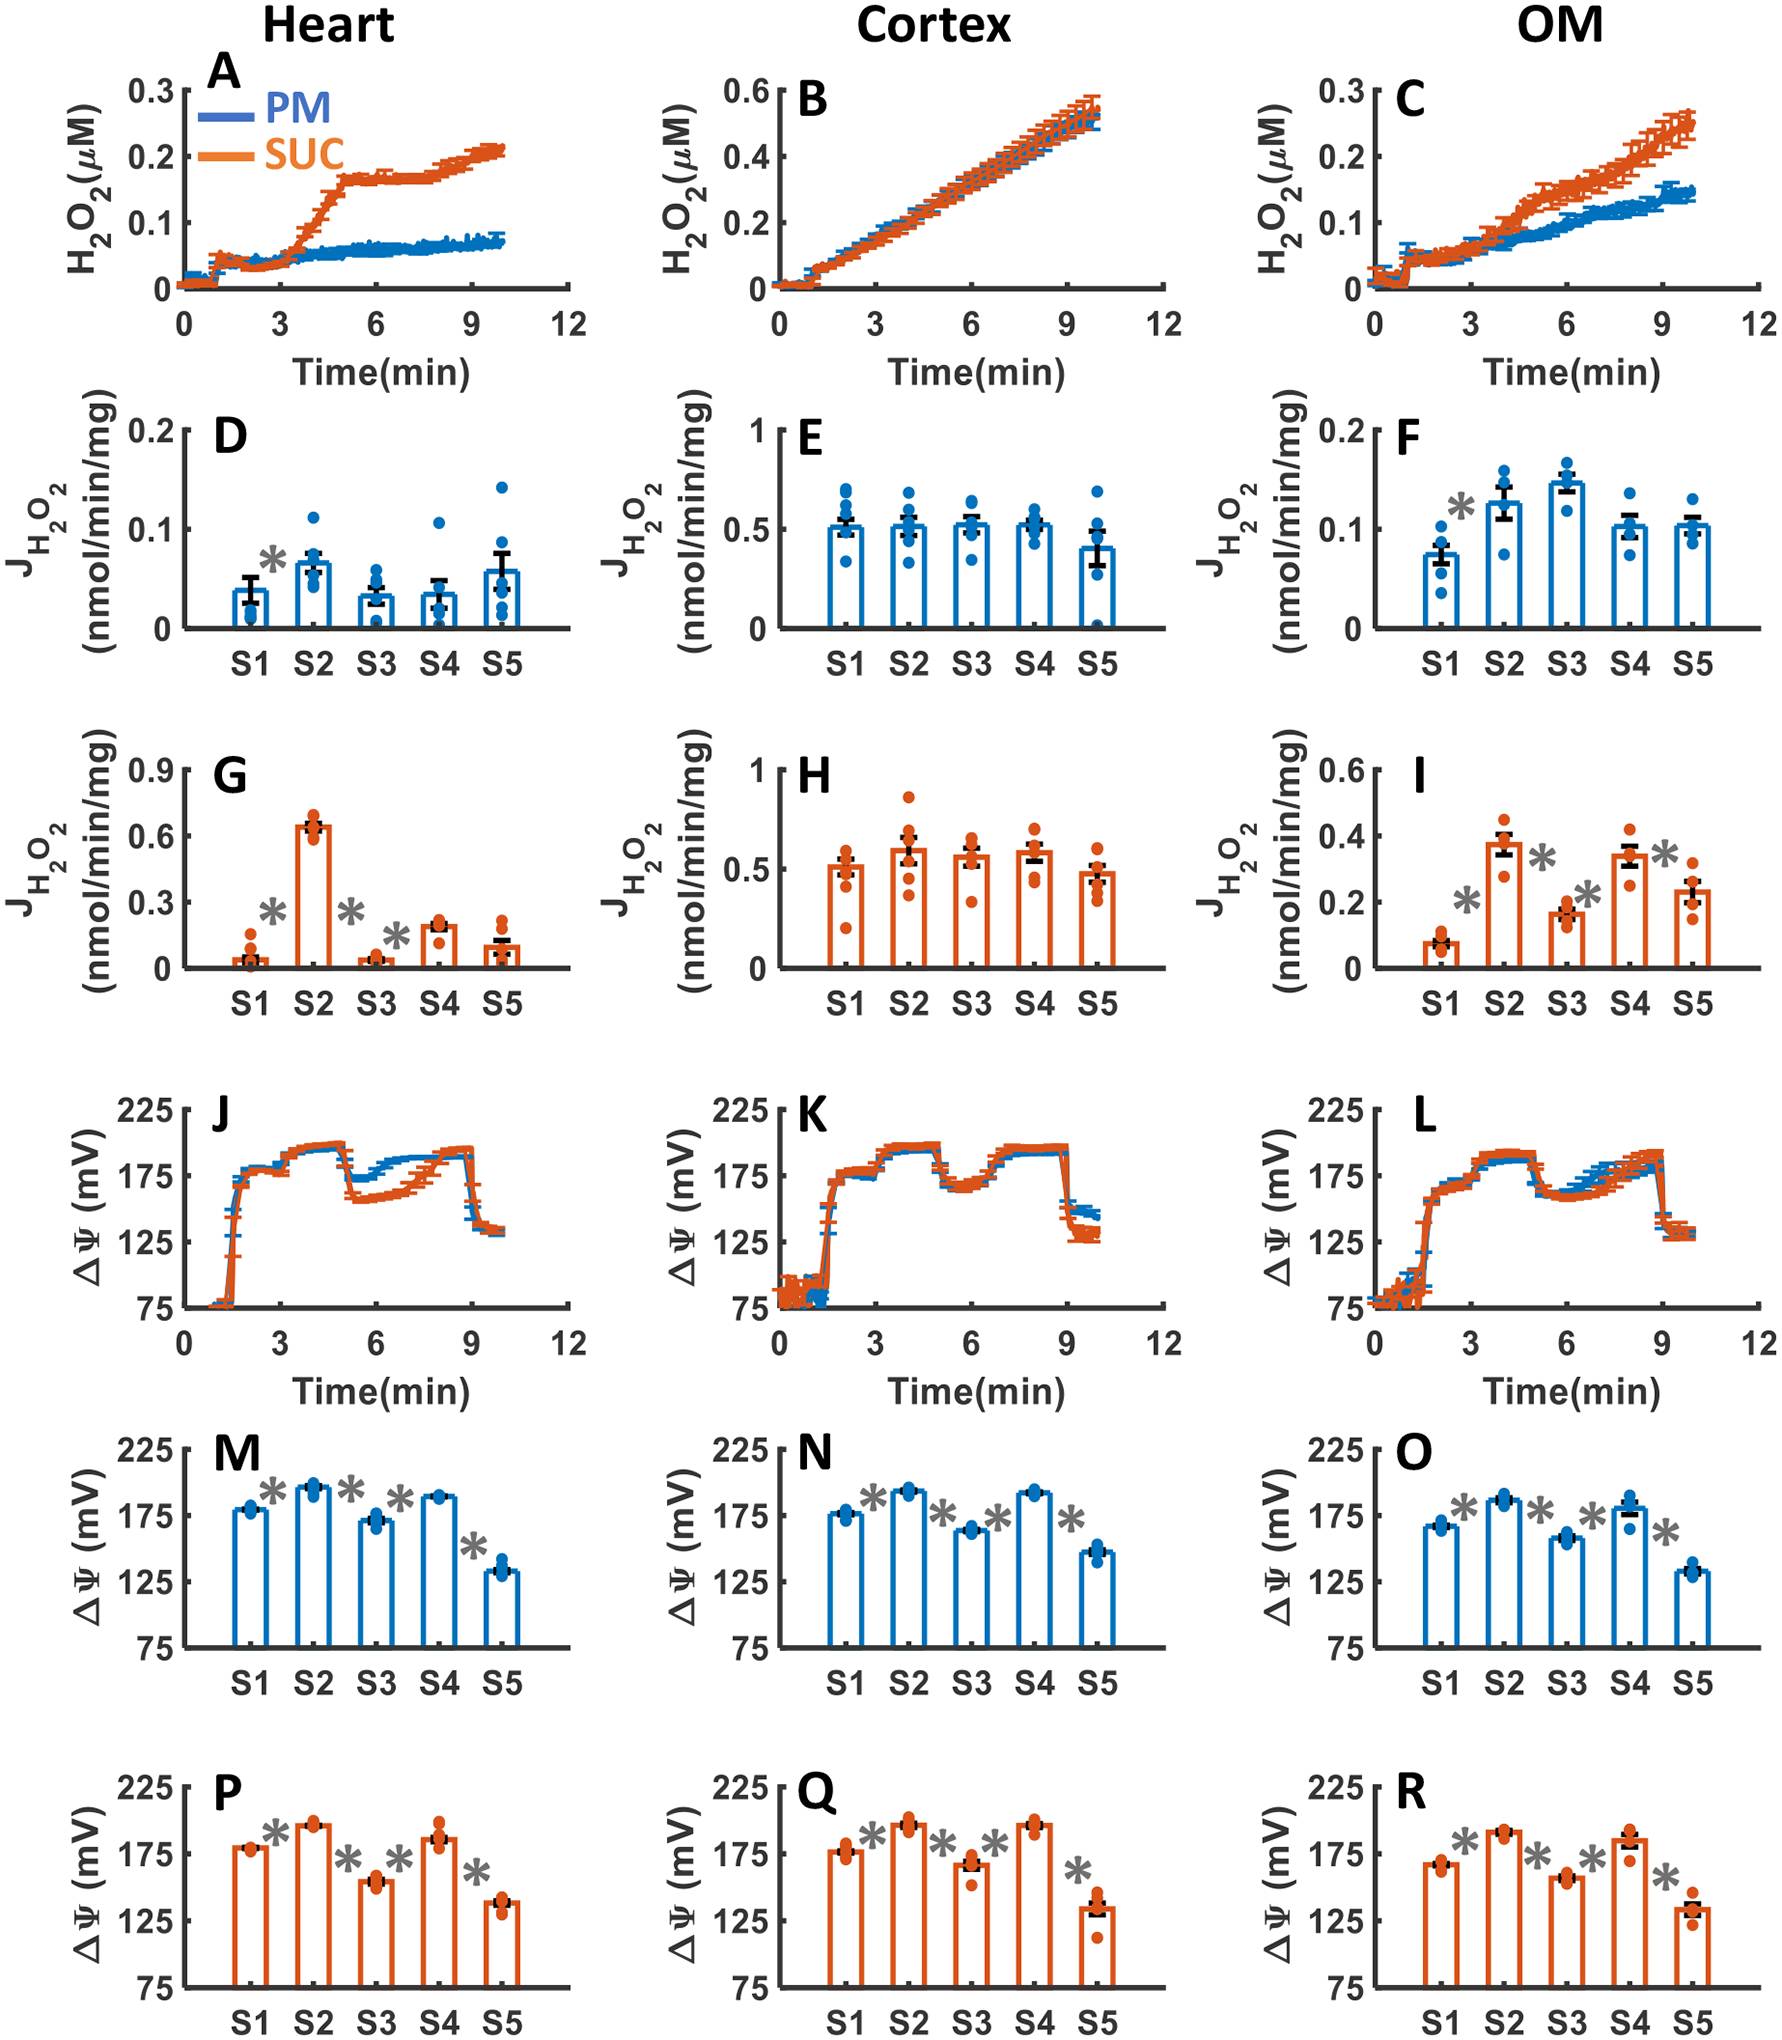
Comparison of mitochondrial H2O2 emission dynamics in the presence of PM and SUC in the heart (A), kidney cortex (B), and kidney OM (C). Comparison of the rate of H2O2 emission in the presence of PM and SUC in the heart (D and G), kidney cortex (E and H), and kidney OM (F and I). Comparison of mitochondrial ΔΨm dynamics and static data in the presence of PM and SUC in the heart (J, M and P), kidney cortex (K, N and Q), and kidney OM (L, O and R). These variables were collected following the experimental protocol B in Figure 2. In all measurements concentration of PM is 5:2.5 mM, SUC is 10 mM, ADP for heart mitochondria is 200 μM, and ADP for kidney cortex and OM mitochondria is 100 μM. Data are shown as average of n = 6 biological replicates ± S.E for the heart and kidney cortex mitochondria and of n = 4 biological replicates ± S.E for the kidney OM mitochondria. To indicate the statistical difference between two sequential additions, asterisk (*) are used, with a significant level of p < 0.05.
Table 1.
Final concentration of H2O2 (μM) in the extra-mitochondrial buffer medium upon mitochondrial H2O2 emission.
| PM | SUC | |||||
|---|---|---|---|---|---|---|
| Heart | Cortex | OM | Heart | Cortex | OM | |
| ADP | 0.06±0.001 | 0.51±0.009 | 0.15±0.006 | 0.21±0.003 | 0.53±0.016 | 0.25±0.01 |
| Ctrl | 0.095±0.004 | 0.85±0.004 | 0.242±0.013 | 0.601±0.012 | 0.95±0.01 | 0.717±0.023 |
| TTFA | 0.13±.006 | 0.86±.075 | 0.18±0.014 | 0.39±0.024 | 1.01±0.088 | 0.28±0.010 |
| KCN | 0.11±0.004 | 0.90±0.060 | 0.24±0.013 | 0.42±0.018 | 0.88±0.066 | 0.53±0.016 |
| FFCP | 0.1±.009 | 0.79±0.029 | 0.2±0.014 | 0.29±0.014 | 0.92±.036 | 0.48±0.049 |
| GSK | 0.15±0.012 | 0.65±0.038 | 0.2±0.021 | 0.61±0.037 | 0.92±0.054 | 0.44±0.023 |
| ROT | 0.43±.068 | 0.97±0.068 | 0.31±0.048 | 0.47±0.23 | 1.05±.058 | 0.33±.047 |
| AA | 0.69±0.075 | 1.31±0.077 | 0.24±0.008 | 0.92±.0.079 | 1.37±0.089 | 0.32±0.001 |
| AF | 0.27±0.01 | 1±0.05 | 0.23±0.008 | 1.87±0.01 | 1.55±0.099 | 0.9±0.058 |
| DNCB | 0.94±0.07 | 1.77±0.113 | 0.38±0.069 | 2±0.126 | 2.03±0.115 | 1.39±0.426 |
Tissue-specific and substrate-dependent effects of CI inhibition by ROT on mitochondrial H2O2 emission and ΔΨm.
The effects of CI inhibition with addition of three increased concentrations of ROT upon H2O2 emission and ΔΨm in the heart and kidney cortex and OM mitochondria respiring under either PM or SUC substrate are summarized in Figure 5A–R. As depicted in Figure 5A–C, the inhibition of CI by ROT resulted in final concentrations of H2O2 in the respiration buffer of 0.43±0.068, 0.97±0.068, and 0.310±0.048 μM in the presence of PM and 0.46±0.23, 1.0±0.058, and 0.33±0.047 μM in the presence of SUC for the heart, kidney cortex, and kidney OM mitochondria, respectively (Table 1). Notably, the rate of H2O2 emission significantly increased in the heart mitochondria after addition of ROT in the presence of PM, but significantly decreased in the presence of SUC (Figure 5D,G). The H2O2 emission was saturated after addition of 1.1μM ROT for both substrates (Figure 5D,G). In the kidney cortex mitochondria, the rate of H2O2 emission after addition of ROT did not change significantly in the presence of PM but decreased significantly and was saturated at 0.1 μM ROT in the presence of SUC (Figure 5E,H). In the kidney OM mitochondria, the rate of H2O2 emission after addition of ROT increased in the presence of PM, decreased in the presence of SUC, and reached saturation at 1.1 μM ROT for both substrates (Figure 5F,I), similar to the heart mitochondria.
Figure 5. Dynamic and static experimental data on tissue-specific and substrate-dependent measurements of mitochondrial H2O2 emission and ΔΨm in the heart and kidney cortex and OM in the presence of CI inhibitor ROT.
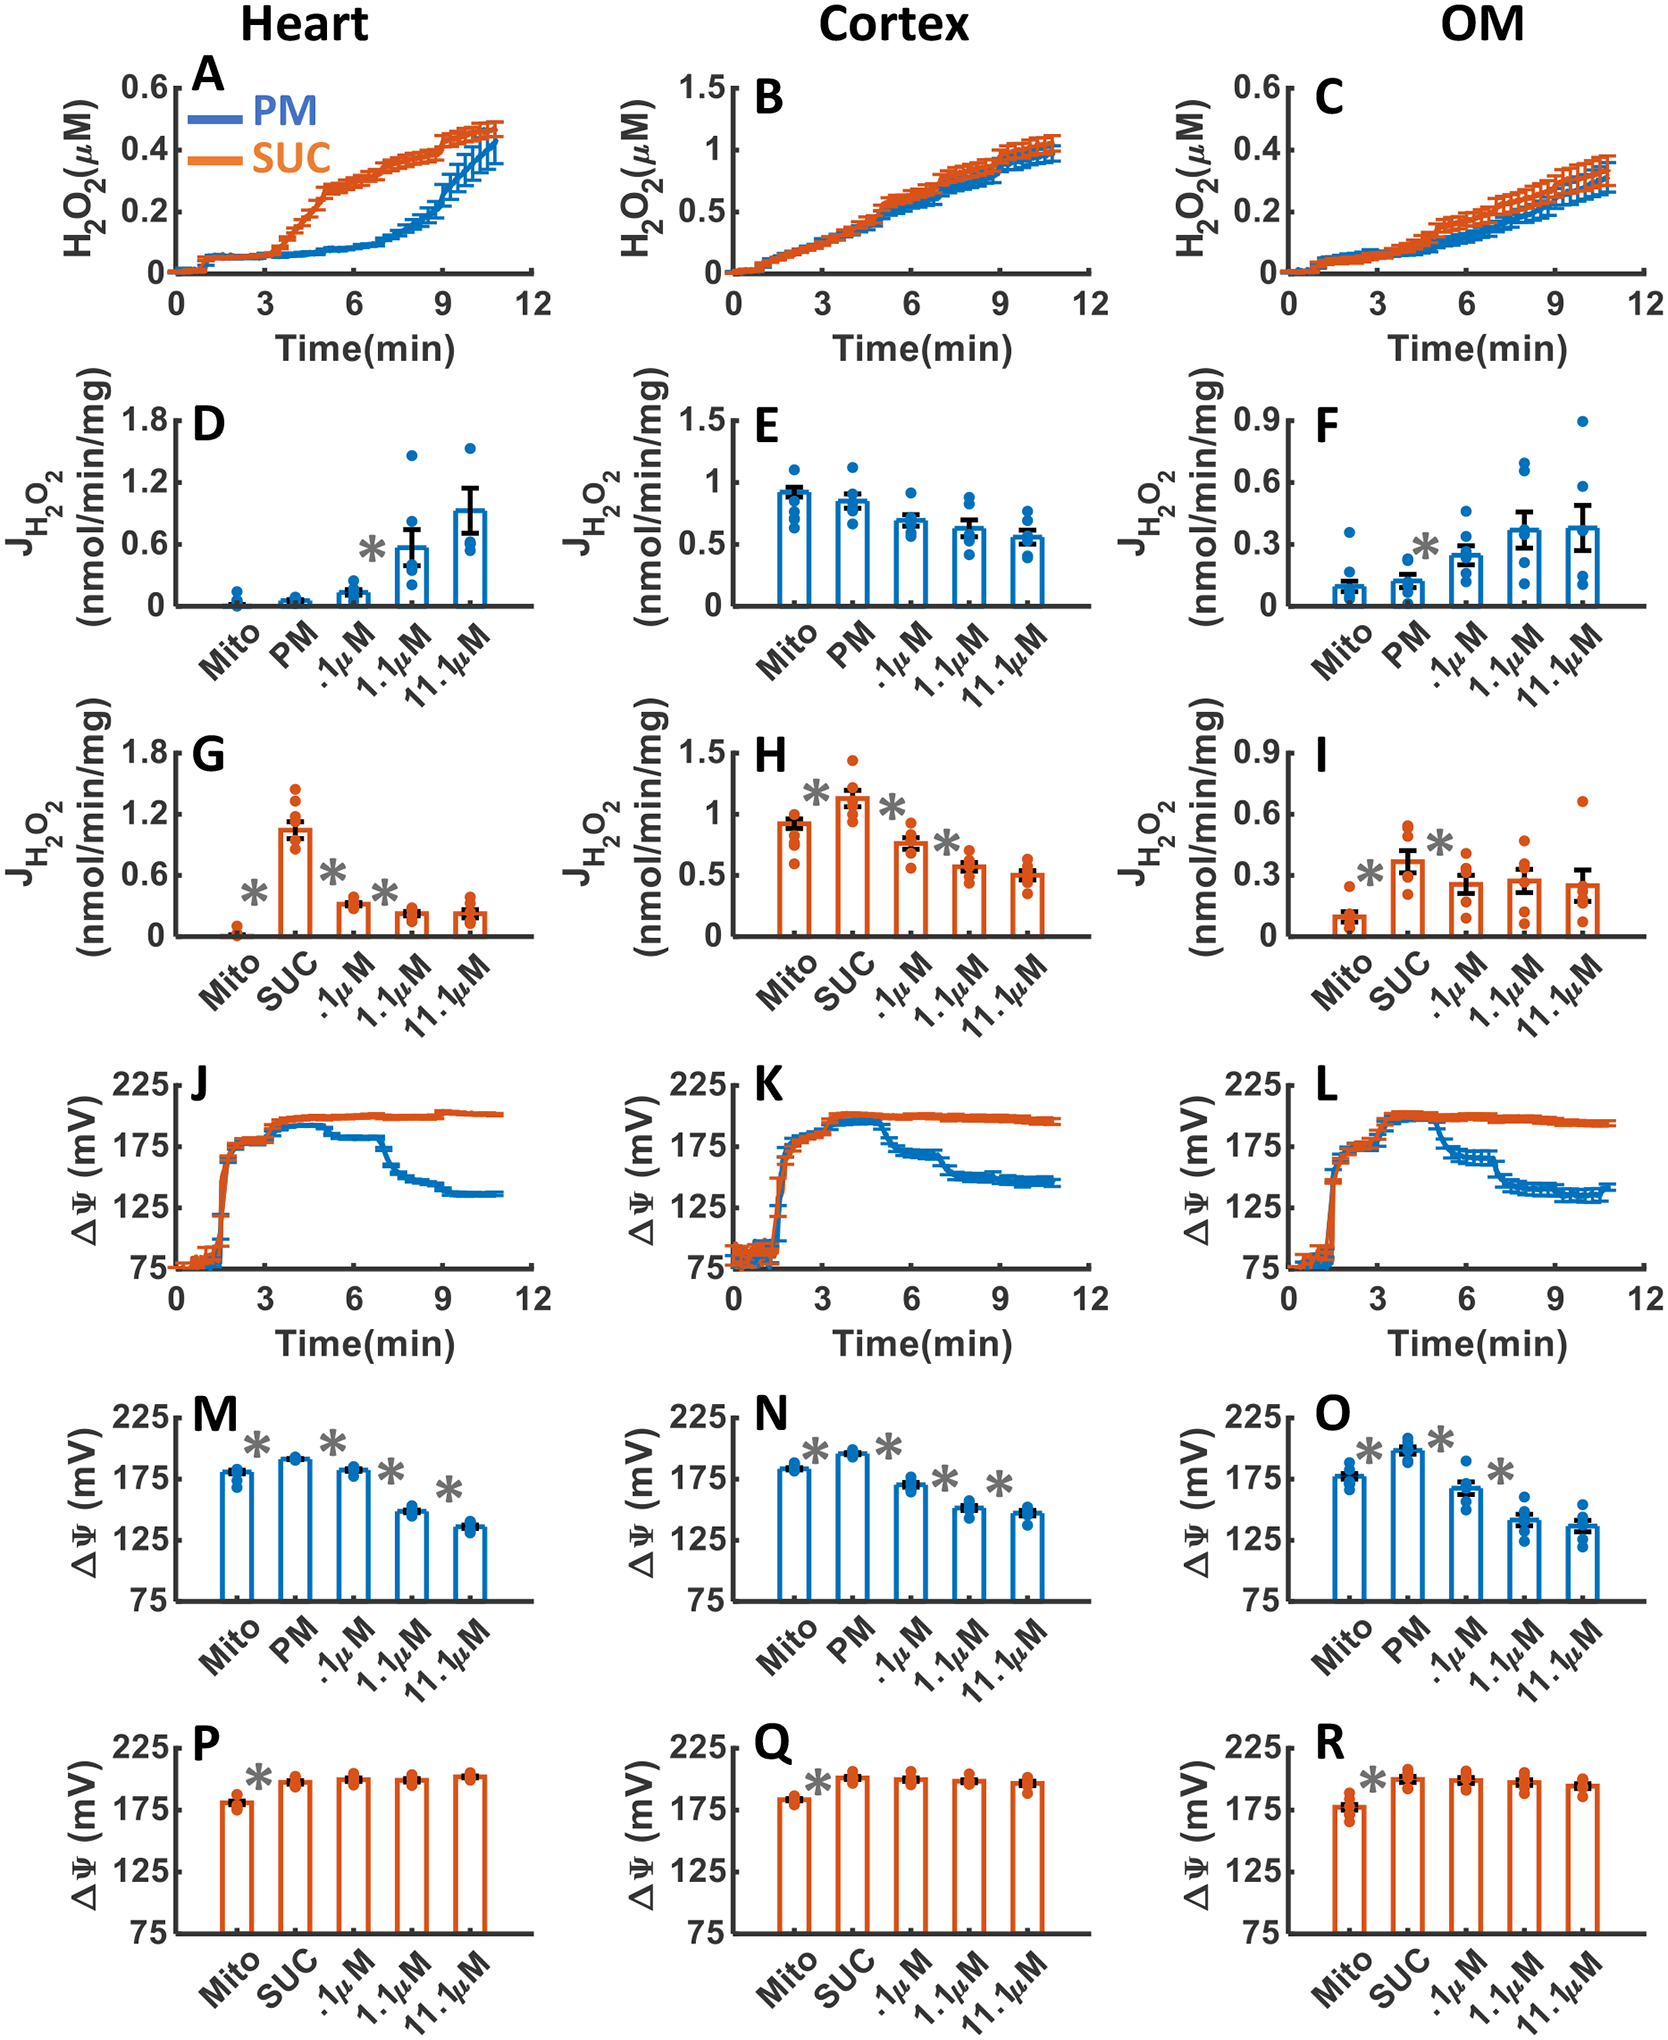
Comparison of mitochondrial H2O2 emission dynamics in the presence of PM and SUC, and 3 doses of ROT in the heart (A), kidney cortex (B), and kidney OM (C). Comparison of rate of mitochondrial H2O2 emission static data in the presence of PM and SUC, and 3 doses of ROT in the heart (D and G), kidney cortex (E and H), and kidney OM (F and I). Comparison of mitochondrial ΔΨm dynamic data in the presence of PM and SUC, and 3 doses of ROT in the heart (J), kidney cortex (K), and kidney OM (L). Comparison of mitochondrial ΔΨm static data in the presence of PM and SUC, and 3 doses of ROT in the heart (M and P), kidney cortex (N and Q), and kidney OM (O and R). This data was collected following the experimental protocol in Figure 2C. In all measurements concentration of PM is 5:2.5 mM and SUC is 10 mM. Increasing concentrations of ROT (0.1, 1, and 10 μM) were added every 2 minutes after the substrate addition at state 2. Data are shown as the average of n = 6 biological replicates ± S.E. To indicate the statistical difference between two sequential additions, asterisk (*) are used, with a significant level of p < 0.05.
As depicted in Figure 5J–R, the heart and kidney cortex and OM mitochondria respiring with PM (Figure 5M–O) exhibited significant depolarization of ΔΨm in response to ROT reaching saturation at 1.1 μM ROT. ROT had no significant effect on ΔΨm in the presence of SUC in the mitochondria from all three tissues (Figure 5P–R). Thus, the ΔΨm dynamics in response to ROT were similar for all three tissues in the presence of either PM or SUC (Figure 5J–R).
Tissue-specific and substrate-dependent effects of CII inhibition by TTFA on mitochondrial H2O2 emission and ΔΨm.
The effects of CII inhibition with the addition of three increasing concentrations of TTFA upon H2O2 emission and ΔΨm in the heart and kidney cortex and OM mitochondria in the presence of either PM or SUC substrate are summarized in Figure 6A–R. As depicted in Figure 6AC, inhibition of CII by TTFA resulted in final concentrations of H2O2 in the respiration medium of 0.13±0.006, 0.86±0.075, and 0.18±0.014 μM in the presence of PM, and 0.39±0.024, 1.01±0.088, and 0.28±0.010 μM in the presence of SUC in the heart, kidney cortex, and kidney OM mitochondria, respectively (Table 1). The rate of mitochondrial H2O2 emission in the presence of PM decreased significantly in response to TTFA addition in all tissues and reached saturation at 100 μM in the heart and 50 μM TTFA in the kidney cortex and OM (Figure 6D–F). The rate of mitochondrial H2O2 emission in the presence of SUC decreased significantly in response to TTFA addition in all tissues and reached saturation at 10 μM TTFA in the heart and 50 μM TTFA in the kidney cortex and OM (Figure 5G–I).
Figure 6. Dynamic and static experimental data on tissue-specific and substrate-specific measurements of mitochondrial H2O2 emission and ΔΨm in the heart and kidney cortex and OM in the presence of CII inhibitor TTFA:
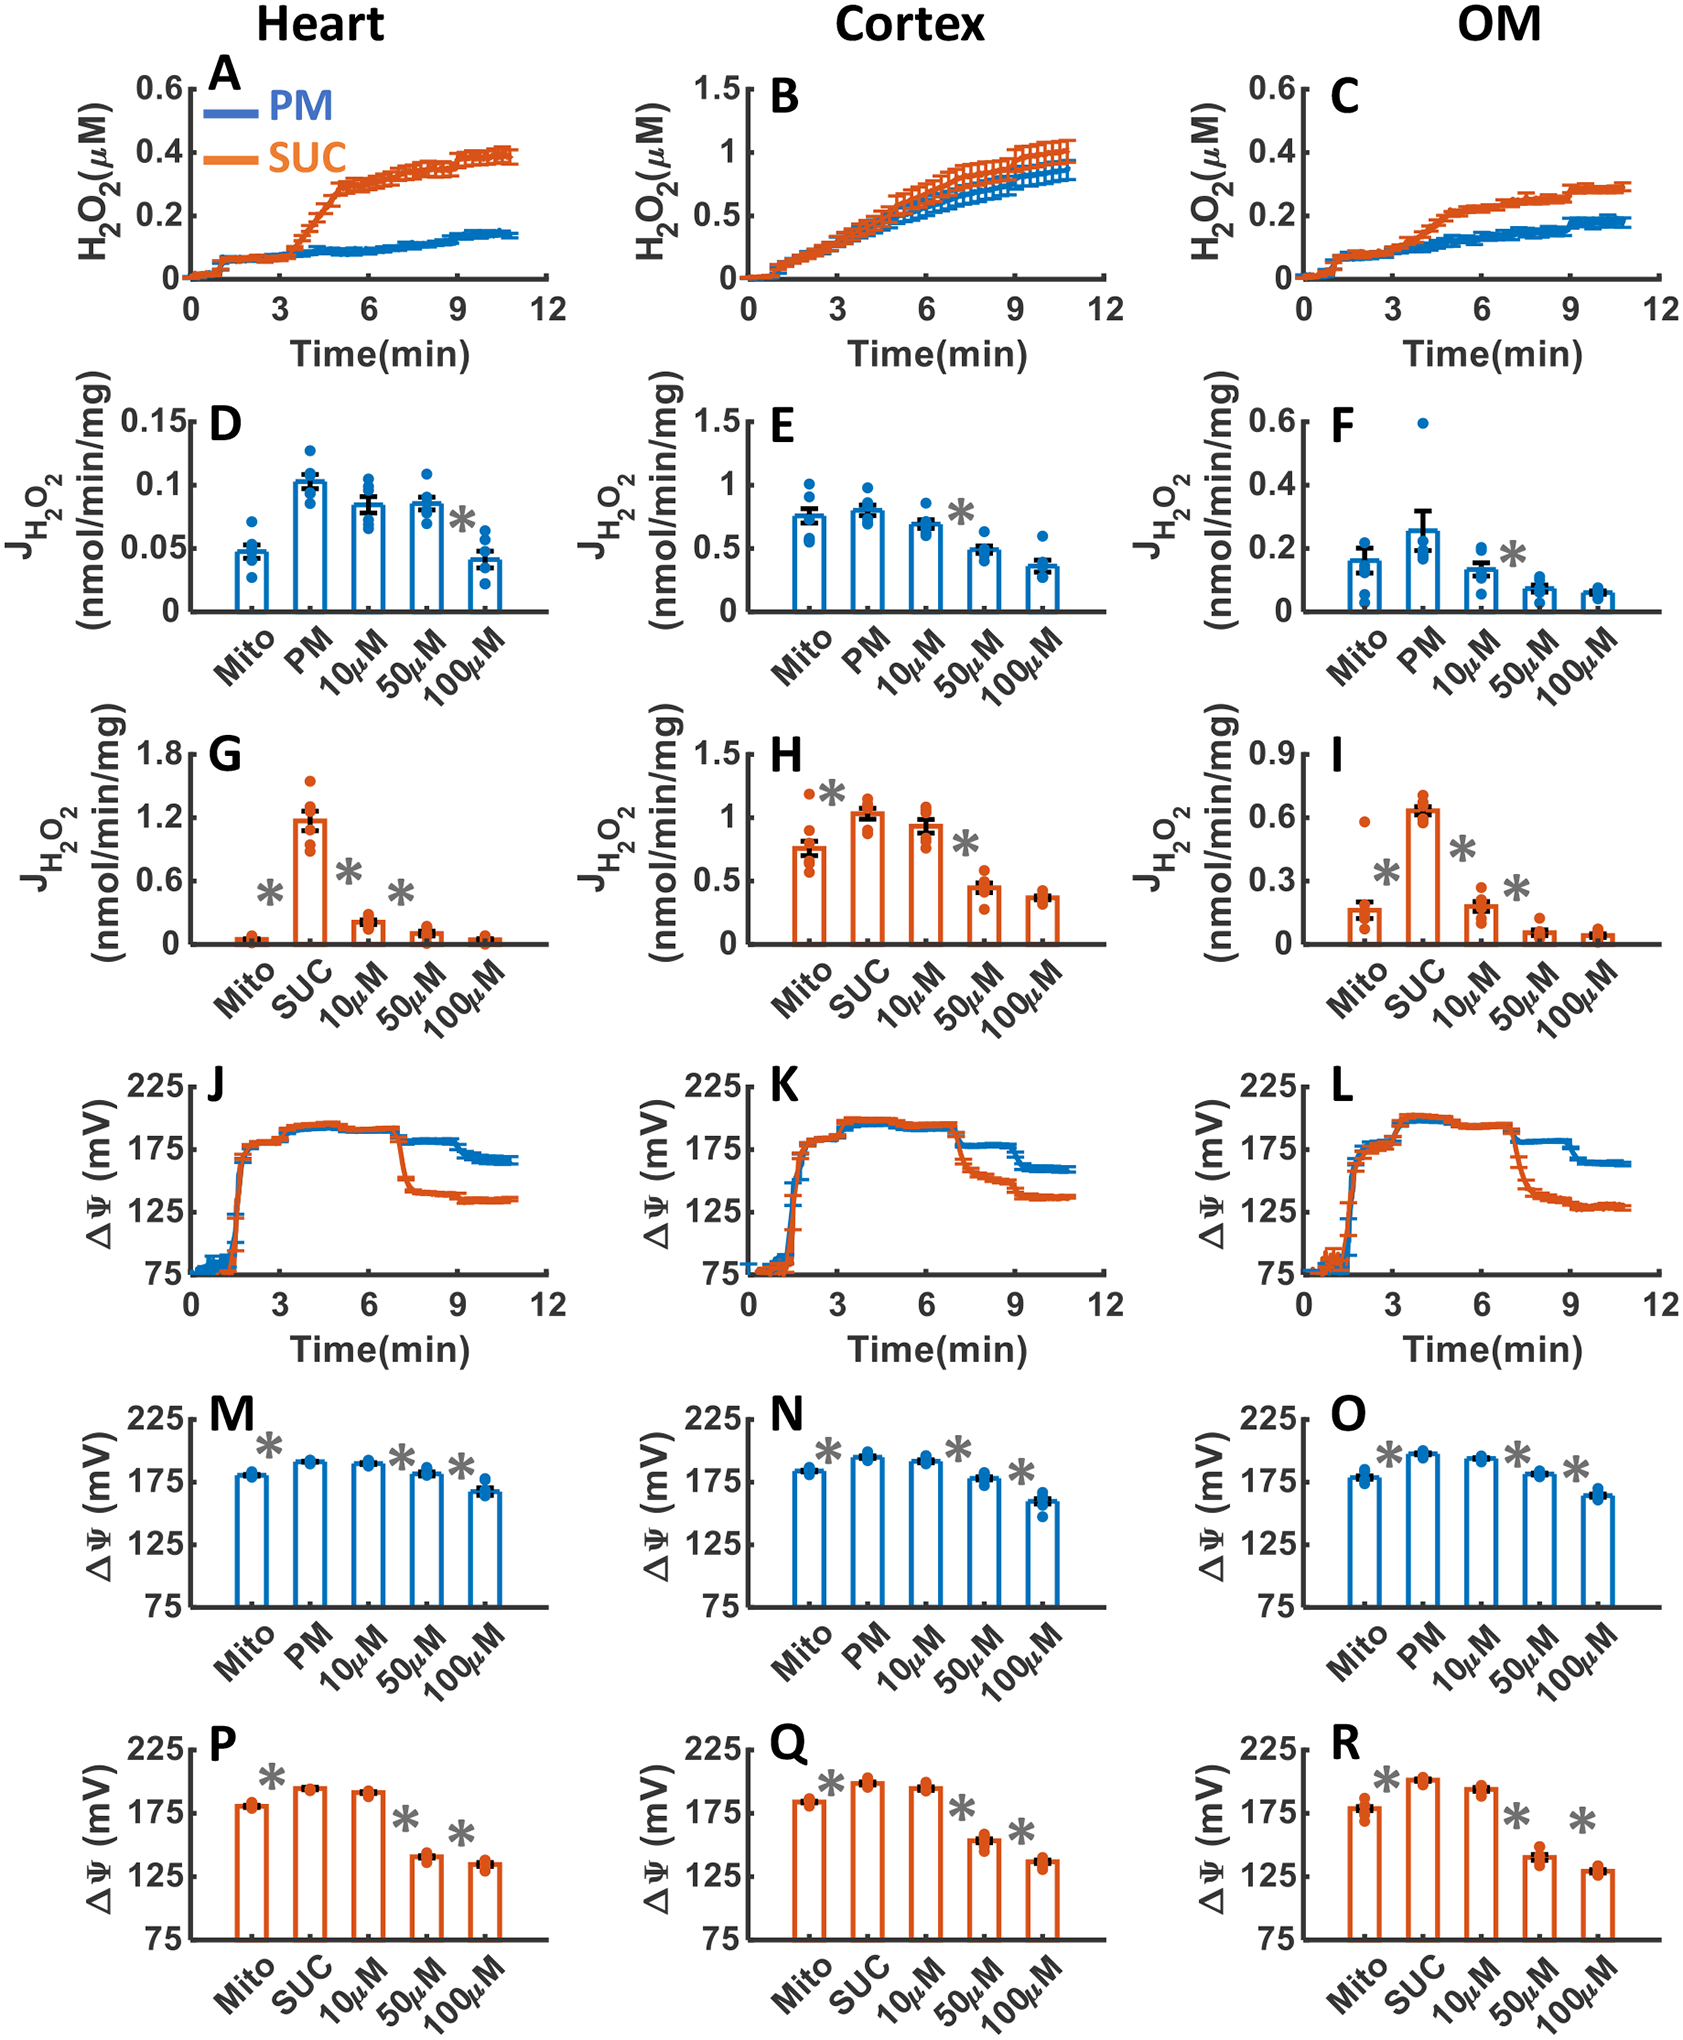
Comparison of mitochondrial H2O2 emission dynamics in the presence of PM and SUC, and 3 doses of TTFA in the heart (A), kidney cortex (B), and kidney OM (C). Comparison of rate of mitochondrial H2O2 emission static data in the presence of PM and SUC, and 3 doses of TTFA in the heart (D and G), kidney cortex (E and H), and kidney OM (F and I). Comparison of mitochondrial ΔΨm dynamic data in the presence of PM and SUC, and 3 doses of TTFA in the heart (J), kidney cortex (K), and kidney OM (L). Comparison of mitochondrial ΔΨm static data in the presence of PM and SUC, and 3 doses of TTFA in the heart (M and P), kidney cortex (N and Q), and kidney OM (O and R). This data was collected following the experimental protocol in Figure 2C. In all measurements concentration of PM is 5:2.5 mM and SUC is 10 mM. Increasing concentrations of TTFA (10, 40, and 50 μM) were added every 2 minutes after the substrate addition at state 2. Data are shown as the average of n = 6 biological replicates ± S.E. To indicate the statistical difference between two sequential additions, asterisk (*) are used, with a significant level of p < 0.05.
As shown in Figure 6J–R, ΔΨm in the heart and kidney cortex and OM mitochondria was significantly depolarized in response to TTFA addition reaching saturation at 50 μM TTFA for both PM and SUC substrates. As shown in Figure 6P–R, the addition of TTFA to the heart, kidney cortex and OM mitochondria resulted in more depolarization of ΔΨm in the presence of SUC compared to that in the presence of PM.
Tissue-specific and substrate-dependent effects of CIII inhibition by AA on mitochondrial H2O2 emission and ΔΨm.
The effects of CIII inhibition with addition of three increasing concentrations of AA upon H2O2 emission and ΔΨm in the heart and kidney cortex and OM mitochondria respiring under either PM or SUC substrate are summarized in Figure 7A–R. As shown in Figure 7A–C, CIII inhibition by AA resulted in final concentrations of H2O2 in the respiration buffer of 0. 69±0.075, 1.31±0.077, and 0.24±0.008 μM in the presence of PM and 0.92±.0.079, 1.37±0.089, and 0.32±0.001 μM in the presence of SUC in the heart, kidney cortex, and kidney OM mitochondria, respectively (Table 1). Notably, the rate of H2O2 emission was significantly increased in the heart and kidney OM mitochondria after addition of AA in the presence of PM, but it was not significantly altered in the presence of SUC (Figure 7D, G, F and I). The increase in the rate of mitochondrial H2O2 emission was saturated after addition of 1.1 μM AA in the presence of PM. Interestingly, in the kidney cortex mitochondria oxidizing either PM or SUC, the rate of H2O2 emission in response to AA addition was not significantly altered (Figure 7E,H). Altogether, the rate of H2O2 emission did not change significantly in the presence of SUC in any of the tissues but significantly increased in the heart and kidney OM mitochondria utilizing PM (Figure 7D–I).
Figure 7. Dynamic and static experimental data on tissue-specific and substrate-specific measurements of mitochondrial H2O2 emission and ΔΨm in the heart and kidney cortex and OM in the presence of CIII inhibitor AA:
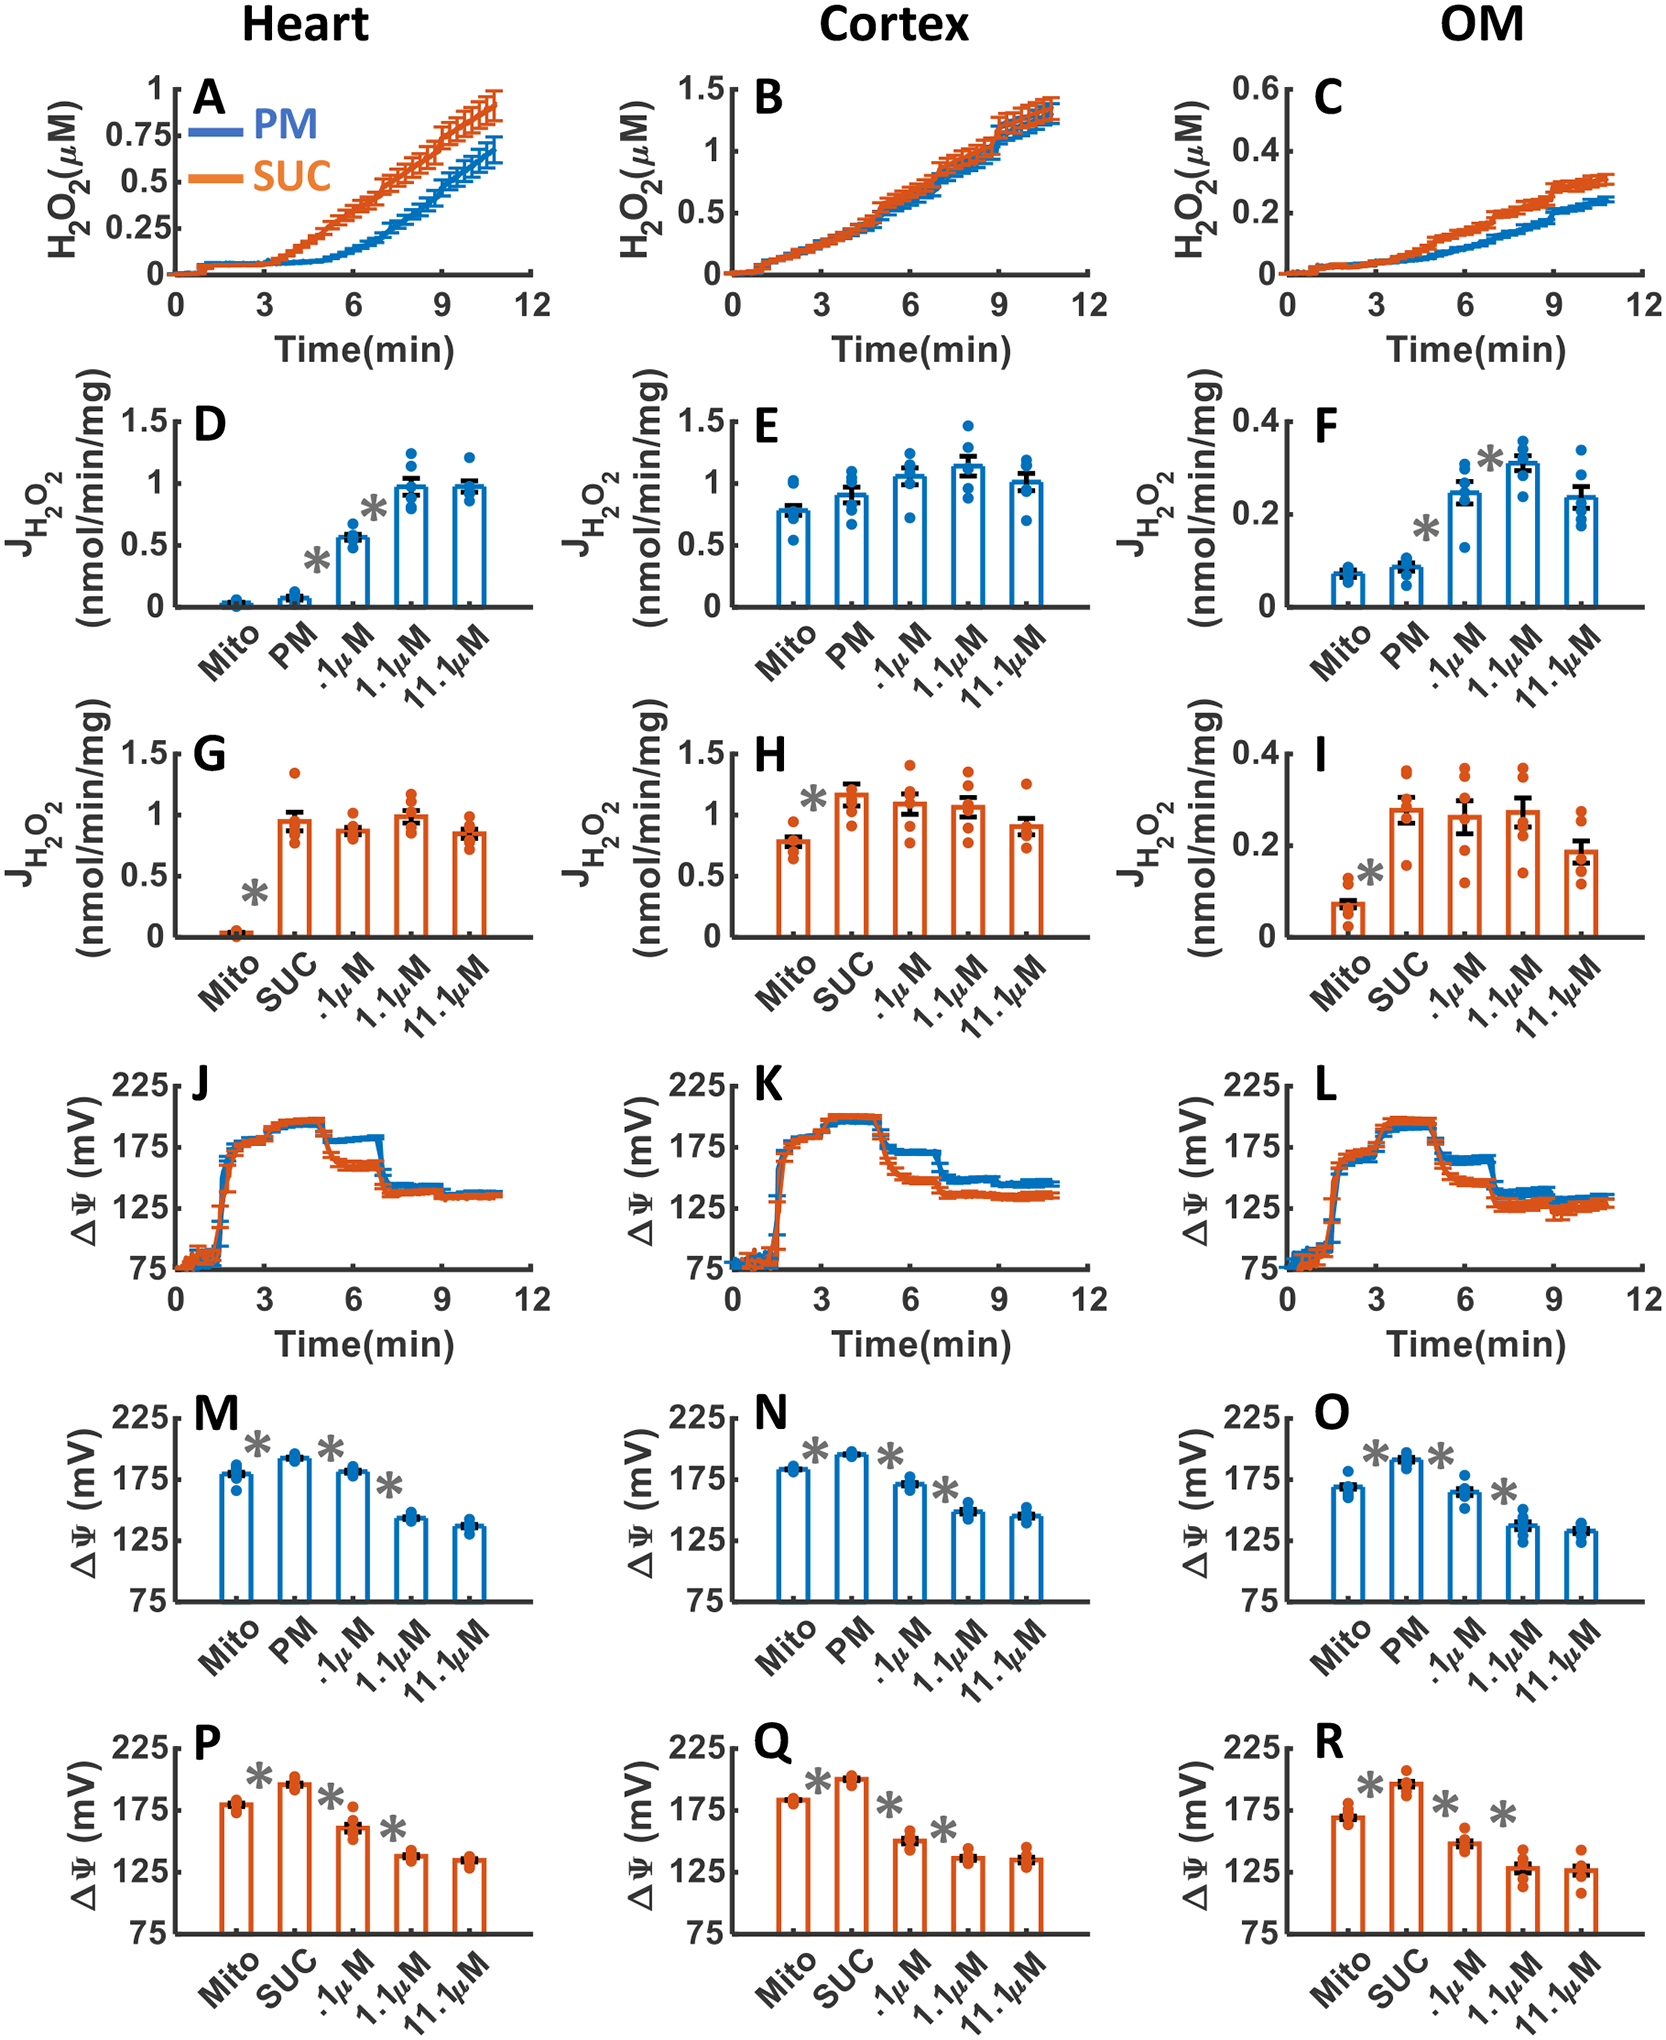
Comparison of mitochondrial H2O2 emission dynamics in the presence of PM and SUC, and 3 doses of AA in the heart (A), kidney cortex (B), and kidney OM (C). Comparison of the rate of mitochondrial H2O2 emission static data in the presence of PM and SUC, and 3 doses of AA in the heart (D and G), kidney cortex (E and H), and kidney OM (F and I). Comparison of mitochondrial ΔΨm dynamic data in the presence of PM and SUC, and 3 doses of AA in the heart (J), kidney cortex (K), and kidney OM (L). Comparison of mitochondrial ΔΨm static data in the presence of PM and SUC, and 3 doses of AA in the heart (M and P), kidney cortex (N and Q), and kidney OM (O and R). This data was collected following the experimental protocol in Figure 2C. In all measurements, concentration of PM is 5:2.5 mM and SUC is 10 mM. Increasing concentrations of AA (0.1, 1, and 10 μM) were added every 2 minutes after the substrate addition at state 2. Data are shown as the average of n = 6 biological replicates ± S.E. To indicate the statistical difference between two sequential additions, asterisk (*) are used, with a significant level of p < 0.05.
As depicted in Figure 7J–R, the dynamics of ΔΨm in response to AA addition were similar in all three tissues in the presence of either substrate. In all three tissues, ΔΨm was significantly depolarized in response to AA addition reaching saturation at 1.1 μM AA in the presence of both substrates (Figure 7M–R). However, in the heart mitochondria, the ΔΨm depolarization after addition of 0.1 μM AA was significaantly less compared to the kidney cortex and OM mitochondria for both substrates (Figure 7M–R).
Tissue-specific and substrate-dependent effects of CIV inhibition by KCN on mitochondrial H2O2 emission and ΔΨm.
The effects of CIV inhibition with addition of three increasing concentrations of KCN upon H2O2 emission and ΔΨm in the heart and kidney cortex and OM mitochondria respiring under either PM or SUC substrate are summarized in Figure 8A–R. As depicted in Figure 8A–C, CIV treatment with KCN resulted in final concentrations of H2O2 in the respiration medium of 0.11±0.004, 0.90±0.06, and 0.24±0.013 μM in the presence of PM and 0.42±0.018, 0.88±0.066, and 0.53±0.016 μM in the presence of SUC in the heart, kidney cortex, and kidney OM mitochondria, respectively (Table 1). In the heart mitochondria utilizing PM and SUC, the rate of H2O2 emission decreased significantly after 0.01 mM KCN addition reaching saturation after 0.11 mM KCN addition for PM and 1 mM KCN addition for SUC (Figure 8D, G). Similarly, in the kidney cortex mitochondria utilizing PM or SUC, the rates of H2O2 emission decreased significantly only after 1 mM KCN addition (Figure 8E, H). However, in the kidney OM mitochondria utilizing SUC, the rate of H2O2 emission decreased significantly after 0.01 mM KCN addition, but it did not change significantly in the presence of PM (Figure 8F, I).
Figure 8. Dynamic and static experimental data on tissue-specific and substrate-specific measurements of mitochondrial H2O2 emission and ΔΨm in the heart and kidney cortex and OM in the presence of CIV inhibitor KCN:
Comparison of mitochondrial H2O2 emission dynamics in the presence of PM and SUC, and 3 doses of KCN in the heart (A), kidney cortex (B), and kidney OM (C). Comparison of the rate of mitochondrial H2O2 emission static data in the presence of PM and SUC, and 3 doses of KCN in the heart (D and G), kidney cortex (E and H), and kidney OM (F and I). Comparison of mitochondrial ΔΨm dynamic data in the presence of PM and SUC, and 3 doses of KCN in the heart (J), kidney cortex (K), and kidney OM (L). Comparison of mitochondrial ΔΨm static data in the presence of PM and SUC, and 3 doses of KCN in the heart (M and P), kidney cortex (N and Q), and kidney OM (O and R). This data was collected following the experimental protocol in Figure 2C. In all measurements concentration of PM is 5:2.5 mM and SUC is 10 mM. Increasing concentrations of 1, 2, and 5 mM KCN were added to kidney cortex mitochondria and 0.01, 0.1, 1 mM KCN were added to heart and kidney OM mitochondria every 2 minutes after the substrate addition at state 2. Data are shown as the average of n = 6 biological replicates ± S.E. To indicate the statistical difference between two sequential additions, asterisk (*) are used, with a significant level of p < 0.05.
As seen in Figure 8J–R, ΔΨm was significantly depolarized after the addition of 0.1 mM KCN to the heart mitochondria, 1 mM KCN to the kidney cortex mitochondria, and 0.11 mM KCN to the kidney OM mitochondria utilizing PM or SUC (Figure 8D–I). In the kidney cortex mitochondria, ΔΨm depolarization in response to KCN additions was significantly higher than in the heart and OM mitochondria in the presence of ether PM or SUC (Figure 8J–R).
Tissue-specific and substrate-dependent effects of TRX and GSH H2O2 scavenging systems inhibition by AF and DNCB on mitochondrial H2O2 emission and ΔΨm.
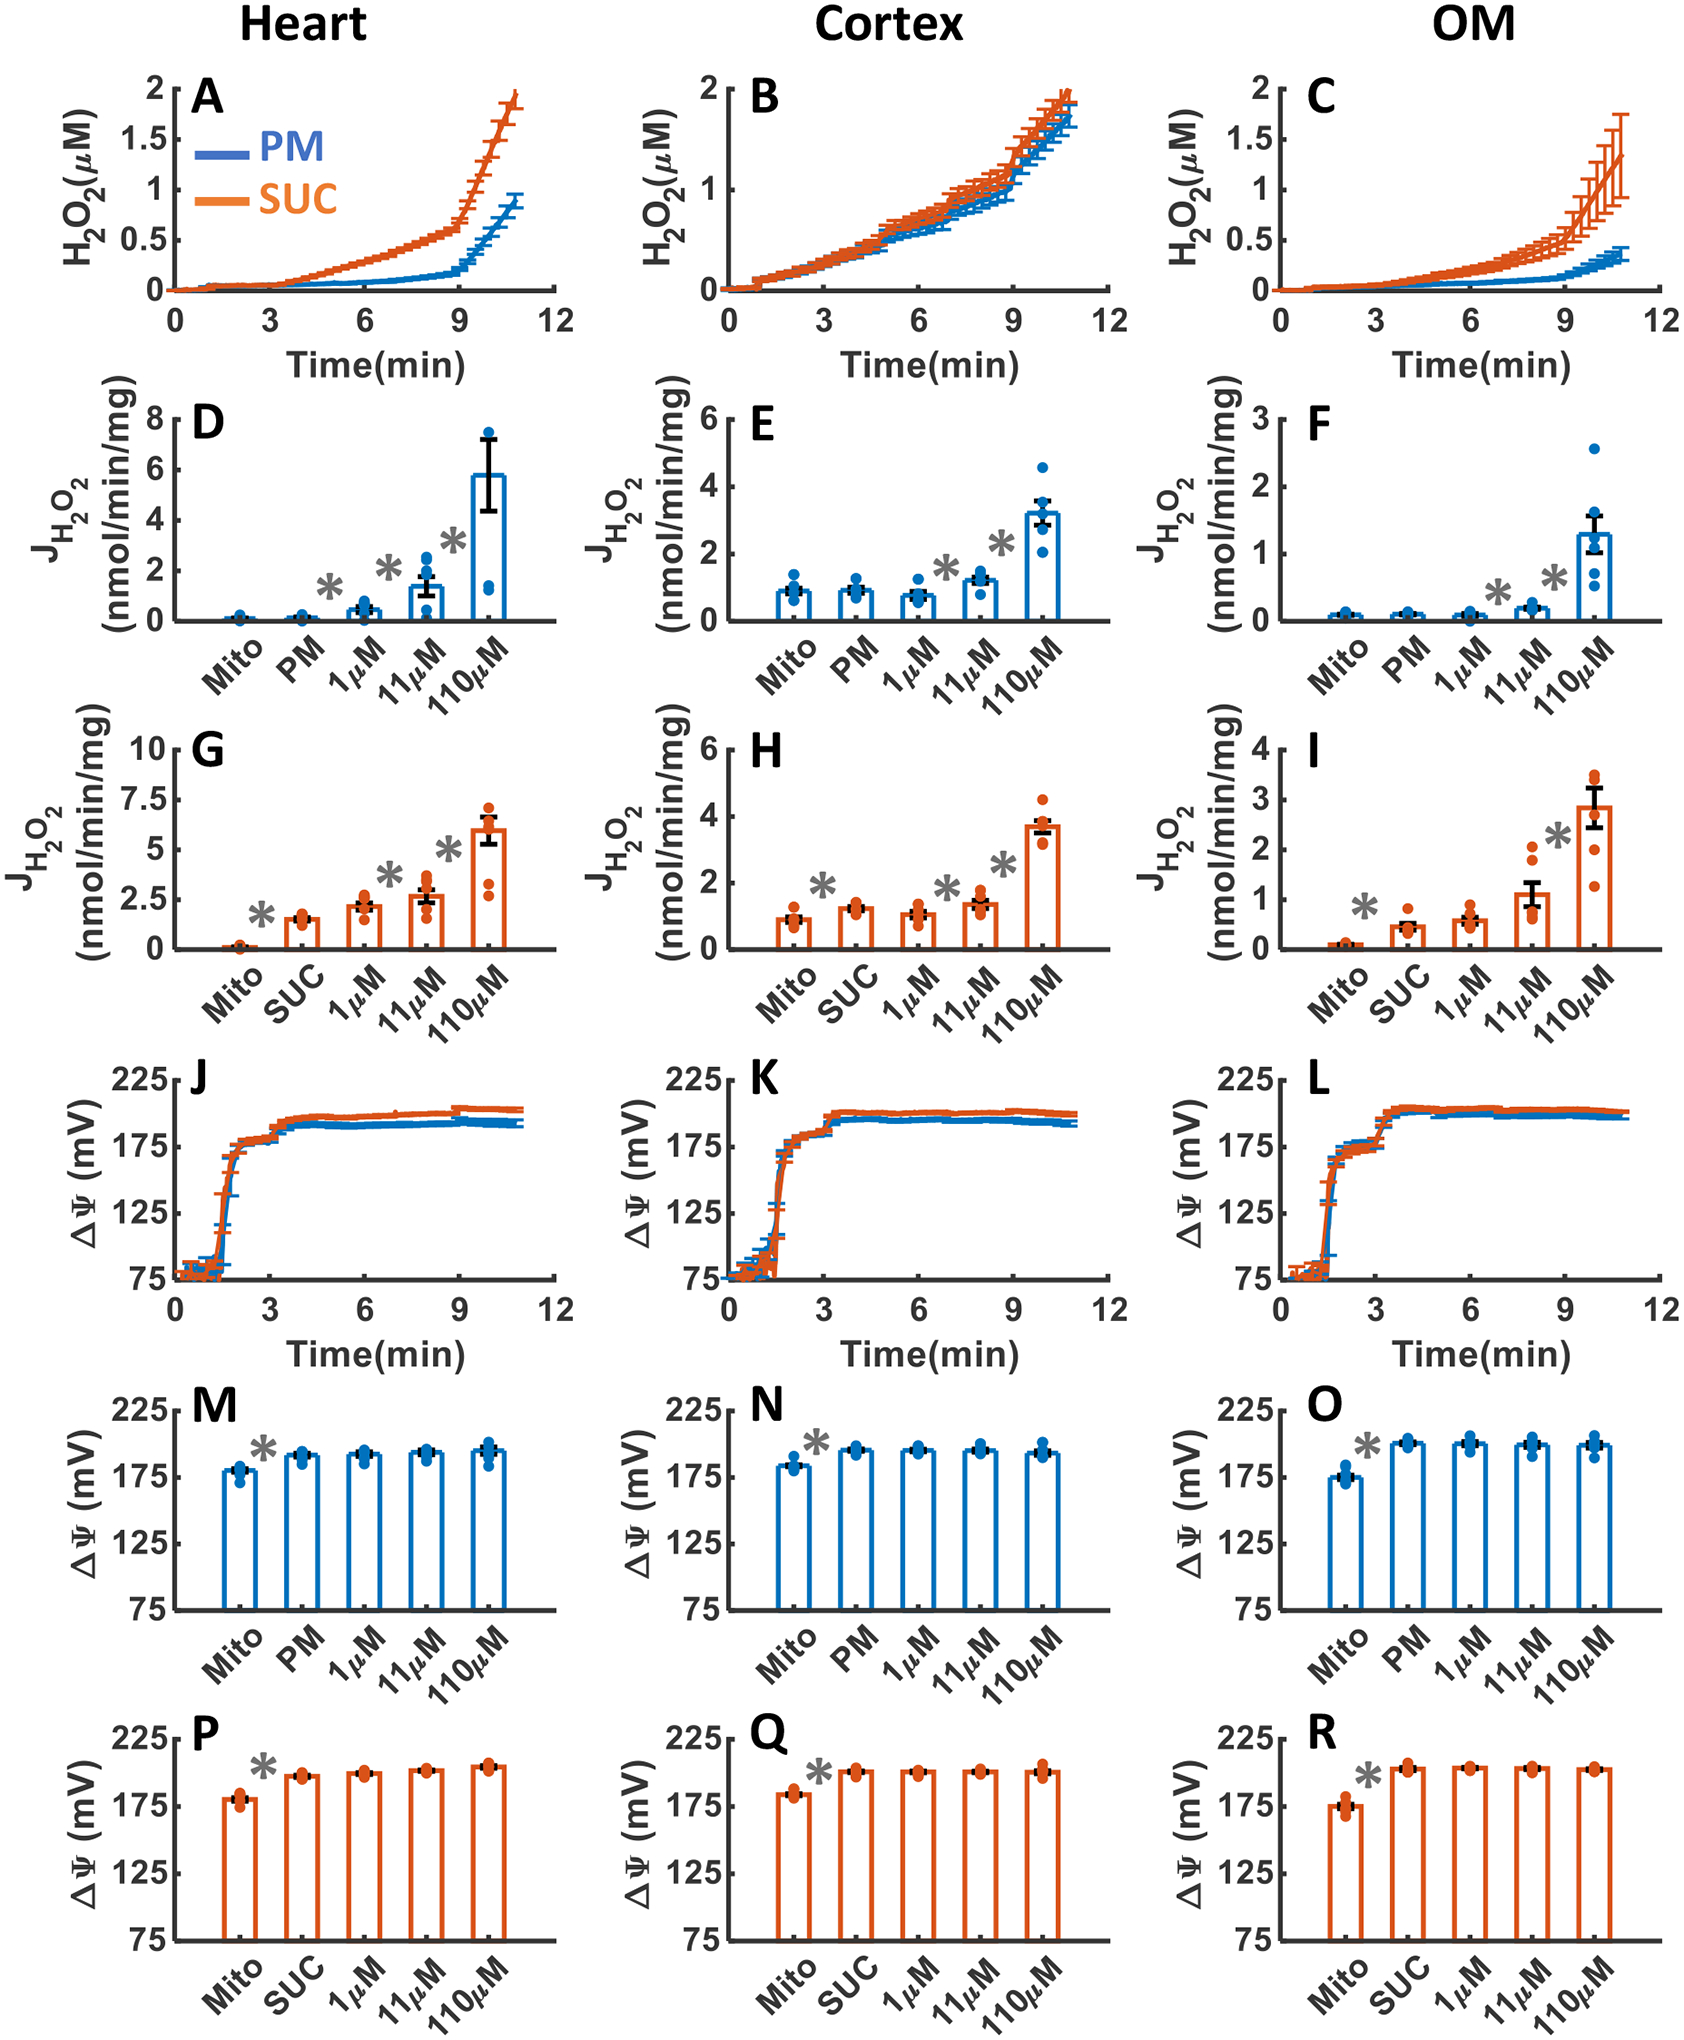
The effects of TRX and GSH H2O2 scavenging systems inhibition with the addition of three increasing concentrations of AF and DNCB upon H2O2 emission and ΔΨm in the heart and kidney cortex and OM mitochondria respiring under either PM or SUC substrate are summarized in Figures 9A–R and 10A–R, respectively. As shown in Figure 9A–I, the inhibition of thioredoxin reductase (TRXR) enzyme by AF resulted in substantial increase in mitochondrial H2O2 emission in the heart and kidney OM, but not in the kidney cortex for both substrates. As depicted in Figure 9A–C, the final concentration of H2O2 in the respiration buffer were 0.27±0.01, 1±0.05, and 0.23±0.008 μM in the presence of PM and 1.87±0.01, 1.55±0.099, and 0.90±0.058 μM in the presence of SUC in the heart, kidney cortex, and kidney OM mitochondria, respectively (Table 1). In the heart and OM mitochondria utilizing SUC, the rate of H2O2 emission significantly increased in response to AF addition (Figure 9G,I). However, this increase was not significant in the presence of PM (Figure 9D,F). In the cortex mitochondria utilizing PM or SUC, the rate of H2O2 emission after addition of AF did not change significantly (Figure 9E,H). AF had no significant effect on ΔΨm in mitochondria from all three tissues in the presence of PM or SUC (Figure 9J–R).
Figure 9. Dynamic and static experimental data on tissue-specific and substrate-specific measurements of mitochondrial H2O2 emission and ΔΨm, in the heart and kidney cortex and OM in the presence of TRX system inhibitor AF:
Comparison of mitochondrial H2O2 emission dynamics in the presence of PM and SUC, and 3 doses of AF in the heart (A), kidney cortex (B), and kidney OM (C). Comparison of the rate of mitochondrial H2O2 emission static data in the presence of PM and SUC, and 3 doses of AF in the heart (D and G), kidney cortex (E and H), and kidney OM (F and I). Comparison of mitochondrial ΔΨm dynamic data in the presence of PM and SUC, and 3 doses of AF in the heart (J), kidney cortex (K), and kidney OM (L). Comparison of mitochondrial ΔΨm static data in the presence of PM and SUC, and 3 doses of AF in the heart (M and P), kidney cortex (N and Q), and kidney OM (O and R). This data was collected following the experimental protocol in Figure 2C. In all measurements concentration of PM is 5:2.5 mM and SUC is 10 mM. Increasing concentrations of 0.1, 1, and 10 μM AF were added to heart and kidney OM mitochondria and 1, 10, and 40 were added to kidney cortex mitochondria and every 2 minutes after the substrate addition at state 2. Data are shown as the average of n = 6 biological replicates ± S.E. To indicate the statistical difference between two sequential additions, asterisk (*) are used, with a significant level of p < 0.05.
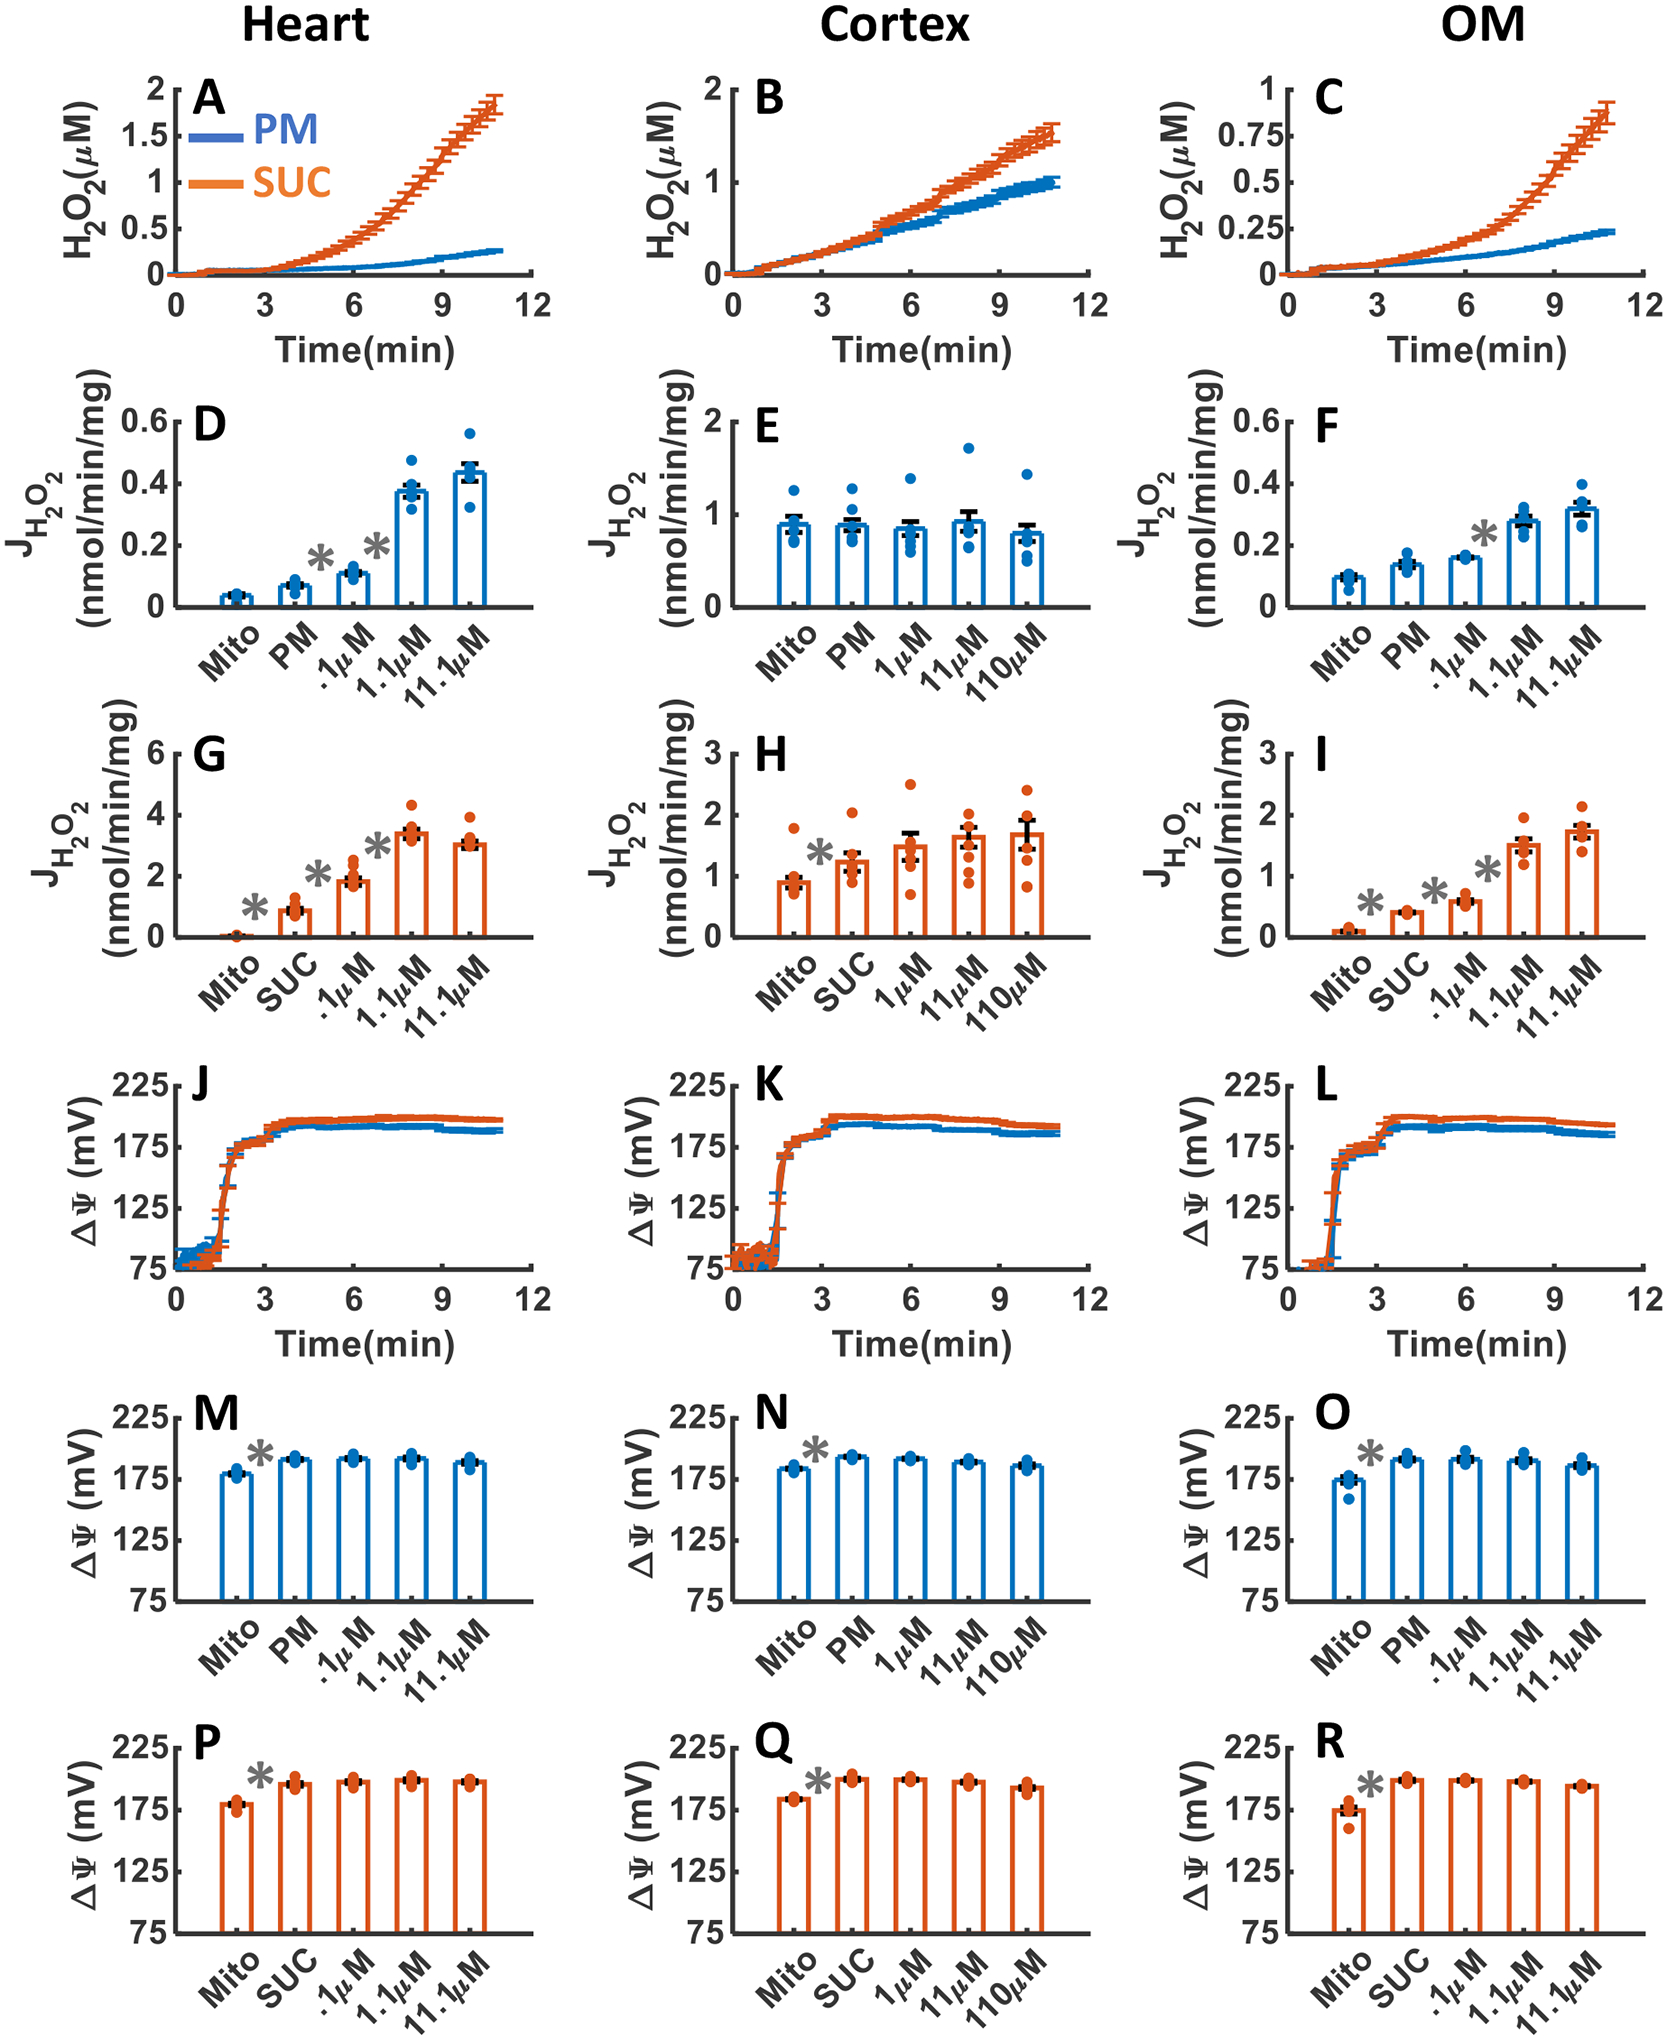
Figure 10. Dynamic and static experimental data on tissue-specific and substrate-specific measurements of mitochondrial H2O2 emission and ΔΨm in the heart and kidney cortex and OM in the presence of GSH system inhibitor DNCB:
Comparison of mitochondrial H2O2 emission dynamics in the presence of PM and SUC, and 3 doses of DNCB in the heart (A), kidney cortex (B), and kidney OM (C). Comparison of the rate of mitochondrial H2O2 emission static data in the presence of PM and SUC, and 3 doses of DNCB in the heart (D and G), kidney cortex (E and H), and kidney OM (F and I). Comparison of mitochondrial ΔΨm dynamic data in the presence of PM and SUC, and 3 doses of DNCB in the heart (J), kidney cortex (K), and kidney OM (L). Comparison of mitochondrial ΔΨm static data in the presence of PM and SUC, and 3 doses of DNCB in the heart (M and P), kidney cortex (N and Q), and kidney OM (O and R). This data was collected following the experimental protocol in Figure 2C. In all measurements concentration of PM is 5:2.5 mM and SUC is 10 mM. Increasing concentrations of DNCB (1, 10, and 100 μM) were added every 2 minutes after the substrate addition at state 2. Data are shown as the average of n = 6 biological replicates ± S.E. To indicate the statistical difference between two sequential additions, asterisk (*) are used, with a significant level of p < 0.05.
Figure 10A–I summarizes the effects of DNCB-induced depletion of mitochondrial GSH pool on H2O2 emission in the heart and kidney cortex and OM mitochondria respiring under either PM or SUC substrate. As shown in Figure 10A–C, the final concentrations of H2O2 in the respiration buffer were 0.94±0.07, 1.77±0.113, and 0.38±0.069 μM in the presence of PM and 2.0±0.126, 2.03±0.115, and 1.39±0.426 μM in the presence of SUC in the heart, kidney cortex, and kidney OM mitochondria, respectively (Table 1). In all three tissues, the rate of mitochondrial H2O2 emission was significantly increased in response to DNCB addition in the presence of both substrates (Figure 10D–I). The rate of H2O2 emission in the presence of PM was higher in the kidney cortex mitochondria in response to DNCB addition compared to that in the heart and kidney OM mitochondria (Figure 10D–F). However, in the heart mitochondria utilizing SUC, the rate of H2O2 emission in response to DNCB addition was higher than that for the kidney cortex and OM mitochondria (Figure 10G–I). Additionally, addition of DNCB in the heart mitochondria utilizing SUC resulted in changes in H2O2 emission rate which were similar to the kidney cortex and OM mitochondria. Finally, in all tissues, ΔΨm did not change significantly in response to DNCB addition for either substrate (Figure 10J–R), as in the case of AF addition.
Tissue-specific and substrate-dependent effects of OxPhos uncoupling by FCCP on mitochondrial H2O2 emission and ΔΨm.
The effects of OxPhos uncoupling with addition of three increasing concentrations of FCCP upon H2O2 emission and ΔΨm in the heart and kidney cortex and OM mitochondria respiring under either PM or SUC substrate are summarized in Figure 11A–R. As shown in Figure 11A–C, as a result of uncoupling of mitochondrial OxPhos by FCCP addition, the final concentrations of H2O2 in the respiration medium were 0.1±0.009, 0.79±0.029, and 0.2±0.014 μM in the presence of PM, and 0.29±0.014, 0.92±.036, and 0.48±0.049 μM in the presence of SUC in the heart, kidney cortex, and kidney OM mitochondria, respectively (Table 1). In the heart and OM mitochondria after addition of FCCP, the rate of H2O2 emission decreased significantly in the presence of SUC and decreased slightly in the presence of PM (Figure 11D,G,F,I). In the cortex mitochondria utilizing PM or SUC, the rate of H2O2 emission decreased in response to FCCP addition (Figure 11E,H). However, in the cortex mitochondria utilizing PM or SUC, the final concentration of H2O2 in the respiration buffer after increasing doses of FCCP additions was significantly higher than the heart and OM mitochondria (Figure 11A–C). Finally, in all tissues, ΔΨm was significantly depolarized after the addition of 1.1 μM of FCCP (Figure 11J–R).
Figure 11. Dynamic and static experimental data on tissue-specific and substrate-specific measurements of mitochondrial H2O2 emission and ΔΨm in the heart and kidney cortex and OM in the presence of FCCP uncoupler:
Comparison of mitochondrial H2O2 emission dynamics in the presence of PM and SUC, and 3 doses of FCCP in the heart (A), kidney cortex (B), and kidney OM (C). Comparison of the rate of mitochondrial H2O2 emission static data in the presence of PM and SUC, and 3 doses of FCCP in the heart (D and G), kidney cortex (E and H), and kidney OM (F and I). Comparison of mitochondrial ΔΨm dynamic data in the presence of PM and SUC, and 3 doses of FCCP in the heart (J), kidney cortex (K), and kidney OM (L). Comparison of mitochondrial ΔΨm static data in the presence of PM and SUC, and 3 doses of FCCP in the heart (M and P), kidney cortex (N and Q), and kidney OM (O and R). This data was collected following the experimental protocol in Figure 2C. In all measurements concentration of PM is 5:2.5 mM and SUC is 10 mM. Increasing concentrations of FCCP (0.1, 1, and 10 μM) were added every 2 minutes after the substrate addition at state 2. Data are shown as the average of n = 6 biological replicates ± S.E. To indicate the statistical difference between two sequential additions, asterisk (*) are used, with a significant level of p < 0.05.
Tissue-specific and substrate-dependent effects of NOX2 inhibition by GSK on mitochondrial H2O2 emission and ΔΨm.
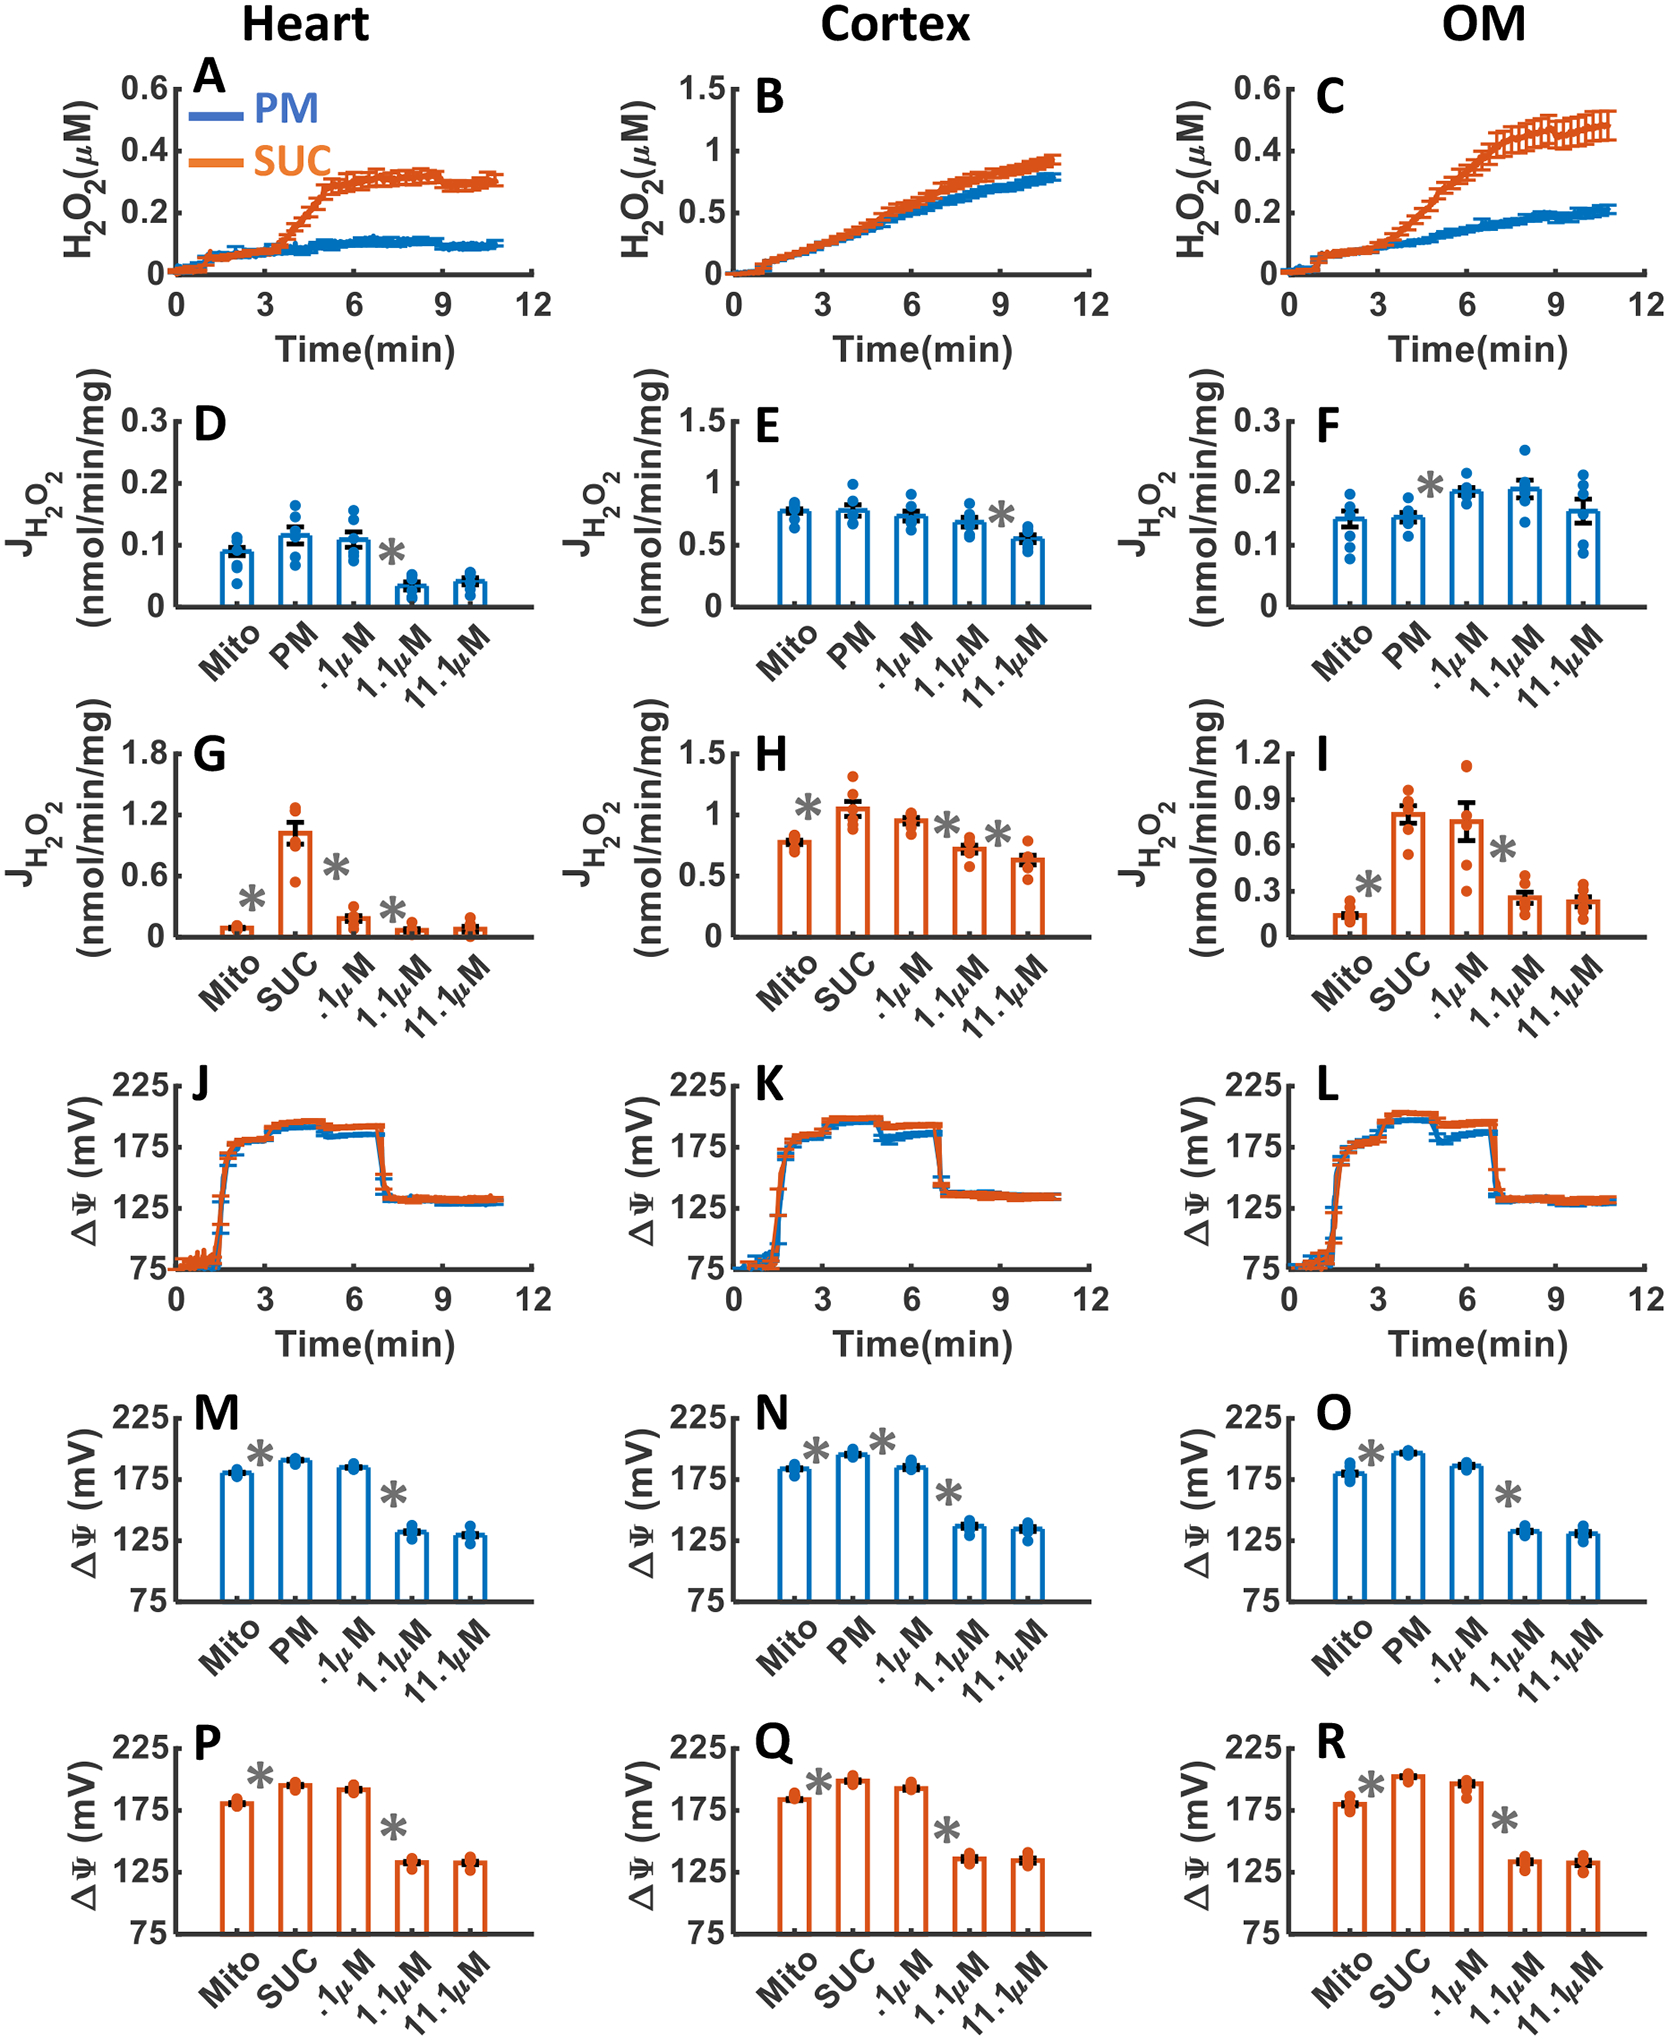
The effects of NOX2 inhibition with addition of three increasing concentrations of GSK upon H2O2 emission and ΔΨm in the heart and kidney cortex and OM mitochondria respiring under either PM or SUC substrate are summarized in Figure 12A–R. As shown in Figure 12A–C, as a result of NOX2 inhibition by GSK addition, the final concentrations of H2O2 in the respiration medium were 0.15±0.012, 0.65±0.038, and 0.2±0.021 μM in the presence of PM and 0.61±0.037, 0.92±0.054, and 0.44±0.023 μM in the presence of SUC in the heart, kidney cortex, and kidney OM mitochondria, respectively (Table 1). In the heart and OM mitochondria utilizing SUC, the rate of H2O2 emission decreased significantly in response to GSK addition, however, this decrease was not as significant in the presence of PM (Figure 12D,G,F,I). In the cortex mitochondria utilizing PM or SUC, the rate of H2O2 emission decreased significantly in response to GSK addition (Figure 12E,H). In the cortex mitochondria utilizing PM or SUC, the final concentrations of H2O2 in the respiration buffer in response to increasing doses of GSK additions were significantly higher than that in the heart and OM mitochondria (Figure 12A–C). In all three tissues, ΔΨm did not change significantly in response to GSK addition for either substrate (Figure 12J–R).
Figure 12. Dynamic and static experimental data on tissue-specific and substrate-specific measurements of mitochondrial H2O2 emission and ΔΨm in the heart and kidney cortex and OM in the presence of NOX2 inhibitor GSK:
Comparison of mitochondrial H2O2 emission dynamics in the presence of PM and SUC, and 3 doses of GSK in the heart (A), kidney cortex (B), and kidney OM (C). Comparison of the rate of mitochondrial H2O2 emission static data in the presence of PM and SUC, and 3 doses of GSK in the heart (D and G), kidney cortex (E and H), and kidney OM (F and I). Comparison of mitochondrial ΔΨm dynamic data in the presence of PM and SUC, and 3 doses of GSK in the heart (J), kidney cortex (K), and kidney OM (L). Comparison of mitochondrial ΔΨm static data in the presence of PM and SUC, and 3 doses of GSK in the heart (M and P), kidney cortex (N and Q), and kidney OM (O and R). This data was collected following the experimental protocol in Figure 2C. In all measurements concentration of PM is 5:2.5 mM and SUC is 10 mM. Increasing concentrations of GSK (10, 40, and 50 μM) were added every 2 minutes after the substrate addition at state 2. Data are shown as the average of n = 6 biological replicates ± S.E. To indicate the statistical difference between two sequential additions, asterisk (*) are used, with a significant level of p < 0.05.
Comparison of tissue-specific and substrate-dependent mitochondrial H2O2 emission under different perturbations.
The inhibition of IQ site of CI by ROT resulted in reduction in the rate of H2O2 emission from 0.79±0.02 to 0.22±0.04 nmol/min/mg in the heart mitochondria and from 0.54±0.02 to 0.24±0.04 nmol/min/mg in the kidney OM mitochondria despite no changes in ΔΨm (Figure 5, Table 2). Whereas the inhibition of IIQ site of CII by TTFA resulted in reduction in the rate of mitochondrial H2O2 emission from 0.79±0.06 to 0.04±0.008 nmol/min/mg in the and from 0.54±0.02 to 0.04 ±0.008 nmol/min/mg in the kidney OM and as well as a significant depolarization of ΔΨm in both tissues (Figure 6, Table 2). In the heart mitochondria, the rate of H2O2 emission was 0.79±0.02 nmol/min/mg (Table 2) after SUC addition and 0.61±0.012 μM H2O2 (Table 1) at the end of the experiment (after 10 minutes). The final concentration of H2O2 in the presence of SUC, which is majorly resulted from reverse electron transport (RET), was 0.6±0.012 μM, which reduced to 0.43±0.068 μM in response to CI inhibition by ROT in the presence of PM (Figure 5) but increased to 0.69±0.075 μM in response to CIII inhibition by AA in the presence of PM (Figure 7, Table 1). These findings suggest that the contribution of IIIQo site of CIII to H2O2 emission in the heart mitochondria is considerably high. In the kidney OM mitochondria, the rate of H2O2 emission after SUC addition was 0.54±0.06 nmol/min/mg (Table 2) leading to 0.71±0.023 μM H2O2 (Table 1) at the end of the experiment (after 10 minutes). The final concentration of H2O2 resulting from RET was 0.71±0.023 μM, which reduced to 0.31±0.048 μM in response to CI inhibition by ROT in the presence of PM (Figure 5) and to 0.24±0.008 μM in response to CIII inhibition by AA in the presence of PM (Figure 7, Table 1). In the kidney cortex mitochondria, the rate of H2O2 emission after SUC addition was 0.7±0.01 nmol/min/mg leading to 0.95±0.01 μM H2O2 at the end of the experiment (after 10 minutes) (Tables 1,2). The final concentration of H2O2 resulting from RET was 0.95±0.01 μM, which slightly increased to 0.97±0.068 μM in response to CI inhibition by ROT in the presence of PM (Figure 5) and 1±0.05 μM in response to CIII inhibition by AA in the presence of PM (Figures 7, Table 1).
Table 2.
Final rate of mitochondrial H2O2 emission (nmol/min/mg)
| PM | SUC | |||||
|---|---|---|---|---|---|---|
| Heart | Cortex | OM | Heart | Cortex | OM | |
| Ctrl | 0.05±0.007 | 0.76±0.01 | 0.17±0.02 | 0.79±0.02 | 0.83±0.02 | 0.54±0.06 |
| TTFA | 0.04±6e-4 | 0.36±0.04 | 0.06±5e-4 | 0.04±0.01 | 0.36±0.01 | 0.04±8e-4 |
| KCN | 0.02±0.003 | 0.32±0.07 | 0.13±0.01 | 0.03±0.006 | 0.37±0.1 | 0.15±0.01 |
| FFCP | 0.04±5e-4 | 0.55±0.03 | 0.15±0.01 | 0.07±0.02 | 0.63±0.03 | 0.23±0.03 |
| GSK | 0.025±0.003 | 0.13±0.01 | 0.07±0.02 | 0.17±0.01 | 0.32±0.05 | 0.23±0.01 |
| ROT | 0.92±0.21 | 0.55±0.05 | 0.37±0.1 | 0.22±0.04 | 0.5±0.03 | 0.24±0.07 |
| AA | 0.97±0.04 | 1.01±0.06 | 0.23±0.02 | 0.84±0.03 | 0.9±0.06 | 0.18±0.02 |
| AF | 0.43±0.02 | 0.79±0.08 | 0.31±0.02 | 3.03±0.12 | 1.68±0.23 | 1.79±0.1 |
| DNCB | 0.578±0.14 | 0.321±0.03 | 0.129±0.02 | 0.596±0.06 | 0.369±0.01 | 0.283±0.03 |
In the heart and kidney OM mitochondria respiring under PM, the final concentration of H2O2 after inhibition of GSH scavenging system by DNCB were 0.94±0.07 μM and 0.38±0.069 μM, respectively (Figure 10, Table 1), whereas the final concentration of H2O2 after inhibition of TRX scavenging system by AF were 0.27±0.01 μM and 0.24±0.008 μM, respectively (Figure 9, Table 1). In the heart and kidney OM mitochondria respiring under SUC, the final concentration of H2O2 after inhibition of GSH scavenging system by DNCB were 2.0±0.126 μM and 1.39±0.426 μM, respectively (Figure 10, Table 1), whereas the final concentration of H2O2 after inhibition of TRX scavenging system by AF were 1.87±0.01 μM and 0.9±0.058 μM, respectively (Figure 9, Table 1). Therefore, the contribution of the GSH scavenging system to H2O2 degradation was ~1.5-fold higher than the TRX scavenging system in these tissues. In the kidney cortex mitochondria respiring under PM, the final concentration of H2O2 was 0.85±0.004 μM which significantly increased to 1.77±0.113 μM as a result of GSH system inhibition by DNCB and slightly increased to 1±0.05 μM as a result of TRX system inhibition (Table 1). In the kidney cortex mitochondria respiring under SUC, the final concentration of H2O2 was 0.95±0.01 μM which significantly increased to 2.03±0.115 μM as a result of GSH system inhibition by DNCB (Figure 10) and slightly increased to 1.55±0.099 μM as a result of TRX system inhibition by AF (Figure 9, Table 1). Therefore, the TRX scavenging system does not contribute to mitochondrial H2O2 degradation, despite significant contribution of GSH scavenging system to H2O2 degradation.
DISCUSSION
In this section, tissue-specific and substrate-dependent differences in mitochondrial respiratory and bioenergetic functions and ROS production and scavenging in the heart and kidney cortex and OM are discussed. The findings from the present study demonstrate significant differences in mitochondrial respiratory and bioenergetic functions and ROS emission among the three tissues. Additionally, we quantify the sources of ROS production from different complexes of the ETC which are responsible for variations in mitochondrial membrane depolarization and regulations of ROS production. Furthermore, we investigate the contributions of ROS scavenging enzymes towards overall mitochondrial ROS emission. These findings advance our fundamental understanding of tissue-specific and substrate-dependent mitochondrial respiratory and bioenergetic functions and ROS emission. This knowledge is particularly important due to the critical role played by excess ROS production, oxidative stress, and metabolic dysfunction in the pathogenesis of cardiovascular and renal diseases, including salt-sensitive hypertension.
Tissue-specific and substrate-dependent mitochondrial respiration, bioenergetics, and H2O2 emission relationships.
The data from the present study demonstrated that the mitochondria from all three tissues exhibit a higher proton leak (state 2) mediated O2 consumption rate (OCR or JO2) with lower efficiency of OxPhos for ATP production (state 3) when respiring with SUC compared to PM (Figure 3A–L), characterized by lower respiratory control index (RCI; state 3 OCR/state 2 OCR) (Figure 3M–O). Interestingly, the ADP-induced state 3 (OxPhos state) OCR in the heart mitochondria was significantly depressed with SUC compared to PM, but it was significantly higher in the kidney cortex and OM mitochondria with SUC compared to PM (Figure 3G–L). Furthermore, it was observed that the OCR profile during OxPhos state in the heart mitochondria, while respiring with SUC, displayed distinct differences compared to the kidney cortex and OM mitochondria (Figure 3D–F). A similar pattern was also observed in the state 3 membrane potential (ΔΨm) dynamics between the heart and kidney cortex and OM mitochondria when respiring with PM and SUC (Figure 4J–L). Comparison between mitochondrial respiratory and bioenergetics functions showed negative correlation between OCR and ΔΨm in the leak state (state 2) and positive correlation between OCR and ΔΨm in the OxPhos state (ADP-induced state 3) in all tissues for either substrate (Figures 3 and 4). These differential respiratory and bioenergetic responses of the heart and kidney cortex and OM mitochondria to PM and SUC substrates and ADP can be attributed to variations in the activities of enzymes and transporters associated with the NADH and FADH2-linked pathways within the mitochondria in these tissues, enabling them to perform distinct metabolic functions.
Significant differences were also observed in the rates of H2O2 emission among the heart and kidney cortex and OM mitochondria during different states of respiration with PM and SUC substrates (Figure 4A–I). Interestingly, the rate of H2O2 emission in the kidney cortex mitochondria did not vary significantly between PM and SUC during different states of respiration (Figure 4B,E,H). Moreover, it remained consistently elevated across all respiratory states, suggesting that the primary source of ROS production in the kidney cortex mitochondria may be different from the ETC complexes such as the involvement of NOX2 enzyme. In contrast, the rates of H2O2 emission in the heart and kidney OM mitochondria exhibited significant variations between PM and SUC, as well as during different states of respiratory states (Figure 4A,D,G,C,F,I). In both the heart and kidney OM mitochondria, the rate of H2O2 emission increased immensely with SUC addition, attenuated significantly with ADP addition (state 3), further increased upon phosphorylation of ADP to ATP (state 4), and significantly decreased with FCCP addition due to increased proton leak. On the other hand, the rate of H2O2 emission in the heart and kidney OM mitochondria oxidizing PM showed minimal variation during different states of respiration. These findings suggest that multiple ETC complexes are likely the primary sources of ROS production in the heart and kidney OM mitochondria. Furthermore, in the heart and kidney OM mitochondria oxidizing SUC, there was a positive correlation between mitochondrial OCR and the rate of mitochondrial H2O2 emission, as well as ΔΨm in both the leak state and OxPhos state. However, no such correlation was observed in the heart and kidney OM mitochondria oxidizing PM, nor in the kidney cortex mitochondria oxidizing PM or SUC (Figures 3 and 4).
These distinct tissue-specific and substrate-dependent mitochondrial respiration (OCR), bioenergetics (ΔΨm), and H2O2 emission data are consistent with the recent results of Tomar et al. from our laboratory [51]. The observed changes in the OCR, ΔΨm, and H2O2 during the OxPhos state (state 3) in the heart and kidney OM mitochondria when utilizing SUC may be attributed to the excessive production of oxaloacetate (OXA), an intermediate of TCA cycle [51, 56–58]. OXA is known to inhibit succinate dehydrogenase (SDH) (coupled to Complex II) leading to a reduction in reverse electron flow (RET)-mediated ROS production at Complex I (CI) and forward electron flow (FET) downstream in the ETC, resulting in reduced OxPhos. In addition, the high rate of H2O2 emission in the heart and kidney OM mitochondria with SUC in state 2 may be attributed to RET-mediated excess ROS production at CI [51, 58]. During this process, superoxide () is generated as a result of electrons leaking from IQ and IF sites of CI to O2 when electrons move back from ubiquinol (UQH2) at CII to NAD+ at CI generating NADH. This phenomenon is known as RET-mediated ROS production [59, 60]. It is important to note that no significant differences in ΔΨm and H2O2 emission were observed in the kidney cortex mitochondria when utilizing SUC and PM. This suggests that SDH inhibition by OXA is not the primary mechanism affecting ΔΨm and H2O2 emission in this tissue, or it is possible that mitochondrial OXA accumulation does not occur to a significant extent in the kidney cortex mitochondria.
Effect of ROT inhibition of CI on tissue-specific and substrate-dependent mitochondrial H2O2 emission and ΔΨm relationship.
Complex I (CI) transfers two electrons from NADH to ubiquinone (UQ) and pumps four protons to the inter-membrane space (IMS), contributing to the generation of membrane potential (ΔΨm) and proton motive force (Δp). During this process, NADH is oxidized at the IF site (flavin mononucleotide (FMN) containing subunit) and donates two electrons to the 2Fe-2S cluster (N2 cluster), which then reduces UQ to UQH2 in a two-step process proposed by Fato et al. [61].
The FMN and UQ sites within the structure of CI are relatively accessible to the mitochondrial matrix side, which increases the likelihood of electron leakage and ROS production from these sites [62]. The specific contribution of these sites to ROS production by CI has been examined using NADH- and FADH2-linked substrates, as well as specific CI inhibitors. Several studies have shown that the IF site is a significant source of production at CI, rather than the IQ site [63, 64]. However, other investigators have argued that IQ site production is more dominant compared to the IF site [65, 66]. It is important to note that most of these studies have focused on the mitochondria of the heart or skeletal muscle, and none have specifically addressed the kidney cortex or OM mitochondria. Therefore, to address this uncertainty, we conducted measurements of the rate of H2O2 emission in the heart and kidney cortex and OM mitochondria using both NADH-linked and FADH2-linked substrates, followed by the addition of ROT, which inhibits CI by blocking the transfer of electrons from the N2 cluster centers to ubiquinone (UQ).
Our findings suggest that in the presence of NADH-linked substrate PM, H2O2 emission was barely detectable in the heart and kidney OM mitochondria. However, upon inhibition of the IQ site by ROT, the rate of H2O2 emission significantly increased. This increase could be a result of electrons leak from the IF site or the N2 cluster of IQ site (UQ binding site) to the mitochondrial matrix. Our observation of negligible H2O2 emission in the presence of PM show that the IF site is not a major contributor to mtROS production under normal conditions. However, the IF site could contribute to excessive mtROS production as a secondary consequence of highly reduced NAD pool (high NADH/NAD) under pathological conditions. In the presence of FADH2-linked substrate SUC, the rate of H2O2 emission was significantly elevated in the heart and kidney OM mitochondria, potentially due to reverse electron transfer (RET) from UQH2 to NAD. However, upon inhibition of the IQ site by ROT, the rate of H2O2 emission decreased significantly. This reduction could be a result of blocking electron leak from the IQ site to mitochondrial matrix or blocking electron transfer from UQH2 to NAD and ultimately blocking electron leak from the IF site to mitochondrial matrix. Therefore, in the heart and kidney OM mitochondria, the negligible H2O2 emission in the presence of PM and significant reduction in the rate of H2O2 emission after addition of ROT in the presence of SUC suggest that the IQ site is the primary source of ROS emission in these tissues. The IF site appears to be secondary to mtROS emission which is likely a a consequence of the highly reduced NAD pool. Interestingly, we did not observe any significant changes in the H2O2 emission rate after addition of ROT to the kidney cortex mitochondria respiring with PM. However, a significant reduction was observed in the rate of H2O2 emission after addition of ROT to the kidney cortex mitochondria respiring with SUC. These observations suggest a significant contribution of the IQ site to mtROS production in the kidney cortex mitochondria. We also observed that the contribution of the IQ site to H2O2 emission in the kidney cortex mitochondria is less significant compared to those in the heart and kidney OM mitochondria.
Although RET-mediated production in mitochondria is not a common occurrence under physiological conditions, it has been found to be a significant contributor to ROS production in pathological conditions [62]. Reduction in ΔΨm leads to an increased protein pumping across the inner mitochondrial membrane (IMM), resulting in the buildup of ΔΨm. This in turn, reduces electron leakage from the ETC and hence decreases ROS emission in mitochondria [67–69]. In the heart and kidney OM mitochondria, when respiring with PM after addition of ROT, there is a reduction in ΔΨm despite an increase in mitochondrial H2O2 emission. However, in the presence of SUC after addition of ROT, the rate of H2O2 emission decreases despite no change in ΔΨm. In all tissues in the presence of either substrate, the opposite profiles of mitochondrial H2O2 emission rate and ΔΨm show that the changes in mitochondrial H2O2 emission dynamic were resulted from site alterations rather than ΔΨm changes.
Effect of TTFA inhibition of CII on tissue-specific and substrate-dependent mitochondrial H2O2 emission and ΔΨm relationship.
Complex II (CII) is directly coupled to succinate dehydrogenase (SDH) (an intermediate enzyme in the TCA cycle within mitochondrial matrix). As an intermediate enzyme of the TCA cycle, SDH transfers two electrons from SUC to FAD at IIF site, oxidizing SUC to fumarate (FUM) and reducing FAD to FADH2. As the second complex of the ETC, CII transfers two electrons from FADH2 to UQ at the IIQ site, oxidizing FADH2 to FAD and reducing UQ to UQH2 [26, 70]. Mitochondrial CII inhibitors are categorized as two groups including the IIF site inhibitors such as malate (MAL), oxaloacetate (OXA), and malonate or the IIQ site inhibitors such as TTFA and Atpenin A5 [71].
Quinlan et al. [70] and Drose et al. [72] reported that the rate of ROS production by CII was higher in the presence of sub-saturating concentrations of SUC compared to its saturated concentrations in the mitochondria isolated from hind limb skeletal muscle. They found that the mitochondrial H2O2 emission rate and SUC concentration had a bell-shaped relationship. In these experiments, they incubated mitochondria with 4μM ROT and 2μM Myxothiazol (MYX: CIII inhibitor) and reported that the maximum H2O2 emission rate was obtained at 0.4mM SUC [70]. In the same condition, inhibition of CII by Malonate (IIF site inhibitor) led to complete prevention of H2O2 emission in the presence of low concentrations of SUC (<1mM). However, when CII was inhibited by Atpenin A5 (IIQ site inhibitor) instead of malonate, the H2O2 emission declined only by ~ 50%. Therefore, they concluded that the IIF site of CII contributes to mitochondrial H2O2 production more than the IIQ site. They also observed that when mitochondria were inhibited by Atpenin A5, less concentrations of SUC were required to achieve the H2O2 emission rate peak that was also influenced by the choice of inhibitor and incubation condition. Quinlan et al. concluded that decrease in the mitochondrial H2O2 emission induced by IIQ inhibition could potentially be attributed to a SUC-dependent leftward shift in the H2O2 emission rate rather than any upstream site. In a study by Drose et al. [71], using submitochondrial particles (SMP) from bovine heart mitochondria respiring with 0.1mM SUC, the peak H2O2 emission rate was found to be ~ 1000 pmol/min/mg. They employed various inhibitors of CII, including 1.5mM malonate, 0.25μM Atpenin A5, and 100μM TTFA, and observed reduction in the rate of H2O2 emission with increasing SUC concentrations within the range of 0.1mM-5mM. They concluded that the unoccupied flavin site (IIF) is the primary source of ROS production by CII. However, in these two studies, the mitochondria were incubated with differing concentrations of SUC, as well as inhibitors of CI, CII, and CIII. Therefore, it is challenging to distinguish changes in mitochondrial H2O2 emission resulting from differences in incubation conditions or secondary effects of CI, CII, and CIII inhibitors from changes caused by alterations in CII sites in these experiments. Furthermore, these studies focused on heart or skeletal muscle mitochondria, without considering the kidney cortex or OM mitochondria. To address these uncertainties, we measured the rate of H2O2 emission in the heart and kidney cortex and OM mitochondria in the presence of both NADH-linked and FADH2-linked substrates, followed by an array of TTFA additions, which inhibit CII by blocking the transfer of electrons from FADH2 to UQ at IIQ site.
We observed low H2O2 emission in the heart and kidney OM mitochondria respiring with PM, which remained unchanged after inhibition of the IIQ site by TTFA. However, the H2O2 emission in the heart and kidney OM mitochondria respiring with SUC was significantly diminished after inhibition of IIQ site by TTFA. In the kidney cortex mitochondria, respiring with either PM or SUC substrate, the inhibition of IIQ site by TTFA resulted in significant reduction of the H2O2 emission rate. In all tissues, the addition of TTFA to isolated mitochondria resulted in a slight decline in ΔΨm in the presence of PM, but a significant decline in the presence of SUC. The reduction in ΔΨm was attributed to a decrease in the reduced UQ pool (low UQH2/UQ) and reduced UQH2 availability to CIII, which in turn prevented pumping of protons across IMM. The H2O2 emission rate decreased significantly after addition of 10μM TTFA, while ΔΨm reduced significantly after addition of 50μM TTFA to the heart and kidney OM mitochondria respiring with either PM or SUC. Therefore, the reduction in mitochondrial H2O2 emission rate cannot be attributed solely to the decrease in ΔΨm in these tissues. Inhibition of IIQ site of CII by TTFA obstructed the flow of electrons upstream of CII and prevented RET-mediated production, indicating that the IIQ site of CII contribute to mtROS production in these tissues. Thus, contribution of the IIQ site of CII to mtROS production is greater than contribution of ΔΨm depolarization in the heart and kidney OM mitochondria respiring with PM or SUC. In the kidney cortex mitochondria, the decrease in H2O2 emission rate upon addition of varying TTFA concentrations is directly proportional to the changes in ΔΨm for both substrates. Consequently, we can conclude that in this tissue, the decrease in mitochondrial H2O2 emission rate may be primarily due to the reduction in ΔΨm rather than the contribution of an independent site at CII.
Effect of AA inhibition of CIII on tissue-specific and substrate-dependent mitochondrial H2O2 emission and ΔΨm relationship.
In complex III (CIII), the completion of one catalytic cycle necessitates the oxidation of two UQH2 molecules to two UQ molecules on the IMS side (P-side or IIIQo site), reduction of one UQ molecule to one UQH2 molecule on the matrix side (N-side or IIIQi site), and reduction of two CytCox molecules to two CytCred molecules on the P-side [59, 73, 74]. During the first half of the cycle, one UQH2 molecule binds to the IIIQo site, contributing two bifurcated electrons. One of these electrons flows through the high-potential chain (CytC bH), reducing a CytCox molecule to CytCred on the P-side, while the other electron flows through the low-potential chain (CytC bL), reducing one UQ molecule to UQH (SQ) on the N-side. In the second half of the cycle, another UQH2 molecule binds to the IIIQo site, donating two bifurcated electrons. One of these electrons reduces the second CytCox molecule to CytCred on the P-side, while the other electron reduces UQH to UQH2 on the N-side. Common inhibitors of CIII are Antimycin A (AA) which inhibits the IIIQi site on the N-side, and Myxothiazol (MYX) which inhibits the IIIQo site on the P-side. The prevailing view is that CIII generates through the formation of an unstable semiquinone (SQ) at the IIIQo site during the Q-cycle, although the precise molecular mechanism of this process remains a matter of debate [59, 73, 75–77].
Quinlan et al. [78] conducted experiments to investigate the contribution of IIIQo site to production in isolated mitochondria of hind limb skeletal muscle of female Wistar rats. They utilized NADH- and FADH2-linked substrates, such as Glutamate-Malate (GM) and SUC and measured the rate of H2O2 emission in isolated mitochondria exposed to SUC while inhibiting the IQ site of CI with ROT, the IIF site of CII with Malonate, and the IIIQ0 site of CIII with MYX. This study revealed that in the presence of GM, mitochondrial was predominantly released from IF site at CI, IIIQo site at CIII, and 2-Oxoglutarate Dehydrogenase (ODH). Conversely, in the presence of SUC, mitochondrial primarily originated from the IQ site, with a minor contribution from the IF site at CI and IIIQo at CIII. Based on these findings, the authors concluded that the IIIQo site played a principal role in mitochondrial production at CIII. However, it is important to note that the experiments did not differentiate between changes in mitochondrial and /or H2O2 emission due to secondary effects of CI and CIII inhibitors from changes resulting from alterations at CIII sites. Moreover, most of these studies focused on heart or skeletal muscle mitochondria, with little consideration given to the kidney cortex or OM mitochondria. To address these limitations, our study measured H2O2 emission in the heart and kidney cortex and OM mitochondria using both NADH-linked and FADH2-linked substrates, followed by the addition of various doses of AA, a CIII inhibitor that blocks electron flow at the IIIQi site on the N-side.
We observed a significant increase in the rate of H2O2 emission when the IIIQi site was inhibited by AA in the heart and kidney OM mitochondria respiring with PM while no changes were observed in the presence of SUC. In the heart and kidney OM mitochondria respiring under PM, the significant increase in the H2O2 emission rate after AA addition could potentially be attributed to secondary effects of IIIQi site inhibition, allowing electrons to move upstream in the ETC and leak from the IIIQo site of CIII and/or IQ site of CI. Furthermore, the absence of significant changes in the rate of mitochondrial H2O2 emission in the presence of SUC suggests that contributions of IQ site of CI (RET-mediated ROS), IIF and/or IIQ sites of CII dominate over the contribution of CIII in these tissues. In the kidney cortex mitochondria respiring with PM or SUC, inhibition of IIIQi of CIII by AA did not lead to a significant change in the rate of H2O2 emission, indicating that CIII is not a major contributor to mitochondrial H2O2 emission in this tissue. In the three tissues, ΔΨm significantly depolarized upon addition of AA to isolated mitochondria in the presence of either substrate. Despite the ΔΨm depolarization, the rate of H2O2 emission did not decrease suggesting that the changes in mitochondrial H2O2 emission were primarily driven by the site-specific contributions rather than ΔΨm alterations.
Effect of KCN inhibition of CIV on tissue-specific and substrate-dependent mitochondrial H2O2 emission and ΔΨm relationship.
Complex IV (CIV), also known as cytochrome c oxidase, is the terminal enzyme in the mitochondrial respiratory chain. It catalyzes the reduction of O2 to H2O while simultaneously pumping four protons across IMM. During the catalytic cycle of CIV four reduction steps occur, each resulting in the formation of one molecule of H2O and translocation of one proton across IMM. The electron transfer begins at CytCred, progresses through a dicopper complex CuA, and subsequently reaches the low-spin heme a. Finally, O2 reduction takes place in the binuclear active cite (BNC), composed of a mononuclear copper complex CuB and a high-spin heme a3 [18, 79, 80]. While it is established that CIV is susceptible to ROS production, there is a limited number of experimental or computational studies investigating the relation between CIV bioenergetics and the dynamics of H2O2 emission [18, 81].
Ramzan et al. conducted a study on the impact of high ATP/ADP on CIV activity. They observed that despite mitochondrial respiration and ΔΨm remaining constant, there was a significant reduction in the production of mitochondrial H2O2. They concluded that this decrease in mitochondrial emission was solely attributed to the binding of ATP to CIV, leading to static respiration and ΔΨm [81]. Potassium cyanide (KCN) is a well-known inhibitor of CIV. It binds to the heme a3-CuB binuclear center, blocking both oxygen utilization, and consequently, ATP production [82]. However, most of the studies examining the effects of KCN have been conducted in the heart or skeletal muscle mitochondria, without considering the kidney cortex or OM mitochondria. To address these limitations, we measured the rate of H2O2 emission in the heart and kidney cortex and OM mitochondria in the presence of both NADH-linked and FADH2-linked substrates followed by an array of KCN additions, which inhibit CIV.
We did not observe significant reductions in the rate of H2O2 emission after inhibition of CIV by KCN in the heart and kidney OM mitochondria respiring with PM despite significant reduction in the presence of SUC. In the kidney cortex mitochondria, the rate of H2O2 emission was reduced significantly after CIV inhibition by KCN in the presence of either substrate. In all tissues, the titration of KCN led to significant depolarization of ΔΨm, with a greater reduction observed in the presence of SUC compared to PM. This difference in ΔΨm depolarization could be attributed to the varying number of complexes involved in proton translocation across the IMM, which in turn contributes to the maintenance of ΔΨm. When mitochondria are oxidizing PM, complexes CI, CIII, and CIV all contribute to proton pumping, thereby increasing ΔΨm. However, when mitochondria are oxidizing SUC, only CIII and CIV contribute to proton translocation across IMM, potentially resulting in a different ΔΨm response. Therefore, changes in the rate of mitochondrial H2O2 emission in all tissues could be potentially attributed to ΔΨm depolarization rather than site contribution.
KCN is also known to inhibit the activity of the scavenging enzyme catalase, which can potentially lead to an increase in H2O2 emission rate. However, based on our experiments, we did not observe any changes in the rate of H2O2 emission after KCN addition to the heart and kidney cortex and OM mitochondria. This finding aligns with previous reports suggesting that catalase has a negligible contribution to ROS scavenging within mitochondria.
Effects of AF inhibition of TRX and DNCB inhibition of GSH scavenging systems on tissue-specific and substrate-dependent mitochondrial H2O2 emission and ΔΨm relationship.
The thioredoxin system consists of three proteins: thioredoxin (TRX), thioredoxin reductase (TRXR), and peroxiredoxin (PRX). This system plays a crucial role in reducing harmful H2O2 to H2O through two redox reactions. First, TRXR catalyzes the reduction of TRXox to TRXred using NADPH as a redox cofactor (electron donor). Second, H2O2 is reduced to H2O by PRX, using TRXred as an electron donor [83, 84]. Auranofin is a commonly used inhibitor of the TRX system, which binds to the selenocysteine of reduced TRXR, thereby inhibiting the scavenging activity of this system. This compound is also utilized for treatment of various diseases [85].
The glutathione system comprises of glutathione (GSH), glutathione reductase (GR), and glutathione peroxidase (GPx) proteins, which also play a vital role in reducing harmful H2O2 to H2O through two redox reactions. GR facilitates the reduction of oxidized glutathione disulfide (GSSG) to reduced GSH by utilizing NADPH as a redox cofactor (electron donor). Subsequently, GPx catalyzes the reduction of H2O2 to H2O using GSH as the electron donor [19, 86]. GR maintains the reduced state of the mitochondrial GSH pool by coupling glutathione disulfide (GSSG) reduction to the matrix NADP pool (Eh ~ −415 mV) [87]. 1-Chloro-2,4-dinitrobenzene (CDNB or DNCB) is a substrate for GST that leads to the depletion of GSH by forming 1-S-glutathionyl-2,4-dinitrobenzene (GSDNB) [87, 88]. DNCB is used to enhance function of immune system in immune-compromised diseases like HIV.
Kudin et al. [89] reported that in the rat brain mitochondria, the thioredoxin (TRX) system contributed to ~ 60±20% of H2O2 detoxification, while the glutathione (GSH) system contributed ~ 20±15%. Similarly, Drechsel et al. [90] found that the TRX system accounted for 80% of H2O2 detoxification, whereas the GSH system contributed minimally (25%) in rat brain mitochondria. A study conducted by Aon et al. [19] demonstrated that inhibition of both TRX and GSH systems in mouse, rat, and guinea pig mitochondria resulted in 17-fold, 11-fold, and 6-fold increase, respectively, in the rate of H2O2 emission during the mitochondrial leak state. Additionally, Stanley et al. [91] observed a significant increase in the H2O2 emission rate after TRX inhibition in mouse and guinea pig heart mitochondria, independent from changes in ΔΨm and/or NAD(P)H. However, the question of the relative contributions of the TRX and GSH systems to mitochondrial H2O2 detoxification remains unresolved. Furthermore, most of these studies have been conducted in the heart, brain or skeletal muscle mitochondria, and none considers the kidney cortex or OM mitochondria. To address these limitations, we measured the rate of H2O2 emission in the heart and kidney cortex and OM mitochondria in the presence of both NADH-linked and FADH2-linked substrates followed by AF additions which inhibit TRX scavenging system or DNCB additions which inhibit GSH scavenging system.
We did not observe significant increase in the rate of H2O2 emission after inhibition of TRX system by AF addition in the heart and kidney OM mitochondria oxidizing PM. This lack of response could be attributed to the negligible H2O2 produced in the presence of PM. However, a significant increase in the rate of H2O2 emission after inhibition of TRX system by AF was observed in in the heart and kidney OM mitochondria respiring with SUC suggesting that TRX system has significant contribution to mitochondrial H2O2 detoxification in these tissues. In the kidney cortex mitochondria, no significant changes were observed in the H2O2 emission rate in the presence of either substrate indicating that the TRX system does not play a significant role in mitochondrial H2O2 scavenging in this tissue.
In contrast, a significant increase in the rate of H2O2 emission was observed in the heart, kidney cortex, and OM mitochondria respiring with either PM or SUC after inhibiting the GSH system by DNCB. This finding suggests a substantial contribution of the GSH system to mitochondrial H2O2 scavenging in these tissues. The GSH system exhibited a 2-fold higher contribution than the than TRX system to mitochondrial H2O2 scavenging. Importantly, these changes in the rate of H2O2 emission were solely attributed to the inhibition of scavenging systems and were independent of ΔΨm, as no changes were observed in ΔΨm upon addition of AF or DNCB.
Effect of OxPhos uncoupling by FCCP on tissue-specific and substrate-dependent mitochondrial H2O2 emission and ΔΨm relationship.
FCCP, a protonophore, is known to induce mitochondrial uncoupling of OxPhos by increasing the influx of protons to the mitochondrial matrix. Multiple studies have reported that the development and progression of heart [92] and kidney [93] failure is associated with mitochondrial uncoupling of OxPhos, which challenges the production of ATP, enhances oxidative stress, and facilitates organ failure. In a study by Chen et al. [49], a defensive mechanism was identified that can mitigate mitochondrial H2O2 emission. According to their findings, elevation in mitochondrial H2O2 emission, which is mostly generated from electron leakage from the ETC, can activate a defensive feedback mechanism to reduce mitochondrial H2O2 emission. This response is achieved by promoting proton leak and decreasing ΔΨm [49]. However, most of these studies have been conducted in the heart or skeletal muscle mitochondria, and none considers the kidney cortex or OM mitochondria. To address these limitations, we measured the rate of H2O2 emission in the heart and kidney cortex and OM mitochondria in the presence of both NADH-linked and FADH2-linked substrates followed by FCCP additions and increasing proton leak which simulates diseased conditions.
In this study, we employed FCCP to induce a protective response in isolated mitochondria by promoting proton leak and uncoupling of OxPhos. Upon addition of FCCP to the heart and kidney OM mitochondria, a significant reduction in ΔΨm and H2O2 emission was observed. This response can be attributed to the increased proton leak which disrupts the coupling of OxPhos and causes a reduction in ΔΨm. As a compensatory mechanism, the ETC operates at an elevated rate to counterbalance the decrease in ΔΨm, resulting in an augmented proton motive force. Consequently, the higher proton motive force reduces electron leakage and subsequently lowers H2O2 emission from the mitochondria. In the kidney cortex mitochondria, a significant reduction in ΔΨm was observed, although there was only a slight reduction in H2O2 emission. This finding suggests that the ETC may not be a primary contributor to mitochondrial H2O2 production in this particular tissue.
Effect of GSK inhibition of NOX2 on tissue-specific and substrate-dependent mitochondrial H2O2 emission and ΔΨm relationship.
The cell membrane NOX2 isoform oxidizes NADPH to NADP and reduces O2 to which is then promptly reduced to H2O2 by SOD1. H2O2 can freely diffuse across cytosolic compartments or be eliminated by scavenging systems present in the cytosolic compartments or mitochondria. Recent studies have highlighted the existence of a feed-forward regulation between cell membrane NOX2 and mitochondria, demonstrating their interplay in H2O2 emission [3, 39, 40]. Hirano et al. [42] first discovered that GSK2795039 molecule inhibits NOX2 in a competitive manner (competing with NADPH for binding to NOX2) as the inhibitor specific to NOX2. Ohsaki et al. [41] found evidence of feed-forward signaling from the kidney medullary thick ascending limb mitochondria to membrane NOXs. Dikalov et al. [3] reported that the crosstalk between mitochondria- and NOX-mediated ROS production can be pharmacologically targeted under oxidative stress condition. However, there is currently a lack of comprehensive studies focusing on the stimulation of NOX2- mediated on mitochondrial H2O2 emission and the following crosstalk effect in the heart, kidney cortex and OM mitochondria does not exist. To address this knowledge gap, we measured the rate of H2O2 emission in the heart and kidney cortex and OM mitochondria in the presence of both NADH-linked and FADH2-linked substrates followed by NOX2 inhibition by GSK
In our study, we observed a significant reduction in the rate of H2O2 emission in the heart, kidney cortex and OM mitochondria after addition of GSK, regardless of the substrate used. Notably, we did not observe any changes in the ΔΨm suggesting that the effect of GSK is independent from ΔΨm. These findings are consistent with previous knowledge regarding the stimulatory role of NOX2 on mitochondrial ROS production through retrograde signaling (RIRR). It is plausible that NOX2 is present in the experimental buffer either due to contamination during isolation or as part of the mitochondrial membrane. The immediate emission of H2O2 after addition of kidney cortex mitochondria to the AR buffer indicates that the major sites of mtROS production in this tissue may differ from the ETC complexes and operate independently of mitochondrial substrate oxidation. The reduction in mitochondrial H2O2 emission rate after GSK addition was more pronounced in the kidney cortex mitochondria compared to heart or kidney OM mitochondria. These results suggest that NOX2-mediated production plays a major role in mtROS production specifically in the kidney cortex mitochondria. In the heart and kidney OM mitochondria, NOX2-mediated ROS contributes to mtROS production, albeit to a lesser extent than in the kidney cortex.
Comparison of tissue-specific and substrate-dependent mitochondrial H2O2 emission and ΔΨm relationships – An integrated view.
Upon inhibition of IQ site of CI by ROT, in the heart and kidney OM mitochondria oxidizing PM, the changes in the mitochondrial H2O2 emission rate were negatively correlated with ΔΨm, indicating that alterations in the H2O2 emission rate are primarily due to site-specific effects rather than changes in ΔΨm. However, no correlation was observed between H2O2 emission rate and ΔΨm in the presence of SUC (Figure 5). Upon inhibition of IIIQo site of CIII by AA in the heart, kidney cortex and OM mitochondria respiring under PM or SUC, the H2O2 emission rate was negatively correlated with ΔΨm, indicating that any changes in the H2O2 emission rate are primarily due to site-specific effects rather than ΔΨm changes. Upon inhibition of IIQ site of CII by TTFA, inhibition of CIV by KCN, and uncoupling OxPhos by FCCP, in the heart, kidney cortex and OM mitochondria respiring with PM or SUC, the changes in the H2O2 emission rate were positively correlated with ΔΨm (Figure 6, 8, and 11 A–C and J–L). This suggests that the reduction in the rate of H2O2 emission could be partially or fully attributed to ΔΨm reduction rather than site alteration.
In the heart and kidney OM mitochondria respiring with SUC, the rate of H2O2 emission after inhibition of IQ site of CI by ROT was 5 times less than the rate of H2O2 emission after the inhibition of IIQ site of CII by TTFA. The ΔΨm did not change in response to CI inhibition by ROT, despite significant depolarization in response to CII inhibition by TTFA. The 5-fold smaller reduction of the H2O2 emission rate in response to ROT addition compared to TTFA addition can possibly be elucidated by the participation of the IIF site, as well as the IIQ site, to the mtROS production or can possibly be elucidated because of no changes in ΔΨm. The smaller H2O2 emission rate after TTFA addition compared to ROT can possibly be a direct effect of TTFA’s inhibition of the IIQ site of CII as a plausible major contributor to mtROS production and/or indirect effect of TTFA’s inhibition of the IIQ site of CII leading to the production and accumulation of OXA which inhibits the IIF site of CII as another potential major contributor to mtROS emission.
In the heart mitochondria the final concentration of H2O2 as a result of RET (in the presence of SUC) is more than the final concentration of H2O2 after inhibition of IQ site of CI by ROT in the presence of PM and less than the final concentration of H2O2 after inhibition of IIIQo site of CIII by AA addition in the presence of PM. These findings suggest that the contribution of IIIQo site of CIII to mitochondrial H2O2 emission in the heart is considerably high. Similarly, Brand et al. [76] reported that the contribution of IIIQo of CIII to mitochondrial production is greater than IQ site of CI, and the contribution of IQ of CI is greater than IIF of CII in rat skeletal muscle mitochondria. Wong et al. [77] also found that the contribution of IIIQo site of CIII to mitochondrial production is ~ 2-fold higher than the contribution of IQ site of CI. In the kidney OM mitochondria, the final concentration of H2O2 as a result of RET (in the presence of SUC) is significantly less than the final concentration of H2O2 after inhibition of IQ site of CI by ROT in the presence of PM and after inhibition of IIIQo site of CIII by AA addition in the presence of PM. These results suggest that the contribution of the IIIQo site to mtROS production is negligible in kidney OM mitochondria. In the kidney cortex mitochondria, the final concentration of H2O2 as a result of RET (in the presence of SUC) is significantly less than the final concentration of H2O2 after inhibition of IQ site of CI by ROT in the presence of PM and after inhibition of IIIQo site of CIII by AA addition in the presence of PM. These results suggest that the contribution of IIIQo site to mtROS production is negligible in kidney cortex mitochondria.
Upon inhibition of TRX scavenging system by AF, the GSH scavenging system by DNCB, and NOX2 by GSK, in the heart, kidney cortex and OM mitochondria respiring with PM or SUC, no correlation was observed between the H2O2 emission rate and ΔΨm showing that changes in the mitochondrial H2O2 emission were independent from ΔΨm (Figures 9, 10, and 12 A–C and J–L). In the heart and kidney OM mitochondria, the contribution of the GSH scavenging system to H2O2 degradation is 1.5-fold higher than the TRX scavenging system. In the kidney cortex TRX system did not contribute to mitochondrial H2O2 degradation, despite significant contribution of GSH scavenging system to H2O2 degradation. In the kidney cortex mitochondria contribution of NOX2-mediated H2O2 emission is significantly higher than in heart and kidney OM mitochondria.
LIMITATIONS and FUTURE DIRECTIONS
One of the major limitations of the current study is that we did not consider the potential contribution of the TCA cycle enzymes to the overall mitochondrial H2O2 emission. This assumption was made based on knowledge TCA cycle enzymes are not considered as major contributors to mtROS production. However, to accurately quantify the contribution of these enzymes to mtROS production, future studies will involve inhibiting specific TCA cycle enzymes such as pyruvate dehydrogenase (PDH) and alpha-ketoglutarate dehydrogenase (AKGDH), followed by measuring mitochondrial H2O2 emission under identical conditions. This will provide a more comprehensive understanding of the specific sites involved in mtROS production.
Another limitation of the current study is that we did not investigate how changes in the redox pools such as NAD pool and FAD pool affect mtROS production and bioenergetics. The reason for this assumption is that the measured mitochondrial H2O2 emission in the respiration buffer is a result of changes in redox ratios. However, to precisely quantify the major components that contribute to mitochondrial H2O2 emission, we will measure redox ratios including NADH/NAD ratio in the future. This will allow us to distinguish whether the changes in mtROS production are due to production at different sites or alterations within redox pools in the mitochondrial matrix. By incorporating these measurements, we would aim to gain a better understanding of how alternations in mitochondrial respiration, bioenergetics, and ROS production and scavenging contribute to the development and progression of cardiac and renal diseases such as salt-sensitive hypertension.
SUMMARY and CONCLUSION
In this study, our focus was to investigate mitochondrial respiration, bioenergetics (ΔΨm), and ROS emission in isolated mitochondria derived from the heart and kidney cortex and OM. Previous research on mtROS emission has primarily concentrated on the heart and skeletal muscle mitochondria, with limited information available for kidney mitochondria. Additionally, the quantitative interplay between mtROS production and scavenging systems remains poorly understood in various tissue and organ systems. To address these gaps, we conducted a systematic and quantitative analysis to characterize the contributions of different components involved in ROS production and scavenging, thereby providing insights into overall mtROS emission. We employed experimental approaches utilizing isolated mitochondria from the cardiac muscle (heart) as well as the epithelial tissues of the kidney cortex and OM. By utilizing NADH-linked substrate pyruvate+malate (PM) and FADH2-linked substrate succinate (SUC), we assessed mitochondrial respiration, bioenergetics, and ROS emission. Additionally, we introduced various substances that selectively inhibit different components of the electron transport chain (ETC) and oxidative phosphorylation (OxPhos) and other ROS producing (e.g., NOX2 enzyme) and ROS scavenging systems. Furthermore, we examined ROS scavenging systems to determine their influence on mtROS emission.
Through this comprehensive analysis, we aimed to provide a thorough understanding of the quantitative contributions of different ROS production and scavenging components to the overall mtROS emission. Our study emphasizes the importance of investigating these processes in diverse tissue and organ systems, expanding our knowledge of mtROS dynamics and their implications in various physiological and pathological contexts. Our findings provide valuable insights into the sources of mitochondrial ROS emission in the heart, kidney OM, and kidney cortex mitochondria. In the heart and kidney OM mitochondria, we identified the IIQ site at CII as the primary source of mtROS production. Conversely, in the kidney cortex mitochondria, inhibition of NOX2 by GSK had the most significant impact on reducing mitochondrial H2O2 emission compared to other sources such as CI, CII, and CIII of the ETC. Furthermore, we examined the contributions of ROS scavenging systems, specifically the TRX and GSH scavenging systems. Our results demonstrate that the GSH scavenging system had a significantly higher contribution than the TRX scavenging system in all three tissues. We also investigated the effects of ΔΨm depolarization resulting from ADP addition on mitochondrial H2O2 emission in comparison to other factors such as CI inhibition during RET, mitochondria uncoupling, and NOX2 inhibition. In the kidney cortex mitochondria, the effects of ΔΨm depolarization as a result of ADP addition on mitochondrial H2O2 emission and CII inhibition on mtROS production were more substantial than those of CI inhibition and mitochondrial uncoupling.
The findings enhance our understanding of the complex interplay between mitochondrial ETC, OxPhos, and ROS production and scavenging systems. They provide crucial insights into tissue-specific and substrate-dependent mitochondrial respiratory and bioenergetic functions, as well as ROS emission. Moreover, these findings shed light on the role of excessive ROS emission, oxidative stress, and mitochondrial dysfunction in the pathogenesis of cardiovascular and renal diseases, including salt-sensitive hypertension. Overall, the study provides a foundation for the development of targeted therapeutic approaches that address mitochondrial dysfunctions and its implications in cardiovascular and renal diseases. By specifically targeting the identified sources of mtROS production and modulating ROS scavenging systems may enable restoration of mitochondrial homeostasis and alleviate the pathological consequences of mitochondrial dysfunction in the heart and kidney.
Highlights:
Tissue/substrate-specific mitochondrial bioenergetics and ROS emission were studied
Contributions of different ROS sources and scavenging components were characterized
Primary source of ROS in the heart and kidney OM mitochondria was Q site of CII
Primary source of ROS in the kidney cortex mitochondria was NOX2
GSH system had a higher contribution towards ROS scavenging than TRX system
ACKNOWLEDGEMENT
This work was supported by the NIH grant R01-HL151587 and NSF grant DMS 2153387.
Footnotes
Publisher's Disclaimer: This is a PDF file of an unedited manuscript that has been accepted for publication. As a service to our customers we are providing this early version of the manuscript. The manuscript will undergo copyediting, typesetting, and review of the resulting proof before it is published in its final form. Please note that during the production process errors may be discovered which could affect the content, and all legal disclaimers that apply to the journal pertain.
AUTHORSHIP CONTRIBUTION
Shima Sadri: Conceptualization; Methodology; Data collection; Data analysis; Investigation; Writing - Original draft; Writing - Review and editing
Namrata Tomar: Conceptualization; Methodology; Data collection
Chun Yang: Conceptualization; Methodology; Investigation
Said H. Audi: Investigation; Writing - Review and editing
Allen W. Cowley Jr.: Conceptualization; Methodology; Investigation; Supervision; Writing - Review and editing; Funding acquisition
Ranjan K. Dash: Conceptualization; Methodology; Data analysis; Investigation; Supervision; Writing - Review and Editing; Project administration; Funding acquisition
DECLARATION OF COMPETING INTEREST
The authors declare that they have no known competing financial interests or personal relationships that could have appeared to influence the work reported in this paper.
REFERENCES
- 1.Dan Dunn J, et al. , Reactive oxygen species and mitochondria: A nexus of cellular homeostasis. Redox Biol, 2015. 6: p. 472–485. [DOI] [PMC free article] [PubMed] [Google Scholar]
- 2.Sedeek M, et al. , NADPH oxidases, reactive oxygen species, and the kidney: friend and foe. J Am Soc Nephrol, 2013. 24(10): p. 1512–8. [DOI] [PMC free article] [PubMed] [Google Scholar]
- 3.Dikalov S, Cross talk between mitochondria and NADPH oxidases. Free Radic Biol Med, 2011. 51(7): p. 1289–301. [DOI] [PMC free article] [PubMed] [Google Scholar]
- 4.Starkov AA, The role of mitochondria in reactive oxygen species metabolism and signaling. Annals of the New York Academy of Sciences, 2008. 1147: p. 37–52. [DOI] [PMC free article] [PubMed] [Google Scholar]
- 5.Murphy MP, How mitochondria produce reactive oxygen species. Biochem J, 2009. 417(1): p. 1–13. [DOI] [PMC free article] [PubMed] [Google Scholar]
- 6.Panday A, et al. , NADPH oxidases: an overview from structure to innate immunityassociated pathologies. Cell Mol Immunol, 2015. 12(1): p. 5–23. [DOI] [PMC free article] [PubMed] [Google Scholar]
- 7.Moghadam ZM, Henneke P, and Kolter J, From Flies to Men: ROS and the NADPH Oxidase in Phagocytes. Front Cell Dev Biol, 2021. 9: p. 628991. [DOI] [PMC free article] [PubMed] [Google Scholar]
- 8.Alfadda AA and Sallam RM, Reactive oxygen species in health and disease. J Biomed Biotechnol, 2012. 2012: p. 936486. [DOI] [PMC free article] [PubMed] [Google Scholar]
- 9.Brieger K, et al. , Reactive oxygen species: from health to disease. Swiss Med Wkly, 2012. 142: p. w13659. [DOI] [PubMed] [Google Scholar]
- 10.San-Millán I, The Key Role of Mitochondrial Function in Health and Disease. Antioxidants, 2023. 12(4). [DOI] [PMC free article] [PubMed] [Google Scholar]
- 11.Brand MD, et al. , The role of mitochondrial function and cellular bioenergetics in ageing and disease. Br J Dermatol, 2013. 169 Suppl 2(0 2): p. 1–8. [DOI] [PMC free article] [PubMed] [Google Scholar]
- 12.Ramaccini D, et al. , Mitochondrial Function and Dysfunction in Dilated Cardiomyopathy. Front Cell Dev Biol, 2020. 8: p. 624216. [DOI] [PMC free article] [PubMed] [Google Scholar]
- 13.Ho HJ and Shirakawa H, Oxidative Stress and Mitochondrial Dysfunction in Chronic Kidney Disease. Cells, 2022. 12(1). [DOI] [PMC free article] [PubMed] [Google Scholar]
- 14.Zhou B and Tian R, Mitochondrial dysfunction in pathophysiology of heart failure. J Clin Invest, 2018. 128(9): p. 3716–3726. [DOI] [PMC free article] [PubMed] [Google Scholar]
- 15.Zhang X, Agborbesong E, and Li X, The Role of Mitochondria in Acute Kidney Injury and Chronic Kidney Disease and Its Therapeutic Potential. Int J Mol Sci, 2021. 22(20). [DOI] [PMC free article] [PubMed] [Google Scholar]
- 16.Chenna S, et al. , Mechanisms and mathematical modeling of ROS production by the mitochondrial electron transport chain. Am J Physiol Cell Physiol, 2022. 323(1): p. C69–C83. [DOI] [PubMed] [Google Scholar]
- 17.Scialo F, Fernandez-Ayala DJ, and Sanz A, Role of Mitochondrial Reverse Electron Transport in ROS Signaling: Potential Roles in Health and Disease. Front Physiol, 2017. 8: p. 428. [DOI] [PMC free article] [PubMed] [Google Scholar]
- 18.Zhao RZ, et al. , Mitochondrial electron transport chain, ROS generation and uncoupling (Review). Int J Mol Med, 2019. 44(1): p. 3–15. [DOI] [PMC free article] [PubMed] [Google Scholar]
- 19.Aon MA, et al. , Glutathione/thioredoxin systems modulate mitochondrial H2O2 emission: an experimental-computational study. J Gen Physiol, 2012. 139(6): p. 479–91. [DOI] [PMC free article] [PubMed] [Google Scholar]
- 20.Korge P, Calmettes G, and Weiss JN, Increased reactive oxygen species production during reductive stress: The roles of mitochondrial glutathione and thioredoxin reductases. Biochim Biophys Acta, 2015. 1847(6–7): p. 514–25. [DOI] [PMC free article] [PubMed] [Google Scholar]
- 21.Li X, et al. , Targeting mitochondrial reactive oxygen species as novel therapy for inflammatory diseases and cancers. Journal of Hematology & Oncology, 2013: p. 19. [DOI] [PMC free article] [PubMed] [Google Scholar]
- 22.Buettner GR, Superoxide dismutase in redox biology: the roles of superoxide and hydrogen peroxide. Anticancer Agents Med Chem, 2011. 11(4): p. 341–6. [DOI] [PMC free article] [PubMed] [Google Scholar]
- 23.Audi SH, et al. , Detection of hydrogen peroxide production in the isolated rat lung using Amplex red. Free Radic Res, 2018. 52(9): p. 1052–1062. [DOI] [PMC free article] [PubMed] [Google Scholar]
- 24.Grivennikova VG, Kozlovsky VS, and Vinogradov AD, Respiratory complex II: ROS production and the kinetics of ubiquinone reduction. Biochim Biophys Acta Bioenerg, 2017. 1858(2): p. 109–117. [DOI] [PubMed] [Google Scholar]
- 25.Peoples JN, et al. , Mitochondrial dysfunction and oxidative stress in heart disease. Exp Mol Med, 2019. 51(12): p. 1–13. [DOI] [PMC free article] [PubMed] [Google Scholar]
- 26.Quinlan CL, et al. , Native rates of superoxide production from multiple sites in isolated mitochondria measured using endogenous reporters. Free Radic Biol Med, 2012. 53(9): p. 1807–17. [DOI] [PMC free article] [PubMed] [Google Scholar]
- 27.Aranda-Rivera AK, et al. , Mitochondrial Redox Signaling and Oxidative Stress in Kidney Diseases. Biomolecules, 2021. 11(8). [DOI] [PMC free article] [PubMed] [Google Scholar]
- 28.Zorov DB, Juhaszova M, and Sollott SJ, Mitochondrial reactive oxygen species (ROS) and ROS-induced ROS release. Physiol Rev, 2014. 94(3): p. 909–50. [DOI] [PMC free article] [PubMed] [Google Scholar]
- 29.Edwards A, Palm F, and Layton AT, A model of mitochondrial O(2) consumption and ATP generation in rat proximal tubule cells. Am J Physiol Renal Physiol, 2020. 318(1): p. F248–F259. [DOI] [PMC free article] [PubMed] [Google Scholar]
- 30.Gauthier LD, et al. , An integrated mitochondrial ROS production and scavenging model: implications for heart failure. Biophys J, 2013. 105(12): p. 2832–42. [DOI] [PMC free article] [PubMed] [Google Scholar]
- 31.Kuznetsov AV, et al. , The Complex Interplay between Mitochondria, ROS and Entire Cellular Metabolism. Antioxidants (Basel), 2022. 11(10). [DOI] [PMC free article] [PubMed] [Google Scholar]
- 32.Kamunde C, Sharaf M, and MacDonald N, H(2)O(2) metabolism in liver and heart mitochondria: Low emitting-high scavenging and high emitting-low scavenging systems. Free Radic Biol Med, 2018. 124: p. 135–148. [DOI] [PubMed] [Google Scholar]
- 33.Bedard K and Krause KH, The NOX family of ROS-generating NADPH oxidases: physiology and pathophysiology. Physiol Rev, 2007. 87(1): p. 245–313. [DOI] [PubMed] [Google Scholar]
- 34.Vermot A, et al. , NADPH Oxidases (NOX): An Overview from Discovery, Molecular Mechanisms to Physiology and Pathology. Antioxidants (Basel), 2021. 10(6). [DOI] [PMC free article] [PubMed] [Google Scholar]
- 35.Gray SP, Shah AM, and Smyrnias I, NADPH oxidase 4 and its role in the cardiovascular system. Vasc Biol, 2019. 1(1): p. H59–H66. [DOI] [PMC free article] [PubMed] [Google Scholar]
- 36.Li JM, et al. , Activation of NADPH oxidase during progression of cardiac hypertrophy to failure. Hypertension, 2002. 40(4): p. 477–84. [DOI] [PubMed] [Google Scholar]
- 37.Cowley AW Jr., et al. , Evidence of the Importance of Nox4 in Production of Hypertension in Dahl Salt-Sensitive Rats. Hypertension, 2016. 67(2): p. 440–50. [DOI] [PMC free article] [PubMed] [Google Scholar]
- 38.Zheleznova NN, Yang C, and Cowley AW Jr., Role of Nox4 and p67phox subunit of Nox2 in ROS production in response to increased tubular flow in the mTAL of Dahl salt-sensitive rats. Am J Physiol Renal Physiol, 2016. 311(2): p. F450–8. [DOI] [PMC free article] [PubMed] [Google Scholar]
- 39.Nazarewicz RR, et al. , Nox2 as a potential target of mitochondrial superoxide and its role in endothelial oxidative stress. Am J Physiol Heart Circ Physiol, 2013. 305(8): p. H1131–40. [DOI] [PMC free article] [PubMed] [Google Scholar]
- 40.Fukai T and Ushio-Fukai M, Cross-Talk between NADPH Oxidase and Mitochondria: Role in ROS Signaling and Angiogenesis. Cells, 2020. 9(8). [DOI] [PMC free article] [PubMed] [Google Scholar]
- 41.Ohsaki Y, et al. , Increase of sodium delivery stimulates the mitochondrial respiratory chain H2O2 production in rat renal medullary thick ascending limb. Am J Physiol Renal Physiol, 2012. 302(1): p. F95–F102. [DOI] [PMC free article] [PubMed] [Google Scholar]
- 42.Hirano K, et al. , Discovery of GSK2795039, a Novel Small Molecule NADPH Oxidase 2 Inhibitor. Antioxid Redox Signal, 2015. 23(5): p. 358–74. [DOI] [PMC free article] [PubMed] [Google Scholar]
- 43.Zhang Y, et al. , NADPH oxidases and oxidase crosstalk in cardiovascular diseases: novel therapeutic targets. Nat Rev Cardiol, 2020. 17(3): p. 170–194. [DOI] [PMC free article] [PubMed] [Google Scholar]
- 44.Vergun O, Votyakova TV, and Reynolds IJ, Spontaneous changes in mitochondrial membrane potential in single isolated brain mitochondria. Biophys J, 2003. 85(5): p. 3358–66. [DOI] [PMC free article] [PubMed] [Google Scholar]
- 45.Suzuki Y and Lehrer RI, NAD(P)H oxidase activity in human neutrophils stimulated by phorbol myristate acetate. J Clin Invest, 1980. 66(6): p. 1409–18. [DOI] [PMC free article] [PubMed] [Google Scholar]
- 46.Starkov AA and Fiskum G, Regulation of brain mitochondrial H2O2 production by membrane potential and NAD(P)H redox state. Journal of neurochemistry, 2003. 86(5): p. 1101–7. [DOI] [PubMed] [Google Scholar]
- 47.Daiber A, Redox signaling (cross-talk) from and to mitochondria involves mitochondrial pores and reactive oxygen species. Biochim Biophys Acta, 2010. 1797(6–7): p. 897–906. [DOI] [PubMed] [Google Scholar]
- 48.Daiber A, et al. , Crosstalk of mitochondria with NADPH oxidase via reactive oxygen and nitrogen species signalling and its role for vascular function. Br J Pharmacol, 2017. 174(12): p. 1670–1689. [DOI] [PMC free article] [PubMed] [Google Scholar]
- 49.Cheng J, et al. , Mitochondrial Proton Leak Plays a Critical Role in Pathogenesis of Cardiovascular Diseases. Adv Exp Med Biol, 2017. 982: p. 359–370. [DOI] [PMC free article] [PubMed] [Google Scholar]
- 50.Jastroch M, et al. , Mitochondrial proton and electron leaks. Essays Biochem, 2010. 47: p. 53–67. [DOI] [PMC free article] [PubMed] [Google Scholar]
- 51.Tomar N, et al. , Substrate-dependent differential regulation of mitochondrial bioenergetics in the heart and kidney cortex and outer medulla. Biochim Biophys Acta Bioenerg, 2022. 1863(2): p. 148518. [DOI] [PMC free article] [PubMed] [Google Scholar]
- 52.Zhang X, et al. , Substrate- and Calcium-Dependent Differential Regulation of Mitochondrial Oxidative Phosphorylation and Energy Production in the Heart and Kidney. Cells, 2021. 11(1). [DOI] [PMC free article] [PubMed] [Google Scholar]
- 53.Bradford MM, A rapid and sensitive method for the quantitation of microgram quantities of protein utilizing the principle of protein-dye binding. Anal Biochem, 1976. 72: p. 248–54. [DOI] [PubMed] [Google Scholar]
- 54.Scaduto RC Jr. and Grotyohann LW, Measurement of mitochondrial membrane potential using fluorescent rhodamine derivatives. Biophys J, 1999. 76(1 Pt 1): p. 469–77. [DOI] [PMC free article] [PubMed] [Google Scholar]
- 55.Huang M, et al. , Mitochondrial inner membrane electrophysiology assessed by rhodamine-123 transport and fluorescence. Ann Biomed Eng, 2007. 35(7): p. 1276–85. [DOI] [PMC free article] [PubMed] [Google Scholar]
- 56.Fink BD, Yu L, and Sivitz WI, Modulation of complex II-energized respiration in muscle, heart, and brown adipose mitochondria by oxaloacetate and complex I electron flow. FASEB Journal, 2019. 33: p. 11696–11705. [DOI] [PMC free article] [PubMed] [Google Scholar]
- 57.Fink BD, et al. , Oxaloacetic acid mediates ADP-dependent inhibition of mitochondrial complex II-driven respiration. Journal of Biological Chemistry, 2018. 293: p. 19932–19941. [DOI] [PMC free article] [PubMed] [Google Scholar]
- 58.Tretter L, Patocs A, and Chinopoulos C, Succinate, an intermediate in metabolism, signal transduction, ROS, hypoxia, and tumorigenesis. Biochim Biophys Acta, 2016. 1857(8): p. 1086–1101. [DOI] [PubMed] [Google Scholar]
- 59.Quinlan CL, et al. , The determination and analysis of site-specific rates of mitochondrial reactive oxygen species production. Methods Enzymol, 2013. 526: p. 189–217. [DOI] [PMC free article] [PubMed] [Google Scholar]
- 60.Quinlan CL, et al. , Sites of reactive oxygen species generation by mitochondria oxidizing different substrates. Redox Biol, 2013. 1: p. 304–12. [DOI] [PMC free article] [PubMed] [Google Scholar]
- 61.Fato R, et al. , Differential effects of mitochondrial Complex I inhibitors on production of reactive oxygen species. Biochim Biophys Acta, 2009. 1787(5): p. 384–92. [DOI] [PMC free article] [PubMed] [Google Scholar]
- 62.Onukwufor JO, Berry BJ, and Wojtovich AP, Physiologic Implications of Reactive Oxygen Species Production by Mitochondrial Complex I Reverse Electron Transport. Antioxidants (Basel), 2019. 8(8). [DOI] [PMC free article] [PubMed] [Google Scholar]
- 63.Hirst J, King MS, and Pryde KR, The production of reactive oxygen species by complex I. Biochemical Society transactions, 2008. 36(Pt 5): p. 976–80. [DOI] [PubMed] [Google Scholar]
- 64.Kussmaul L and Hirst J, The mechanism of superoxide production by NADH:ubiquinone oxidoreductase (complex I) from bovine heart mitochondria. Proceedings of the National Academy of Sciences of the United States of America, 2006. 103(20): p. 7607–12. [DOI] [PMC free article] [PubMed] [Google Scholar]
- 65.Muller FL, et al. , High rates of superoxide production in skeletal-muscle mitochondria respiring on both complex I- and complex II-linked substrates. Biochem J, 2008. 409(2): p. 491–9. [DOI] [PubMed] [Google Scholar]
- 66.Kushnareva Y, Murphy AN, and Andreyev A, Complex I-mediated reactive oxygen species generation: modulation by cytochrome c and NAD(P)+ oxidation-reduction state. Biochem J, 2002. 368(Pt 2): p. 545–53. [DOI] [PMC free article] [PubMed] [Google Scholar]
- 67.Zorov DB, et al. , Reactive oxygen species (ROS)-induced ROS release: a new phenomenon accompanying induction of the mitochondrial permeability transition in cardiac myocytes. J Exp Med, 2000. 192(7): p. 1001–14. [DOI] [PMC free article] [PubMed] [Google Scholar]
- 68.Zorov DB, Juhaszova M, and Sollott SJ, Mitochondrial ROS-induced ROS release: an update and review. Biochimica et biophysica acta, 2006. 1757(5–6): p. 509–17. [DOI] [PubMed] [Google Scholar]
- 69.Zorova LD, et al. , Mitochondrial membrane potential. Anal Biochem, 2018. 552: p. 50–59. [DOI] [PMC free article] [PubMed] [Google Scholar]
- 70.Quinlan CL, et al. , Mitochondrial complex II can generate reactive oxygen species at high rates in both the forward and reverse reactions. The Journal of biological chemistry, 2012. 287(32): p. 27255–64. [DOI] [PMC free article] [PubMed] [Google Scholar]
- 71.Siebels I and Drose S, Q-site inhibitor induced ROS production of mitochondrial complex II is attenuated by TCA cycle dicarboxylates. Biochim Biophys Acta, 2013. 1827(10): p. 1156–64. [DOI] [PubMed] [Google Scholar]
- 72.Drose S, Bleier L, and Brandt U, A common mechanism links differently acting complex II inhibitors to cardioprotection: modulation of mitochondrial reactive oxygen species production. Mol Pharmacol, 2011. 79(5): p. 814–22. [DOI] [PubMed] [Google Scholar]
- 73.Quinlan CL, et al. , Sites of reactive oxygen species generation by mitochondria oxidizing different substrates. Redox biology, 2013. 1(1): p. 304–12. [DOI] [PMC free article] [PubMed] [Google Scholar]
- 74.Bazil JN, et al. , Analysis of the kinetics and bistability of ubiquinol:cytochrome C oxidoreductase. Biophysical Journal, 2013. 105(2): p. 343–55. [DOI] [PMC free article] [PubMed] [Google Scholar]
- 75.Mazat JP, Devin A, and Ransac S, Modelling mitochondrial ROS production by the respiratory chain. Cell Mol Life Sci, 2020. 77(3): p. 455–465. [DOI] [PMC free article] [PubMed] [Google Scholar]
- 76.Brand MD, Mitochondrial generation of superoxide and hydrogen peroxide as the source of mitochondrial redox signaling. Free Radic Biol Med, 2016. 100: p. 14–31. [DOI] [PubMed] [Google Scholar]
- 77.Wong HS, Benoit B, and Brand MD, Mitochondrial and cytosolic sources of hydrogen peroxide in resting C2C12 myoblasts. Free Radic Biol Med, 2019. 130: p. 140–150. [DOI] [PubMed] [Google Scholar]
- 78.Quinlan CL, et al. , The mechanism of superoxide production by the antimycin-inhibited mitochondrial Q-cycle. The Journal of biological chemistry, 2011. 286(36): p. 31361–72. [DOI] [PMC free article] [PubMed] [Google Scholar]
- 79.Blomberg MR, Mechanism of Oxygen Reduction in Cytochrome c Oxidase and the Role of the Active Site Tyrosine. Biochemistry, 2016. 55(3): p. 489–500. [DOI] [PubMed] [Google Scholar]
- 80.Ishigami I, et al. , Proton translocation in cytochrome c oxidase: insights from proton exchange kinetics and vibrational spectroscopy. Biochim Biophys Acta, 2015. 1847(1): p. 98–108. [DOI] [PMC free article] [PubMed] [Google Scholar]
- 81.Ramzan R, et al. , Cytochrome c Oxidase Inhibition by ATP Decreases Mitochondrial ROS Production. Cells, 2022. 11(6). [DOI] [PMC free article] [PubMed] [Google Scholar]
- 82.Leavesley HB, et al. , Interaction of cyanide and nitric oxide with cytochrome c oxidase: implications for acute cyanide toxicity. Toxicol Sci, 2008. 101(1): p. 101–11. [DOI] [PubMed] [Google Scholar]
- 83.Pannala VR and Dash RK, Mechanistic characterization of the thioredoxin system in the removal of hydrogen peroxide. Free Radic Biol Med, 2015. 78: p. 42–55. [DOI] [PMC free article] [PubMed] [Google Scholar]
- 84.Pillay CS, Hofmeyr JH, and Rohwer JM, The logic of kinetic regulation in the thioredoxin system. BMC Syst Biol, 2011. 5: p. 15. [DOI] [PMC free article] [PubMed] [Google Scholar]
- 85.Zhang X, et al. , Repurposing of auranofin: Thioredoxin reductase remains a primary target of the drug. Biochimie, 2019. 162: p. 46–54. [DOI] [PubMed] [Google Scholar]
- 86.Pannala VR, et al. , A mechanistic mathematical model for the catalytic action of glutathione peroxidase. Free Radic Res, 2014. 48(4): p. 487–502. [DOI] [PMC free article] [PubMed] [Google Scholar]
- 87.Murphy MP, Mitochondrial thiols in antioxidant protection and redox signaling: distinct roles for glutathionylation and other thiol modifications. Antioxid Redox Signal, 2012. 16(6): p. 476–95. [DOI] [PubMed] [Google Scholar]
- 88.Deponte M, Glutathione catalysis and the reaction mechanisms of glutathionedependent enzymes. Biochim Biophys Acta, 2013. 1830(5): p. 3217–66. [DOI] [PubMed] [Google Scholar]
- 89.Kudin AP, et al. , The contribution of thioredoxin-2 reductase and glutathione peroxidase to H(2)O(2) detoxification of rat brain mitochondria. Biochimica et biophysica acta, 2012. 1817(10): p. 1901–6. [DOI] [PubMed] [Google Scholar]
- 90.Drechsel DA and Patel M, Respiration-dependent H2O2 removal in brain mitochondria via the thioredoxin/peroxiredoxin system. J Biol Chem, 2010. 285(36): p. 27850–8. [DOI] [PMC free article] [PubMed] [Google Scholar]
- 91.Stanley BA, et al. , Thioredoxin reductase-2 is essential for keeping low levels of H(2)O(2) emission from isolated heart mitochondria. J Biol Chem, 2011. 286(38): p. 33669–77. [DOI] [PMC free article] [PubMed] [Google Scholar]
- 92.Laskowski KR and Russell RR 3rd, Uncoupling proteins in heart failure. Curr Heart Fail Rep, 2008. 5(2): p. 75–9. [DOI] [PMC free article] [PubMed] [Google Scholar]
- 93.Friederich M, et al. , Diabetes-induced up-regulation of uncoupling protein-2 results in increased mitochondrial uncoupling in kidney proximal tubular cells. Biochim Biophys Acta, 2008. 1777(7–8): p. 935–40. [DOI] [PubMed] [Google Scholar]