Abstract
Zygotic genome activation (ZGA) activates the quiescent genome to enable the maternal-to-zygotic transition1,2. However, the identity of transcription factors (TFs) that underlie mammalian ZGA in vivo remains elusive. Here, we showed that OBOX, a PRD-like homeobox domain TF family (OBOX1–8)3–5, are key regulators of mouse ZGA. Mice deficient for maternally transcribed Obox1/2/5/7 and zygotically expressed Obox3/4 had a 2–4 cell arrest accompanied by impaired ZGA. Maternal and zygotic OBOX redundantly supported embryonic development as Obox KO defects could be rescued by restoring either of them. Chromatin binding analysis revealed Obox knockout preferentially affected OBOX-binding targets. Mechanistically, OBOX facilitated RNA Pol II “pre-configuration”, as Pol II relocated from the initial 1-cell binding targets to ZGA gene promoters and distal enhancers. The impaired Pol II pre-configuration in Obox mutants was accompanied by defective ZGA and chromatin accessibility transition, as well as aberrant activation of 1-cell Pol II targets. Finally, ectopic expression of OBOX activated ZGA genes and MERVL repeats in mouse embryonic stem cells. Hence, these data demonstrate that OBOX regulates mouse ZGA and early embryogenesis.
ZGA, the first transcription event after fertilization, drives the transition from the maternal to embryonic control in early development1,2. It often occurs in two waves: minor ZGA and major ZGA6–8. In mice, minor ZGA occurs around the mid-1-cell stage, when only a handful of genes are activated. Thousands of genes are then activated in late 2-cell (L2C) embryos during major ZGA.
Pol II initiates widespread chromatin binding in 1-cell (1C) mouse embryos, including many non-major ZGA targets9. It then undergoes relocation to major ZGA genes, or “pre-configuration”, with an intermediate state detected at the early 2-cell (E2C) stage prior to major ZGA9. However, which sequence-specific factors guide Pol II’s pre-configuration remains unknown. In Drosophila, ZELDA, GAF, and CLAMP were identified as master transcription factors (TFs) for ZGA10–12. Similar roles for NANOG, SOXB1, and POU5F1 were reported in zebrafish13–15. DUX in mouse and DUX4 in human activate a subset of ZGA genes (mainly minor ZGA genes) in ESCs16–18. However, Dux knockout (KO) barely affected ZGA in mouse embryos, and roughly half of Dux KO mice survived to term19,20. NR5A2 was suggested to regulate mouse ZGA and development beyond the 2C stage, although its precise role was still under discussion21–23. Recently, we showed that PRD-like homeobox TF TPRXs regulate human ZGA and early development24. However, this finding remained to be tested in a genetic KO model, and whether equivalent TFs in mouse play similar roles in ZGA remains unknown.
Obox is highly expressed around ZGA
We first searched for TFs highly translated prior to and during major ZGA based on our translatome data25 in mouse oocytes and early embryos (Tables S1). The most highly translated TFs in 1C, E2C (pre-major ZGA), and L2C (major ZGA) embryos were overwhelmingly dominated by the OBOX family (Fig. 1a, “RPF”). Moreover, five out of the top six TF motifs enriched in accessible chromatin26 (OBOX, OTX2, GSC, CRX, and PITX1) at the L2C stage were all PRD-like homeobox TFs sharing the TAATCC binding motif27 (Fig. 1a, “ATAC-seq motif”). As OTX2, GSC, CRX, and PITX1 were not or lowly expressed in mouse oocytes and early embryos, we focused on the OBOX family as potential ZGA regulators.
Fig. 1. OBOX expression in mouse oocytes and preimplantation embryos.
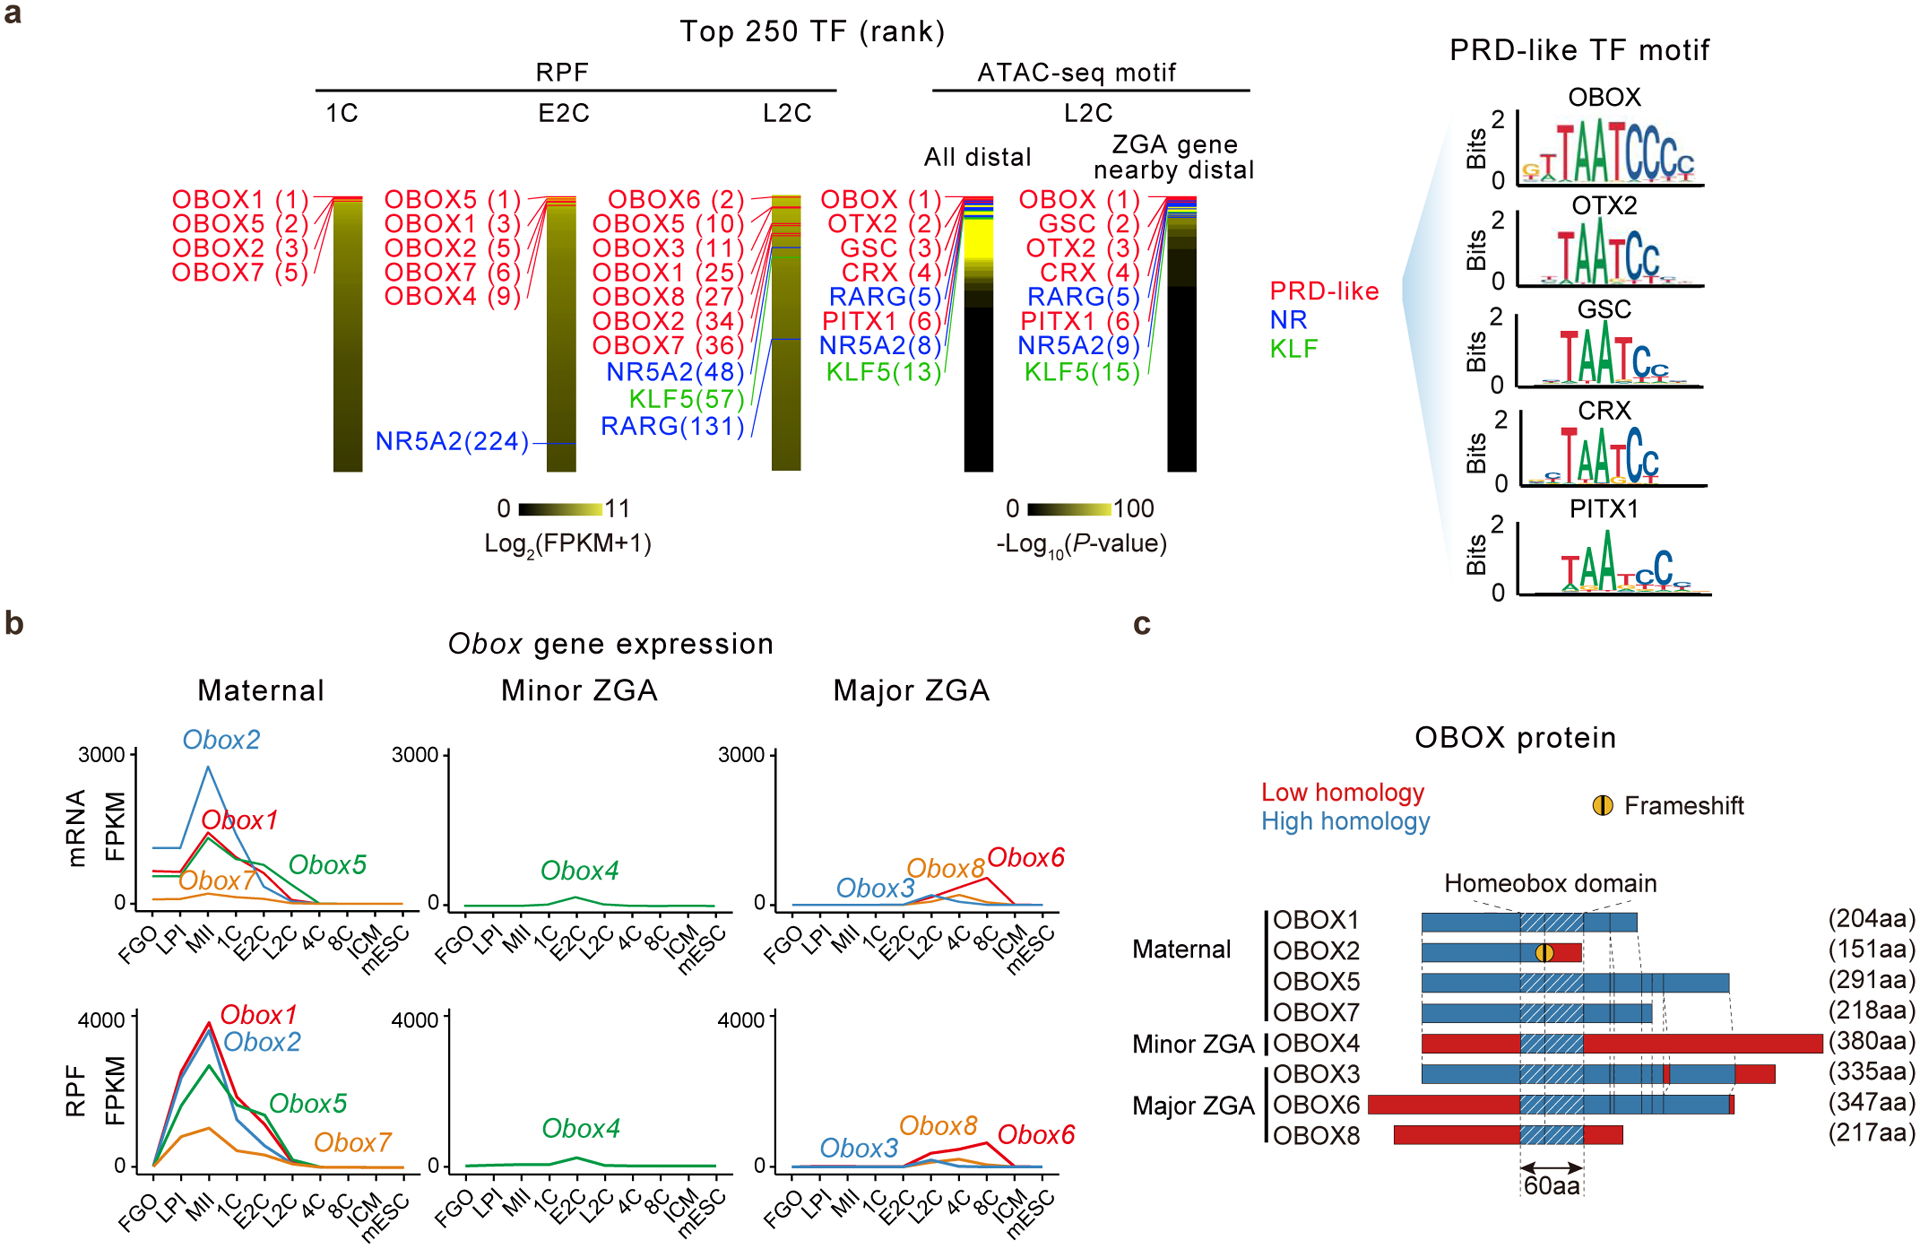
a, Top 250 TFs based on the translation levels (RPF, ribosome protected fragments)25 or motif enrichment in all distal accessible regions or those near ZGA genes based on ATAC-seq26 (left) in embryos. PRD-like homeobox family (red), nuclear receptor (NR) (blue), and Kruppel-like factors (KLF) (green) TFs and their ranks are indicated. OBOX, OTX2, GSC, CRX, and PITX1 binding motifs are shown (right). E2C, early 2-cell; L2C, late 2-cell. b, Line plots showing mRNA28 and translation25 levels of maternal, minor, and major ZGA Obox in oocytes and early embryos (2 biological replicates). c, Sequence alignment of OBOX proteins based on Clustal Omega.
Previous phylogenetic analyses revealed 66 Obox loci in mouse, all located in a single cluster on chromosome 73,5 (Extended Data Fig. 1a). Based on the transcriptome28 and translatome data25, we classified them into four groups (Tables S2–3). 1) Maternal Obox genes include Obox1/2/5/7, which showed high RNA levels in oocytes and early embryos before their expression declined after ZGA (Fig. 1b, Extended Data Fig. 1b). They were not translated in full-grown oocytes (FGOs), but became highly translated from the late prometaphase I stage (LPI) until the 2C stage, consistent with their transcripts containing cytoplasmic polyadenylation elements (CPEs) in the proximity of polyadenylation signal sites (PASs) and undergoing poly(A) tail lengthening during oocyte maturation25,29 (Extended Data Fig. 1c–d). Maternal OBOX are highly similar in protein sequences but with different lengths, as they arise through different premature stop codons (Fig. 1c). OBOX2 has a truncated homeobox domain due to a frameshift mutation, raising the possibility of impaired DNA-binding ability (Fig. 1c, “Frameshift”). 2) Minor ZGA Obox include Obox4 and its pseudogenes (Obox4-ps, n = 51), whose transcripts and translation were low in oocytes, but increased dramatically in E2C embryos, before quickly declining in L2C embryos (Extended Data Fig. 1b). 3) Major ZGA Obox include Obox3 (and its pseudogenes, n = 7), Obox8, and Obox6, which were primarily activated during major ZGA and peaked at L2C, 4C, and 8C, respectively (Fig. 1b). The expression of Obox3 was detected as early as mid-2-cell (M2C) and could be considered as minor-major ZGA genes (Extended Data Fig. 1e–f). 4) A proportion of Obox4 pseudogenes showed no or little expression in oocytes/early embryos and were hence excluded from further analyses (Extended Data Fig. 1b). Examination of the previously published transcriptome and translatome datasets30,31 revealed largely similar results (Extended Data Fig. 2a–b). OBOX proteins detected by specific antibodies showed consistent expression patterns with the corresponding translation levels (Extended Data Fig. 2c–h). Therefore, Obox genes are dynamically regulated at the transcriptional and post-transcriptional levels in mouse oocytes and early embryos.
Obox knockout caused 2–4C arrest
We asked if OBOX regulates mouse early development and ZGA. Knocking down individual Obox genes did not affect embryo development (Extended Data Fig. 3a–d, Table S4). Considering their possible redundancy, we sought to knock out multiple Obox genes simultaneously. Maternally expressed Obox1/2/5/7, minor ZGA Obox4, and minor-major ZGA Obox3 showed the highest expression levels before or around major ZGA (Fig. 1b). Therefore, we removed a region that encompasses Obox1/2/3/4/5/7, including all expressed Obox3/4 pseudogenes, in mice (referred to as Obox−/− hereafter). We first confirmed the knockout of Obox genes (Extended Data Fig. 4a–d). Heterozygous females and males were fertile with comparable offspring numbers compared with wild-type (WT) (Extended Data Fig. 4e). However, no Obox maternal-zygotic KO (mzKO) pups were born when crossing Obox−/− female with Obox−/− male (Extended Data Fig. 4f). The morphology of Obox−/− ovary was comparable to WT (Extended Data Fig. 4g). Obox−/− female mice could ovulate normally, and Obox−/− oocytes underwent meiosis with correct spindle configuration with no apparent transcriptome alterations (Extended Data Fig. 4h–j). However, when we isolated embryos in vivo at a time when the control embryos developed to blastocysts, the Obox mzKO embryos were still arrested at the 2–4C stage (with a small percentage arrested at 1C) (Fig. 2a). A similar result was obtained for in vitro cultured embryos from 1C (Extended Data Fig. 4k), suggesting that OBOX proteins are required for development beyond 4C.
Fig. 2. Maternal and zygotic OBOX redundantly supported embryo development.
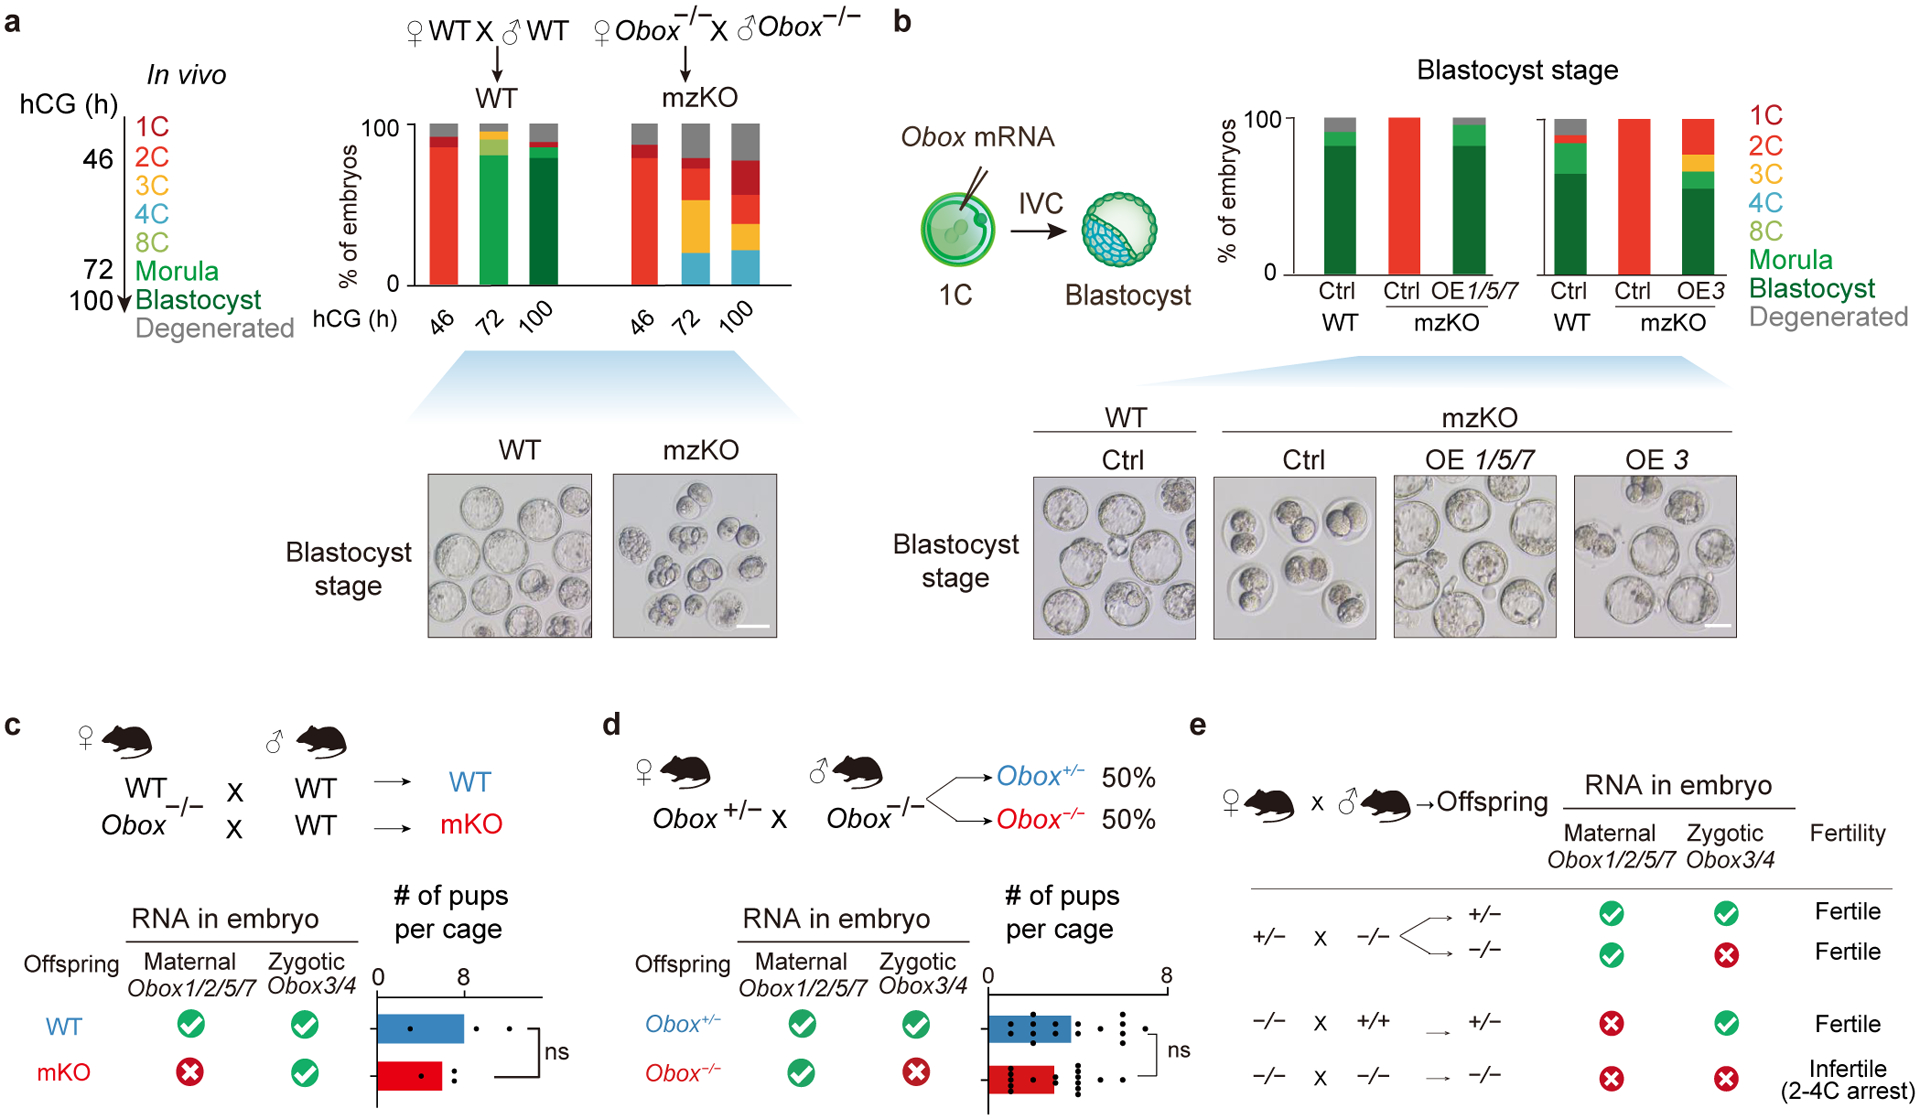
a, Embryo morphology and developmental rates of WT and Obox mzKO embryos dissected in vivo (4 biological replicates). Scale bar, 75 μm. b, OBOX rescue through overexpression of Obox1/5/7 (OE 1/5/7) or Obox3 (OE 3) mRNA, and the resulting embryo morphology and developmental rates (3 biological replicates). Scale bar, 75 μm. c, Offspring numbers for either WT or Obox−/− female mice crossed with WT male mice (three litters for each group). The presence or absence of Obox mRNAs in embryos is indicated. ns, not significant (P-value = 0.52, two-sided t-test). d, Offspring types and numbers for Obox+/− female mice crossed with Obox−/− male mice (total of 108 pups from 16 litters). P-value = 0.07, two-sided paired t-test. e, Summary of genotypes and phenotypes from different Obox mutant mouse crossing.
Maternal and zygotic Obox are redundant
We asked if restoring OBOX could rescue the developmental defects of Obox mzKO embryos. When maternal Obox1/5/7 mRNAs (Obox2 omitted due to a truncated homeobox domain) were introduced back into Obox mzKO zygotes, these embryos successfully developed to blastocysts (Fig. 2b), with the transcriptome properly restored (Extended Data Fig. 5a). A similar rescue was achieved by introducing zygotic Obox3 mRNA at 1C or M2C (Fig. 2b, Extended Data Fig. 5a–b), suggesting that ZGA regulators were not limited to maternally-deposited and 1C-expressed genes. By contrast, Obox4 mRNA partially rescued development, with a small portion of embryos developed to blastocysts (16.7%) (Extended Data Fig. 5c–d).
We then asked whether maternal or zygotic Obox could further support development to term. As zygotic Obox were expressed in embryos, maternal Obox KO (mKO) mice derived from Obox−/− female x WT male would still express Obox3/4 but not maternal Obox1/2/5/7 (Extended Data Fig. 5e–f). Indeed, Obox mKO embryos developed to blastocysts with normal gene expression (Extended Data Fig. 5g–h) and further survived to term (Fig. 2c), suggesting that Obox mzKO embryos could be fully rescued by zygotic Obox3/4. We then asked if supplementing maternal OBOX could also support mzKO embryos’ development to term. By crossing Obox+/− female with Obox−/− male mice, all embryos (including half Obox−/− and half Obox+/−) carried maternal Obox1/2/5/7 mRNAs supplied from oocytes (Extended Data Fig. 5i). However, Obox−/− embryos, unlike Obox+/− embryos, did not express Obox3 and Obox4. We found Obox−/− embryos could also survive to term (Fig. 2d), suggesting that the defects of mzKO embryos were fully rescued by maternal OBOX. Therefore, maternal OBOX and zygotic OBOX redundantly regulate mouse early development (Fig. 2e).
Obox knockout impaired ZGA
We next asked if ZGA in Obox mzKO embryos was affected. At E2C, 32% (21 of 65) of minor ZGA genes (see Methods, Tables S5–6) were downregulated in Obox mzKO embryos (Fig. 3a, Extended Data Fig. 6a–b), including the MERVL repetitive elements, a marker of E2C32–34 (Fig. 3b, Extended Data Fig. 6c). Dux was not downregulated (Fig. 3c), suggesting the ZGA defects by OBOX depletion were not through DUX. At L2C, the Obox mzKO embryos exhibited a widespread decrease of major ZGA genes (530/1107 or 48%) (Fig. 3a, Table S6). Downregulated genes preferentially function in essential pathways such as rRNA processing, mRNA processing, and translation (Extended Data Fig. 6b), and also include transcription factor Dppa2, Gata1/4, and Nr5a2 (Fig. 3c). Such ZGA defects were not due to developmental delay as maternal transcript clearance was not globally altered (Extended Data Fig. 6d–e). Minor ZGA genes were upregulated in Obox mutants at L2C, likely reflecting delayed downregulation (Extended Data Fig. 6c). In sum, the OBOX family regulate both minor and major ZGAs in mouse embryos.
Fig. 3. The loss of OBOX caused defective minor and major ZGAs.
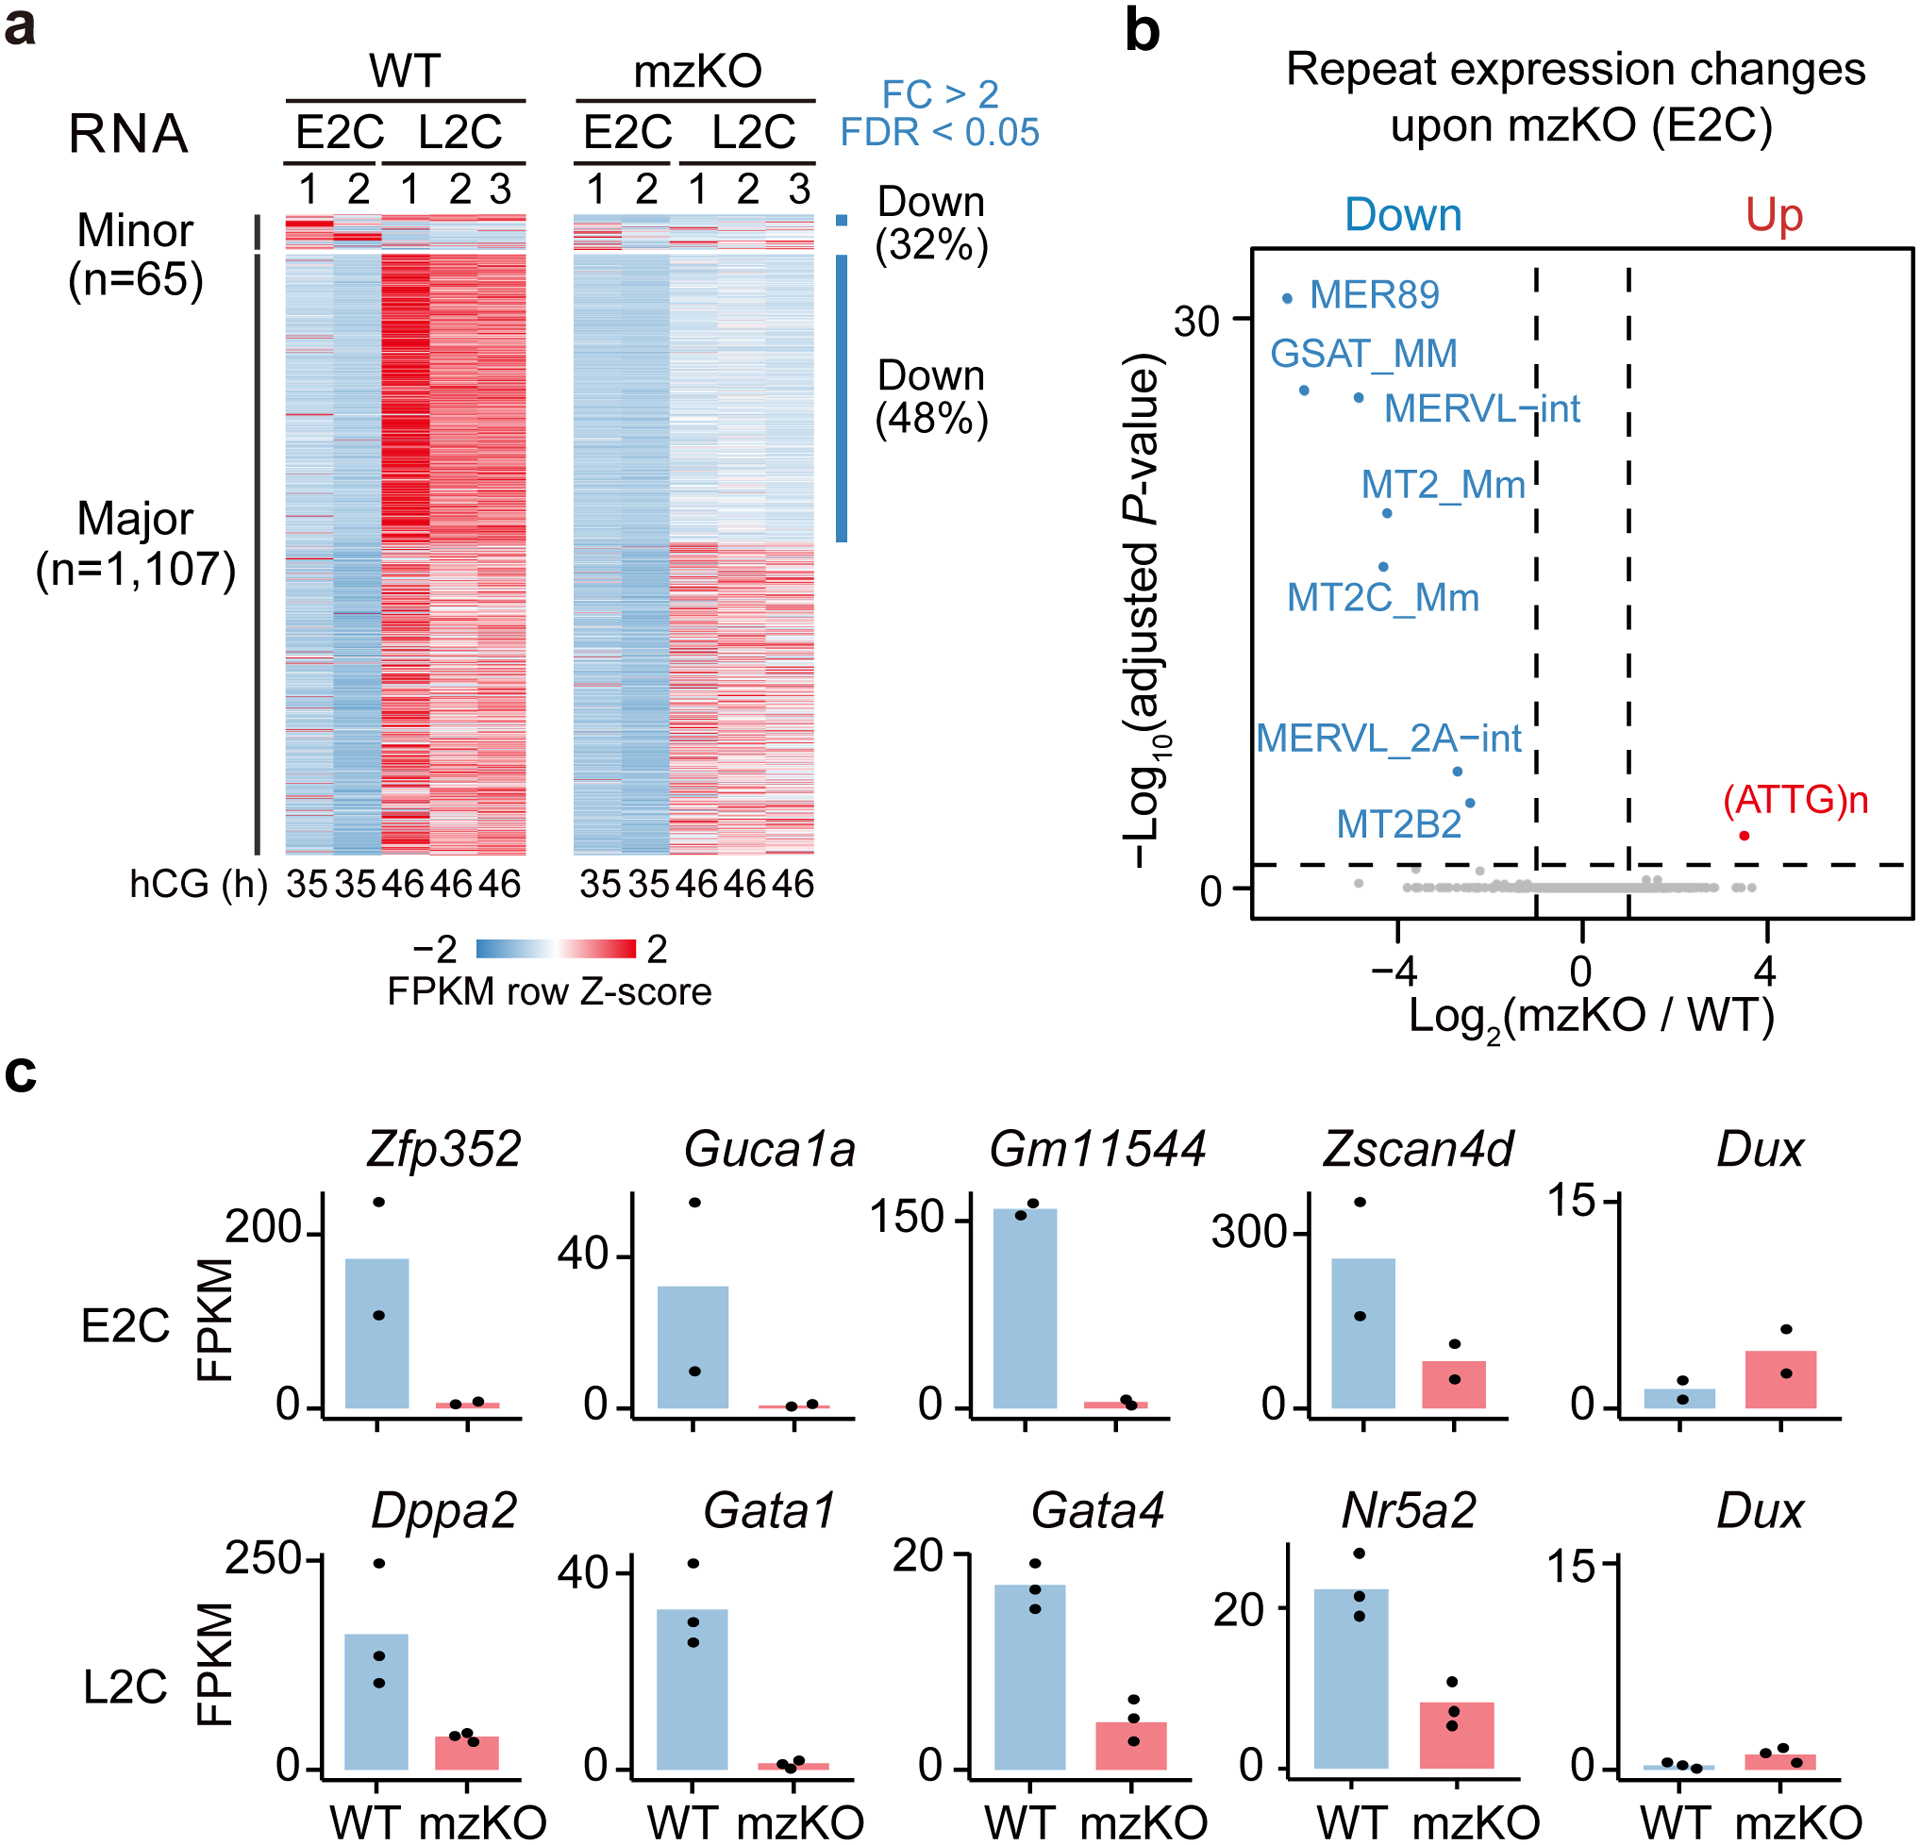
a, Heatmap showing minor and major ZGA gene expression in WT and Obox mzKO embryos (2 biological replicates for E2C and 3 for L2C). n, ZGA gene number. b, Volcano plot showing repeat expression changes comparing Obox mzKO and WT E2C embryos (2 biological replicates). Dashed line, adjusted P-value threshold 0.05. c, Bar charts showing minor and major ZGA gene expression in WT and Obox mzKO embryos (2 biological replicates for E2C and 3 for L2C; 10 embryos per group).
OBOX bound ZGA genes
We then asked how OBOX regulates ZGA, by probing the binding targets of OBOX1/5 and OBOX3 (representing maternal and zygotic ZGA OBOX, respectively). Overexpression of flagtagged Obox in WT embryos had no or only moderate effects on transcriptome (Extended Data Fig. 7a). As negative controls, no significant binding was detected for OBOX2 (with a truncated homeobox domain) and OBOX5 with a single amino acid mutation (OBOX5R98E, a key amino acid that contacts the minor groove of DNA35,36) that abolished gene activation ability in a luciferase reporter assay (Extended Data Fig. 7b), and for embryos without Obox injection (Fig. 4a, Extended Data Fig. 7c). By contract, Obox1, Obox5, and Obox3 showed strong (with 48,592, 33,422, and 32,125 binding peaks, respectively) (Table S7) and similar binding in the genome in L2C embryos (Extended Data Fig. 7d), as exemplified at Dppa2, Nr5a2, and MERVL (Fig. 4a). OBOX preferentially enriched at enhancers, promoters, MERVL, and B1/B2/B4 repetitive elements (Fig. 4b, Extended Data Fig. 7c, e-f). The top 1 and 2 de novo motifs for OBOX binding peaks matched well with the reported OBOX binding motif (TAATCCC)27 (Fig. 4c). These two motifs were actually adjacently present in OBOX binding peaks (51.1% of OBOX1 peaks, 71.4% of OBOX5 peaks, and 68.1% of OBOX3 peaks), leading to the identification of an extended OBOX binding motif (ACNCCTTTAATCCCAG), with OBOX1 showing the longest consecutive version (CCTTTAATCCCAG) which was chosen for the following analysis (Extended Data Fig. 7g). About 95.9% of this extended OBOX motif located in B1 element, and it rendered stronger gene activation than the reported 7-bp motif in reporter assays in embryos and HEK293 cells (Extended Data Fig. 7h–i). The reporter activity was abolished in Obox mzKO L2C embryos and was rescued by reintroducing Obox mRNAs (Extended Data Fig. 7j). Of note, 2C-specific genes contained more OBOX binding motifs at promoters compared to genes specifically activated at other stages (Extended Data Fig. 7k). ZGA genes containing more OBOX motifs showed higher OBOX binding both for promoters and distal regions (putative enhancers), and stronger downregulation in Obox mzKO embryos (Fig. 4d–e, Extended Data Fig. 7l–n). Genes containing both promoter and distal OBOX motifs were the most affected (Fig. 4f), arguing against the likelihood that developmental delay was the basis for the differences. In sum, OBOX preferentially binds and regulates ZGA genes with the OBOX motif in mouse embryos.
Fig. 4. OBOX binding in 2C embryos.
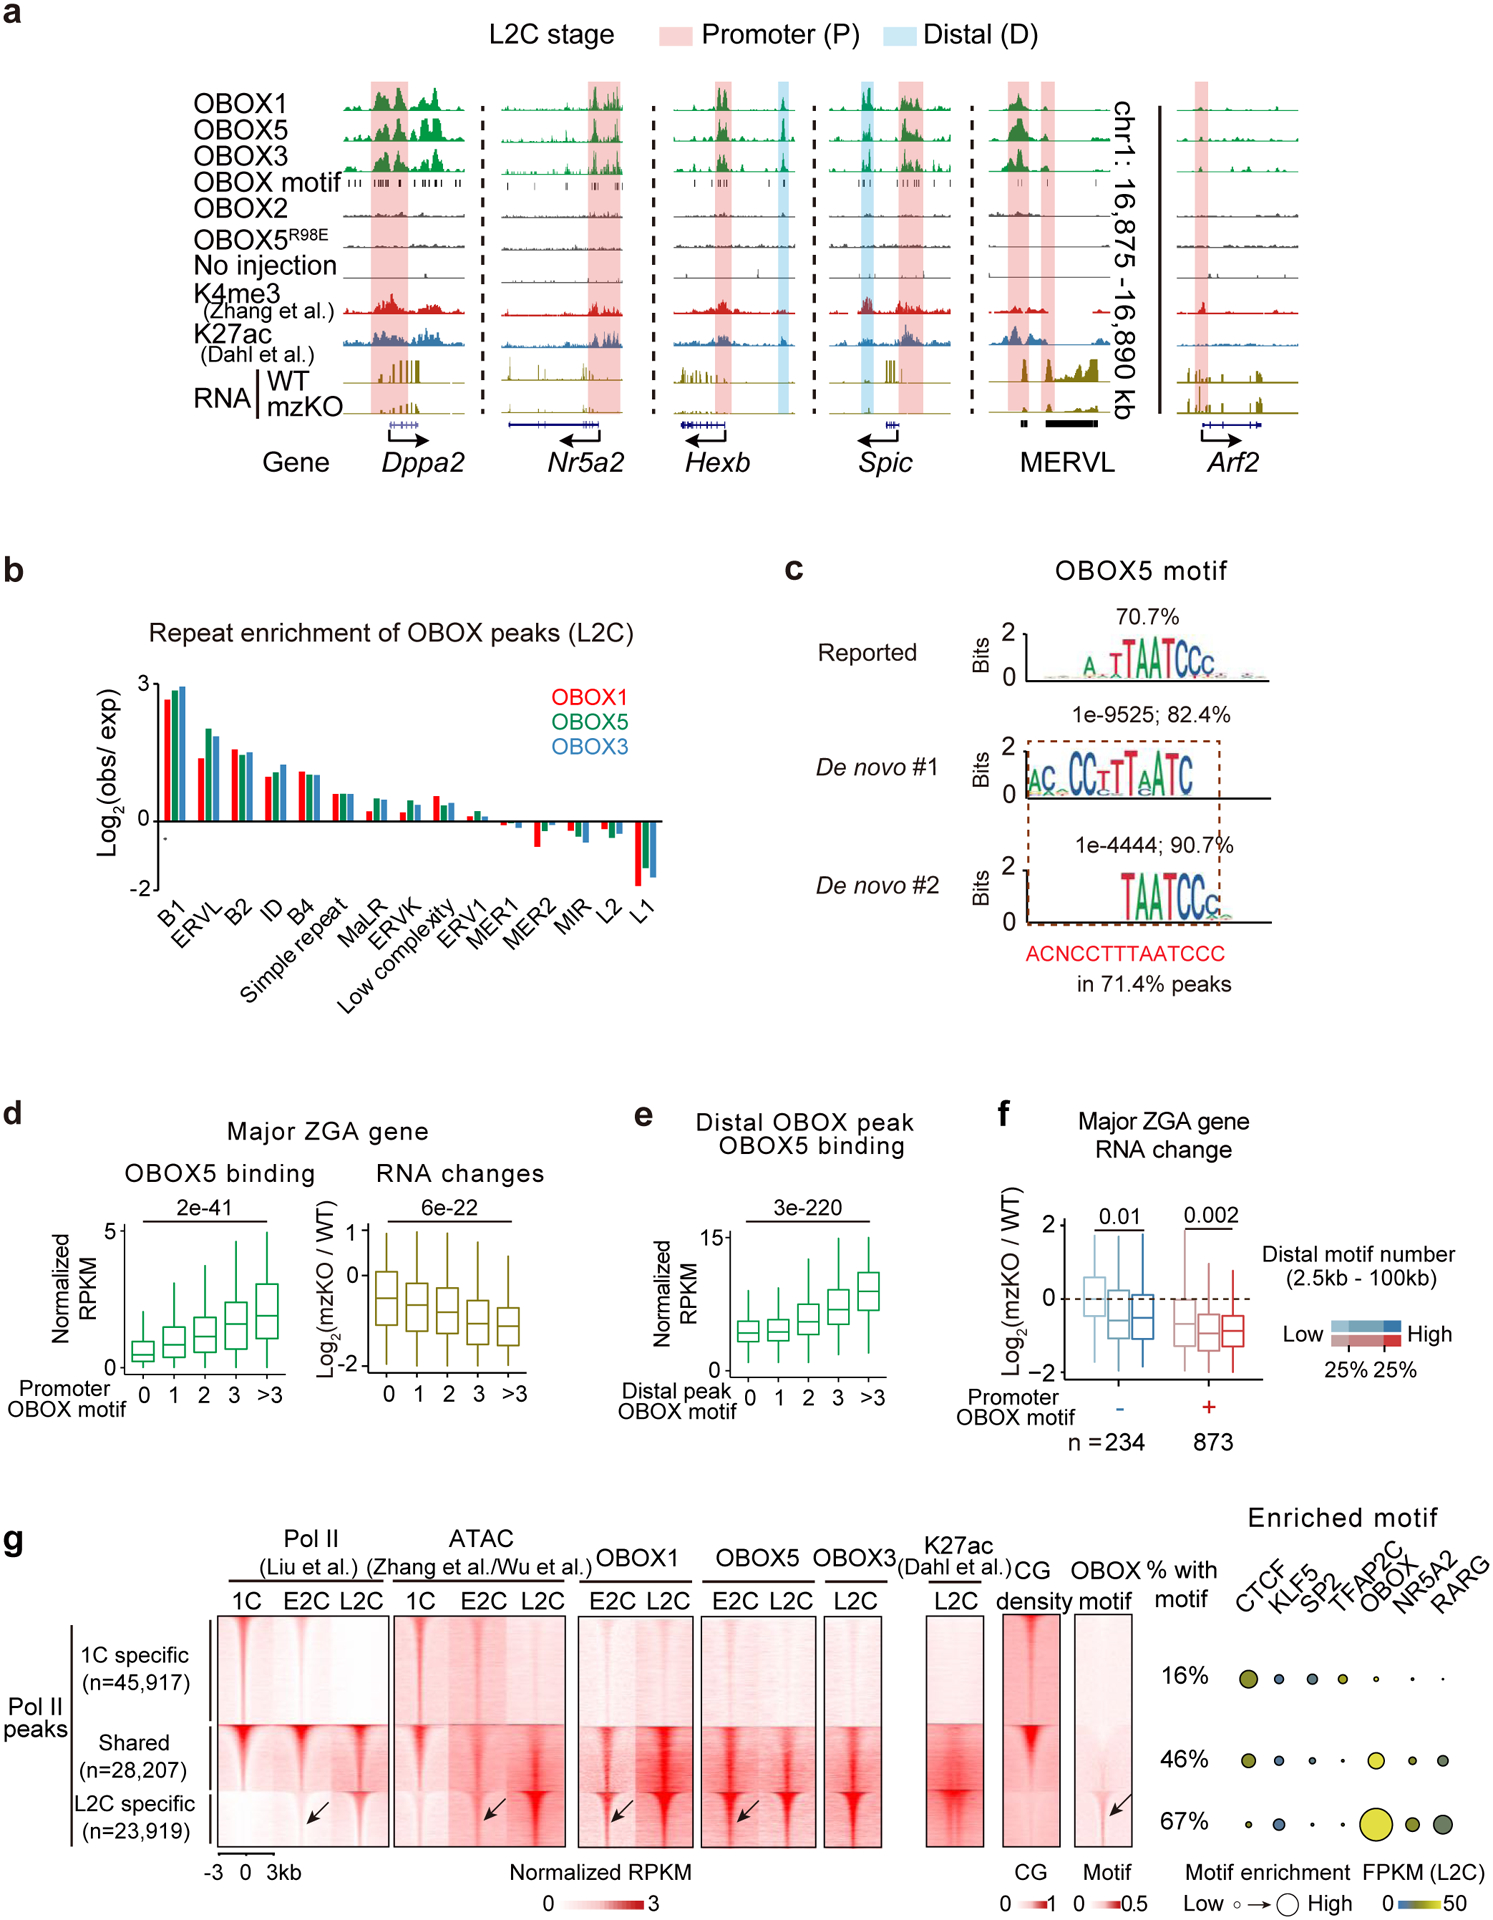
a, The UCSC browser snapshots showing OBOX1/5/3 binding at example genes and repeats in L2C embryos. Stacc-seq of OBOX2, OBOX5R98E binding, and Stacc-seq in embryos without injection are negative controls. H3K4me328, H3K27ac42, OBOX motif, and RNA levels in WT and Obox mzKO embryos are also shown. b, Bar chart showing repeat enrichment at OBOX binding peaks at L2C. c, Reported motif27, de novo top 1, 2, and combined extended motif identified by OBOX5 binding peaks in embryos. The percentages of peaks containing these motifs and P-values are shown. d, Box plots showing OBOX5 binding at major ZGA gene promoters in WT L2C embryos (left) and the major ZGA gene expression fold-changes upon OBOX depletion (right, 3 biological replicates). P-value, two-sided Wilcoxon rank-sum test. 234, 272, 232, 169, and 201 genes have 0, 1, 2, 3, and >3 OBOX motifs on promoters, respectively. Centre line, median; box, 25th and 75th percentiles; whiskers, 1.5 × IQR (same for d and e). e, Box plot showing OBOX5 binding enrichment at distal binding peaks in L2C embryos. P-value, two-sided Wilcoxon rank-sum test. 5,885, 16,226, 5,314, 1,370, and 561 distal OBOX3 binding peaks have 0, 1, 2, 3, and >3 OBOX motifs, respectively. f, Box plots showing ZGA gene expression changes upon Obox knockout (3 biological replicates). P-value, two-sided Wilcoxon rank-sum test. n, major ZGA gene number. g, Left, heatmaps showing Pol II binding9, chromatin accessibility (ATAC)26,31, OBOX binding, H3K27ac42, CG density and OBOX motif enrichment at 1C-specific, shared, and L2C-specific Pol II peaks in WT embryo. The percentages of peaks with at least one OBOX motif are shown. The arrows indicate Pol II, accessible chromatin, OBOX1/5 binding, and OBOX motif at the L2C-specific Pol II peaks in the E2C embryos. Right, enrichment of known transcription factor motifs. Motif P-value, area of the circle.
OBOX guided Pol II pre-configuration
Pol II undergoes “loading, pre-configuration, and production” during mouse ZGA9. Pol II binding correlates with CG density for 1C-specific and 1C-L2C shared peaks, before deviating from such correlation at L2C-specific peaks (Fig. 4g, “Pol II”), raising a possibility that CG-rich promoters were naturally accessible37 for the initial Pol II loading in 1C embryos, while the L2C-specific Pol II peaks, which are CG-poor, require additional TFs. In L2C-specific Pol II targets, OBOX motif is the top motif enriched and Obox showed the highest expression among the inferred TFs (Fig. 4g, right). Importantly, OBOX1 and OBOX5 binding preceded Pol II recruitment in these regions in E2C embryos (Fig. 4g, arrow), raising the possibility that OBOX guides Pol II to these targets.
Next, we performed Stacc-seq for Pol II in WT and Obox mzKO 1C, E2C, and L2C embryos. Among all Pol II peaks in WT, 21% were present at promoters and 79% were away from promoters (distal) (30% intergenic and 49% intragenic) (Fig. 5a, Table S8). For distal Pol II peaks, we focused on intergenic peaks to avoid the confounding elongating Pol II in gene bodies. Pol II binding in WT and Obox mzKO 1C embryos was similar (Extended Data Fig. 8a), suggesting that the initial Pol II binding is independent of OBOX and may be recruited to CG-rich regions “by default”. However, at E2C, while Pol II already initiated recruitment to L2C-specific sites in WT embryos, this process was impaired in Obox mzKO mutants (Extended Data Fig. 8a–c). Such defects were exacerbated in L2C embryos (Fig. 5a, red arrow). The decreased Pol II peaks in Obox mutants were more likely to contain the OBOX motif compared with the unaffected and increased peaks (Extended Data Fig. 8d). Moreover, genes showing decreased Pol II at promoters or distal regions (potential enhancers), but not those with unaffected Pol II, preferentially exhibited downregulation (Fig. 5b–c). Intriguingly, failing of Pol II recruitment to 2C-specific targets was accompanied by aberrant retention of Pol II at 1C targets in both E2C and L2C Obox mzKO embryos (Fig. 5d, Extended Data Fig. 8a–b). 435 genes were ectopically activated in L2C embryos (Fig. 5e, Extended Data Fig. 8e, Table S9). Approximately 50% of ectopically activated genes (compared to 27% of all genes) showed strong Pol II binding in 1C embryos (Extended Data Fig. 8f). These ectopically activated genes were normally inactive in early development and enriched for developmental genes, transcription factors, and Polycomb targets38 (Extended Data Fig. 8e–g), consistent with their CG-rich promoters. Of note, by identifying TE and ICM-enriched genes from a published dataset26, we found 27 (out of 340) TE-enriched genes and 22 (out of 360) ICM-enriched genes aberrantly activated in Obox mzKO embryos (Extended Data Fig. 8h–i).
Fig. 5. OBOX regulated Pol II pre-configuration in embryos and its overexpression activated ZGA genes and MERVL in mESCs.
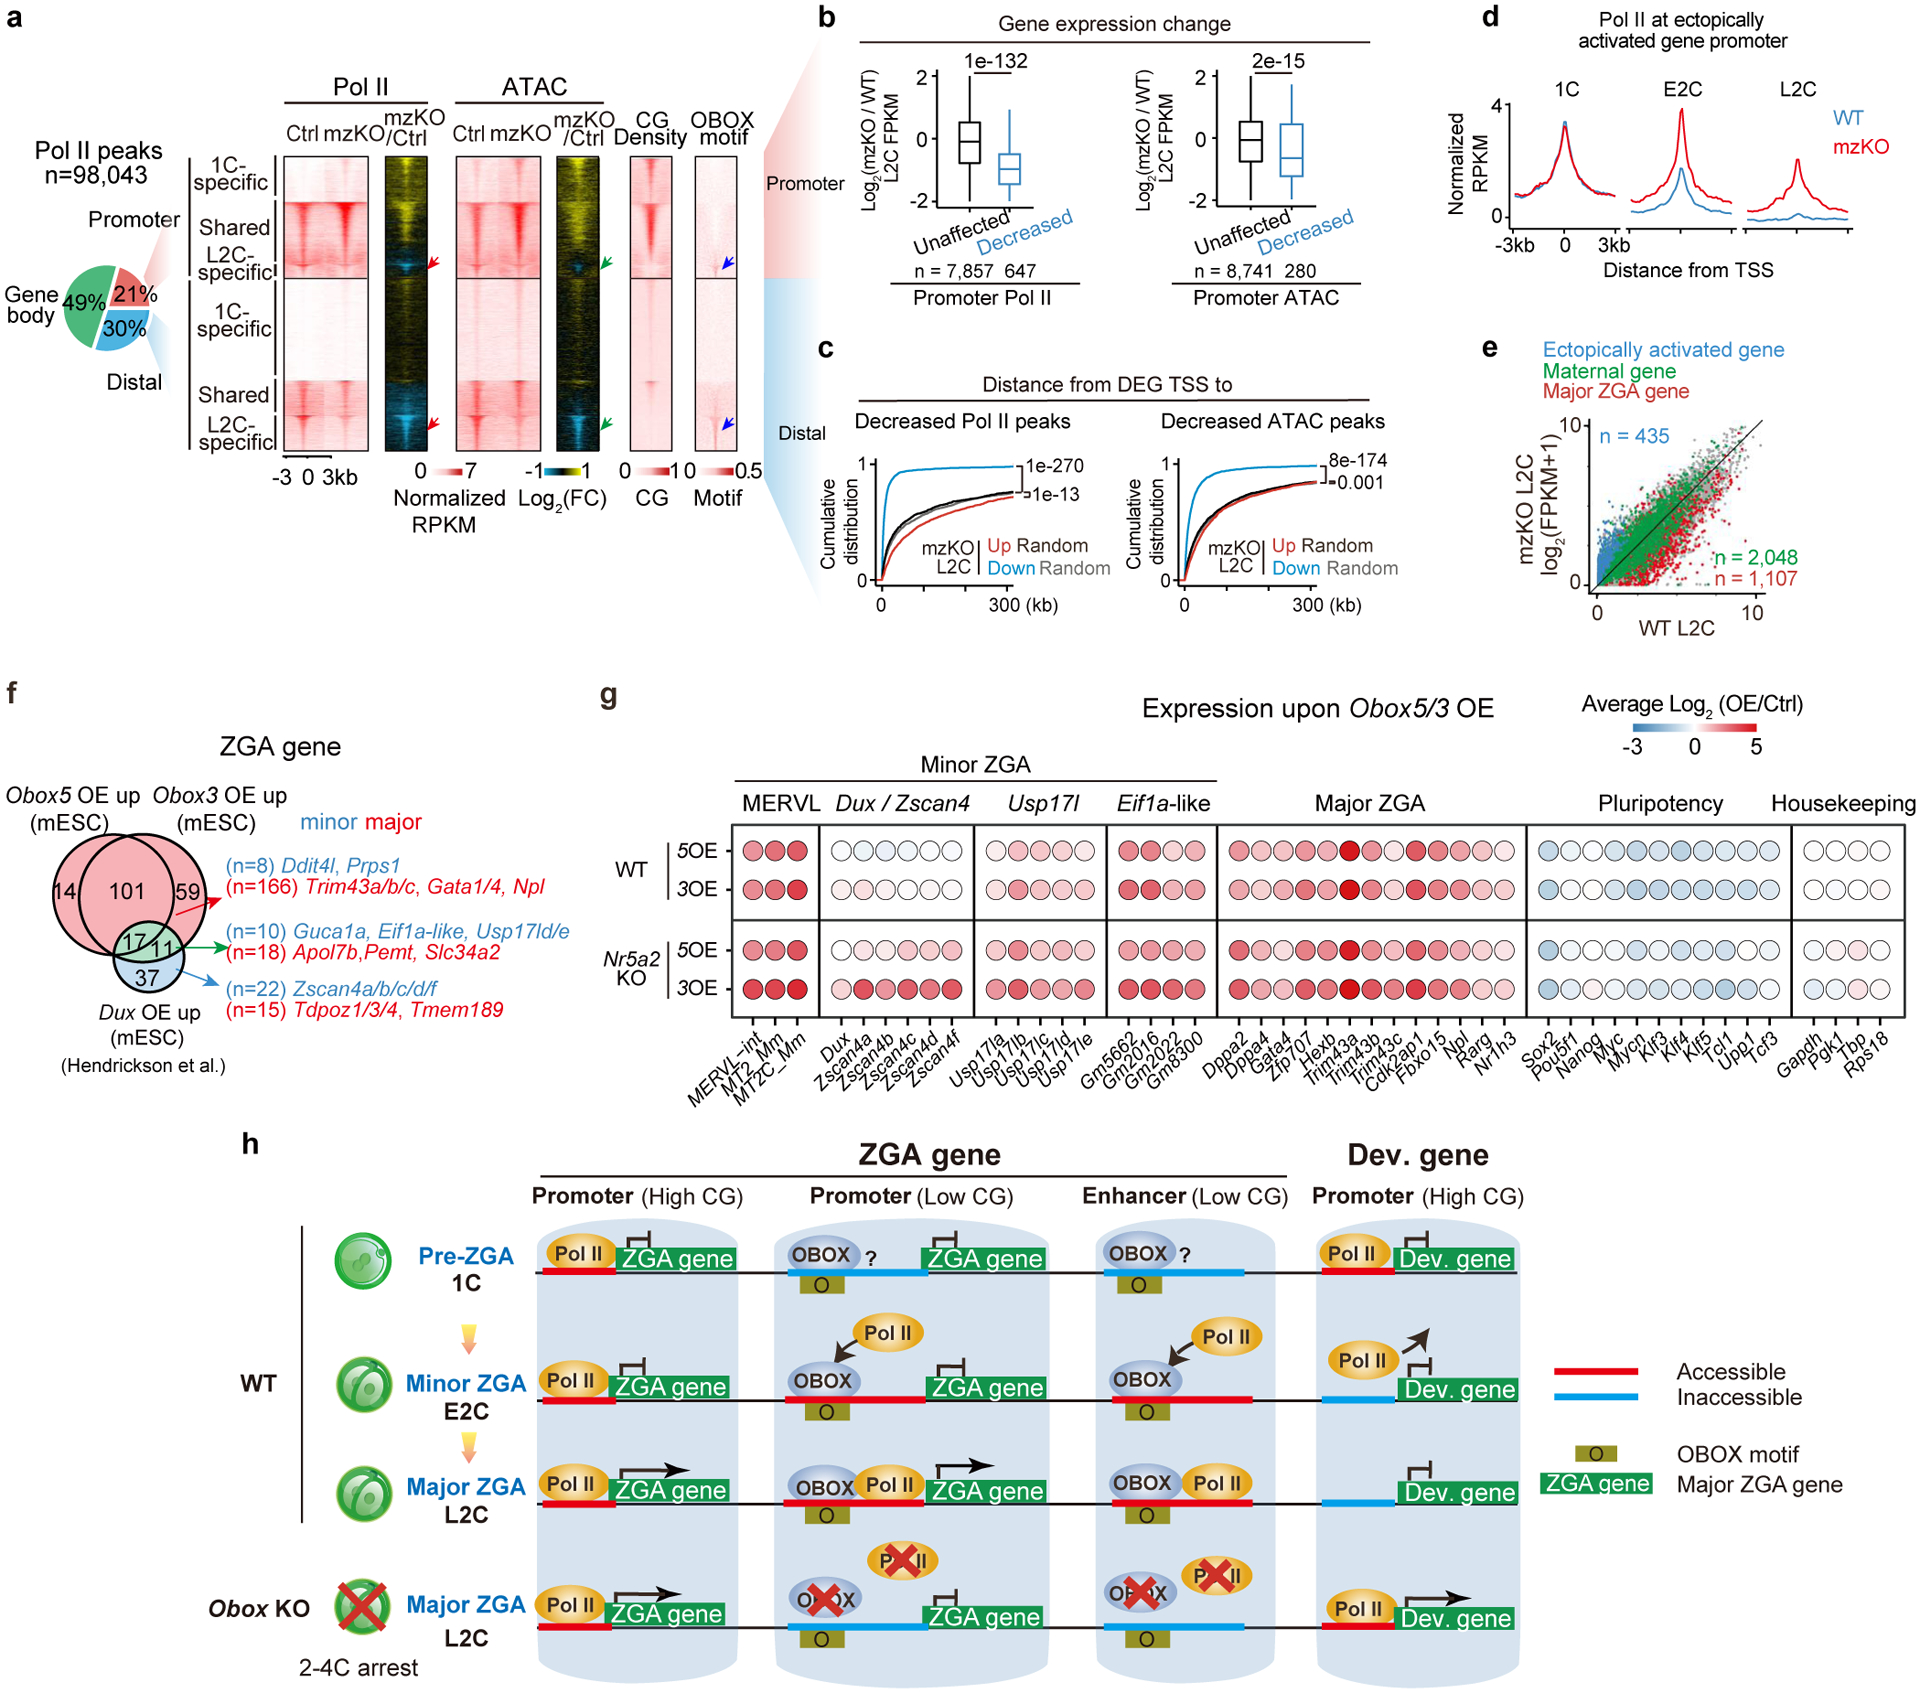
a, Pie chart showing Pol II peak distribution in the genome. Heatmaps showing Pol II binding and ATAC signals at 1C-specific, shared, and L2C-Pol II peaks at L2C (2 biological replicates). CG density and OBOX motif enrichment are shown. b, Box plots showing expression changes for genes with promoter Pol II binding or ATAC enrichment decreased or unaffected in Obox mzKO embryos (2 biological replicates). P-values, two-sided Wilcoxon rank-sum test. n, gene number. c, Empirical cumulative density function of the distance from downregulated or upregulated gene transcription start sites (TSS) to the nearest decreased distal Pol II peaks or ATAC peaks (2 biological replicates). P-values, two-sided Wilcoxon rank-sum test. Down-regulated genes, n = 2,026; up-regulated genes, n = 1,486. Equal numbers of random control genes are included. The decreased distal Pol II and ATAC peak numbers are 23,039 and 14,364, respectively. d, Promoter Pol II enrichment (Z-score normalized; 2 biological replicates) for the ectopically activated genes. e, Scatter plots comparing gene expression between WT and Obox mzKO embryos (3 biological replicates). f, Venn diagram showing the overlap of Obox (4 biological replicates) or Dux (2 biological replicates) overexpression upregulated ZGA genes in 2i mESCs. n, ZGA gene numbers. g, Balloon plot showing average gene expression changes after overexpressing Obox5 or Obox3 in WT (top, 4 biological replicates) or Nr5a2 KO (bottom, 2 biological replicates) 2i mESCs. Housekeeping genes, control. h, A model illustrating the role of OBOX in ZGA. Before ZGA (1C), promoters with high CG densities are initially accessible and bound by Pol II. Later (E2C and L2C), Pol II leaves 1C-specific targets (with mechanisms unclear) and OBOX guides Pol II to CG-poor ZGA gene promoters and enhancers. The loss of OBOX leads to impaired Pol II binding at ZGA gene promoters and enhancers, defective ZGA, and aberrant Pol II retaining in 1C targets, accompanied by ectopic gene activation and 2–4C arrest.
We then asked if OBOX may drive chromatin opening in early embryos. Using ATAC-seq, we found OBOX depletion decreased chromatin accessibility at the L2C-specific Pol II binding sites (Fig. 5a, green arrow). About 21% of active enhancers (9,191 out of 43,995, defined by distal H3K27ac) showed substantial decreases in chromatin accessibility in Obox mzKO L2C embryos. Failure to open promoters and enhancers also correlated with the downregulation of nearby ZGA genes (Fig. 5b–c). Taken together, these data indicate that OBOX guides timely pre-configuration of Pol II and chromatin accessibility at regulatory elements, and the loss of OBOX results in defect ZGA and aberrant activation of Pol II 1C targets.
OBOX activated ZGA genes in mESCs
To ask whether OBOX can activate ZGA genes beyond early embryos, we transiently overexpressed Obox5 or Obox3 (representing maternal or zygotic Obox, respectively) in 2i mESCs (Extended Data Fig. 9a). Genes activated by OBOX in 2i mESCs included substantial numbers of ZGA genes (132 out of 449 for OBOX5 and 188 out of 728 for OBOX3) (Fig. 5f, Extended Data Fig. 9b–d, Table S10), and showed strong OBOX5/3 binding in 2C embryos (Extended Data Fig. 9e–f). These genes were preferentially activated in WT 2–8C embryos (Extended Data Fig. 9g) and downregulated in Obox knockout embryos (73.5%, n = 97 for OBOX5 and 71.3%, n = 134 for OBOX3) (Extended Data Fig. 9h). The ZGA genes activated by ectopic OBOX5 and OBOX3 also exhibited a strong overlap (n = 118, P-value = 7e-89), again supporting functional redundancy of OBOX proteins. MERVL elements (including MT2C_Mm, MT2B2, MT2_Mm, and MERVL-int) were also activated by OBOX5/3 (Fig, 5g, Extended Data Fig. 9i). About 70% of the MT2_Mm repeats and 41% of the MT2C_Mm repeats contain the extended OBOX binding motif. Intriguingly, several pluripotency genes were downregulated by Obox5/3 expression (e.g., Sox2, Klf3/4/5) (Fig. 5g), raising the possibility that OBOX proteins promote totipotency and suppress pluripotency programs.
In line with Dux expression being unaffected in Obox mzKO embryos, neither OBOX binding nor OBOX motif was present at the Dux promoter in 2C embryos, and Dux was barely activated upon Obox5/3 OE (FPKM < 2, P-value = 0.14) in 2i mESCs (Extended Data Fig. 10a–b). Conversely, Re-analyses of published data showed Obox genes, except Obox4, were not or only moderately affected by Dux overexpression in mESCs16 and Dux KO in embryos20 (Extended Data Fig. 10c–d). 28 ZGA genes were commonly activated (10 minor and 18 major ZGA genes) in both Obox and Dux overexpressed mESCs (Fig. 5f). The majority of OBOX-activated ZGA genes were not activated by DUX in mESCs. OBOX-specifically activated genes in mESCs were enriched for major ZGA genes (166 out of 174, 95.4%), while DUX preferentially activated minor ZGA genes (22 out of 37, 59.5%). Only 39 ZGA genes were commonly downregulated in Obox and Dux knockout19,20 embryos (Extended Data Fig. 10e), suggesting that OBOX and DUX largely function in parallel. While partial overlap was found between “2C genes” in 2CLCs39 and Obox5/3 activated genes (14 minor ZGA genes and 42 major ZGA genes), OBOX also activated a set of ZGA genes that were not enriched in 2CLCs (4 minor ZGA genes and 142 major ZGA genes) (Extended Data Fig. 10f). Of note, OBOX bound regions near Zscan4a/d and the expression of Zscan4a/b/c/d/f was downregulated in Obox mzKO E2C embryos (Extended Data Fig. 10a–b). Dppa2, Dppa3, and Dppa4 were bound by OBOX5 and OBOX3 in embryos, and activated by Obox5/3 overexpression in mESCs (Extended Data Fig. 10a–b), suggesting that they may be downstream targets of OBOX. Finally, Nr5a2 was also bound by OBOX1/5/3 in embryos and was downregulated in Obox mzKO embryos (Fig. 3c and Fig. 4a). On the other hand, Nr5a2 knockdown21 did not affect Obox expression and OBOX could still activate ZGA genes in mESCs in the absence of Nr5a2 (Fig. 5g, Extended Data Fig. 10g–h), raising a possibility that NR5A2 may function downstream of OBOX. Overall, ectopic expression of OBOX can directly activate ZGA genes and MERVL in mESCs.
Discussion
How mammalian ZGA is regulated remains poorly understood. In this study, we identified the OBOX family as critical regulators of mouse ZGA, in part by facilitating Pol II pre-configuration and chromatin opening preferentially at CG-poor promoters and enhancers. Depletion of OBOX compromised both mouse preimplantation development and ZGA, accompanied by ectopic gene activation of Pol II 1C targets (Fig. 5h). Intriguingly, such defects can be rescued by restoring either maternal1/5/7 or zygotic OBOX3, suggesting redundancy among OBOX members. It is puzzling why Obox undergoes fast evolution and frequent duplications in the genome. Given that gene families with multiple copies, such as Dux and Zscan4, are also linked to ZGA, we speculate such redundancy may be evolved as a fail-safe mechanism to ensure the successful launch of ZGA. It remains to be further explored if individual OBOX members execute specific functions.
Of note, a handful of PRD-like TFs in human independently arose from the same ancestor gene Crx that gave rise to Obox genes in rodents, although they share limited protein similarities with OBOX (13.4–28.7%)3,40,41. We recently found PRD-like members TPRXs regulated human ZGA and early development24. However, how they function is unknown due to the inaccessibility of human embryos for molecular characterization. Our study now convincingly demonstrates the essential role of PRD-like TFs in murine ZGA and early development with a KO genetic model, thus illuminating the molecular circuitry underlying the fundamental question of how life begins. We envision that this work will also pave the way for understanding mammalian ZGA and PRD-like TFs in other species.
Methods
No statistical methods were used to predetermine sample size. The experiments were not randomized and investigators were not blinded to allocation during experiments and outcome assessment.
Animal maintenance
Wildtype C57BL/6 and ICR strain mice were purchased from Vital River and Tsinghua Animal Center. PWK/PhJ mice were originally purchased from Jackson Laboratory. Both wild-type and knockout mice were raised at Tsinghua Animal Center. Mice were maintained under SPF conditions with a 12 h-12 h light-dark cycle in a 20–22°C and humidity 55±10 % environment. All animals were taken care according to the guidelines of Institutional Animal Care and Use Committee (IACUC) of Tsinghua University, Beijing, China.
Oocyte and early embryo collection
Full-grown oocytes (FGOs) (with diameters > 70 μm) were collected from the ovaries of 4-week-old female C57BL/6 mice or 8-week-old ICR 46–48 h after pregnant mare serum gonadotropin (PMSG, Ningbo Hormone Product Co., Cat # 110254564 Ltd., China, 5 IU) injection. For MII and embryo collection, C57BL/6 female mice were injected with PMSG, followed 48 h later by human chorionic gonadotropin (hCG, Ningbo Hormone Product Co., Cat # 110251283 Ltd., China 5 IU) injection. For embryo collection, females were mated to PWK/PhJ or C57BL/6 males after hCG administration. Zygote, early 2-cell, mid-2-cell, mid to late 2-cell, late 2-cell, 4-cell, and blastocyst stage embryos were collected at 20 h, 35 h, 40 h, 44 h, 46 h, 56 h, and 100 h post-hCG, respectively. Oocytes and embryos were collected in M2 medium (Sigma-Aldrich, M7167).
Parthenogenetic activation and embryo culture
FGOs were collected from ICR strain mice and cultured to the MII stage in an atmosphere of 5% CO2 in air at 37.0 °C in Medium 199 (Gibco, 11150–059) supplemented with 10% (v/v) KSR (Gibco, A3181501), 0.1% BSA (Sigma-Aldrich, A1933), 3.05 mM D-glucose (Sigma-Aldrich, G7012), 0.91 mM sodium pyruvate (Sigma-Aldrich, P4562), 0.05 IU/ml FSH (Millipore, 869001), 0.05 IU/ml LH (Millipore, 869003), 20 ng/ml EGF (Gibco, PHG0311), 100 μM cysteamine (Sigma-Aldrich, M9768; fresh added) and 200 μM cystine (Sigma-Aldrich, C7602; fresh added). MII eggs were activated for 6 h in calcium-ion-free Chatot-Ziomek-Bavister (Ca2+-free CZB) medium with 2.5 mM SrCl2 and 2.5 μg/ml Cytochalasin B (Sigma-Aldrich, C6762). The composition of Ca2+-free CZB medium includes the following: 85.35 mM NaCl, 4.83 mM KCl, 1.18 mM KH2PO4, 0.11 mM EDTA-2Na, 25.12 mM NaHCO3, 0.27 mM sodium pyruvate (Gibco, 11360070), 1 × GlutaMAX (Gibco, 35050061) and 5 mg/ml bovine serum albumin (BSA; Sigma-Aldrich, A1933). Parthenogenetic one-cell embryos were then cultured in KSOM medium (Millipore, MR-121-D) until the blastocyst stage.
Immunostaining
All steps were performed at room temperature. Mouse oocytes or embryos were fixed with 4% paraformaldehyde (PFA) (Sigma-Aldrich, P6148) for 30 min and then permeabilized with 0.5% Triton X-100 in PBS for 30 min. The samples were blocked with 1% BSA for 1 h and incubated with primary antibodies (1:100 dilution for Flag antibody and 1:500 for all OBOX antibodies) for 1 h. OBOX antibodies were generated in house with a peptide CERNLLKQESQGPSR for OBOX1/2/3, NLQNIEQVLPES for OBOX1/5, EVLDQSKPYSHEEVC for OBOX3 and ASTQGPEYAQDS for OBOX6 (due to their similarities in protein sequences, some of the epitopes are present in more than one OBOX protein). The primary antibody was washed out with PBST (0.1% Triton X-100 in PBS) and then the samples were incubated with the secondary antibody and Hoechst 33342 for 30 min. The samples were then washed with PBST three times. All immunofluorescence images were taken using a confocal LSM880 (Zeiss) microscope.
In vitro transcription and microinjection
For mRNA samples, pRK5 vectors containing a T3 promoter were linearized and transcribed with T3 mMESSAGE Kit (Invitrogen, AM1348) following the manufacturer’s instructions. mRNAs were recovered by RNA Clean XP beads (Beckman, A63987). For the Obox mzKO rescue experiments, Obox1, Obox5, and Obox7 mRNA (100 ng/μl for each) were used for the combined Obox1/5/7 rescue experiments, 100ng/ul Obox3 mRNA for Obox3 rescue, and 5ng/ul, 20ng/ul, and 100ng/ul Obox4 mRNA for Obox4 rescue. For Obox Stacc-seq, wild-type zygotes were injected with Flag-Obox1, Flag-Obox5, Flag-Obox3, Flag-Obox2, or Flag-Obox5R98E mRNA (500 ng/μl). For the knockdown of individual maternal Obox genes, siRNAs were injected into FGOs followed by in vitro maturation and parthenogenetic activation. Minor and major Obox genes were knocked down from the zygote stage. Note that Obox1/2 were knocked down together as their mRNA sequences are highly similar (despite divergent protein sequences due to a frameshift mutation of Obox2). siRNA targeting Obox3 also partially reduced Obox1/2/6/7 transcripts, again due to their sequence similarities. All injections were performed with an Eppendorf Transferman NK2 micromanipulator. 5–10 pL samples were injected per zygote or 2-cell embryo. For the knockdown experiment, 25 μM of siRNA was used for each siRNA and non-targeting siRNA as a control. The siRNA sequences are included in Table S4.
Generation of Obox KO mice
Obox KO mice were generated by GemPharmatech. Cas9 mRNA (100 ng/μl) and sgRNA (50 ng/μl each) were injected into the cytoplasm of zygotes. Following injection, zygotes were cultured in KSOM until the 2-cell stage at 37 °C under 5% CO2 in air. Two-cell embryos were transferred into the oviducts of surrogate ICR strain mothers. The Obox mutant mice were crossed with WT C57BL/6J mice for two generations before conducting the related experiments to reduce the risk of off-target. To genotype colonies, a mouse tail tip was lysed in 70 μl Solution A (25mmol/L NaOH, 0.2mmol/l EDTA) at 95 °C for 50 min before being cooled down, followed by the addition of Solution B (40 mmol/L Tris-HCl). The supernatants were used as templates for PCR (WT and KO alleles are 558 bp and 200 bp, respectively). The sgRNA sequences used in generating Obox KO mice and genotyping primer sequence are provided in Table S11.
Cell culture
Naïve (2i) mESCs were cultured on feeder-free dishes coated with 0.1% gelatin in N2B27 medium supplemented with 1 μM PD0325901, 3 μM Chir99021, and 1 × 10³ units/mL LIF. The cells were passaged 1:10–1:20.
Plasmid construction and transfection
For plasmids used for Obox overexpression in embryos or cell lines (2i mESCs or HEK293), Obox cDNA was cloned into piggyBac vector between 3×FLAG and P2A (self-cleaving peptide). Luciferase reporters were constructed with pGL4.23 (Promega) plasmid as previously described43 with minor modifications. The 4×13bp motif (113bp sequence containing four of the 13bp de novo OBOX motif with 12bp spacer between them), 4×7bp motif (94bp sequence containing four of the 7bp motif with 12bp spacer between them), or 4xno-motif (61bp sequence without motif sequence) was inserted between KpnI and XhoI. The sequences were generated through T4 polynucleotide kinase phosphorylation followed by primer annealing and ligation. The primers used for reporter plasmid construction are listed in Table S12. GFP reporter plasmids were constructed by replacing luciferase with GFP in the luciferase reporter plasmids. For OBOX overexpression assays in mESCs, Obox3 and Obox5 plasmids were transiently overexpressed in 2i mESCs using Lipofectamine 3000 (Invitrogen, L3000015). GFP+ cells were selected after 24 h of transfection by flow cytometry (BD FACSAria™ II or Beckman MoFlo Astrios EQ). RNA-seq (Smart-seq) was conducted for sorted cells with GFP-OBOX expression to measure gene expression. For the Nr5a2 KO mESC line, four sgRNAs (Table S13) were cloned into a pX330 plasmid (Addgene, 42230) and were co-transfected into mESCs with Lipofectamine 3000 (Thermo Fisher Scientific). Two to three days after transfection, cells were manually sorted into a gelatinized 96-well plate for single-clone selection. The obtained clones were genotyped by PCR and validated by Sanger sequencing.
Reporter assay in HEK293 and embryos
For the reporter assay in HEK293, firefly luciferase, renilla luciferase, and Obox plasmids were transfected to HEK293 with Lipofectamine 3000 (Invitrogen, L3000015). Luciferase activity was measured at 16 h after transfection using Dual-Luciferase Reporter Assay System (Promega) following the manufacturer’s protocol with the following modification: 30 μl lysis buffer was added to HEK293; samples were centrifuged and 8 μl cell lysis supernatant was collected; 40 μl firefly substrate and then 40 μl stop buffer were added into the cell lysis at the measuring step.
For reporter assay in WT and Obox mzKO embryos, two rounds of microinjection were performed. Obox1/5 mRNAs (100ng/ul for each) were injected into zygotes and then 50ng/μl reporter plasmids (pGL4.23-GFP plasmid with or without 4 × 13 bp OBOX motif) were injected into the nuclei of early 2-cell embryos (as the OBOX motif is mainly associated with genes activated in 2C embryos and plasmids would diffuse away after mitosis and nuclear membrane breakdown if injected in 1-cell embryos). Embryos were cultured to the late 2-cell stage for imaging analyses. For the reported 7-bp and extended OBOX motif comparison, the reporter plasmids (pGL4.23-GFP plasmid with 4 × 13 bp OBOX motif, 4 × 7 bp OBOX motif, or without the OBOX motif) were injected into one of the nuclei of early 2-cell embryos at a concentration of 200ng/ul and then imaged at the late 2-cell stage.
RNA-seq library preparation and sequencing
All RNA-seq libraries were generated following the Smart-seq2 protocol as described previously44. The zona pellucida was gently removed by treatment with Tyrode’s solution (Sigma, T1788). Oocytes and embryos were washed three times in M2 medium and then lysed in 2 μl lysis buffer containing RNase inhibitor.
Whole genome sequence (WGS)
Tail tip DNA was extracted with the isopropanol precipitation method. The DNA libraries were generated with Tn5 based method44.
Stacc–seq library generation and sequencing
Stacc-seq libraries were constructed as previously described with minor modifications9. Embryo samples (total volume with buffer less than 1 μl) were prepared freshly into a 1.5ml low-binding tube. The zona pellucida was removed with Tyrode’s solution and the polar body was removed with a sharp glass pipette.
For Pol II Stacc-seq, DB1 buffer was prepared freshly (10 mM Tris-HCl pH = 7.5, 150 mM NaCl, 0.5 mM spermidine, 2% glycerol, 1 × EDTA-free with Roche complete protease inhibitor, 0.01% digitonin, and 2mM DTT). For each sample, 2.5ul (0.2ug/ul) anti-Pol II antibody (active motif 102660), 0.5ul (1ug/ul) pG-Tn5 (Vazyme Biotech, TD901), and 9.5ul DB1 buffer were added to a 200 μl low-binding tube and the mixture was incubated at 4 °C for 30 min. DB1 buffer (37.5 μl) was added to the embryos. The mixture was incubated for 10 min at 4 °C and vortexed gently every 2.5 min. The embryo samples, 12.5ul pre-incubated antibody-pG-Tn5 mixture, and 12.5 μl pre-warmed (37 °C) 5 × TTBL (Vazyme Biotech, TD502) were mixed and incubated in an Eppendorf Thermomixer at 37 °C for 30 min. Then, 2ul 10% SDS, 2ul carrier RNA, and 2ul spike-in DNA were added to the tube after being fully mixed and incubated at room temperature for 5min and then incubated at 55°C for 10min. DNA was purified by 3x Ampure XP beads. PCR was performed to amplify the libraries (Vazyme Biotech, TD601) using the following PCR conditions: 72 °C for 3 min; 98 °C for 30 s; thermocycling for 16 cycles at 98 °C for 15 s, 60 °C for 30 s and 72 °C for 3 min; followed by 72 °C for 5 min. After the PCR reaction, libraries were purified by 0.4×–1.7× AMPure beads size selection and were subjected to next-generation sequencing.
For OBOX1, OBOX2, and OBOX3, DB1 buffer was freshly prepared (10 mM Tris-HCl pH = 7.5, 150 mM NaCl, 0.5 mM spermidine, 2% glycerol, and 1 × EDTA-free with Roche complete protease inhibitor, 0.02% digitonin). For each sample, 0.5ul (1ug/ul) anti-Flag antibody (Sigma-Aldrich, F1804), 0.5ul (1ug/ul) pG-Tn5 (Vazyme Biotech, TD901), and 11.5ul DB1 buffer were added to a 200 μl low-binding tube and the mixture was incubated at 4 °C for 30 min. The tagmentation, DNA purification, and PCR steps were performed the same as those in Pol II profiling.
For OBOX5 and OBOX5R98E Stacc-seq with wash was performed as previously described9. DB1 buffer was prepared freshly (same as OBOX1, OBOX2, and OBOX3 Stacc-seq). For each sample, 0.5ul (1ug/ul) anti-Flag antibody (Sigma-Aldrich, F1804), 0.5ul (1ug/ul) pG-Tn5 (Vazyme Biotech, TD901), and 11.5ul DB1 buffer were added to a 200 μl low-binding tube and the mixture was incubated at 4 °C for 30 min. For each sample, 10ul concanavalin A beads were washed twice in binding buffer (20mM HEPES-KOH pH 7.5, 10mM KCl, 1mM CaCl2, 1mM MnCl2) and resuspended in 10ul binding buffer. After collection embryos in a 1.5ml low-binding tube, 50ul Buffer1 (10 mM Tris-HCl pH = 7.5, 150 mM NaCl, 0.5 mM spermidine, and 2% glycerol, 1 × EDTA-free with Roche complete protease inhibitor) and 10ul washed concanavalin A beads were added and gently mixed. After incubation at room temperature for 10min, beads bond embryos were washed once with 100ul DB1 buffer. 37.5ul DB1 buffer and 12.5ul pre-incubated antibody-pG-Tn5 mixture were then added to the sample. After incubating the sample at 4 °C for 2 hours, the embryo sample, 12.5ul pre-incubated antibody-pG-Tn5 mixture, and 12.5 μl pre-warmed (37 °C) 5 × TTBL (Vazyme Biotech, TD502) were mixed and incubated in an Eppendorf Thermomixer at 37 °C for 30 min. DNA purification and PCR were then performed as those for Pol II profiling.
ATAC-seq library preparation and sequencing
The ATAC-seq libraries of WT and Obox mzKO embryos were prepared as previously described with minor modifications26,45. Briefly, samples were lysed in 11ul lysis buffer (10 mM Tris-HCl (pH 7.5), 10 mM NaCl, 3 mM MgCl2, and 0.05% digitonin) for 10 min at 4°C. The samples were then incubated with 5ul Tn5 transposase and 4ul TTBL tagmentation buffer at 37°C for 30 min (Vazyme Biotech). After the tagmentation, 2ul 10% SDS was added directly into the reaction to end the tagmentation. 2ul carrier RNA and spike-in DNA were added and PCR was performed to amplify the library for 17 cycles using the following PCR conditions: 72 °C for 3 min; 98 °C for 30s; and thermocycling at 98°C for 15s, 60°C for 30s and 72°C for 3min; following by 72°C 5 min. After the PCR reaction, libraries were purified by 0.4×–1.7× AMPure bead size selection and were subjected to next-generation sequencing.
Data analyses
RNA-seq data processing
Paired-end RNA-seq reads were trimmed and then mapped to mm9 genome by HISAT2 v2.2.146. StringTie v2.1.247 was used to calculate the FPKM per gene based on mm9 refFlat from UCSC genome annotation database48. HTSeq v0.6.049 was applied to calculate the counts per gene with default parameters. Trimmed RNA-seq data were also mapped to the reference Obox mRNA sequence by Magic-BLAST50. The mapped reads to each Obox gene were counted and normalized by total reads and gene length to estimate the FPKM. The Obox translation levels were calculated by StringTie v2.1.2 based on the Ribo-lite data25.
Differentially expressed gene (DEG) analysis
DEGs were identified with adjusted P-value <0.05 and fold change > 2 by DESeq2 v1.24.051. GO terms of DEGs were analyzed by DAVID v6.852. FeatureCounts v2.0.153 was used to count reads that were mapped to the annotated repeats (RepeatMasker). Differentially expressed repetitive elements were identified with adjusted P-value <0.05 and fold change > 2 by DESeq2 v1.24.0 with total reads as the sizeFactors.
Identification of stage-specific genes, ZGA genes and maternal genes
Minor/major ZGA genes, maternal genes, and stage-specific genes were defined based on the reference RNA-seq data using staged mouse embryos dissected in vivo26. ZGA genes were defined as those not expressed or lowly expressed in FGO and MII oocytes (FPKM < 5) but become upregulated (FPKM > 5, at least 3-fold upregulation) in either 1-cell or early 2-cell embryos (minor ZGA genes) or late 2-cell embryos (major ZGA genes). Genes that are expressed in oocytes (FPKM > 5) but are highly upregulated at the late 2-cell stage (over 5-fold upregulation) were also included in major ZGA genes (n = 99). No such genes exist for minor ZGA genes. Note that a small number of major ZGA genes were already moderately activated in our WT E2C samples which were collected at a slightly later time point (35 h post-hCG) compared with that of a reference26 (30 h post-hCG) used to define the ZGA gene list (n = 159, E2C (hCG35 h)/E2C (hCG30 h) > 2). Among these genes, 87 were downregulated in E2C Obox mutants. Maternal genes were defined as those that are expressed in MII or FGO oocytes (FPKM > 5) but become downregulated (at least 3-fold) at the late 2-cell stages.
Genes specifically activated at each stage during early development were defined using more strict criteria to ensure their stage specificity. These genes are activated at a defined stage (FPKM > 5) but stay silenced at all preceding stages from FGO (FPKM < 1).
Stacc-seq and ATAC–seq data processing
The paired-end Stacc-seq or ATAC-seq reads were aligned to the mm9 genome with the following parameters: -t -q -N 1 -L 25 -X 2000 --no-mixed --no-discordant by Bowtie2 v2.3.554. Aligned reads were filtered with a minimum MAPQ of 20 and PCR duplicates were removed. Read coverages over the mm9 genome were estimated by bamCoverage from deepTools v3.3.155 with parameters --binSize 100 --normalizeUsing RPKM and visualized by UCSC browser56. To minimize the batch and cell type variation in comparisons, the RPKM values of Stacc-seq and ATAC-seq data were further normalized through Z-score transformation.
Peak analyses
Peaks were called using MACS v1.4.257 with the parameters nolambda –nomodel. The peaks in all heatmaps were sorted according to peak enrichment in each group. Promoters were defined as ±2.5 kb around the transcription starting sites (TSS). Pol II peaks at least 2.5 kb away from TSS and excluded from gene body were defined as distal peaks by BEDTools v2.29.058. Differential peaks were identified by those showing fold change (normalized RPKM+0.5) > 2.
OBOX binding site feature annotation
Genomic distributions of OBOX Stacc-seq peaks and randomly shuffled peaks were calculated by ChIPseeker v1.20.059. The Stacc-seq peaks and randomly shuffled peaks were compared to annotated repeats (RepeatMasker) to estimate the enrichment of repetitive elements. The numbers of observed peaks that overlap with a certain type of repeats were compared to the average numbers of a set of random shuffled peaks (100 rounds) that overlap with those repeats, and a log ratio (log2) was generated as the “observed/expected” enrichment.
Motif analyses
The motif analyses were done with HOMER v4.11.160. De novo motifs of OBOX Stacc-seq peaks were identified by findMotifsGenome.pl. The percentages of peaks or promoters containing motifs were estimated by overlapping them with genome-wide motif locations determined by scanMotifGenomeWide.pl based on PWM matrixes of de novo or reported OBOX motifs. For distal ATAC-seq peaks and stage-specific Pol II peaks, findMotifsGenome.pl was applied to enrich the known motifs. OBOX motif density heatmaps were created by annotatePeaks.pl.
OBOX protein sequence alignment
Sequence alignment of OBOX proteins was based on Clustal Omega61. Pairwise correlation between sequences of aligned regions were calculated by Rcpi v1.30.062 with BLOSUM62 as scoring function. Those regions with correlation >0.8 were considered as high conservation regions. Homeobox locations were identified and confirmed with SMART63 and UniProt knowledgebase64.
Extended Data
Extended Data Fig. 1 |. The location and expression of Obox genes.
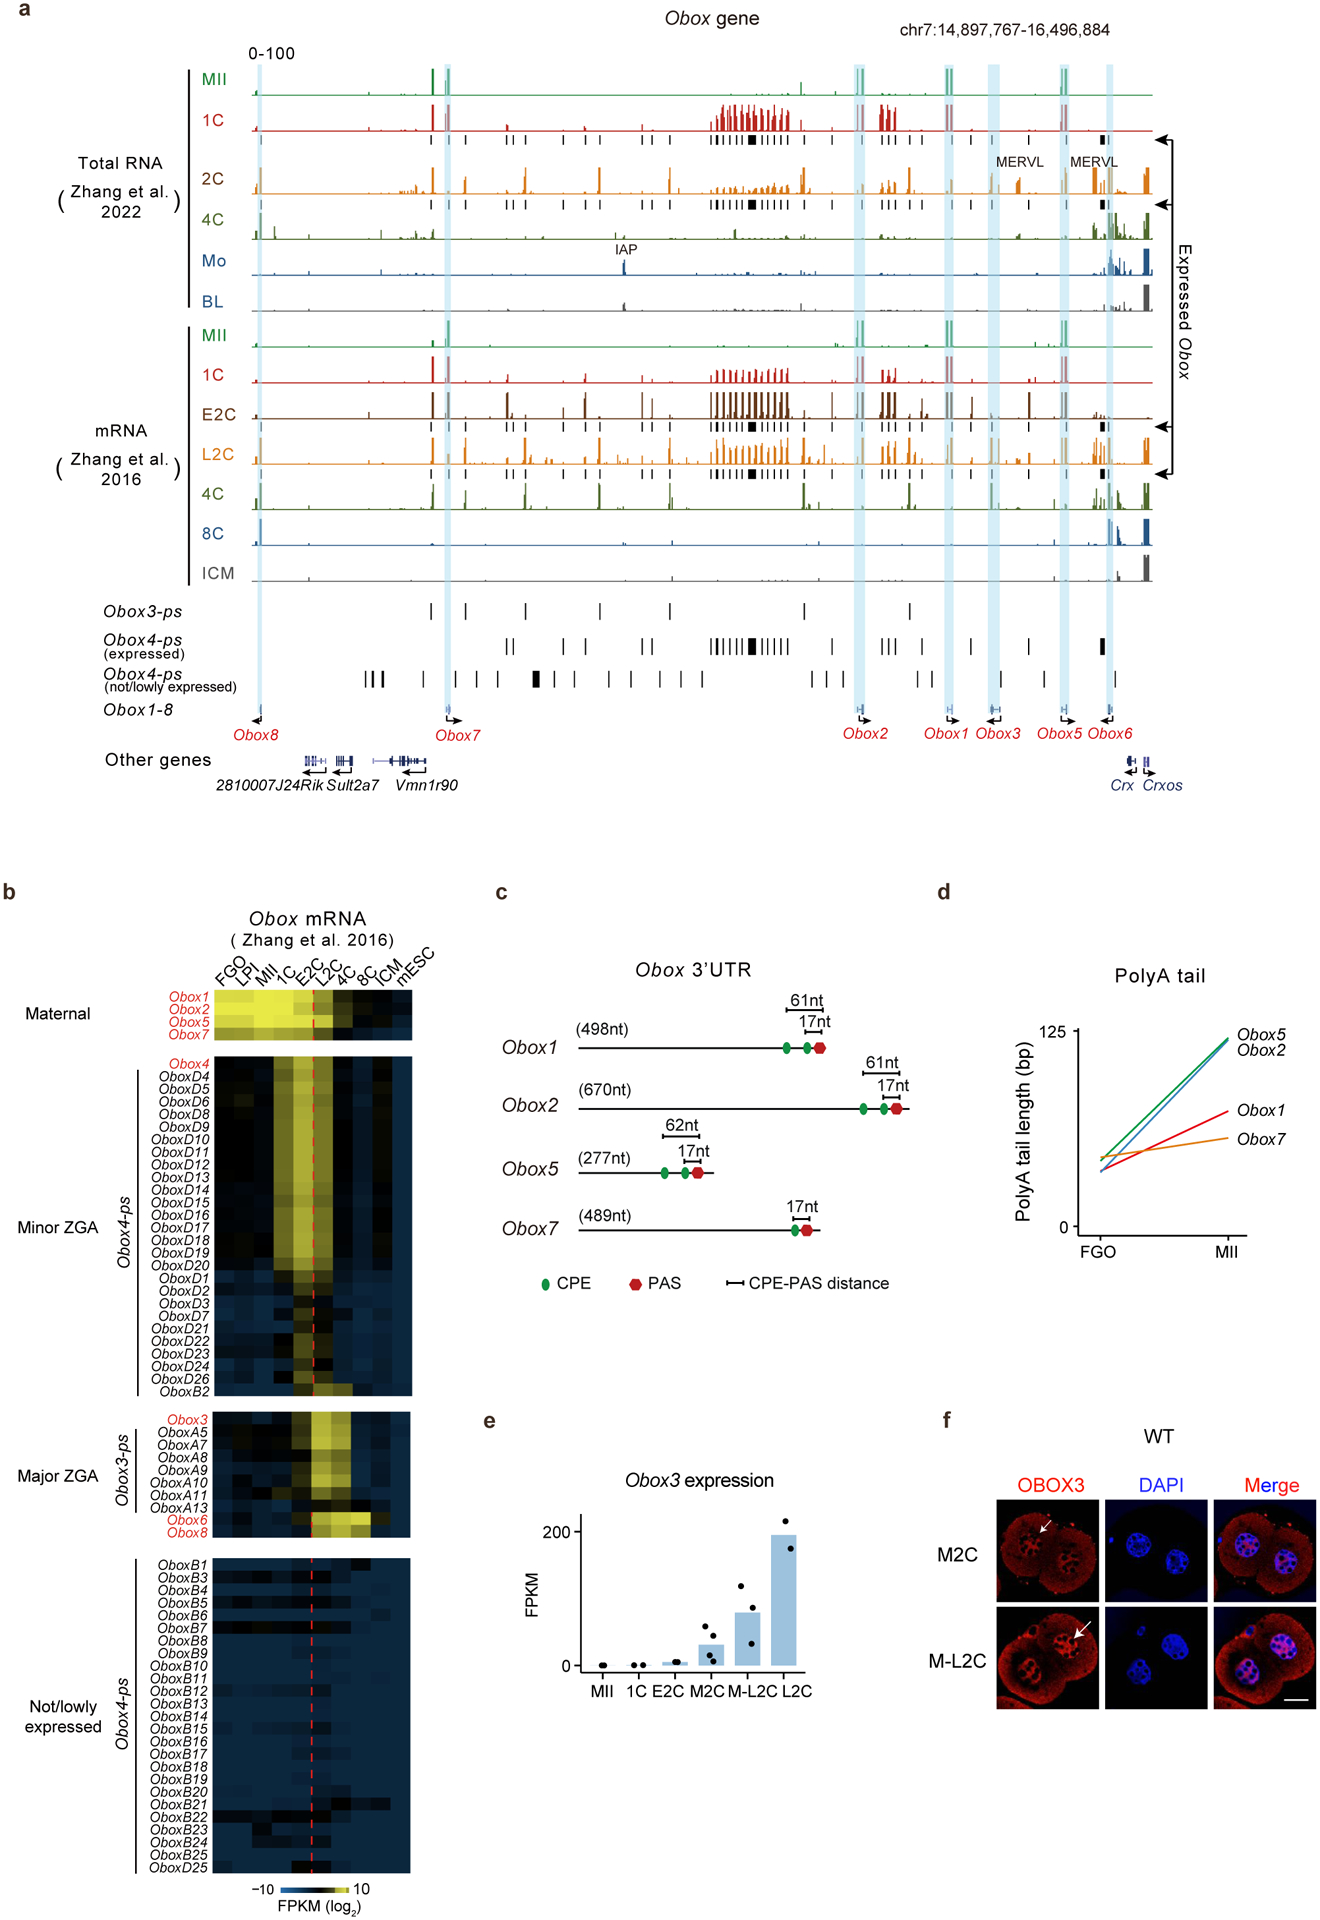
a, The UCSC genome browser snapshots showing Obox location and expression. b, Heatmap showing Obox mRNA levels in oocytes and embryos. c, CPE and PAS locations in maternal Obox 3’UTRs. d, Line plots showing poly(A) tail lengths25 of maternal Obox during oocyte maturation. e, Bar chart showing Obox3 mRNA levels in WT (2–4 biological replicates;10 oocytes or embryos for each group). f, OBOX3 immunofluorescence in 2C embryos. M2C, mid-2-cell; M-L2C, mid-to-late 2-cell (3 biological replicates). Scale bar, 20 μm. Arrow, nuclear OBOX3.
Extended Data Fig. 2 |. OBOX protein levels in oocytes and early embryos.
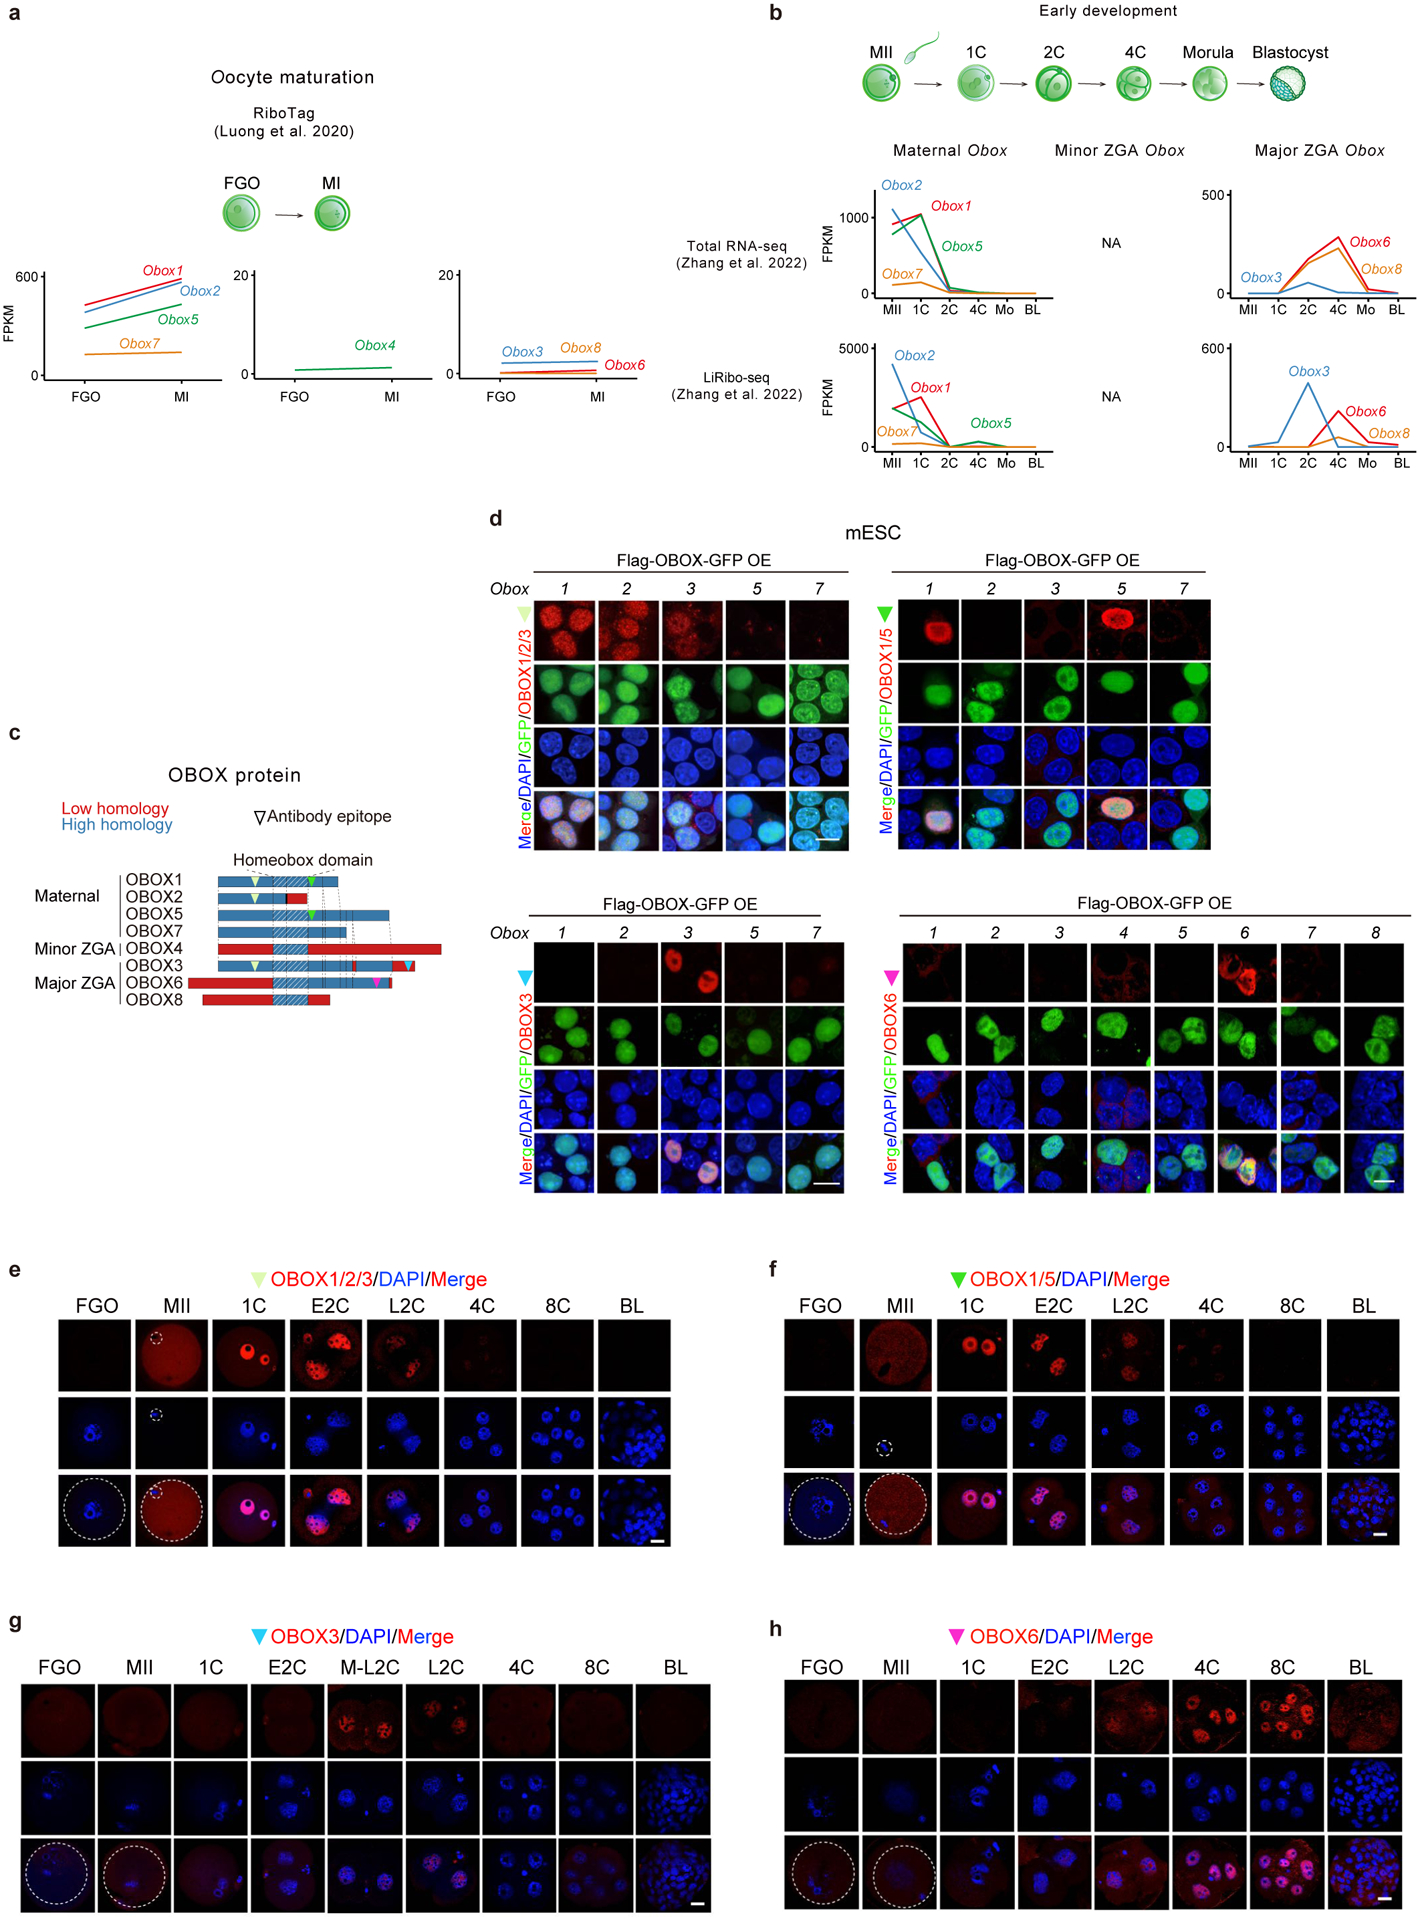
a-b, Line plots showing Obox mRNA and translation levels during oocyte maturation (2 biological replicates) and early embryo development (2 biological replicates) based on datasets from the previous publications30,31. NA, data not available. c, OBOX antibody epitope locations. d, Immunofluorescence showing OBOX signals detected by OBOX antibodies upon Flag-OBOX-GFP overexpression in mESCs (2 biological replicates). Scale bar, 10μm. e-h, OBOX immunofluorescence in mouse oocytes and embryos (3 biological replicates). BL, blastocyst. Scale bar, 20 μm.
Extended Data Fig. 3 |. Individual Obox knockdown had limited effects on preimplantation development.
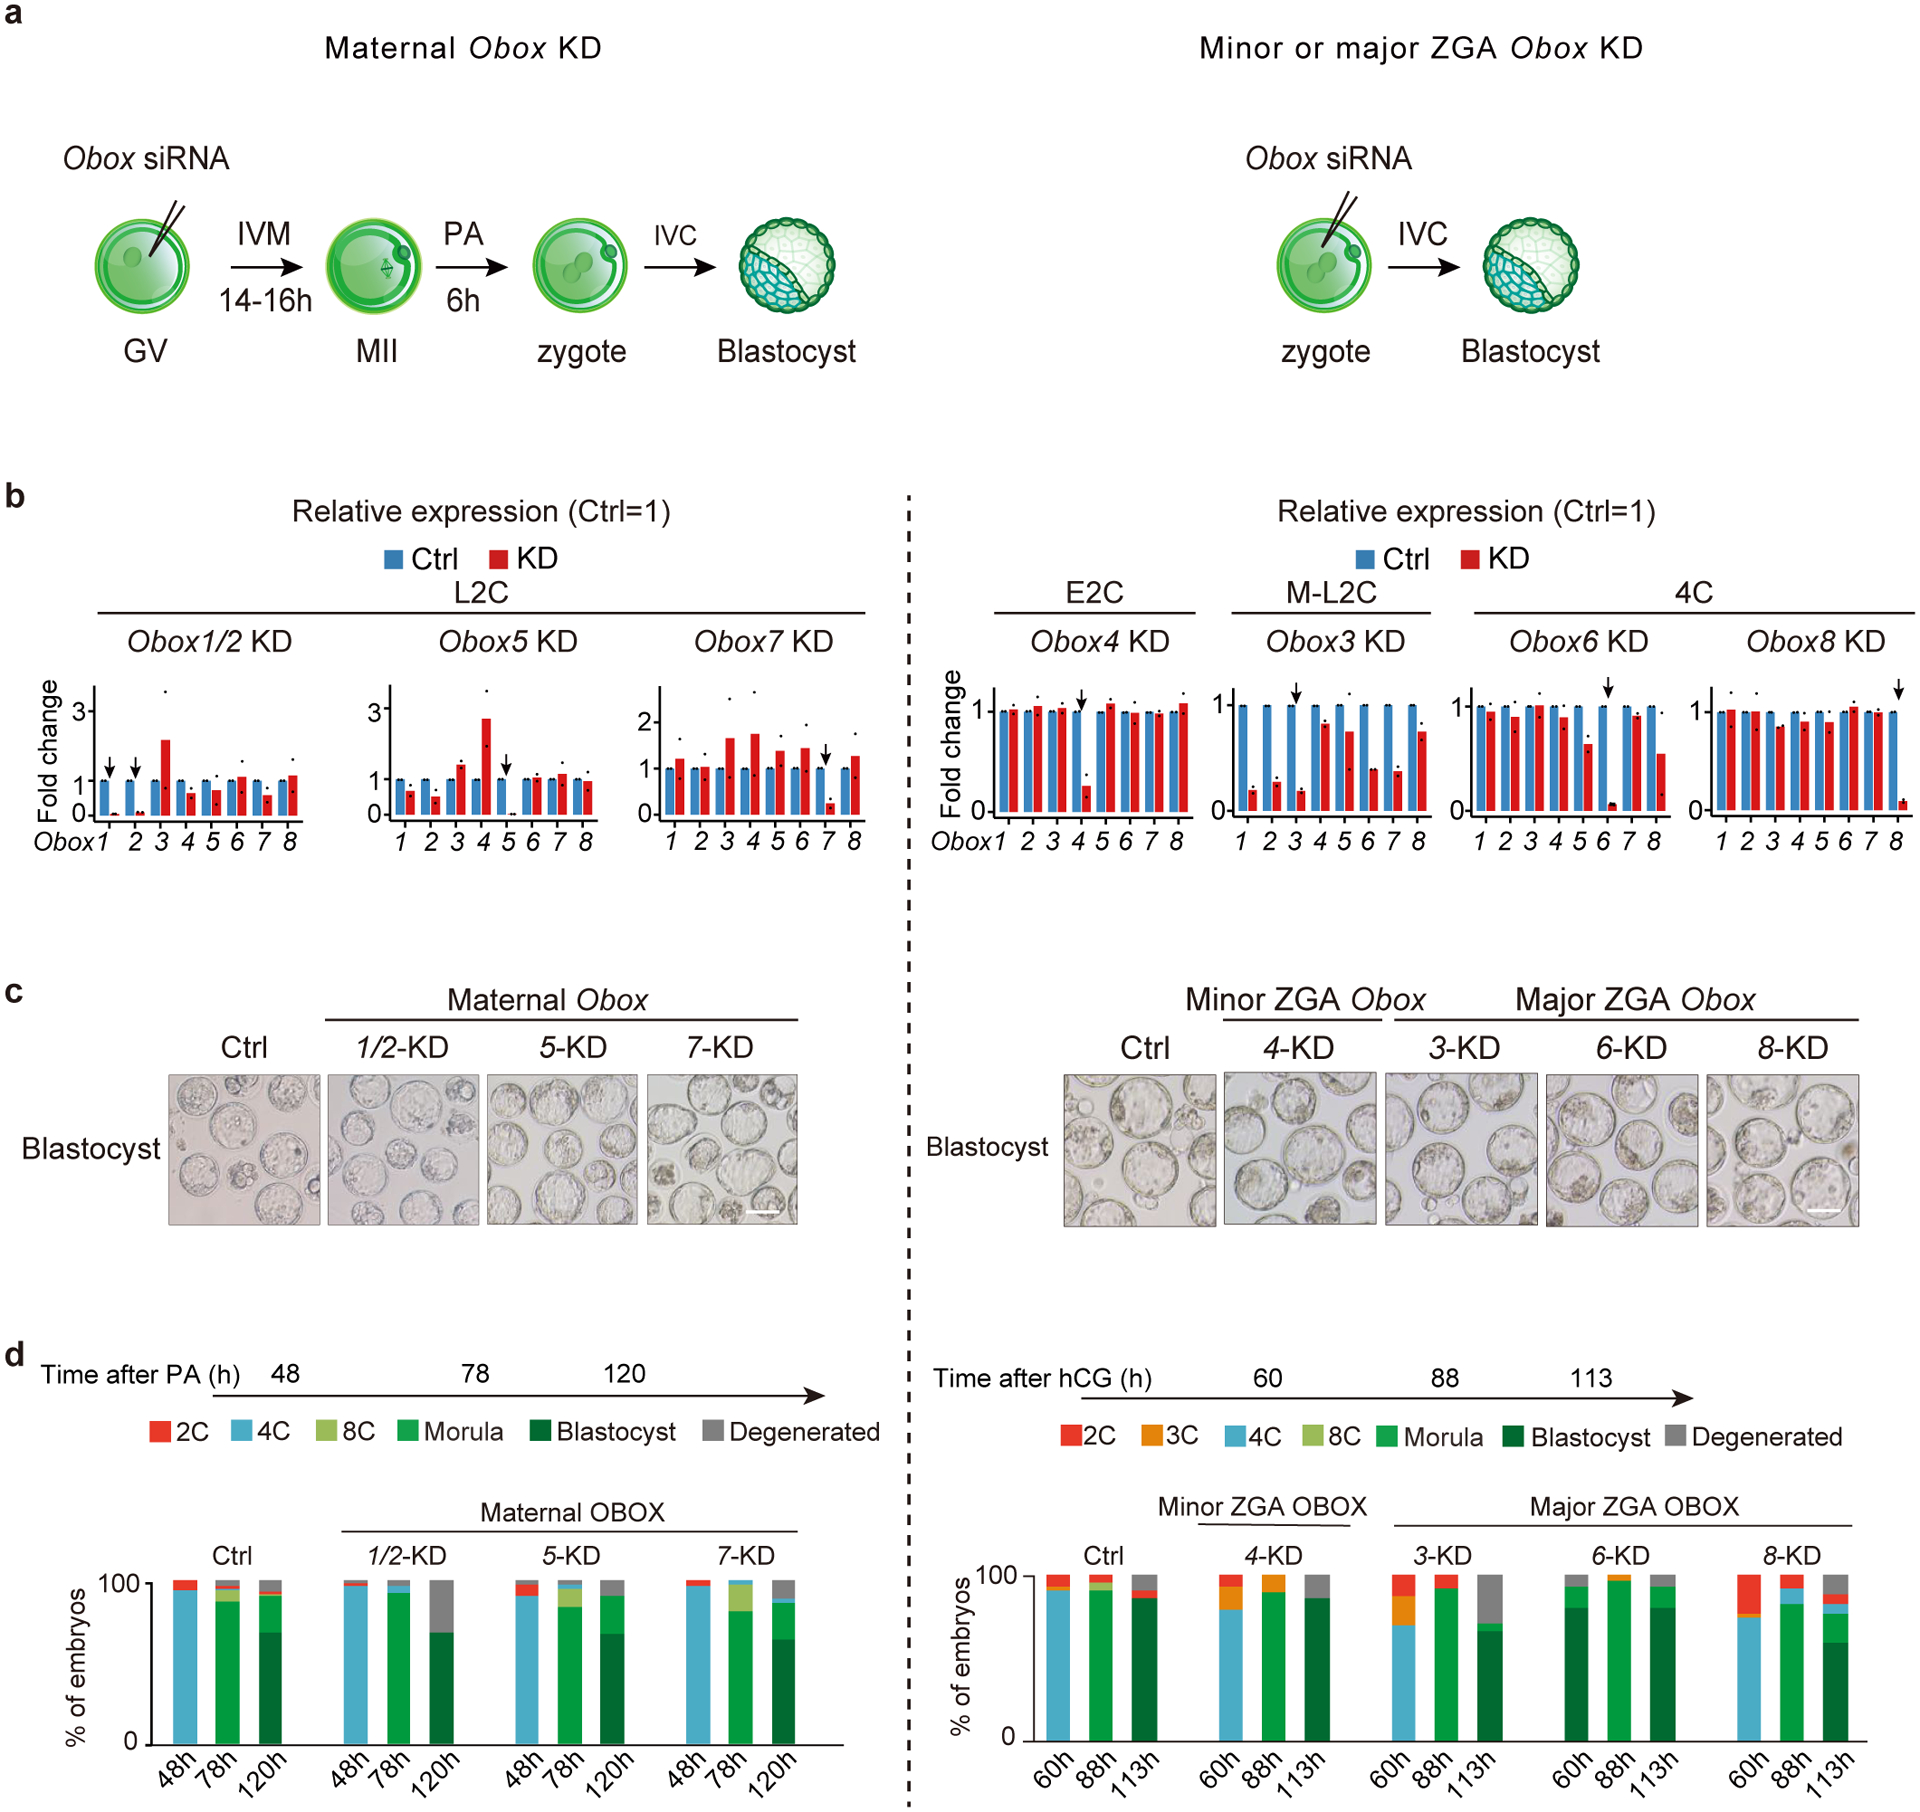
a, Schematic of individual Obox knockdown. b, Bar chart showing the Obox knockdown efficiency in embryos (2 biological replicates; 10 embryos for each group). The control RNA levels were normalized to 1. Arrow, targeted Obox. c, Embryo morphology upon individual Obox knockdown at the blastocyst stage (2 biological replicates). Scale bars, 100 μm. d, Developmental rate upon individual Obox knockdown (2 biological replicates).
Extended Data Fig. 4 |. Obox depletion did not affect oocyte maturation.
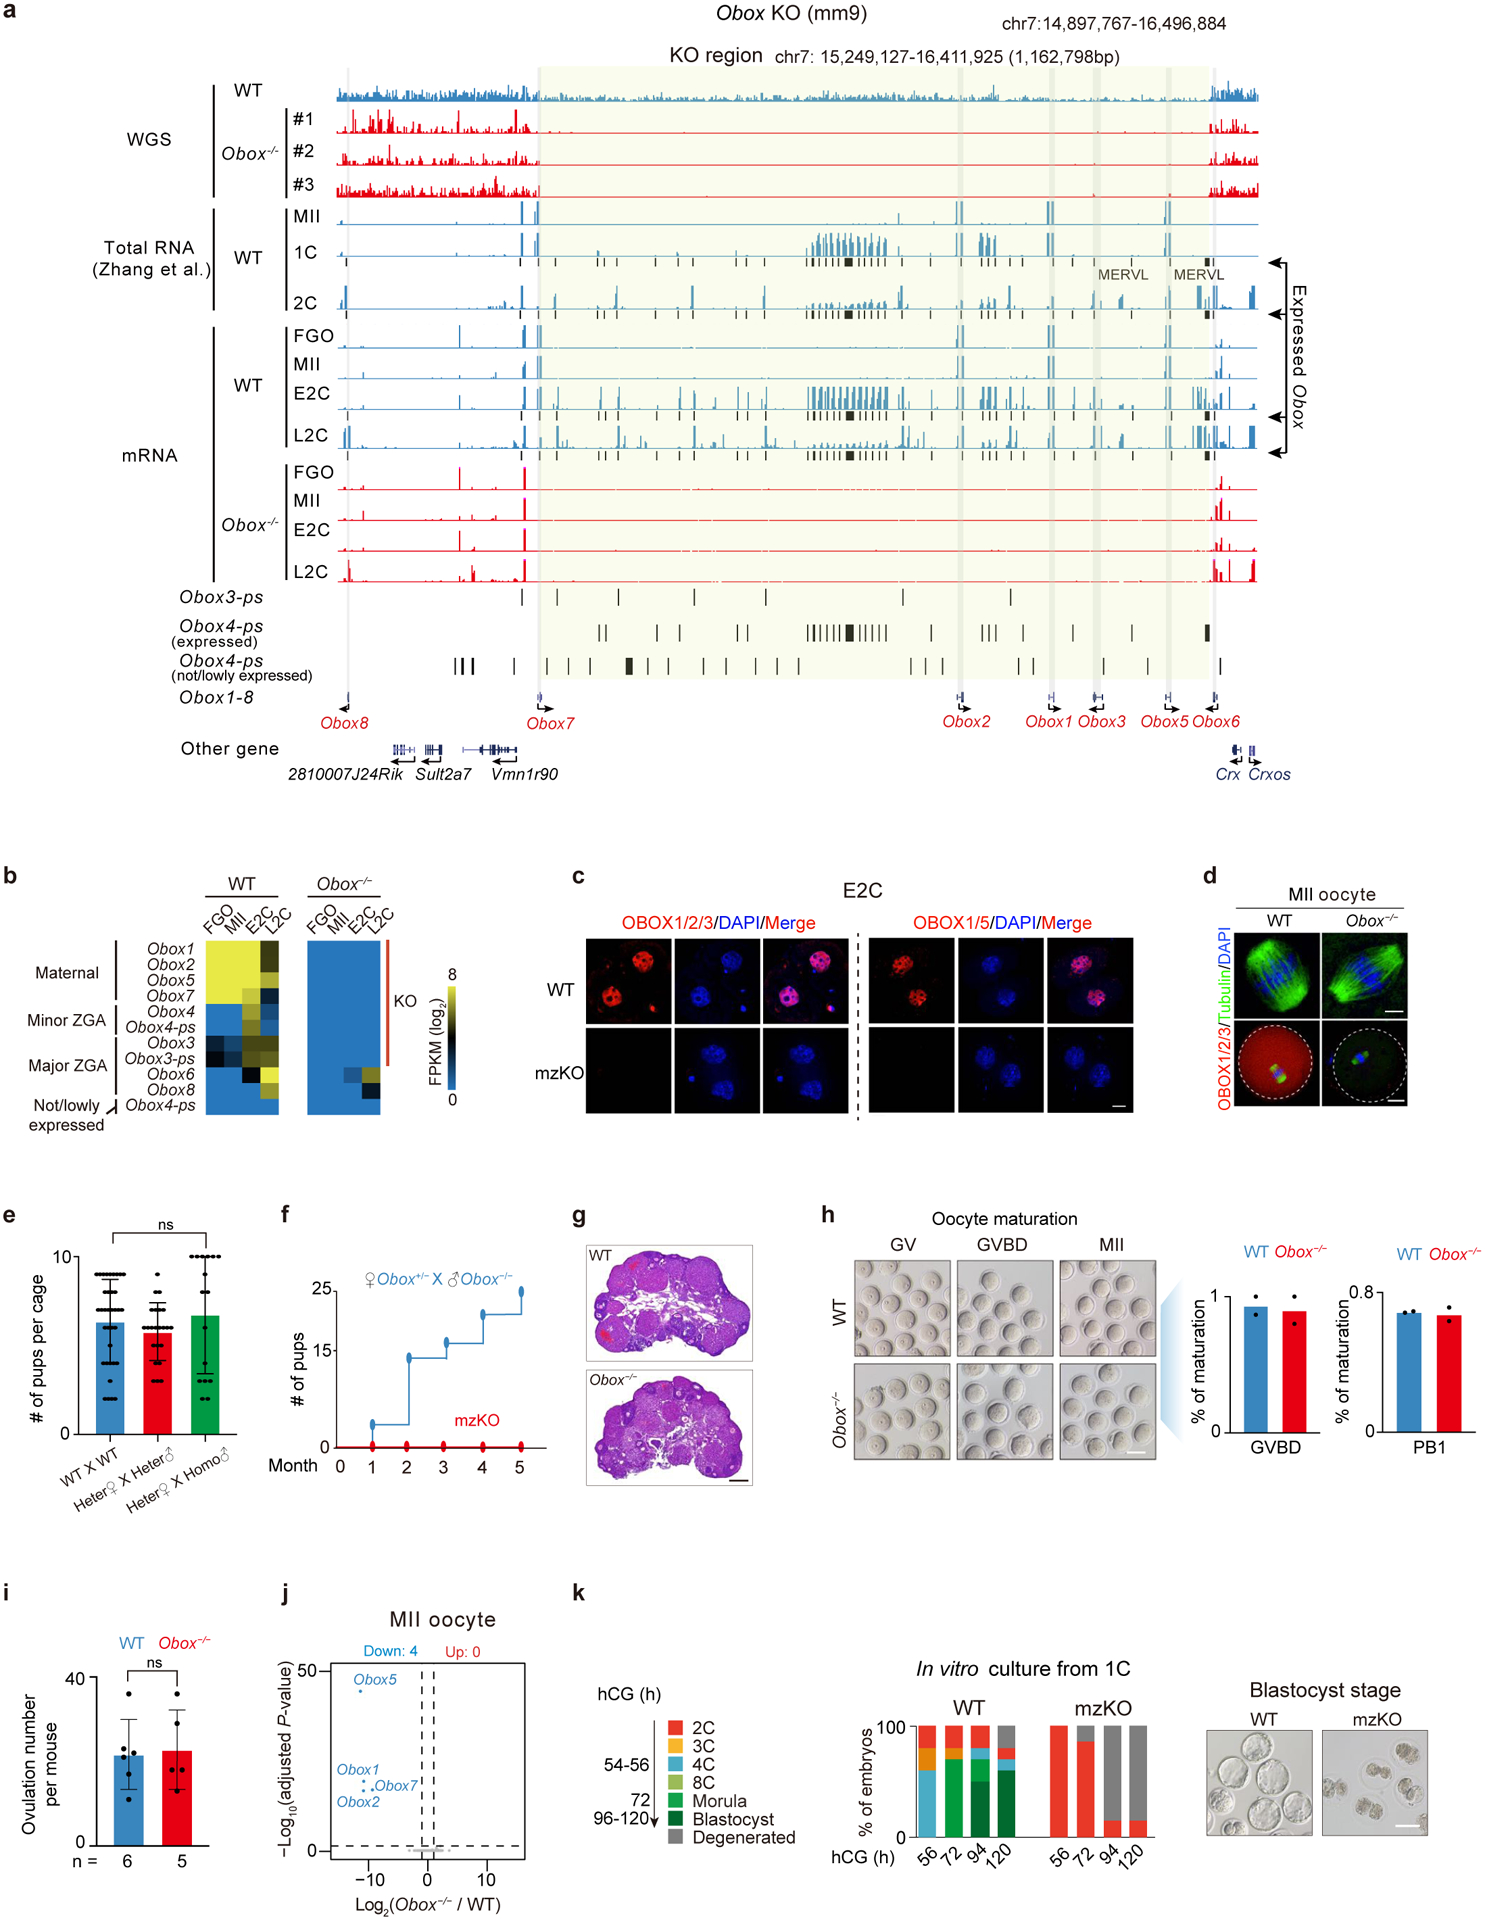
a, Whole-genome sequencing (WGS) and RNA-seq showing Obox genes and expression. Yellow shade, the deleted Obox. #1/#2/#3, three Obox mzKO mice. b, RNA-seq showing Obox levels (2 or 3 biological replicates). KO, the knocked out Obox genes. c, OBOX staining in WT and Obox mzKO embryos (2 biological replicates). Scale bar, 20 μm. d, Tubulin and OBOX staining in WT and Obox−/− oocytes (3 biological replicates). Scale bars, 5 μm (top) and 20 μm (bottom). e, Bar chart showing offspring numbers with different crossing strategies. 37, 23, and 16 cages for WT × WT, heterozygote × heterozygote, and homozygote × homozygote, respectively. ns, not significant (P-value = 0.69, two-sided t-test). Data are presented as mean values ± SD. f, Fertility test of mzKO (four female mice per group). g, HE staining (3 biological replicates). Scale bar, 0.25mm. h, Bright-field images and bar charts showing oocyte morphology and maturation percentages upon OBOX depletion (2 biological replications). GVBD, germinal vesicle breakdown; PB1, the first polar body. Scale bar, 75μm. i, Bar chart showing the numbers of ovulated oocytes per mouse. n, number of mice used. P-value = 0.84, two-sided t-test. Data are presented as mean values ± SD. j, Volcano plot showing gene expression changes between Obox−/− and WT oocytes (2 biological replicates). Dashed line, adjusted P-value threshold 0.05. k, Embryo morphology and developmental rate in vitro (5 biological replicates). Scale bar, 75 μm.
Extended Data Fig. 5 |. Maternal and zygotic OBOX redundantly support early development.
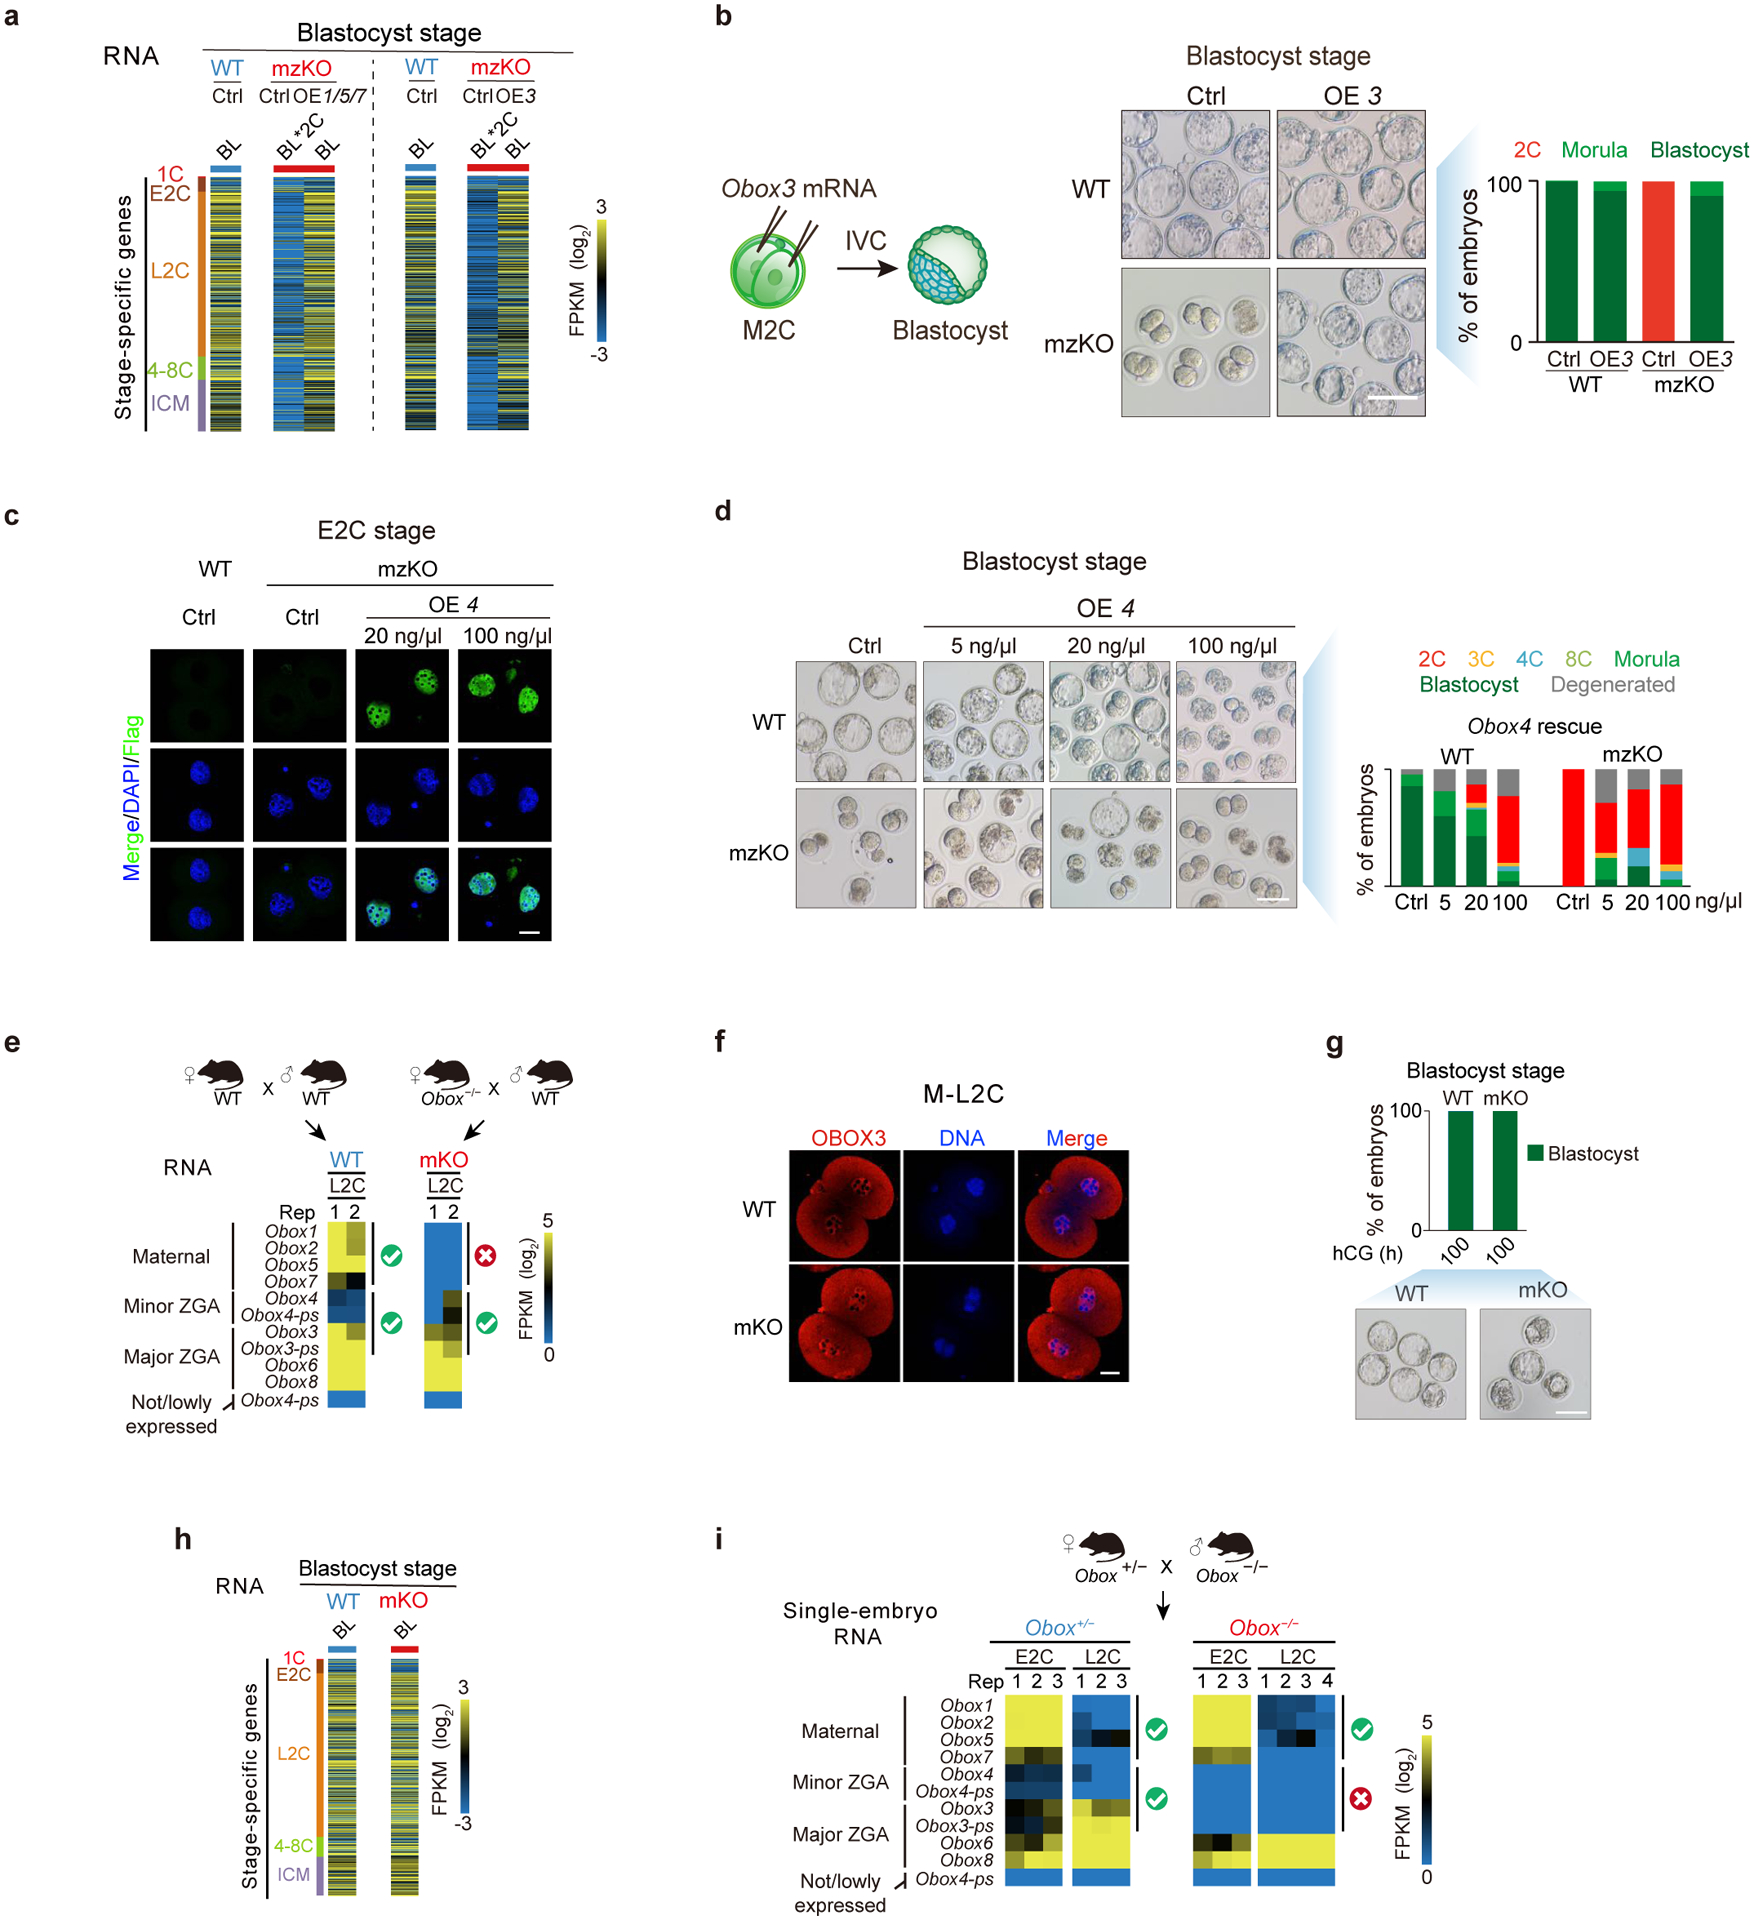
a, Expression of stage-specific genes in WT, Obox mutant, and rescued embryos. BL*2C, Obox mzKO embryos arrested at 2C when WT developed to blastocyst. b, Schematic of OBOX3 rescue in Obox mzKO embryos with embryo morphology and developmental rates shown (3 biological replicates). Scale bar, 100 μm. c-d, OBOX4 expression (c), embryo morphology, and developmental rate (d) with or without Obox4 rescue (3 biological replicates). Scale bar, 75 μm. e, RNA-seq showing Obox levels in WT and maternal Obox knockout embryos. Check and cross, the presence or absence of Obox mRNAs. f, OBOX3 immunofluorescence in WT and Obox mKO embryos (3 biological replicates). Scale bar, 20 μm. g-h, Embryo morphology, developmental rate (g), and expression of stage-specific genes (h) for WT and Obox mKO embryos in vivo at the blastocyst stage (2 biological replicates). Scale bar, 100 μm. i, Obox expression levels in Obox mutant embryos.
Extended Data Fig. 6 |. Obox depletion impaired ZGA and MERVL activation.
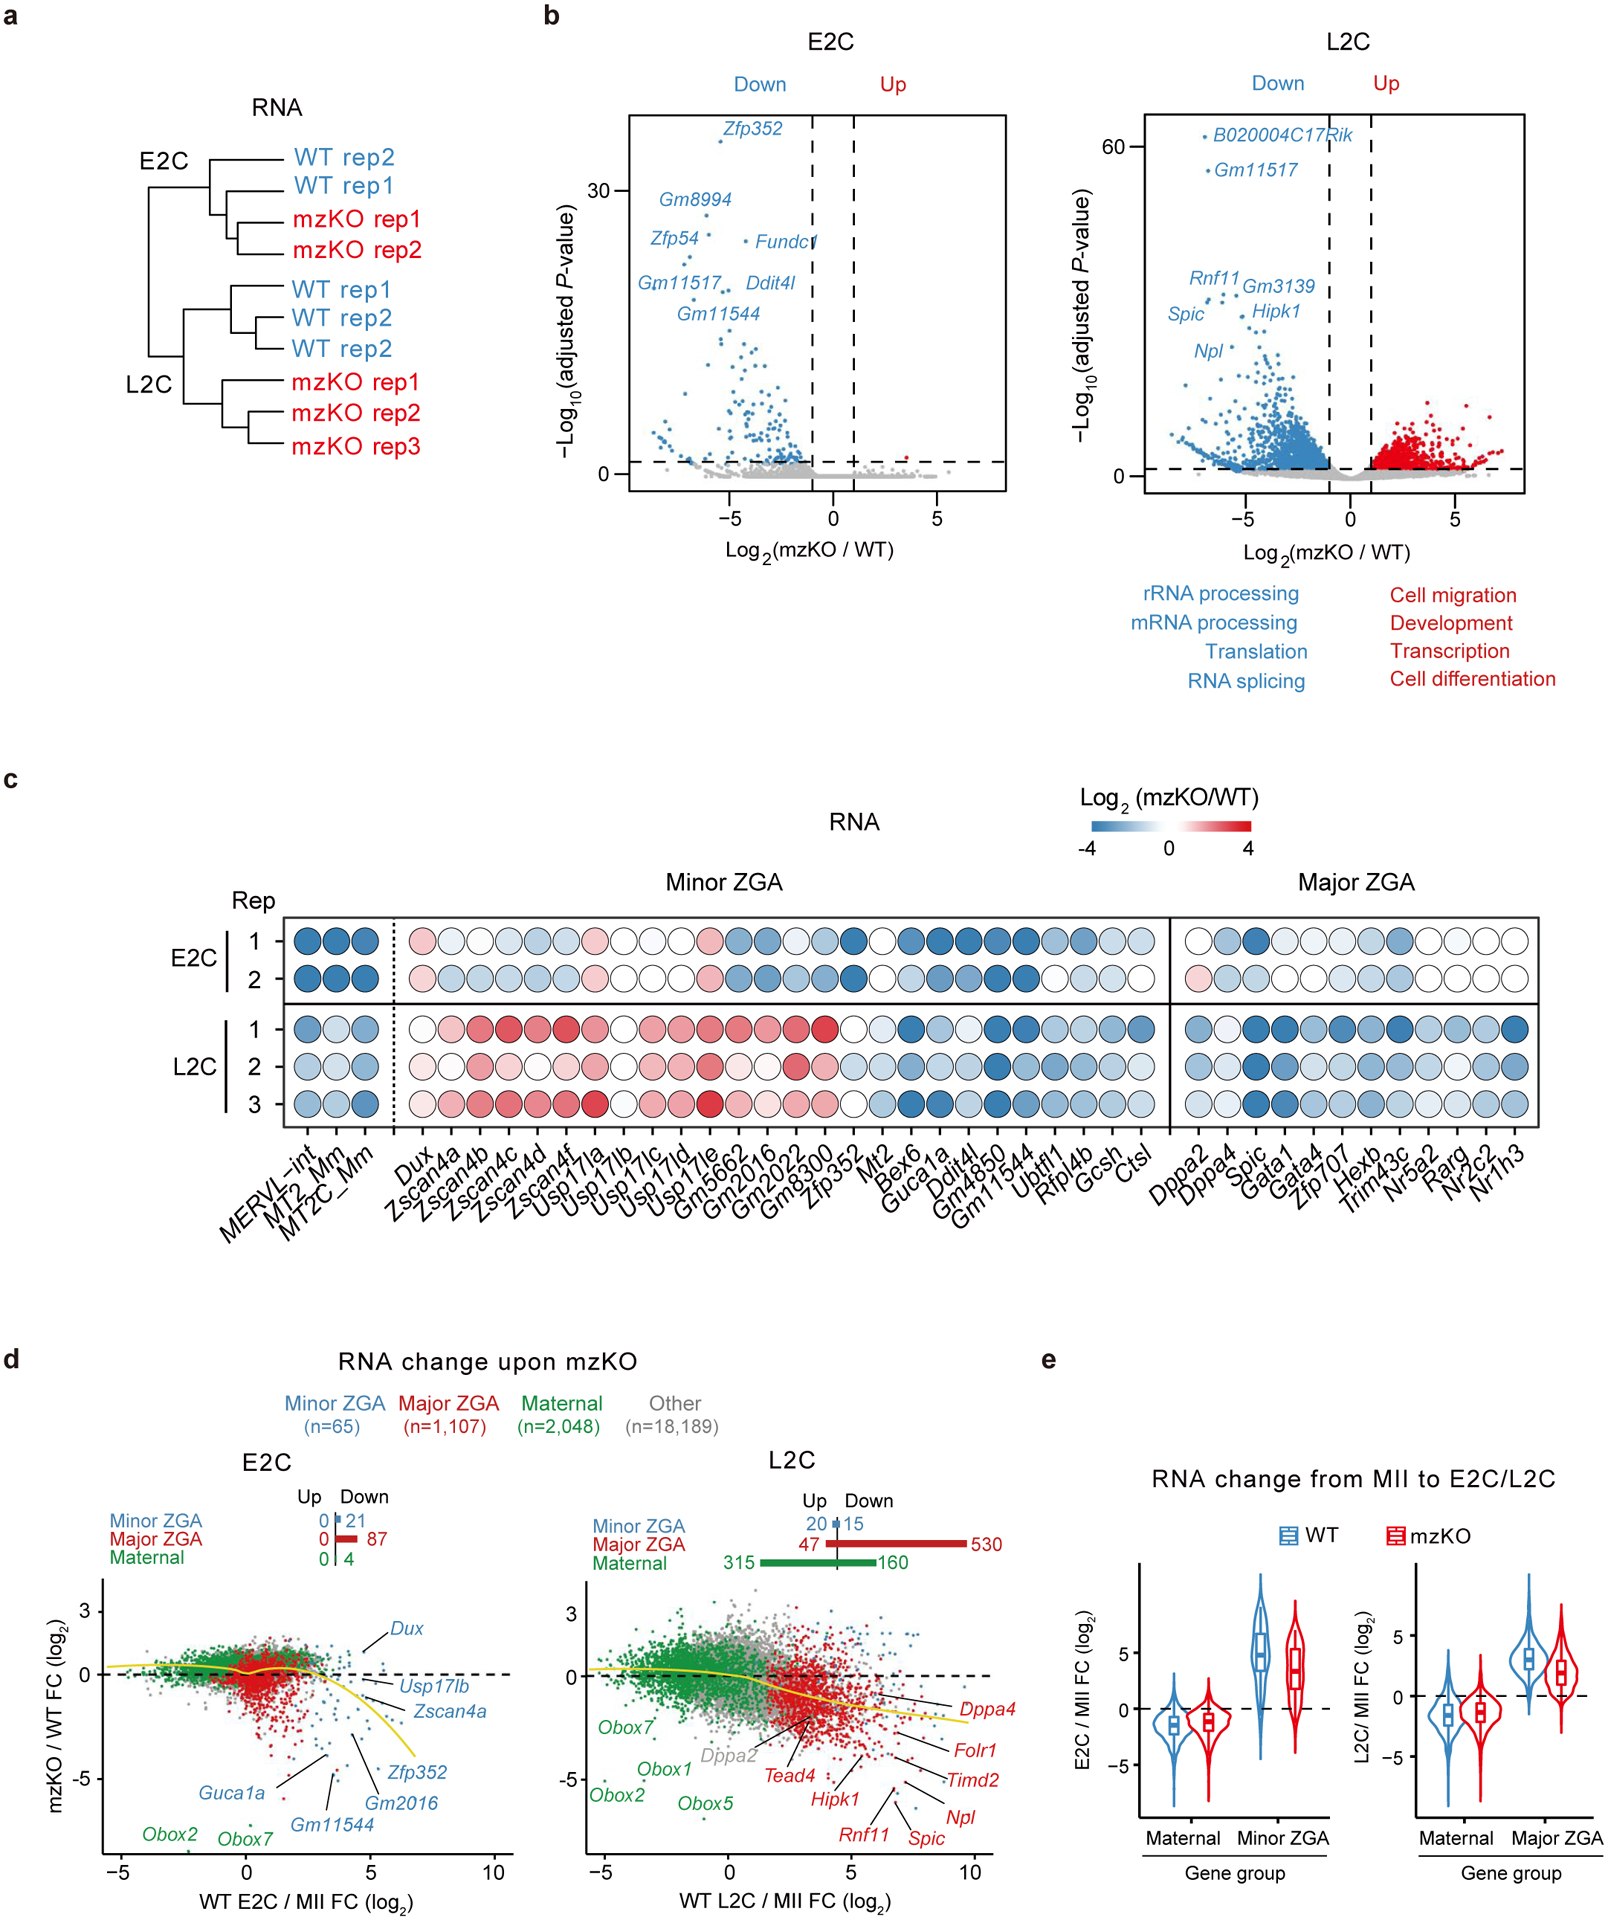
a, Hierarchical clustering based on RNA-seq (2 biological replicates for E2C and 3 for L2C). b, Volcano plot showing gene expression changes upon Obox depletion (2 biological replicates for E2C and 3 for L2C). Dashed line, adjusted P-value threshold 0.05. GO terms are shown. c, Balloon plot showing gene expression changes (mzKO/WT) for MERVL and ZGA genes at 2C (2 biological replicates for E2C and 3 for L2C). d, Scatter plot showing gene expression fold-changes upon Obox depletion (2 biological replicates for E2C and 3 for L2C). FC, fold-change. Yellow lines, local regression fitting. e, Violin plot showing maternal and ZGA gene expression changes from oocytes to E2C or L2C in WT and Obox mzKO embryos (2 biological replicates for MII, E2C and 3 for L2C). Centre line, median; box, 25th and 75th percentiles; whiskers, 1.5 × IQR.
Extended Data Fig. 7 |. OBOX binding in 2-cell embryos.
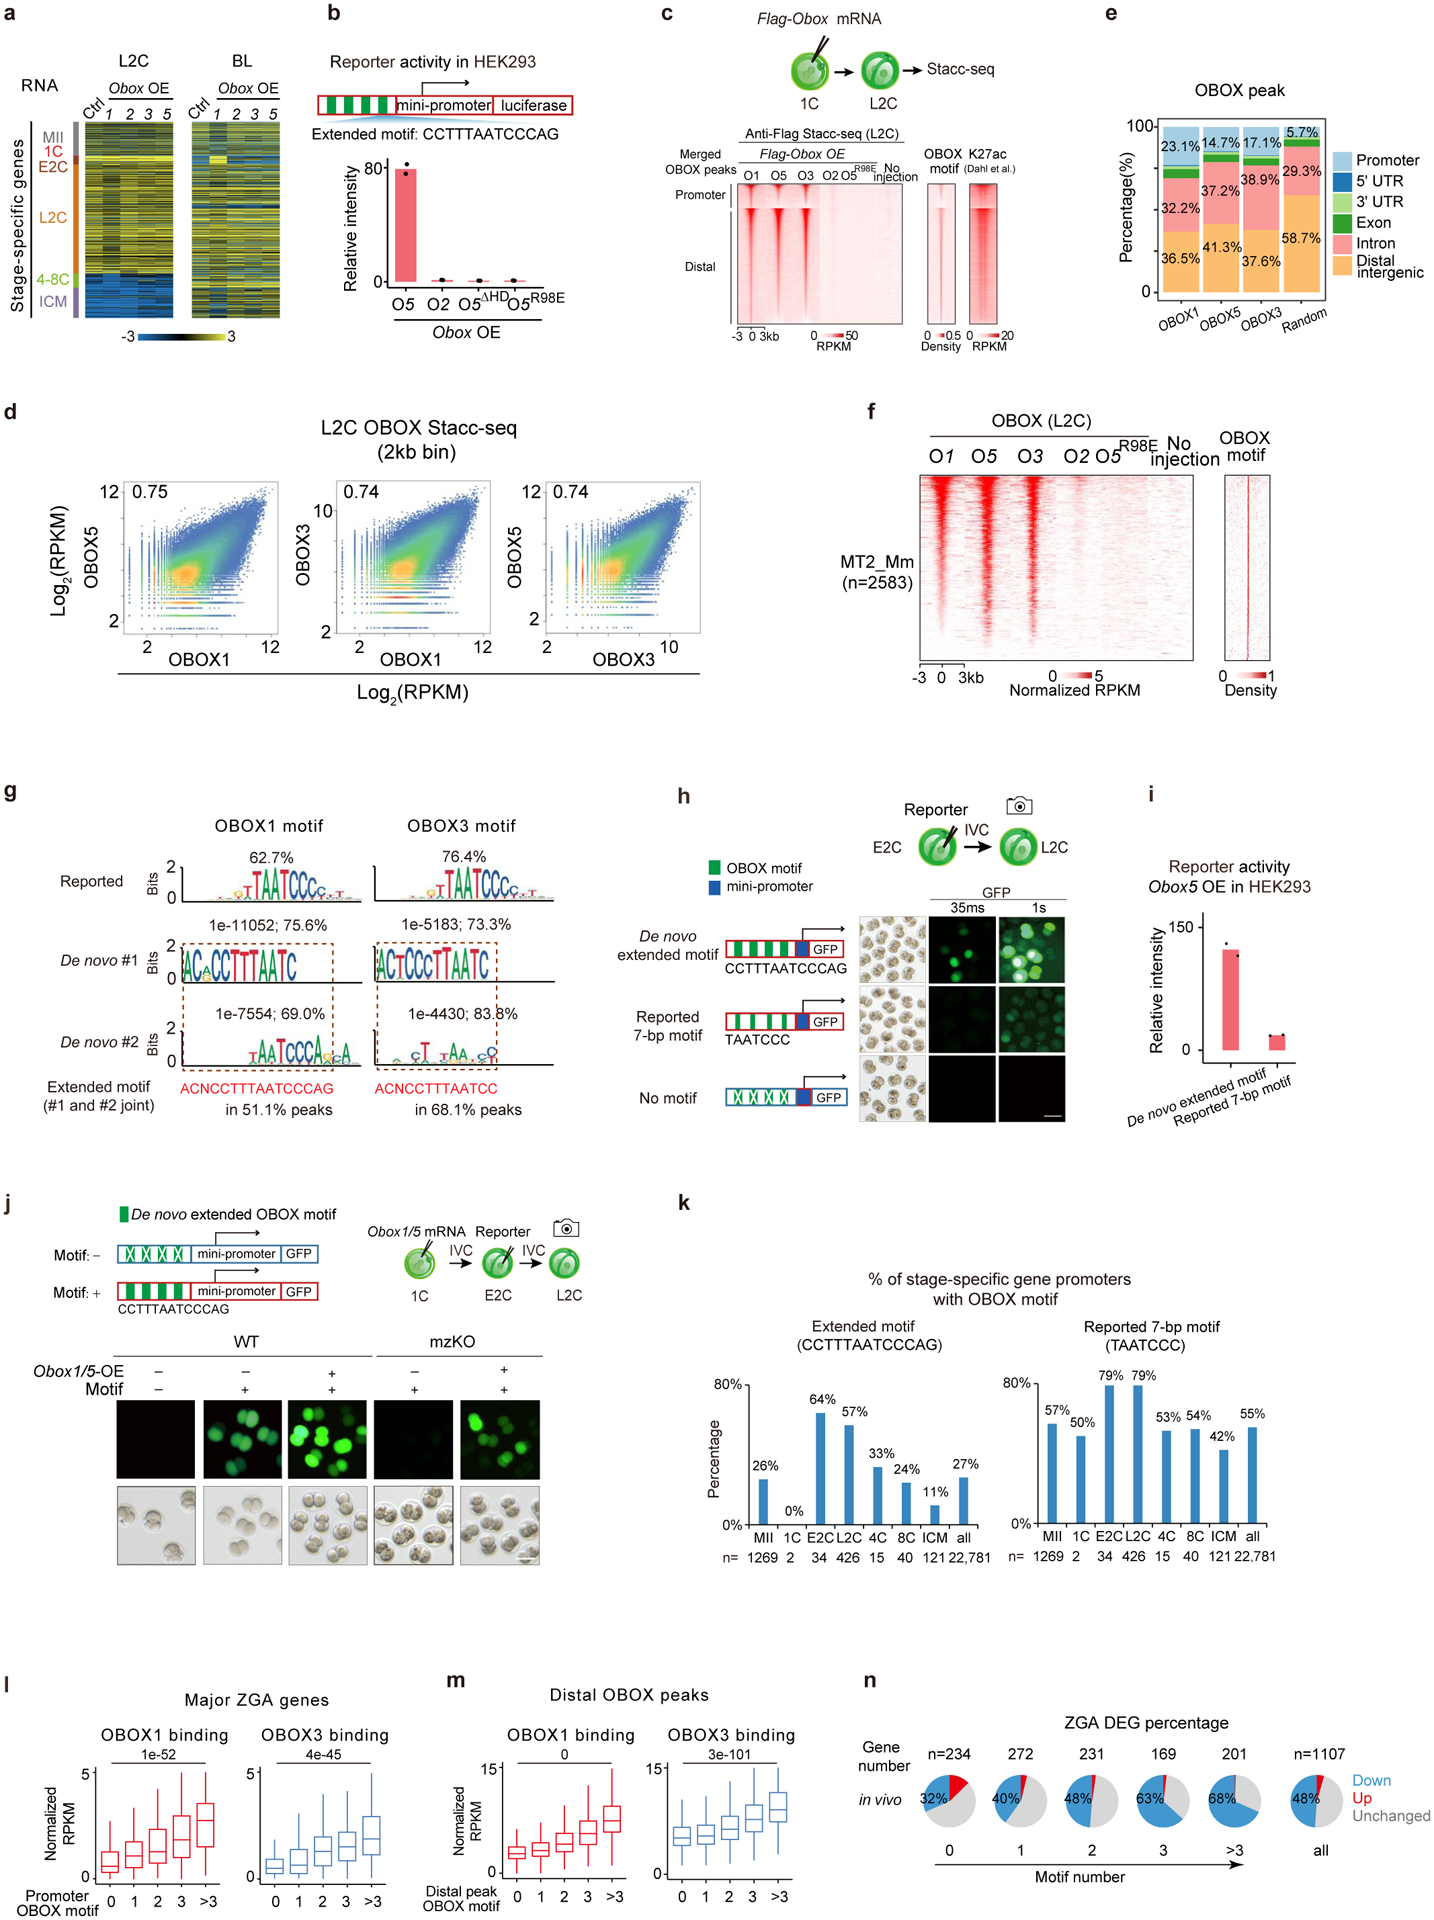
a, Stage-specific gene expression upon Obox overexpression in WT embryos. b, Luciferase reporter assay showing OBOX gene activation abilities in HEK293 cells (2 biological replicates). ΔHD, homeobox domain deletion. c, Heatmap showing OBOX binding at L2C. OBOX motif densities and H3K27ac42 are shown. d, Scatter plot comparing OBOX binding at L2C. e, Bar chart showing the genomic distribution of OBOX binding at L2C. f, Heatmap showing OBOX binding on MERVL at L2C. OBOX motif is shown. n, peak number. g, Motif identified in OBOX binding sites in embryos. Percentages and P-values are shown. h, OBOX motif reporter assay in WT mouse embryos (2 biological replicates). Exposure time is shown. i, Luciferase reporter intensities in HEK293 cells (2 biological replicates). j, OBOX motif reporter assay in WT and Obox mzKO embryos (3 biological replicates). + and −, presence and absence of Obox1/5 mRNAs or extended motif, respectively. Scale bar, 75 μm. k, Bar chart showing OBOX motif occurrence at the stage-specific gene promoters. l-m, Box plots showing OBOX binding enrichment at major ZGA gene promoters (l) and distal regions (m) in WT L2C. 234, 272, 232, 169, and 201 genes have 0, 1, 2, 3, and >3 OBOX motifs on promoters, respectively. 9,855, 18,416, 7,142, 2,135, and 1,257 distal OBOX1 binding peaks have 0, 1, 2, 3, and >3 OBOX motifs, respectively. 5,918, 15,350, 4,795, 1,000, and 261 distal OBOX3 binding peaks have 0, 1, 2, 3, and >3 OBOX motifs, respectively. P-values, two-sided Wilcoxon rank-sum test. Centre line, median; box, 25th and 75th percentiles; whiskers, 1.5 × IQR. n, Percentages of ZGA genes that showed gene expression changes upon Obox depletion at L2C (3 biological replicates).
Extended Data Fig. 8 |. Depletion of OBOX led to Pol II pre-configuration defects and ectopic activation of 1C Pol II targets.
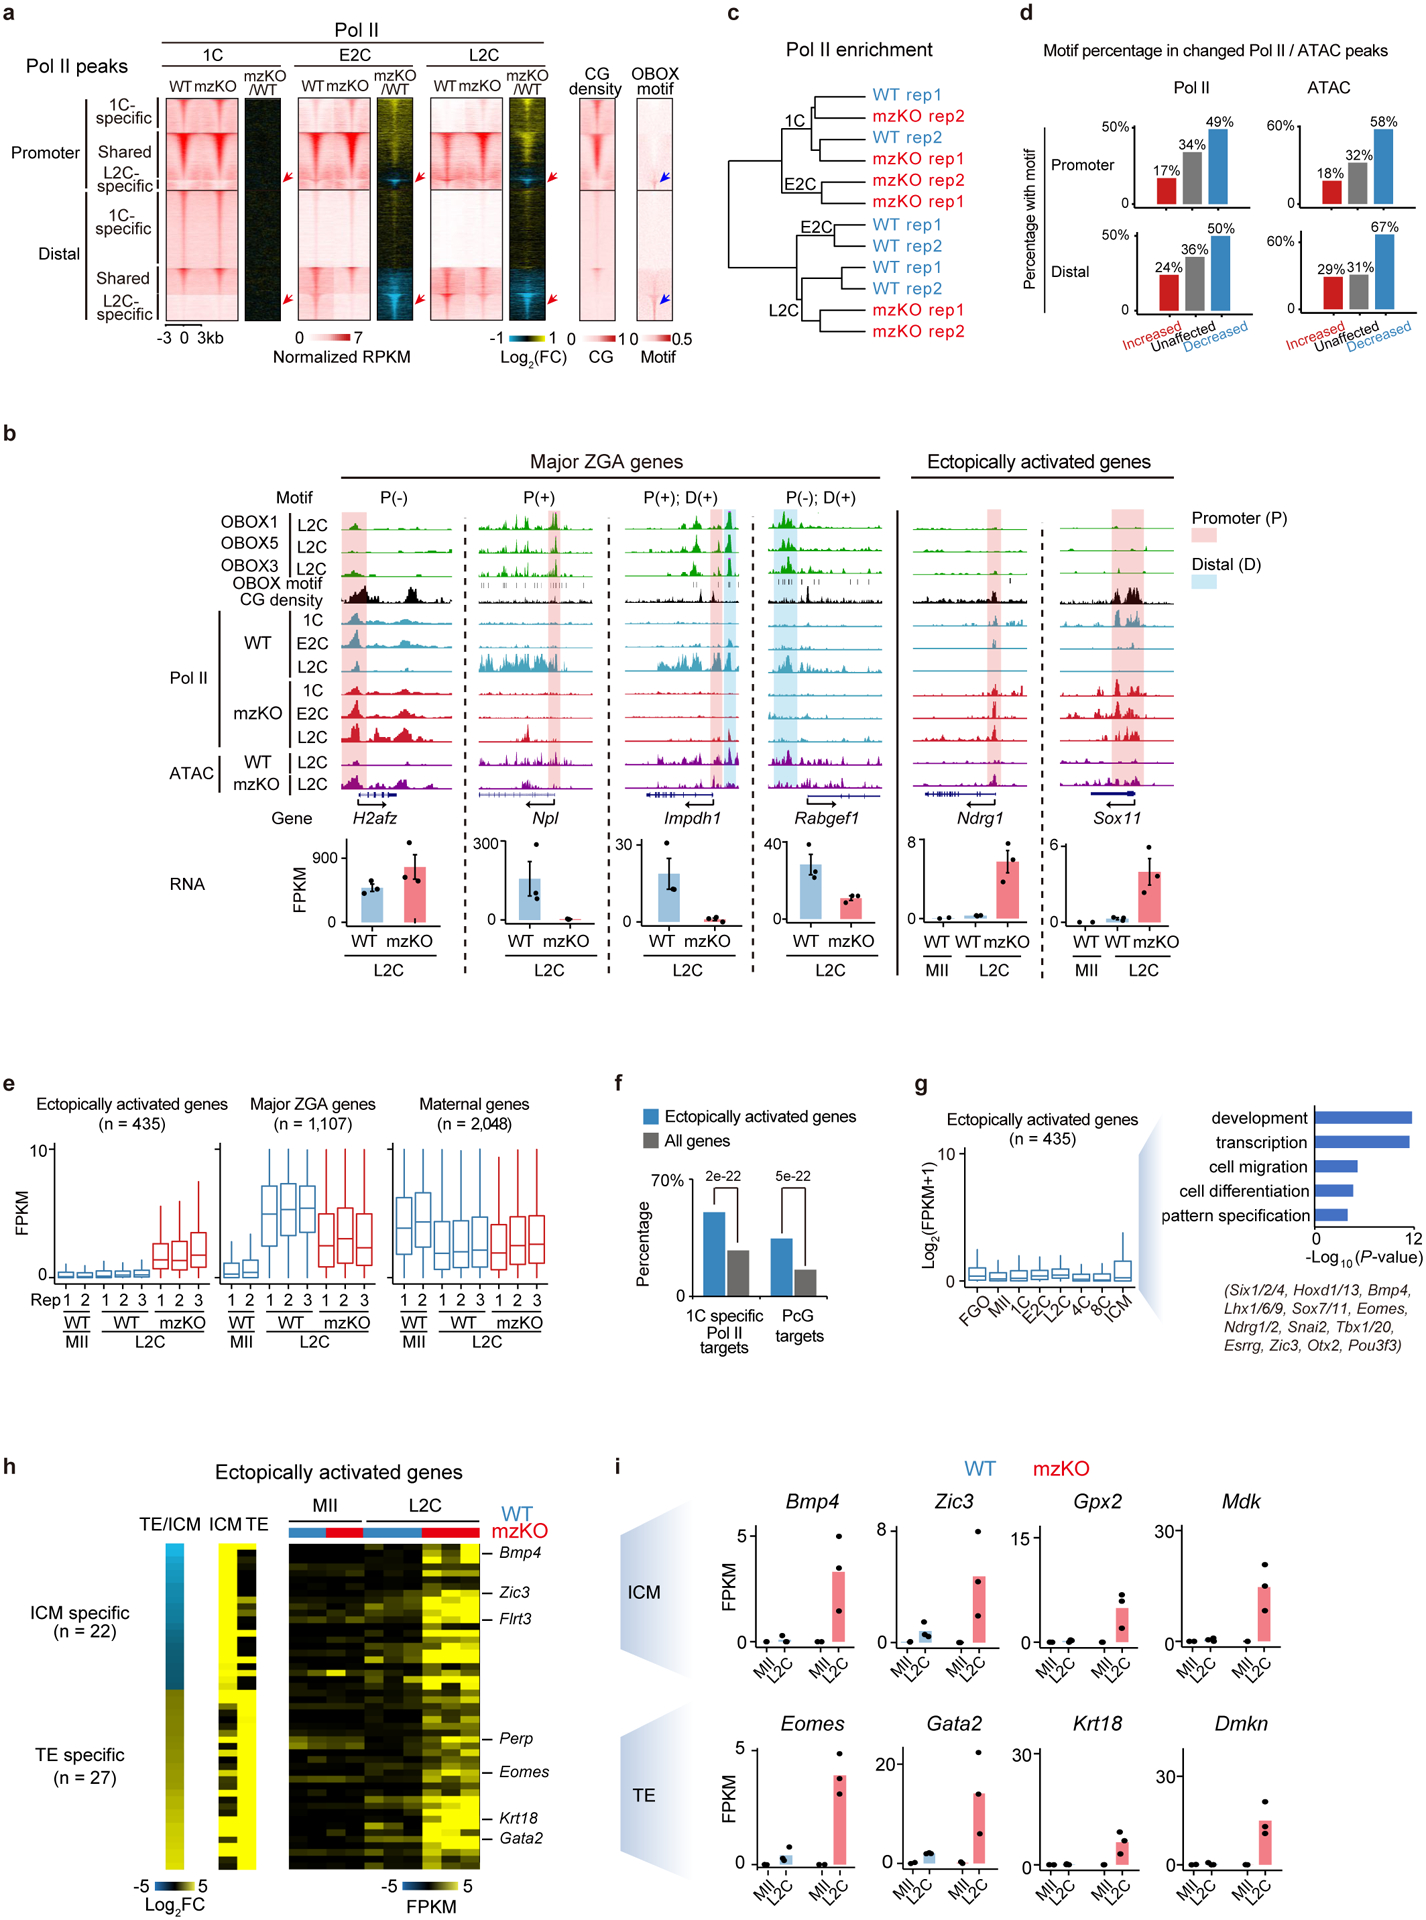
a, Pol II binding, CG density, and OBOX motif enrichment at 1C-specific, shared, and L2C-specific Pol II peaks in WT and Obox mzKO embryos. Red and blue arrows indicate L2C-specific Pol II binding and enrichment of the OBOX motif, respectively. b, Top, OBOX binding at example genes in WT embryos. OBOX motif and CG density are shown. Middle, Pol II binding and ATAC enrichment in WT and Obox mzKO embryos (2 biological replicates). P (+/−), promoter with or without the OBOX motif; D (+), distal enhancer with the OBOX motif. Bottom, bar charts showing gene expression (2 biological replicates for MII and 3 for L2C). Error bars, mean ± SE. c, Hierarchical clustering based on Pol II Stacc-seq (2 biological replicates). d, Percentages of Pol II or ATAC peaks with OBOX motif at the promoters or distal regions at L2C. e, Box plot showing RNA levels of ectopically activated genes, major ZGA genes, and maternal genes. n, gene number. Centre line, median; box, 25th and 75th percentiles; whiskers, 1.5 × IQR. f, Percentages of ectopically activated genes or all genes (control) that are 1C-specific Pol II targets or Polycomb targets (PcG). P-values, two-sided Fisher’s exact test. g, RNA levels in WT oocytes and embryos for ectopically activated genes. GO terms and example genes are shown. Centre line, median; box, 25th and 75th percentiles; whiskers, 1.5 × IQR. h, Heatmap showing gene expression in ICM, TE, and the ratio of TE/ICM in WT embryos for ectopically activated ICM and TE genes in Obox knockout embryos. Gene expression for WT and Obox mzKO MII oocytes (2 biological replicates) and embryos (3 biological replicates) is mapped. n indicates gene number. 4C*, the stage when WT developed to 4C and Obox mzKO embryos arrested at 2–4C. i, Bar chart showing gene expression of example ICM and TE genes from h.
Extended Data Fig. 9 |. Obox overexpression activated ZGA genes and MERVL in 2i mESCs.
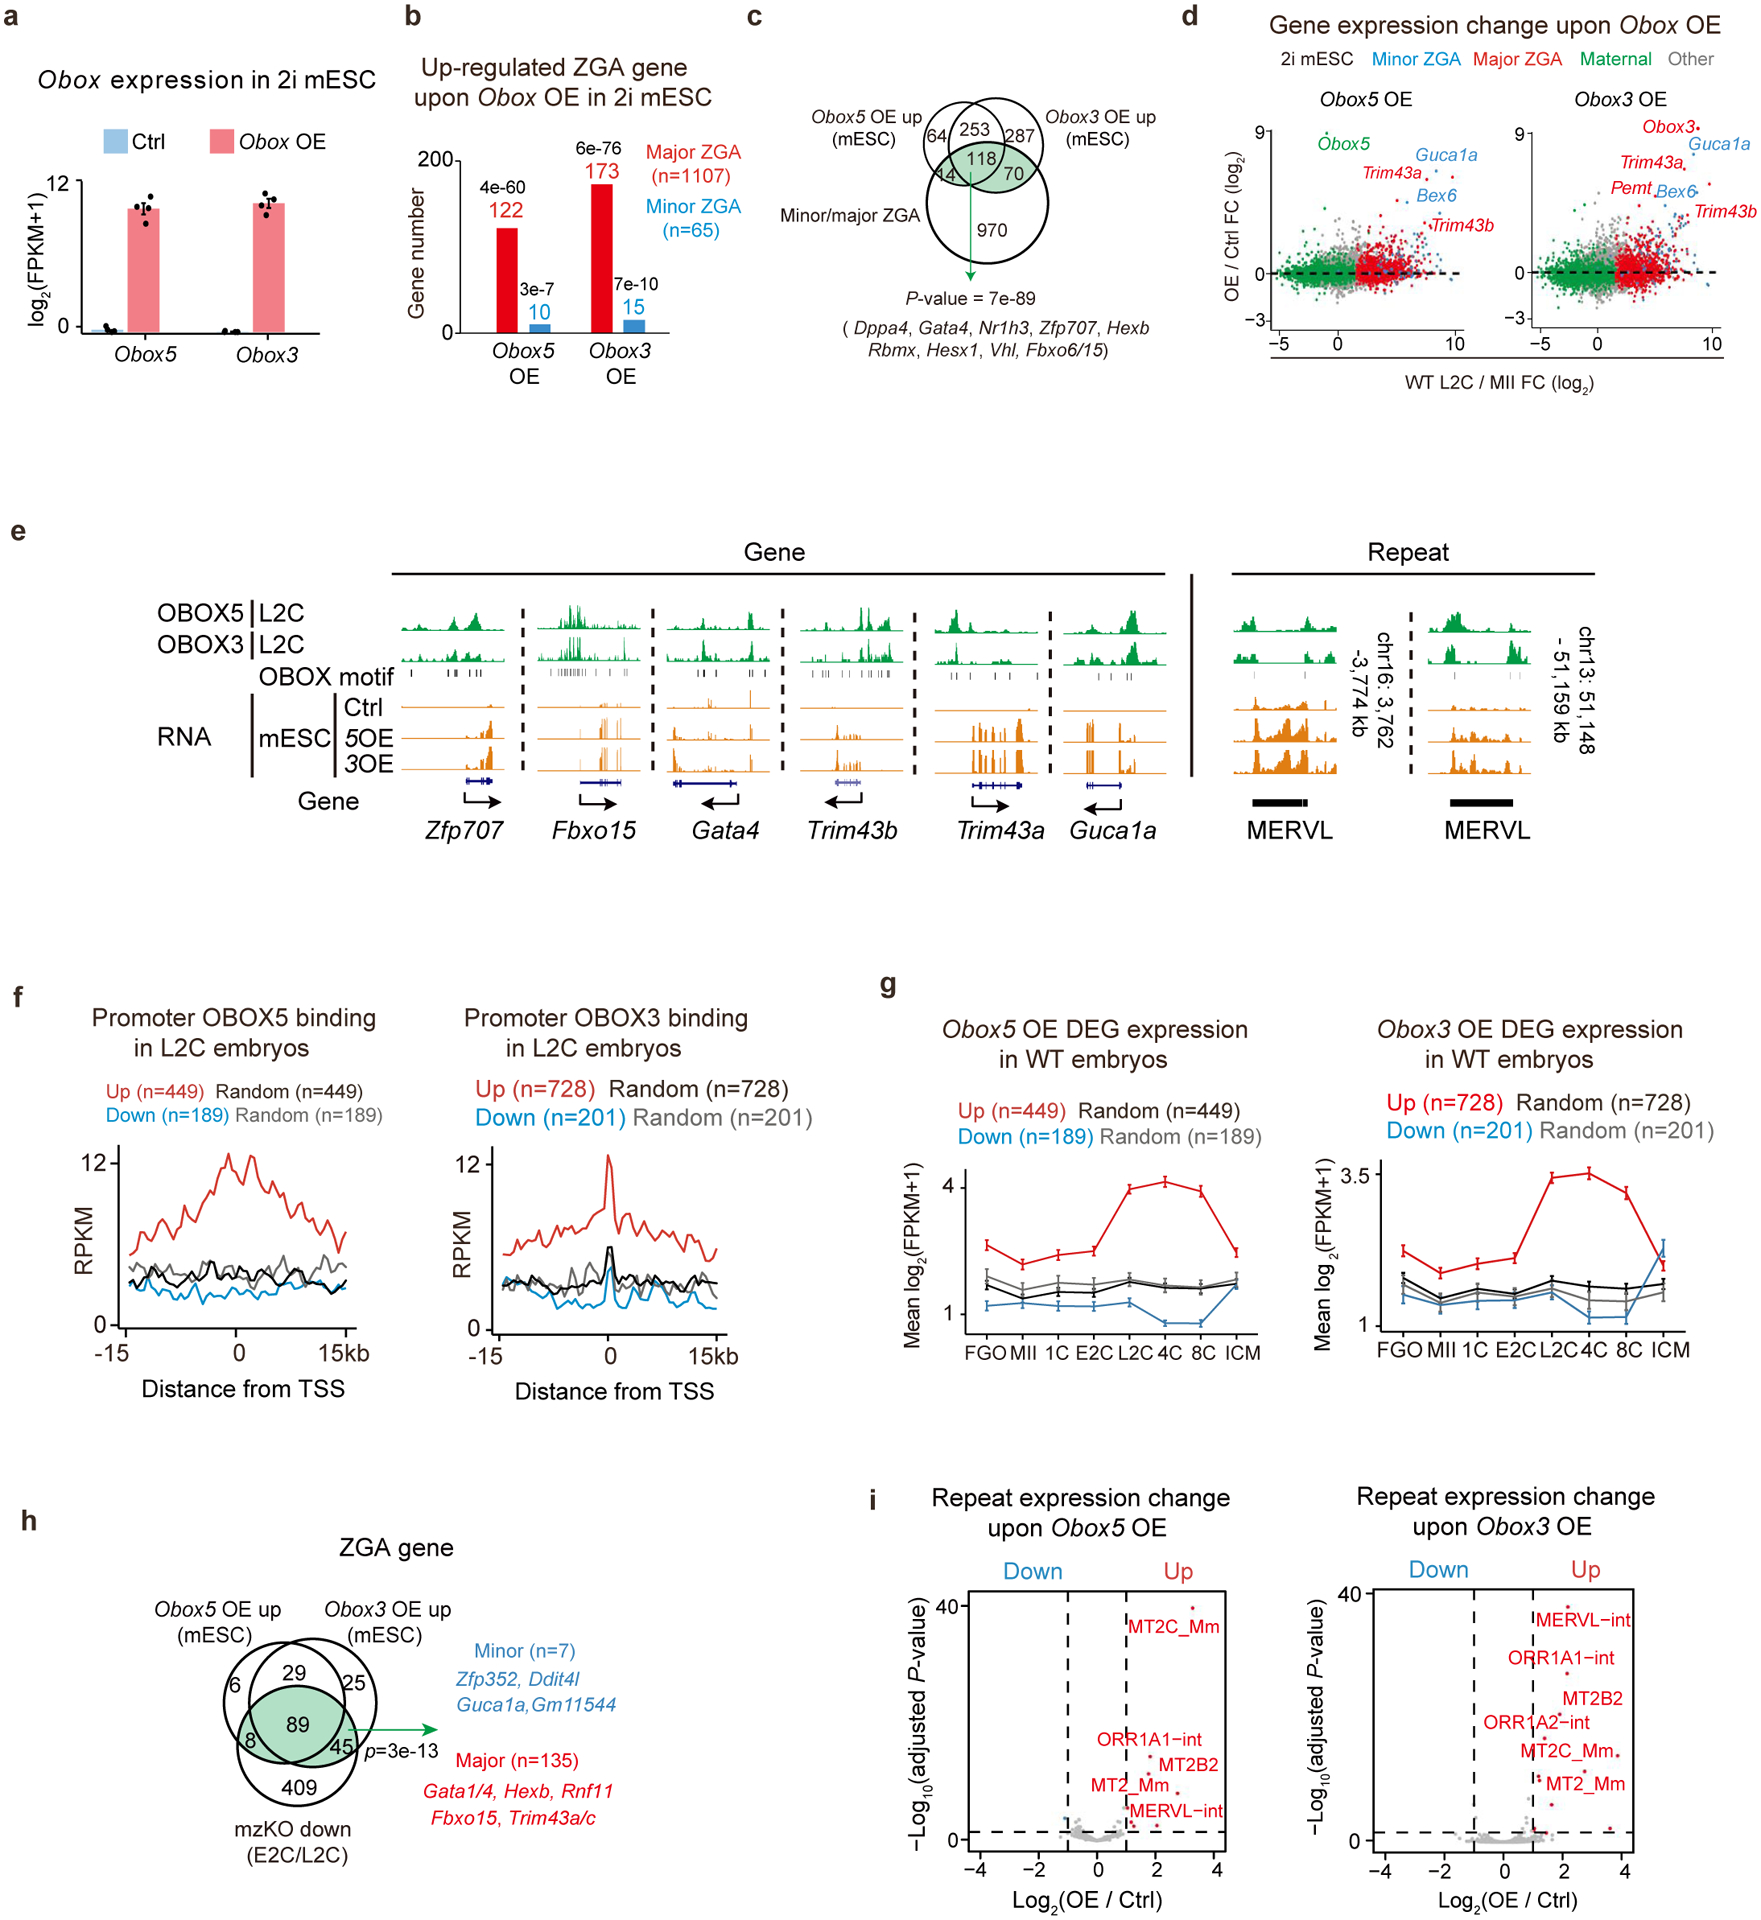
a, Obox expression levels upon overexpression in 2i mESCs (4 biological replicates). Error bars, mean ±SE. b, Bar chart showing the activated ZGA gene numbers upon Obox overexpression in 2i mESCs (4 biological replicates). P-values, two-sided Fisher’s exact test. c, Venn diagram showing the overlaps among Obox OE upregulated genes in 2i mESCs and ZGA genes. P-value, two-sided Fisher’s exact test. Green indicates the combined ZGA gene list activated by OBOX3/5. d, Scatter plot showing gene expression fold-changes upon Obox overexpression in 2i mESCs (4 biological replicates). e, OBOX binding at example OBOX-activated ZGA genes and MERVL in embryos. OBOX motif and RNA levels are shown. f, OBOX binding enrichment in embryos at the promoters of differentially expressed genes (DEGs) upon Obox overexpression in 2i mESCs. g, Line charts showing DEG upon Obox overexpression in 2i mESCs (4 biological replicates) for their expression in oocytes and embryos. Error bars, mean ± SE. n, gene number. h, Venn diagram showing the overlap between Obox activated ZGA genes in 2i mESCs (4 biological replicates) and downregulated ZGA genes in Obox mzKO embryos (2 biological replicates for E2C and 3 for L2C)). P-value, two-sided Fisher’s exact test. Green indicates the combined ZGA gene list activated by OBOX3/5 and downregulated in Obox mzKO embryos. i, Volcano plot showing the repeat expression changes upon Obox overexpression in 2i mESCs (4 biological replicates). Dashed line, adjusted P-value threshold 0.05.
Extended Data Fig. 10 |. OBOX activated ZGA genes in mESCs independent of DUX and NR5A2.
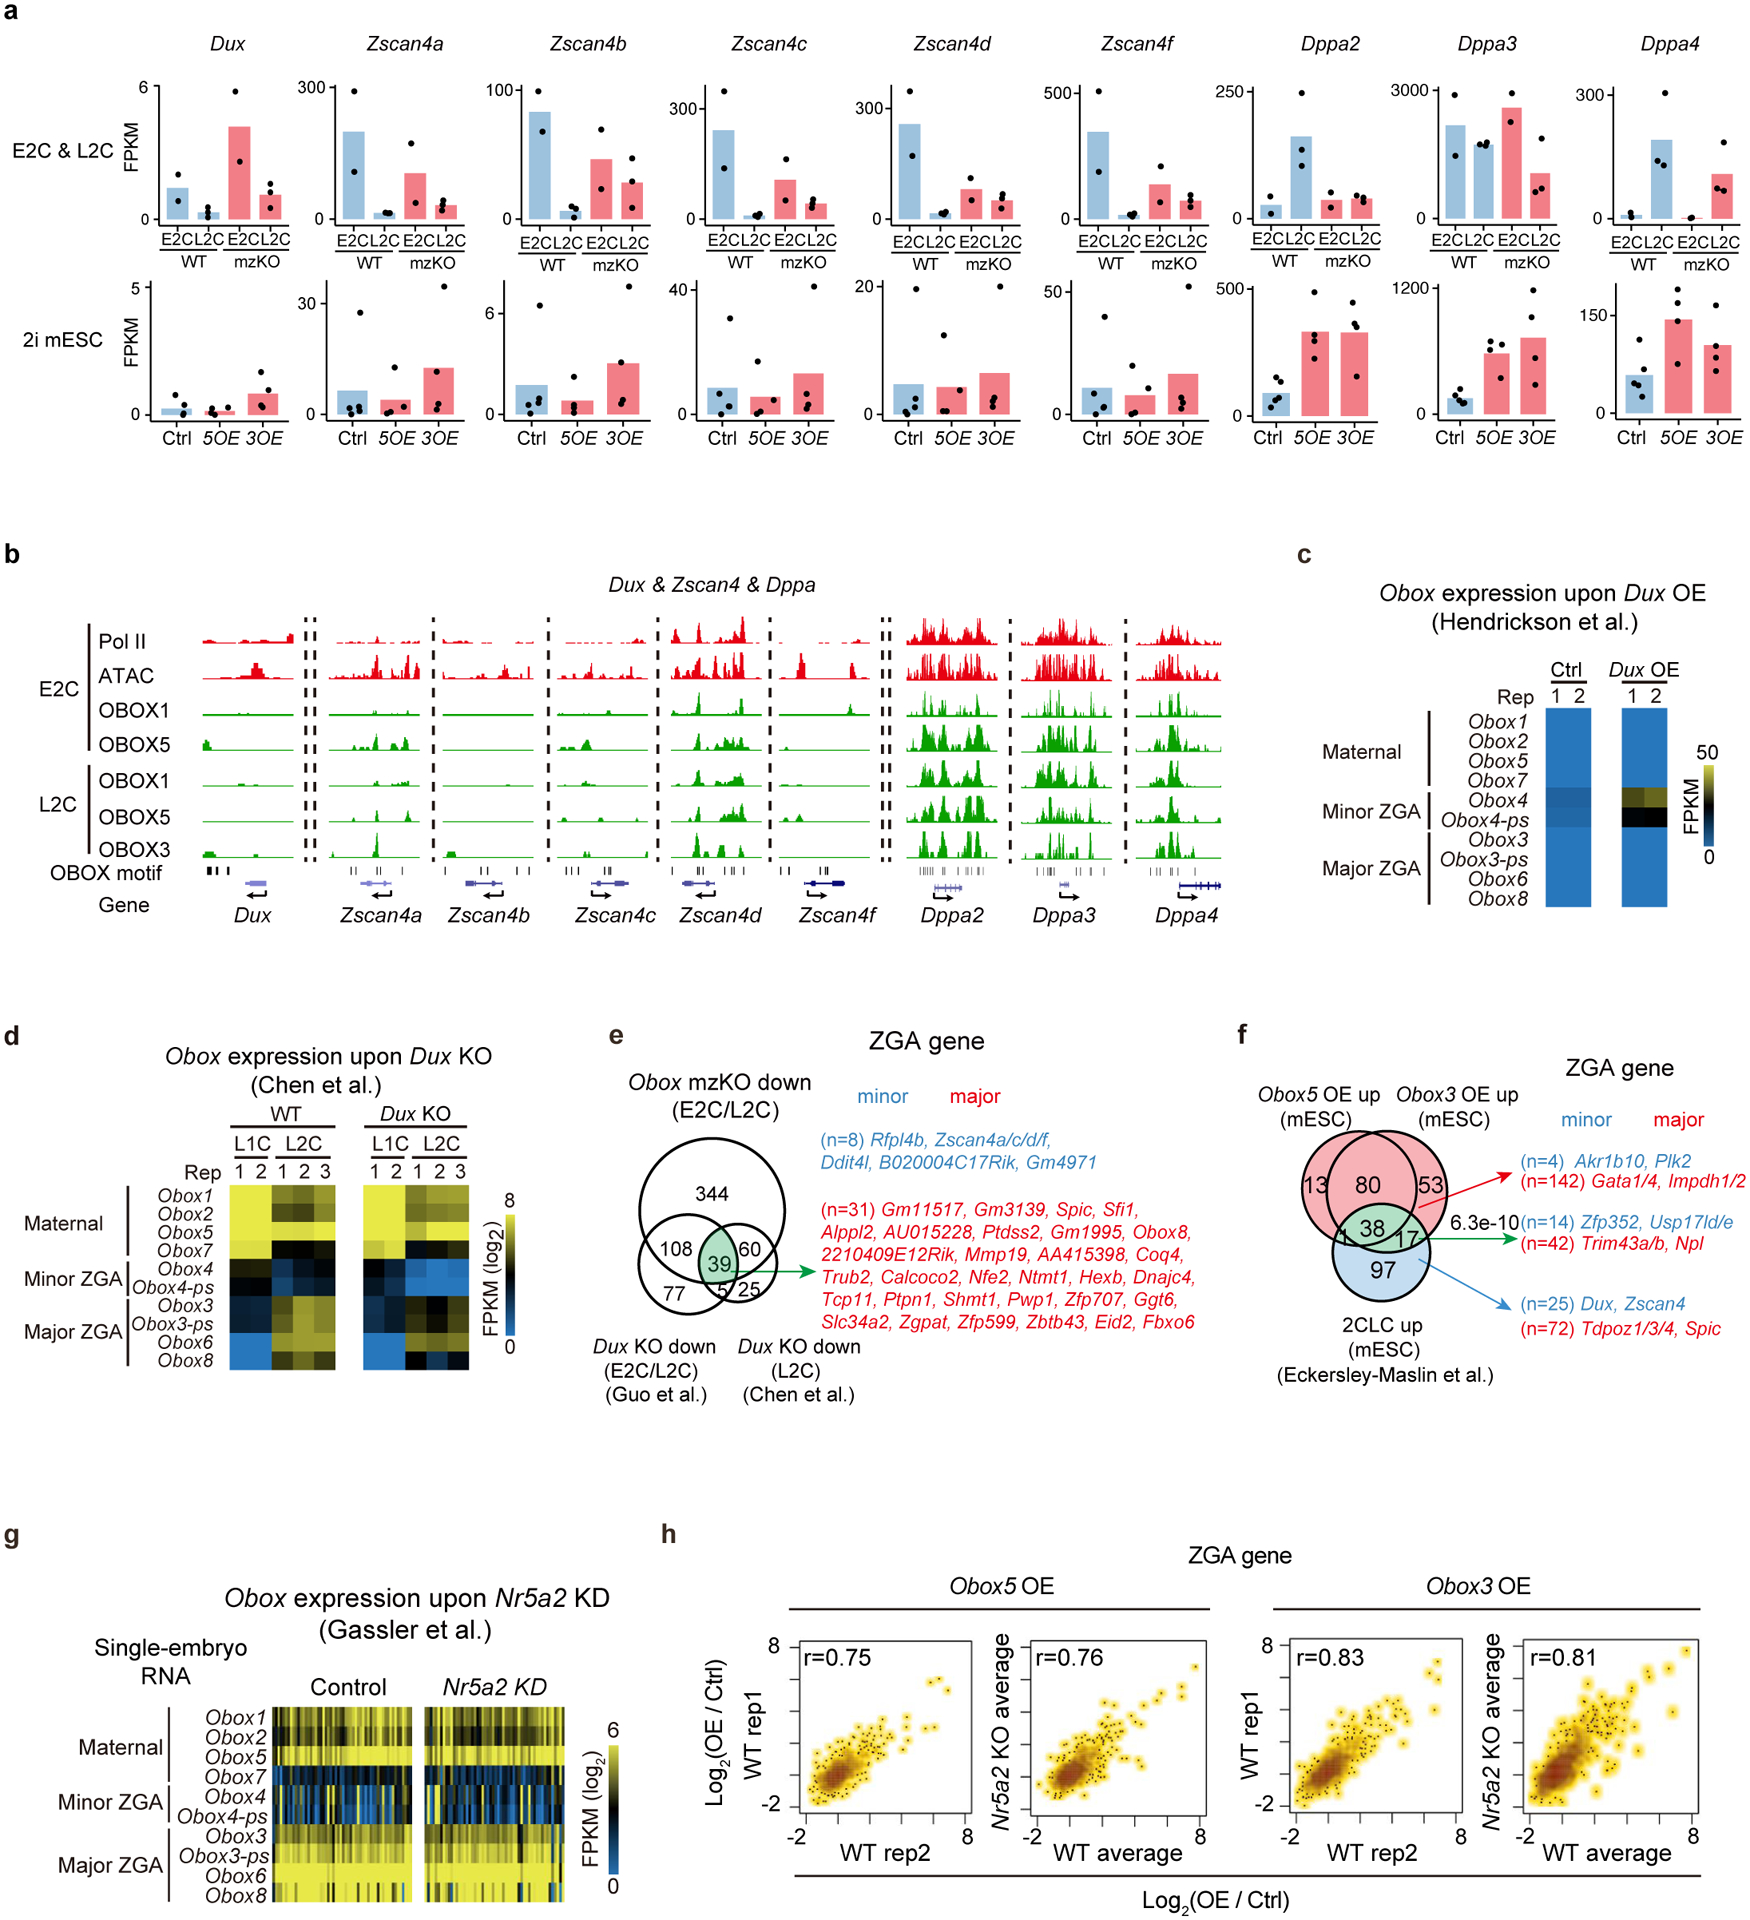
a, Bar charts showing Dux, Zscan4, and Dppa expression in 2C embryos (top, 2 biological replicates for E2C and 3 for L2C) and mESCs (bottom, 4–5 biological replicates). b, The UCSC browser snapshots showing OBOX binding at 2C. Pol II, ATAC, and OBOX motif are shown. c, Heatmap showing Obox expression upon Dux overexpression16 in 2i mESCs (2 biological replicates). d, Heatmap showing Obox expression upon Dux knockout20 (2 biological replicates for L1C and 3 for L2C). e, Venn diagram showing the overlap of downregulated ZGA genes between Obox knockout and Dux knockout embryos19,20. n, ZGA gene numbers. f, Venn diagram showing the overlap of OBOX-activated ZGA genes and upregulated ZGA genes in 2CLCs compared to mESCs. P-value, two-sided Fisher’s exact test. Green indicates the combined ZGA gene list activated by OBOX3/5 and in 2CLC. g, Heatmap showing Obox expression upon Nr5a2 knockdown21 in embryos. h, Scatter plot comparing the ZGA gene expression changes upon Obox overexpression between WT and Nr5a2 knockout mESCs (2 replicates).
Supplementary Material
Supplementary Table 1
mRNA levels of Obox genes in oocytes and early embryos.
Gene names, group, class, and mRNA level for the Obox family in FGO, LPI, MII oocytes, 1C, E2C, L2C, 4C, 8C embryos, ICM, and mESCs are included.
Supplementary Table 2
Translation levels of Obox genes in oocytes and early embryos.
Gene names, group, class, and translation level for the Obox family in FGO, LPI, MII oocytes, 1C, E2C, L2C, 4C, 8C embryos, ICM, and mESCs are included.
Supplementary Table 3
siRNA sequences for individual Obox knockdown. siRNAs used for targeting Obox1/2, Obox3, Obox4, Obox5, Obox6, Obox7, or Obox8 are included.
Supplementary Table 4
RNA levels in WT and Obox KO oocytes and early embryos. Gene names and class for WT and Obox KO FGO, MII oocytes, E2C, and L2C embryos are included.
Supplementary Table 5
Differentially expressed genes between WT and Obox mzKO embryos. Gene names, fold-change, P-value, group, and class at the E2C and L2C stages are included. 2 biological replications for E2C and 3 for L2C stage.
Supplementary Table 6
OBOX1, OBOX5, and OBOX3 Stacc-seq peaks in 2C embryos. Chromatin location and P-value for OBOX peaks are included.
Supplementary Table 7
Pol II Stacc-seq peak class in WT embyos. Location, P-values, group, genomic region, and the presence/absence of the OBOX motif are included.
Supplementary Table 8
Ectopically activated genes in Obox mzKO L2C embryos. Gene names and class are included.
Supplementary Table 9
Differentially expressed genes upon OBOX5/3 overexpression in 2i mESCs. Gene names, fold change comparing Obox overexpression and control, P-value, group, and class are included. 4 biological replicates.
Supplementary Table 10
Primer sequence for OBOX motif reporter plasmid. The primer names and sequence used are included.
Supplementary Table 11
sgRNAs used for generating Obox knockout mice and primers used for genotyping. sgRNA names, sequence, and genotyping primer sequence are included.
Supplementary Table 12
sgRNAs used for generating Nr5a2 KO mESCs. sgRNA names and sequence are included.
Acknowledgements
We are grateful to members of the Schultz and Xie laboratories for the discussion and comments during the OBOX study and preparation of the manuscript, and the Animal Center and Biocomputing Facility at Tsinghua University for their support. We thank Dr. Huili Wang for advising embryo culture.
Funding:
This work was funded by the National Natural Science Foundation of China (31988101 to W.X.), the National Key R&D Program of China (2019YFA0508900 to W.X.), the National Natural Science Foundation of China (31830047, 31725018 to W.X.), the Tsinghua-Peking Center for Life Sciences (W.X.). This work was also supported in part by NIH grant HD022681 (R.M.S.) and Intramural Research Program of the NIH, National Institutes of Environmental Health Sciences 1ZIAES102985 (C.J.W.). Wei Xie is a recipient of an HHMI International Research Scholar award and New Cornerstone Investigator.
Footnotes
Reporting summary
Further information on research design is available in the Nature Research Reporting Summary linked to this paper.
Code availability
Software used to analyze these data are listed in the Methods and are all publicly available.
Competing interests The authors declare no competing financial interests.
Data availability
All data are available within the article and Supplementary Tables. Source data are provided in this paper. All data have been deposited to GEO with the accession number GSE215813. Accession codes of the published data in GEO used in this study are as follows: RNA-seq of oocytes and early embryos and late 2-cell H3K4me3, GSE71434; Ribo-lite data of oocytes and early embryos, GSE165782; RiboTag data of oocytes, GSE135525; total RNA-seq of oocytes and early embryos, GSE169632; 1-cell ATAC-seq, GSE169632; early and late 2-cell ATAC-seq, GSE92605; Pol II Stacc-seq of early embryos, GSE135457; late 2-cell H3K27ac, GSE72784; RNA-seq of Dux overexpressed and control mESCs, GSE85632; RNA-seq of Dux KO embryos, GSE121746 and GSE134832; RNA-seq of 2C-like cells and control mESCs, GSE75751; RNA-seq of Nr5a2 knockdown and control 2-cell embryos, GSE178661.
References:
- 1.Jukam D, Shariati SAM & Skotheim JM Zygotic Genome Activation in Vertebrates. Dev Cell 42, 316–332, doi: 10.1016/j.devcel.2017.07.026 (2017). [DOI] [PMC free article] [PubMed] [Google Scholar]
- 2.Lee MT, Bonneau AR & Giraldez AJ Zygotic genome activation during the maternal-to-zygotic transition. Annu Rev Cell Dev Biol 30, 581–613, doi: 10.1146/annurev-cellbio-100913-013027 (2014). [DOI] [PMC free article] [PubMed] [Google Scholar]
- 3.Wilming LG, Boychenko V & Harrow JL Comprehensive comparative homeobox gene annotation in human and mouse. Database (Oxford) 2015, doi: 10.1093/database/bav091 (2015). [DOI] [PMC free article] [PubMed] [Google Scholar]
- 4.Rajkovic A, Yan C, Yan W, Klysik M & Matzuk MM Obox, a family of homeobox genes preferentially expressed in germ cells. Genomics 79, 711–717, doi: 10.1006/geno.2002.6759 (2002). [DOI] [PubMed] [Google Scholar]
- 5.Royall AH, Maeso I, Dunwell TL & Holland PWH Mouse Obox and Crxos modulate preimplantation transcriptional profiles revealing similarity between paralogous mouse and human homeobox genes. Evodevo 9, 2, doi: 10.1186/s13227-018-0091-4 (2018). [DOI] [PMC free article] [PubMed] [Google Scholar]
- 6.Aoki F, Worrad DM & Schultz RM Regulation of transcriptional activity during the first and second cell cycles in the preimplantation mouse embryo. Dev Biol 181, 296–307, doi: 10.1006/dbio.1996.8466 (1997). [DOI] [PubMed] [Google Scholar]
- 7.Bouniol C, Nguyen E & Debey P Endogenous transcription occurs at the 1-cell stage in the mouse embryo. Exp Cell Res 218, 57–62, doi: 10.1006/excr.1995.1130 (1995). [DOI] [PubMed] [Google Scholar]
- 8.Schulz KN & Harrison MM Mechanisms regulating zygotic genome activation. Nat Rev Genet 20, 221–234, doi: 10.1038/s41576-018-0087-x (2019). [DOI] [PMC free article] [PubMed] [Google Scholar]
- 9.Liu B et al. The landscape of RNA Pol II binding reveals a stepwise transition during ZGA. Nature 587, 139–144, doi: 10.1038/s41586-020-2847-y (2020). [DOI] [PubMed] [Google Scholar]
- 10.Liang HL et al. The zinc-finger protein Zelda is a key activator of the early zygotic genome in Drosophila. Nature 456, 400–403, doi: 10.1038/nature07388 (2008). [DOI] [PMC free article] [PubMed] [Google Scholar]
- 11.Gaskill MM, Gibson TJ, Larson ED & Harrison MM GAF is essential for zygotic genome activation and chromatin accessibility in the early Drosophila embryo. Elife 10, doi: 10.7554/eLife.66668 (2021). [DOI] [PMC free article] [PubMed] [Google Scholar]
- 12.Duan J et al. CLAMP and Zelda function together to promote Drosophila zygotic genome activation. Elife 10, doi: 10.7554/eLife.69937 (2021). [DOI] [PMC free article] [PubMed] [Google Scholar]
- 13.Lee MT et al. Nanog, Pou5f1 and SoxB1 activate zygotic gene expression during the maternal-to-zygotic transition. Nature 503, 360–364, doi: 10.1038/nature12632 (2013). [DOI] [PMC free article] [PubMed] [Google Scholar]
- 14.Leichsenring M, Maes J, Mössner R, Driever W & Onichtchouk D Pou5f1 transcription factor controls zygotic gene activation in vertebrates. Science (New York, N.Y.) 341, 1005–1009, doi: 10.1126/science.1242527 (2013). [DOI] [PubMed] [Google Scholar]
- 15.Miao L et al. The landscape of pioneer factor activity reveals the mechanisms of chromatin reprogramming and genome activation. Mol Cell 82, 986–1002 e1009, doi: 10.1016/j.molcel.2022.01.024 (2022). [DOI] [PMC free article] [PubMed] [Google Scholar]
- 16.Hendrickson PG et al. Conserved roles of mouse DUX and human DUX4 in activating cleavage-stage genes and MERVL/HERVL retrotransposons. Nat Genet 49, 925–934, doi: 10.1038/ng.3844 (2017). [DOI] [PMC free article] [PubMed] [Google Scholar]
- 17.Whiddon JL, Langford AT, Wong CJ, Zhong JW & Tapscott SJ Conservation and innovation in the DUX4-family gene network. Nat Genet 49, 935–940, doi: 10.1038/ng.3846 (2017). [DOI] [PMC free article] [PubMed] [Google Scholar]
- 18.De Iaco A et al. DUX-family transcription factors regulate zygotic genome activation in placental mammals. Nat Genet 49, 941–945, doi: 10.1038/ng.3858 (2017). [DOI] [PMC free article] [PubMed] [Google Scholar]
- 19.Guo M et al. Precise temporal regulation of Dux is important for embryo development. Cell Res 29, 956–959, doi: 10.1038/s41422-019-0238-4 (2019). [DOI] [PMC free article] [PubMed] [Google Scholar]
- 20.Chen Z & Zhang Y Loss of DUX causes minor defects in zygotic genome activation and is compatible with mouse development. Nat Genet 51, 947–951, doi: 10.1038/s41588-019-0418-7 (2019). [DOI] [PMC free article] [PubMed] [Google Scholar]
- 21.Gassler J et al. Zygotic genome activation by the totipotency pioneer factor Nr5a2. Science 378, 1305–1315, doi: 10.1126/science.abn7478 (2022). [DOI] [PubMed] [Google Scholar]
- 22.Lai F et al. NR5A2 connects genome activation to the first lineage segregation in early mouse development. biorxiv (2022). [DOI] [PMC free article] [PubMed] [Google Scholar]
- 23.Festuccia N et al. Nr5a2 is essential for morula development. bioRxiv (2023). [Google Scholar]
- 24.Zou Z et al. Translatome and transcriptome co-profiling reveals a role of TPRXs in human zygotic genome activation. Science, eabo7923, doi: 10.1126/science.abo7923 (2022). [DOI] [PubMed] [Google Scholar]
- 25.Xiong Z et al. Ultrasensitive Ribo-seq reveals translational landscapes during mammalian oocyte-to-embryo transition and pre-implantation development. Nat Cell Biol 24, 968–980, doi: 10.1038/s41556-022-00928-6 (2022). [DOI] [PubMed] [Google Scholar]
- 26.Wu J et al. The landscape of accessible chromatin in mammalian preimplantation embryos. Nature 534, 652–657, doi: 10.1038/nature18606 (2016). [DOI] [PubMed] [Google Scholar]
- 27.Berger MF et al. Variation in homeodomain DNA binding revealed by high-resolution analysis of sequence preferences. Cell 133, 1266–1276, doi: 10.1016/j.cell.2008.05.024 (2008). [DOI] [PMC free article] [PubMed] [Google Scholar]
- 28.Zhang B et al. Allelic reprogramming of the histone modification H3K4me3 in early mammalian development. Nature 537, 553–557, doi: 10.1038/nature19361 (2016). [DOI] [PubMed] [Google Scholar]
- 29.Dai XX et al. A combinatorial code for mRNA 3’-UTR-mediated translational control in the mouse oocyte. Nucleic acids research 47, 328–340, doi: 10.1093/nar/gky971 (2019). [DOI] [PMC free article] [PubMed] [Google Scholar]
- 30.Luong XG, Daldello EM, Rajkovic G, Yang CR & Conti M Genome-wide analysis reveals a switch in the translational program upon oocyte meiotic resumption. Nucleic Acids Res 48, 3257–3276, doi: 10.1093/nar/gkaa010 (2020). [DOI] [PMC free article] [PubMed] [Google Scholar]
- 31.Zhang C, Wang M, Li Y & Zhang Y Profiling and functional characterization of maternal mRNA translation during mouse maternal-to-zygotic transition. Sci Adv 8, eabj3967, doi: 10.1126/sciadv.abj3967 (2022). [DOI] [PMC free article] [PubMed] [Google Scholar]
- 32.Svoboda P et al. RNAi and expression of retrotransposons MuERV-L and IAP in preimplantation mouse embryos. Dev Biol 269, 276–285, doi: 10.1016/j.ydbio.2004.01.028 (2004). [DOI] [PubMed] [Google Scholar]
- 33.Macfarlan TS et al. Embryonic stem cell potency fluctuates with endogenous retrovirus activity. Nature 487, 57–63, doi: 10.1038/nature11244 (2012). [DOI] [PMC free article] [PubMed] [Google Scholar]
- 34.Sakashita A et al. Transcription of MERVL retrotransposons is required for preimplantation embryo development. Nat Genet 55, 484–495, doi: 10.1038/s41588-023-01324-y (2023). [DOI] [PMC free article] [PubMed] [Google Scholar]
- 35.Chi YI Homeodomain revisited: a lesson from disease-causing mutations. Hum Genet 116, 433–444, doi: 10.1007/s00439-004-1252-1 (2005). [DOI] [PMC free article] [PubMed] [Google Scholar]
- 36.Katayama S et al. Phylogenetic and mutational analyses of human LEUTX, a homeobox gene implicated in embryogenesis. Sci Rep 8, 17421, doi: 10.1038/s41598-018-35547-5 (2018). [DOI] [PMC free article] [PubMed] [Google Scholar]
- 37.Fenouil R et al. CpG islands and GC content dictate nucleosome depletion in a transcription-independent manner at mammalian promoters. Genome Research 22, 2399–2408 (2012). [DOI] [PMC free article] [PubMed] [Google Scholar]
- 38.Zheng H et al. Resetting Epigenetic Memory by Reprogramming of Histone Modifications in Mammals. Mol Cell 63, 1066–1079, doi: 10.1016/j.molcel.2016.08.032 (2016). [DOI] [PubMed] [Google Scholar]
- 39.Eckersley-Maslin MA et al. MERVL/Zscan4 Network Activation Results in Transient Genome-wide DNA Demethylation of mESCs. Cell Rep 17, 179–192, doi: 10.1016/j.celrep.2016.08.087 (2016). [DOI] [PMC free article] [PubMed] [Google Scholar]
- 40.Maeso I et al. Evolutionary origin and functional divergence of totipotent cell homeobox genes in eutherian mammals. BMC Biol 14, 45, doi: 10.1186/s12915-016-0267-0 (2016). [DOI] [PMC free article] [PubMed] [Google Scholar]
- 41.Zhong YF & Holland PW The dynamics of vertebrate homeobox gene evolution: gain and loss of genes in mouse and human lineages. BMC evolutionary biology 11, 169, doi: 10.1186/1471-2148-11-169 (2011). [DOI] [PMC free article] [PubMed] [Google Scholar]
- 42.Dahl JA et al. Broad histone H3K4me3 domains in mouse oocytes modulate maternal-to-zygotic transition. Nature 537, 548–552, doi: 10.1038/nature19360 (2016). [DOI] [PMC free article] [PubMed] [Google Scholar]
- 43.Katayama S et al. Phylogenetic and mutational analyses of human LEUTX, a homeobox gene implicated in embryogenesis. Scientific Reports 8, 17421, doi: 10.1038/s41598-018-35547-5 (2018). [DOI] [PMC free article] [PubMed] [Google Scholar]
- 44.Picelli S et al. Full-length RNA-seq from single cells using Smart-seq2. Nat Protoc 9, 171–181, doi: 10.1038/nprot.2014.006 (2014). [DOI] [PubMed] [Google Scholar]
- 45.Buenrostro JD, Giresi PG, Zaba LC, Chang HY & Greenleaf WJ Transposition of native chromatin for fast and sensitive epigenomic profiling of open chromatin, DNA-binding proteins and nucleosome position. Nat Methods 10, 1213–1218, doi: 10.1038/nmeth.2688 (2013). [DOI] [PMC free article] [PubMed] [Google Scholar]
- 46.Kim D, Paggi JM, Park C, Bennett C & Salzberg SL Graph-based genome alignment and genotyping with HISAT2 and HISAT-genotype. Nature Biotechnology 37, 907–915, doi: 10.1038/s41587-019-0201-4 (2019). [DOI] [PMC free article] [PubMed] [Google Scholar]
- 47.Pertea M, Kim D, Pertea GM, Leek JT & Salzberg SL Transcript-level expression analysis of RNA-seq experiments with HISAT, StringTie and Ballgown. Nature Protocols 11, 1650–1667, doi: 10.1038/nprot.2016.095 (2016). [DOI] [PMC free article] [PubMed] [Google Scholar]
- 48.Karolchik D et al. The UCSC Table Browser data retrieval tool. Nucleic Acids Res 32, D493–496, doi: 10.1093/nar/gkh103 (2004). [DOI] [PMC free article] [PubMed] [Google Scholar]
- 49.Anders S, Pyl PT & Huber W HTSeq--a Python framework to work with high-throughput sequencing data. Bioinformatics 31, 166–169, doi: 10.1093/bioinformatics/btu638 (2015). [DOI] [PMC free article] [PubMed] [Google Scholar]
- 50.Boratyn GM, Thierry-Mieg J, Thierry-Mieg D, Busby B & Madden TL Magic-BLAST, an accurate RNA-seq aligner for long and short reads. BMC Bioinformatics 20, 405, doi: 10.1186/s12859-019-2996-x (2019). [DOI] [PMC free article] [PubMed] [Google Scholar]
- 51.Love MI, Huber W & Anders S Moderated estimation of fold change and dispersion for RNA-seq data with DESeq2. Genome Biology 15, 550, doi: 10.1186/s13059-014-0550-8 (2014). [DOI] [PMC free article] [PubMed] [Google Scholar]
- 52.Huang da W, Sherman BT & Lempicki RA Systematic and integrative analysis of large gene lists using DAVID bioinformatics resources. Nat Protoc 4, 44–57, doi: 10.1038/nprot.2008.211 (2009). [DOI] [PubMed] [Google Scholar]
- 53.Liao Y, Smyth GK & Shi W featureCounts: an efficient general purpose program for assigning sequence reads to genomic features. Bioinformatics 30, 923–930, doi: 10.1093/bioinformatics/btt656 (2014). [DOI] [PubMed] [Google Scholar]
- 54.Langmead B & Salzberg SL Fast gapped-read alignment with Bowtie 2. Nat Methods 9, 357–359, doi: 10.1038/nmeth.1923 (2012). [DOI] [PMC free article] [PubMed] [Google Scholar]
- 55.Ramirez F et al. deepTools2: a next generation web server for deep-sequencing data analysis. Nucleic Acids Res 44, W160–165, doi: 10.1093/nar/gkw257 (2016). [DOI] [PMC free article] [PubMed] [Google Scholar]
- 56.Kuhn RM, Haussler D & Kent WJ The UCSC genome browser and associated tools. Brief Bioinform 14, 144–161, doi: 10.1093/bib/bbs038 (2013). [DOI] [PMC free article] [PubMed] [Google Scholar]
- 57.Zhang Y et al. Model-based analysis of ChIP-Seq (MACS). Genome Biol 9, R137, doi: 10.1186/gb-2008-9-9-r137 (2008). [DOI] [PMC free article] [PubMed] [Google Scholar]
- 58.Quinlan AR & Hall IM BEDTools: a flexible suite of utilities for comparing genomic features. Bioinformatics 26, 841–842, doi: 10.1093/bioinformatics/btq033 (2010). [DOI] [PMC free article] [PubMed] [Google Scholar]
- 59.Yu G, Wang LG & He QY ChIPseeker: an R/Bioconductor package for ChIP peak annotation, comparison and visualization. Bioinformatics 31, 2382–2383, doi: 10.1093/bioinformatics/btv145 (2015). [DOI] [PubMed] [Google Scholar]
- 60.Heinz S et al. Simple combinations of lineage-determining transcription factors prime cis-regulatory elements required for macrophage and B cell identities. Mol Cell 38, 576–589, doi: 10.1016/j.molcel.2010.05.004 (2010). [DOI] [PMC free article] [PubMed] [Google Scholar]
- 61.Madeira F et al. The EMBL-EBI search and sequence analysis tools APIs in 2019. Nucleic Acids Res 47, W636–W641, doi: 10.1093/nar/gkz268 (2019). [DOI] [PMC free article] [PubMed] [Google Scholar]
- 62.Cao D-S, Xiao N, Xu Q-S & Chen AF Rcpi: R/Bioconductor package to generate various descriptors of proteins, compounds and their interactions. Bioinformatics 31, 279–281, doi: 10.1093/bioinformatics/btu624 (2015). [DOI] [PubMed] [Google Scholar]
- 63.Letunic I & Bork P 20 years of the SMART protein domain annotation resource. Nucleic Acids Res 46, D493–D496, doi: 10.1093/nar/gkx922 (2018). [DOI] [PMC free article] [PubMed] [Google Scholar]
- 64.UniProt Consortium T UniProt: the universal protein knowledgebase. Nucleic Acids Res 46, 2699, doi: 10.1093/nar/gky092 (2018). [DOI] [PMC free article] [PubMed] [Google Scholar]
Associated Data
This section collects any data citations, data availability statements, or supplementary materials included in this article.
Supplementary Materials
Supplementary Table 1
mRNA levels of Obox genes in oocytes and early embryos.
Gene names, group, class, and mRNA level for the Obox family in FGO, LPI, MII oocytes, 1C, E2C, L2C, 4C, 8C embryos, ICM, and mESCs are included.
Supplementary Table 2
Translation levels of Obox genes in oocytes and early embryos.
Gene names, group, class, and translation level for the Obox family in FGO, LPI, MII oocytes, 1C, E2C, L2C, 4C, 8C embryos, ICM, and mESCs are included.
Supplementary Table 3
siRNA sequences for individual Obox knockdown. siRNAs used for targeting Obox1/2, Obox3, Obox4, Obox5, Obox6, Obox7, or Obox8 are included.
Supplementary Table 4
RNA levels in WT and Obox KO oocytes and early embryos. Gene names and class for WT and Obox KO FGO, MII oocytes, E2C, and L2C embryos are included.
Supplementary Table 5
Differentially expressed genes between WT and Obox mzKO embryos. Gene names, fold-change, P-value, group, and class at the E2C and L2C stages are included. 2 biological replications for E2C and 3 for L2C stage.
Supplementary Table 6
OBOX1, OBOX5, and OBOX3 Stacc-seq peaks in 2C embryos. Chromatin location and P-value for OBOX peaks are included.
Supplementary Table 7
Pol II Stacc-seq peak class in WT embyos. Location, P-values, group, genomic region, and the presence/absence of the OBOX motif are included.
Supplementary Table 8
Ectopically activated genes in Obox mzKO L2C embryos. Gene names and class are included.
Supplementary Table 9
Differentially expressed genes upon OBOX5/3 overexpression in 2i mESCs. Gene names, fold change comparing Obox overexpression and control, P-value, group, and class are included. 4 biological replicates.
Supplementary Table 10
Primer sequence for OBOX motif reporter plasmid. The primer names and sequence used are included.
Supplementary Table 11
sgRNAs used for generating Obox knockout mice and primers used for genotyping. sgRNA names, sequence, and genotyping primer sequence are included.
Supplementary Table 12
sgRNAs used for generating Nr5a2 KO mESCs. sgRNA names and sequence are included.
Data Availability Statement
All data are available within the article and Supplementary Tables. Source data are provided in this paper. All data have been deposited to GEO with the accession number GSE215813. Accession codes of the published data in GEO used in this study are as follows: RNA-seq of oocytes and early embryos and late 2-cell H3K4me3, GSE71434; Ribo-lite data of oocytes and early embryos, GSE165782; RiboTag data of oocytes, GSE135525; total RNA-seq of oocytes and early embryos, GSE169632; 1-cell ATAC-seq, GSE169632; early and late 2-cell ATAC-seq, GSE92605; Pol II Stacc-seq of early embryos, GSE135457; late 2-cell H3K27ac, GSE72784; RNA-seq of Dux overexpressed and control mESCs, GSE85632; RNA-seq of Dux KO embryos, GSE121746 and GSE134832; RNA-seq of 2C-like cells and control mESCs, GSE75751; RNA-seq of Nr5a2 knockdown and control 2-cell embryos, GSE178661.


