

SUMMARY
Hypothalamic gliosis associated with high-fat diet (HFD) feeding increases susceptibility to hyperphagia and weight gain. However, the body weight-independent contribution of microglia to glucose regulation has not been determined. Here, we show that reducing microglial NF-κB signaling via cell-specific IKKβ deletion exacerbates HFD-induced glucose intolerance despite reducing body weight and adiposity. Conversely, two genetic approaches to increase microglial pro-inflammatory signaling (deletion of a NF-κB pathway inhibitor and chemogenetic activation through a modified Gq-coupled muscarinic receptor) improved glucose tolerance independently of diet in both lean and obese rodents. Microglial regulation of glucose homeostasis involves a TNFα-dependent mechanism that increases activation of pro-opiomelanocortin (POMC) and other hypothalamic glucose sensing neurons, ultimately leading to a marked amplification of first-phase insulin secretion via a parasympathetic pathway. Overall, these data indicate that microglia regulate glucose homeostasis in a body weight-independent manner, an unexpected mechanism that limits the deterioration of glucose tolerance associated with obesity.
Keywords: Microglia, glucose tolerance, insulin, parasympathetic, obesity, inflammation, TNF, POMC, glucose sensing, chemogenetic
eTOC BLURB
Douglass et al. demonstrate that microglial inflammatory signaling improves glucose tolerance despite promoting weight gain. Microglial activation modulates hypothalamic glucose sensing and engages a TNF-, melanocortin- and parasympathetic-dependent pathway to increase insulin secretion, thereby limiting the disruption of glucose homeostasis during diet-induced obesity.
INTRODUCTION
In humans and rodents, obesity is associated with a pro-inflammatory response of non-neuronal cells such as microglia (the resident macrophages of the CNS) that resembles the gliosis response to brain injury and other CNS insults.1–7 This gliosis occurs at the onset of high-fat diet (HFD) feeding and is largely restricted to brain regions such as the hypothalamus that contain neurocircuits critical to the regulation of body weight and glucose homeostasis.2–8 These observations led to the hypothesis that alterations to microglial activation state in response to HFD feeding promote the progression of diet-induced obesity (DIO) and insulin resistance.1–7 Indeed, there is now substantial evidence that microglia increase DIO susceptibility,9–15 but a direct role for microglia in glucose homeostasis remains uncertain.
Microglia are long-lived CNS-resident immune cells that are intimately involved in both physiological and pathological processes within the brain.16–19 Microglia regulate many basic functions in the healthy brain, but their plasticity and sensitivity to environmental cues elicit rapid transformation to non-homeostatic cellular phenotypes.3,6,16–20 These altered microglial states can have beneficial or deleterious impacts on surrounding neurons and glia, resulting in attenuation or exacerbation of pathology depending on the context. In DIO, for example, HFD induction of NF-κB-mediated signaling in microglia promotes food intake, fat accumulation, and central resistance to satiety signals such as leptin.9,10 These data together with more recent analyses of microglial mitochondrial (UCP2),11 lipid (LPL),12 circadian (Bmal1),13 chemokine (CX3CR1),14 and prostaglandin15 signaling support a primary role for microglia in obesity pathogenesis.
Glucose intolerance and insulin resistance typically arise as a consequence of obesity. Accordingly, prior studies of microglial alterations to body weight showed the expected parallel effects on glycemic parameters.11–15 However, CNS regulation of energy balance and systemic glycemia occurs via distinct pathways21 and recent evidence suggests that hypothalamic microglia can affect cephalic-phase insulin release,22 raising the untested possibility of direct, body weight-independent effects of microglial signaling on glucose homeostasis and insulin secretion.
The central nervous system and, in particular, the hypothalamus contributes to the regulation of peripheral glycemia through adjustment of insulin secretion, glucose disposal, and hepatic glucose production.23 Pancreatic insulin secretion is modulated by autonomic outflow: parasympathetic innervation increases insulin secretion, while sympathetic outflow suppresses insulin secretion.24 Microglial inflammatory signaling affects CNS sympathetic and parasympathetic tone, playing a well-documented role in metabolic pathologies such as hypertension.25 Recently, microglial IL-1β has been shown to increase cephalic insulin secretion downstream of central muscarinic receptor signaling,22 suggesting that microglial inflammatory signaling may contribute to central modulation of glucose homeostasis. Here, using cell-specific models combined with approaches to account for or eliminate weight differences between groups, we reveal an unexpected benefit of microglial inflammatory activation to improve glucose tolerance through a TNFα- and melanocortin-dependent mechanism involving parasympathetic enhancement of glucose-stimulated insulin secretion.
RESULTS
Microglia-specific deletion of IKKβ ameliorates HFD-induced weight gain without accompanying improvements in glucose tolerance.
We previously demonstrated that microglial inflammatory signaling induced by HFD feeding increases food intake and weight gain in mice,9,10,14,15 but the impact on glucose homeostasis was not explored. To examine this question in the context of obesity, we returned to our previously published Cx3cr1CreER/+::Ikbkbfl/fl mouse model (IKKβ-MGKO).10 In this inducible model, tamoxifen treatment causes deletion of IKKβ in both peripheral and CNS CX3CR1+ myeloid populations; however, peripheral cells turn over after ~4 weeks and are replaced by non-recombined bone marrow-derived monocytes.26–29 In contrast, microglia are long-lived with minimal turnover resulting in persistent gene deletion.26–29 Consistent with our previous finding,10 NF-κB pathway silencing in IKKβ-MGKO mice resulted in a greatly diminished cytokine response to inflammatory stimulation with lipopolysaccharide (LPS) in primary microglia (Figure 1A). 4 weeks after tamoxifen treatment, control (Ikbkbfl/fl, Ctl) and IKKβ-MGKO mice were exposed to an ad libitum low-fat control diet (CD) or a 60% HFD for 10 weeks. Despite HFD-fed IKKβ-MGKO mice having >10% lower body weight and fat mass than HFD-fed control mice (Figures 1B and 1C), their glucose tolerance was relatively unaffected (Figures 1D and 1E), a result that contrasts with those seen in other models with a similar degree of resistance to DIO in the context of reduced CNS inflammatory signaling.30–33 CD-fed mice of both genotypes showed only a slight uptrend in glucose AUC with increasing fat mass likely due to the low variance in the distribution of adiposity (Figure 1F) while the HFD-fed control mice showed the expected association of glucose intolerance with progressive obesity (Figure 1G; gray dots, R2=0.51, p=0.01). In contrast, no such correlation was observed in HFD-fed IKKβ-MGKO mice (Figure 1G; red dots, R2=0.01, p=0.75) with a large proportion of the leanest animals paradoxically showing substantial glucose intolerance (upper left portion of graph in Figure 1G). Overall, these results suggest that the loss of microglial inflammatory signaling during HFD exposure has divergent effects on the central regulation of body weight and glucose homeostasis.
Figure 1. Loss of microglial IKKβ dampens inflammatory signaling and reduces HFD-induced weight gain but does not improve glucose tolerance.
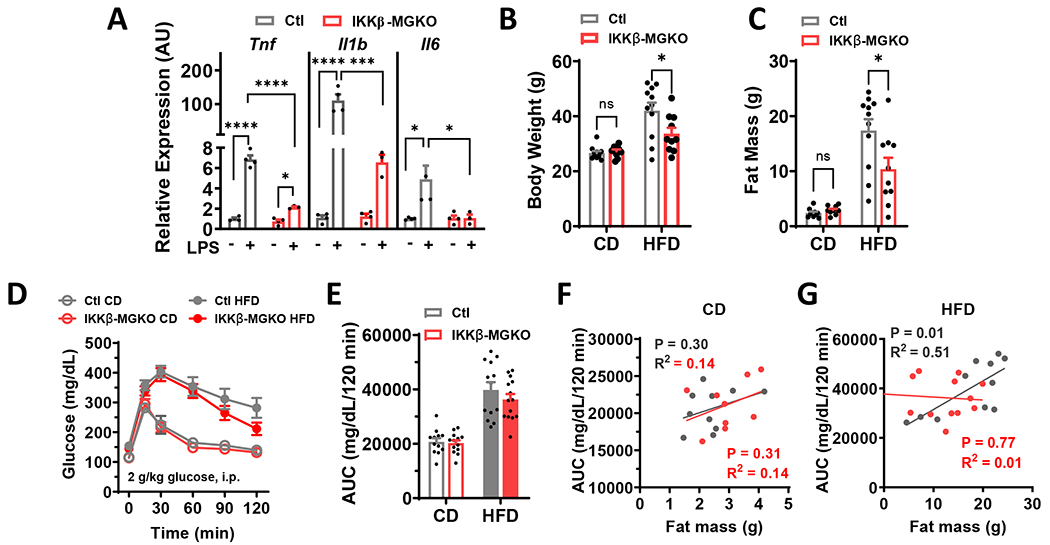
(A) Inflammatory cytokine expression in primary microglial cultures from IKKβ-MGKO and control (Ctl) mice treated 6-h with 100 ng/ml lipopolysaccharide (LPS). N=3-4 wells/genotype/treatment. (B) Body weight and (C) fat mass after 10 weeks of ad libitum CD and HFD feeding. N=10-12/group. (D) GTT and (E) area under the curve (AUC) at 10 weeks of CD or HFD. N=10-12/group. (F-G) AUC from E versus 10 week weight gain in IKKβ-MGKO (red) and Ctl (gray) mice.
All values are mean ± SEM. (A-C) two-way ANOVA with Bonferroni post-hoc test. (D-E) Student’s t-test. (F-G) Linear regression. * p < 0.05, *** p < 0.001, **** p <0.0001.
Loss of microglia NF-κB-mediated inflammatory signaling during HFD exposure exacerbates glucose intolerance and insulin resistance independently of body weight.
Given the unexpected lack of improvement in glucose tolerance in the HFD-fed IKKβ-MGKO mice relative to controls, we wondered whether controlling for differences in body weight might unmask an impairment of glucose tolerance in the knockout mice. Since lower food intake is the primary determinant of leanness in this model,10 we generated weight-matched cohorts by pairing the HFD caloric consumption in control mice to the reduced intake of ad libitum (AL) HFD-fed IKKβ-MGKO mice. As predicted, this paradigm effectively generated cohorts of pair-fed (PF) controls and IKKβ-MGKO AL mice with matched body weights (Figure 2A) and adiposity (Figure 2B) over 14 weeks of HFD consumption. Importantly, early dark cycle food intake and random blood glucose levels measured 4 hours after dark onset were similar between groups (Figures S1A and S1B), indicating that this mild pair feeding regimen did not induce the hyperphagia-fasting cycles common to many caloric restriction protocols. Nevertheless, to avoid any potential confounding from differing meal patterns, we provided ad lib HFD access to both groups for at least 2 days before assessing glucose homeostasis. At week 7 of HFD, IKKβ-MGKO AL mice displayed worse glucose tolerance than the weight-matched PF controls (Figures 2C and 2D), an effect that was sustained through the 12 weeks of HFD feeding (data not shown). Taken together these data indicate that microglial inflammatory signaling is required to maintain normal glucose homeostasis despite promoting hyperphagia and increased adiposity under obesogenic dietary conditions.
Figure 2. Microglial IKKβ deletion exacerbates HFD-induced glucose intolerance and insulin resistance in weight-matched mice.
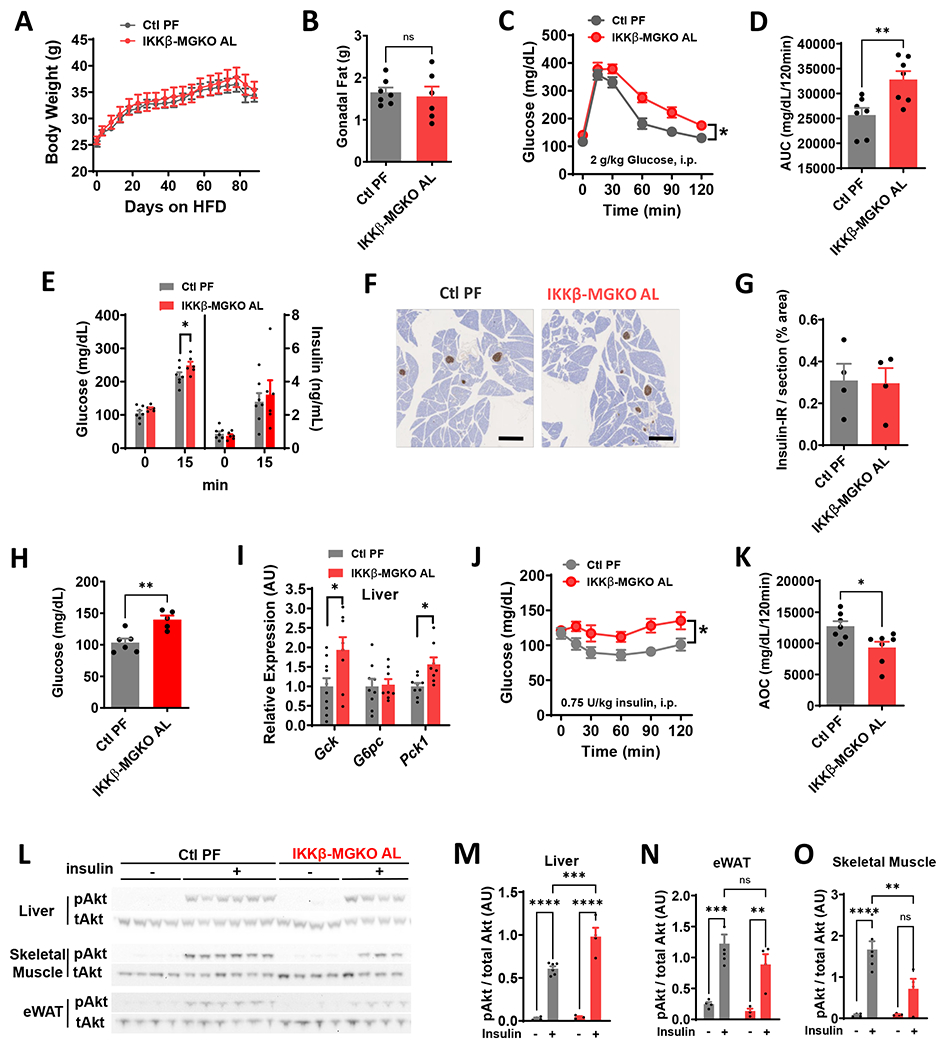
(A) Body weight of ad libitum HFD-fed IKKβ-MGKO (IKKβ-MGKO AL) and HFD pair-fed control mice (Ctl PF). N=7/group. (B) Gonadal fat pad weights after 14 weeks of HFD. (C) GTT and (D) AUC after 7 weeks of HFD. (E) Glucose-stimulated insulin secretion (2 g/kg glucose; gavage). (F) Insulin (brown) immunostaining after 10 week of HFD. Scale bar = 500 μm. (G) Quantification of F. N=4/group. (H) 16-h fasted blood glucose. (I) Liver mRNA expression (relative to Ctl PF group) of glucoregulatory enzymes in overnight fasted mice after 14 weeks of HFD. N=8-10/group. (J) ITT and (K) Area-over-curve (AOC) at 10 weeks HFD. (L) pAkt (Ser473) and total Akt in tissue homogenates from liver, skeletal muscle, and epididymal white adipose tissue (eWAT) from 16-h fasted mice given saline (−) or insulin (+) (5 U/kg, i.p., 15 minutes) after 14 weeks on HFD. (M-O) Densitometric quantification of L. N=4-6/group.
All values are mean ± SEM. (A-B, J, M-O) Two-way ANOVA with Bonferroni post-hoc test. (C-E, G-I, K) Student’s t-test. * p < 0.05, ** p < 0.01, *** p < 0.001, **** p < 0.0001.
Next, we determined whether impairments in insulin secretion or action might underlie the glucose intolerance of IKKβ-MGKO AL mice. We performed an oral glucose challenge on IKKβ-MGKO AL and PF control mice and found that plasma insulin levels measured both in the fasted state and 15 minutes after glucose intake were similar between groups despite higher glucose levels in the IKKβ-MGKO AL animals (Figure 2E). Immunohistochemical analysis of pancreatic islets after 10 weeks of HFD feeding revealed similar levels of pancreatic insulin content across genotypes (Figures 2F and 2G). These data together suggest that IKKβ-MGKO AL mice do not have deficient insulin production, but may have insufficient glucose-stimulated insulin secretion .
IKKβ-MGKO AL mice had elevated blood glucose levels after fasting overnight for 16 hours (Figure 2H), a potential indicator of impaired hepatic insulin action. Analyses of hepatic mRNA in fasted mice showed transcriptional upregulation of glucokinase (Gck) and no change in glucose-6 phosphatase (G6pc) (Figure 2I). Importantly, there was an increase in expression of the primary gluconeogenic enzyme phosphoenolpyruvate carboxykinase (Pck1) (Figure 2I), analogous to that observed in pre-diabetic animals with enhanced hepatic glucose production.34,35 In addition, a pyruvate tolerance test revealed modestly elevated blood glucose in the IKKβ-MGKO AL mice relative to PF controls (Figures S1C and S1D), suggesting a potential increase in gluconeogenesis in this model.
Given that excessive endogenous glucose production is often reflective of impaired insulin responsiveness, we next assessed the systemic insulin tolerance of IKKβ-MGKO AL mice. Doing so revealed that IKKβ-MGKO AL mice had evidence of marked insulin resistance among IKKβ-MGKO AL mice when compared to PF controls (Figures 2J and 2K). We next assessed tissue-level insulin action by measuring pAkt/Akt ratios in tissue samples from liver, epididymal white adipose (eWAT), and skeletal muscle of HFD-fed mice fasted overnight and then injected with insulin (5 U/kg, i.p.) 15 minutes before sacrifice. Surprisingly, insulin signaling in the livers of IKKβ-MGKO AL mice was slightly improved compared to PF controls, whereas a similar analysis in eWAT showed no difference between genotypes (Figures 2L and 2M). In contrast, skeletal muscle insulin sensitivity was markedly reduced in IKKβ-MGKO AL mice compared to PF controls (Figures 2L and 2M). Together, these data support the hypothesis that increased hepatic gluconeogenesis may account for the elevation of fasting glucose (Figures 2H, 2I, and S1) while impaired muscle insulin signaling may explain the reduced insulin tolerance in IKKβ-MGKO AL mice (Figures 2J and 2K).
Glucose-sensing neurons modulate peripheral glucose handling through effects on insulin sensitivity and secretion36,37. Based on the altered glycemic parameters observed in IKKβ-MGKO AL mice, we hypothesized that hypothalamic glucoregulatory mechanisms are impaired during DIO by genetic reduction in microglial inflammatory signaling. We first compared the hypothalamic expression of genes implicated in neuronal glucose sensing,38–41 including glucose transporters 1 and 2 (GLUT1/Slc2a1 and GLUT2/Slc2a2), Gck, and uncoupling protein 2 (Ucp2), between IKKβ-MGKO AL mice and PF controls fed a HFD for 16 weeks (Figure 3A). In the IKKβ-MGKO AL mice, unchanged levels of Slc2a1 and elevated levels of Slc2a2 suggested largely intact hypothalamic glucose uptake. In contrast, the reduced levels of Gck and Ucp2 highlighted a potential functional reduction in hypothalamic neuronal glucose sensing (Figure 3A). To address this possibility, we quantified hypothalamic neuronal activation in response to a systemic glucose challenge in fasted IKKβ-MGKO AL mice and PF controls (2 g/kg, i.p.). IKKβ-MGKO AL mice had a marked reduction in the number of glucose-stimulated c-Fos+ cells in both the dorsomedial (DMH) and lateral (LHA) regions and a blunting of the glucose response in the ventromedial (VMH) nucleus (Figures 3B and 3C). Together, these data suggest that diet-induced activation of microglial NF-κB signaling maintains hypothalamic glucose sensing during HFD feeding, a potential mechanism to preserve glucose tolerance in the setting of DIO.
Figure 3. Hypothalamic glucoresponsiveness is impaired by loss of microglial IKKβ in obese mice.
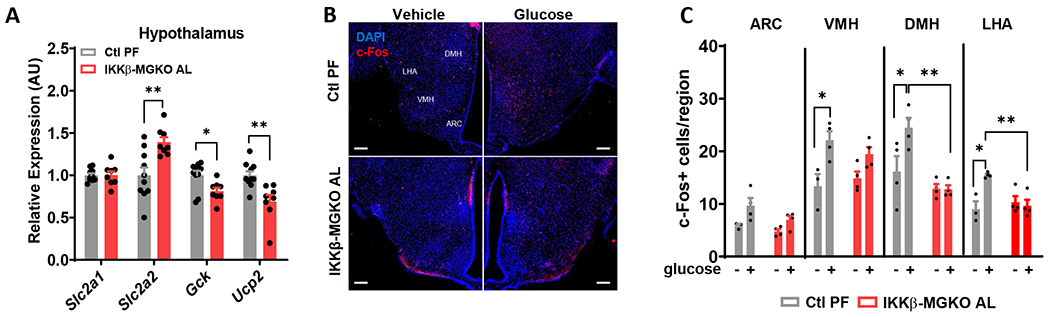
(A) Hypothalamic mRNA levels (relative to Ctl PF group) of glucose sensing genes after 16 weeks of HFD. N=7/group. (B) Hypothalamic c-Fos (red) and DAPI (blue) immunostaining 1 hour after glucose administration (2 g/kg, i.p.) in 10 week HFD-fed mice. Arcuate nucleus, ARC; ventromedial hypothalamus, VMH; dorsomedial hypothalamus, DMH; lateral hypothalamic area, LHA. Scale bar = 100 μm. (C) Quantification of B. N=3-4/group.
All values are mean ± SEM. (A) Student’s t-test. (C) Two-way ANOVA with Bonferroni post-hoc test. * p < 0.05, ** p < 0.01.
Increasing microglial inflammatory signaling improves glycemia in lean and obese mice.
If silencing microglial IKKβ signaling worsens glucose tolerance during DIO, then enhancing microglial NF-κB pathway activity would be predicted to have the opposite effect. To test this hypothesis, we analyzed Cx3cr1CreER/+::Tnfaip3fl/fl mice, a model of tamoxifen-inducible microglia-specific deletion of the NF-κB repressor protein A20 (Figure 4A).10,42 We previously reported that microglial A20 deletion causes a rapid, spontaneous conversion of microglia to a highly pro-inflammatory state, resulting in increased food intake and weight gain even on a CD.10 In this study, the Cx3cr1CreER/+::Tnfaip3fl/fl mice first received lethal irradiation while their heads and necks were shielded with lead to protect microglia and preserve blood-brain barrier integrity. The irradiated mice were subsequently transplanted with wild-type donor bone marrow in order to avoid confounding of later metabolic studies by inflammation generated by A20 deletion in peripheral myeloid cell populations (A20-BMT-MGKO; Figure 4A). In the resulting chimeric mice, Cre induction deletes A20 from microglia but leaves the wild-type peripheral immune and hematopoietic systems intact.10 One week after tamoxifen treatment, CD-fed A20-BMT-MGKO mice displayed hypertrophic microglia in the mediobasal hypothalamus (Figure 4B) along with increased TNFα expression (Figures 4B, 4C, and S2), indicating a heightened state of inflammatory activation consistent with prior studies. Remarkably, A20-BMT-MGKO mice had improved glucose tolerance compared to BMT controls despite equal weights (Figures 4D–4F). Similarly, in a separate cohort of mice fed HFD for 7 weeks, A20-BMT-MGKO mice had better glucose tolerance than control littermates (Figures 4G and 4H). Overall, these results reveal an unexpected effect of enhancing microglial inflammatory signaling to improve glucose tolerance in lean and obese mice.
Figure 4. Derepression of microglial IKKβ/NF-κB signaling through A20 (Tnfaip3) deletion improves glucose tolerance.
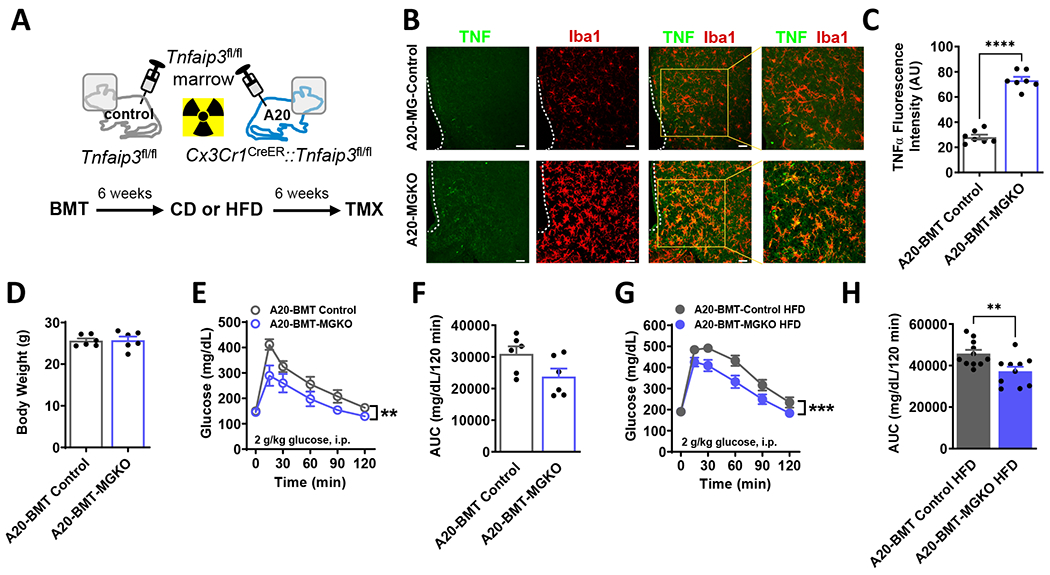
(A) Schematic diagram: Mice received lethal irradiation with head shielding to protect microglia and preserve blood-brain barrier integrity. Subsequently, adoptive transfer of Tnfaip3fl/fl bone marrow yielded Cre− Tnfaip3fl/fl controls (A20-BMT Control) and Cx3CrlCreER::Tnfaip3fl/fl (A20-BMT-MGKO) chimeric mice with Cre− peripheral myeloid cells and Cre+ microglia. Timeline: After 6 weeks recovery, mice received 6 weeks CD or HFD followed by tamoxifen (TMX) to induce microglial A20 deletion. Studies B-H were performed 1 week after TMX. (B) Hypothalamic TNF (green) and Iba1 (red) immunostaining from CD-fed BMT mice. Scale bars = 100 μm. (C) Quantification of B. N=7/group, 6 sections/mouse. (D) Body weight of CD-fed mice. N=6/group. (E) GTT and (F) AUC in CD-fed mice. (G) GTT and (H) AUC in HFD-fed mice.
All values are mean ± SEM. (C-D, F, H) Student’s t-test. (E, G) Two-way ANOVA. ** p < 0.01, *** p < 0.001, **** p < 0.0001.
Diet-independent models of acute microglial inhibition and activation.
Our results indicated an apparent dissociation between the detrimental impact of microglial inflammatory signaling on body weight regulation and its salutary effect on glucose homeostasis. To further explore this unexpected dichotomy, we sought to manipulate microglial signaling acutely to avoid potential compensatory adaptations to chronic gene deletion. As a first approach, we administered the third-generation tetracycline derivative minocycline, a widely used microglial inhibitor,43–45 into the CNS of 4 week HFD-fed rats. Rats receiving minocycline (10 μg, i.c.v.) had an acute impairment in insulin tolerance compared with vehicle-treated controls (Figures S3A–S3C), analogous to the insulin resistant phenotype of the IKKβ-MGKO mice.
Next, we used the Designer Receptor Exclusively Activated by Designer Drugs (DREADD) chemogenetic system46,47 to express the Gq-coupled hM3Dq (activating) receptor in microglia, which we hypothesized could provide a diet-independent means to trigger microglial activation in vivo using the synthetic DREADD agonist clozapine N-oxide (CNO). We first confirmed that Cx3cr1CreER::CAG-LSL-HA-Gq-DREADD-mCitrine mice (hM3D) treated with tamoxifen to activate Cre-mediated recombination had stable expression of the transgene in microglia up to 28 weeks later (Figure S4A). As with the IKKβ-MGKO mouse line, we waited 4 weeks after tamoxifen administration to allow for peripheral myeloid cell turnover and found expression of hM3D, as determined by qRT-PCR, was restricted to the CNS (Figure S4B; data not shown). As expected, hM3D mice and littermate controls (Cx3cr1CreER/+) showed equivalent weight curves on CD (data not shown), since the hM3Dq receptor remains inactive in the absence of CNO administration. To validate Gq-coupled signal transduction in this chemogenetic mouse model, we measured the change in intracellular calcium concentration ([Ca2+]i) in response to CNO treatment in primary microglia preloaded with the calcium indicator Fura Red. CNO treatment (0.01-0.1 μM) caused a rapid rise in [Ca2+]i, which remained elevated for several hours afterward (Figures S4C and S4D), consistent with prior reports using DREADDs in microglia.47–52 In vivo, CNO treatment (1 mg/kg, i.p.) increased microglial cell size but not cell number throughout the CNS including in the hypothalamus (Figures S4E–S4G; data not shown) and resulted in upregulation of cytokine and chemokine mRNA levels in FACS-isolated microglia (Figure S4H). Importantly, CNO treatment did not reduce 24-hour food intake or dark cycle ambulatory activity (Figures S5A–S5D), suggesting that acute chemogenetic activation of microglia does not induce sickness behavior despite increasing cytokine gene expression (Figures S4E–S4H).
Acute chemogenetic activation of microglia improves glucose tolerance.
Having validated the hM3D model, we next utilized systemic CNO administration to determine the effect of acute diet-independent microglial activation on glucose tolerance in CD-fed hM3D and control mice. While no differences were observed with vehicle treatment (data not shown), microglial activation with CNO (1 mg/kg, i.p.) caused a significant though modest improvement in glucose tolerance in hM3D mice compared to controls (Figures 5A and 5B). High dose CNO treatment (5 mg/kg, i.p.) elicited a more consistent and robust glucose response, still without inducing sickness behavior (Figures 5C and 5D; data not shown). Similar effects were observed in female hM3D mice (data not shown). Sustained microglial activation using orally-delivered CNO (25 μg/ml in water bottles; ~75-100 μg daily) did not affect body weights (Figure 5E) but markedly improved glucose tolerance in hM3D mice compared with controls (Figures 5F and 5G). Interestingly, return of the animals to normal water reversed the benefit (Figures 5H and 5I), indicating that improved glucose tolerance depends on sustained microglial activation. Overall, the results with the hM3D model demonstrate that microglia regulate systemic glycemia independently of body weight or food intake alterations.
Figure 5. Acute pharmacogenetic activation of microglia improves glucose homeostasis in CD and HFD-fed mice.
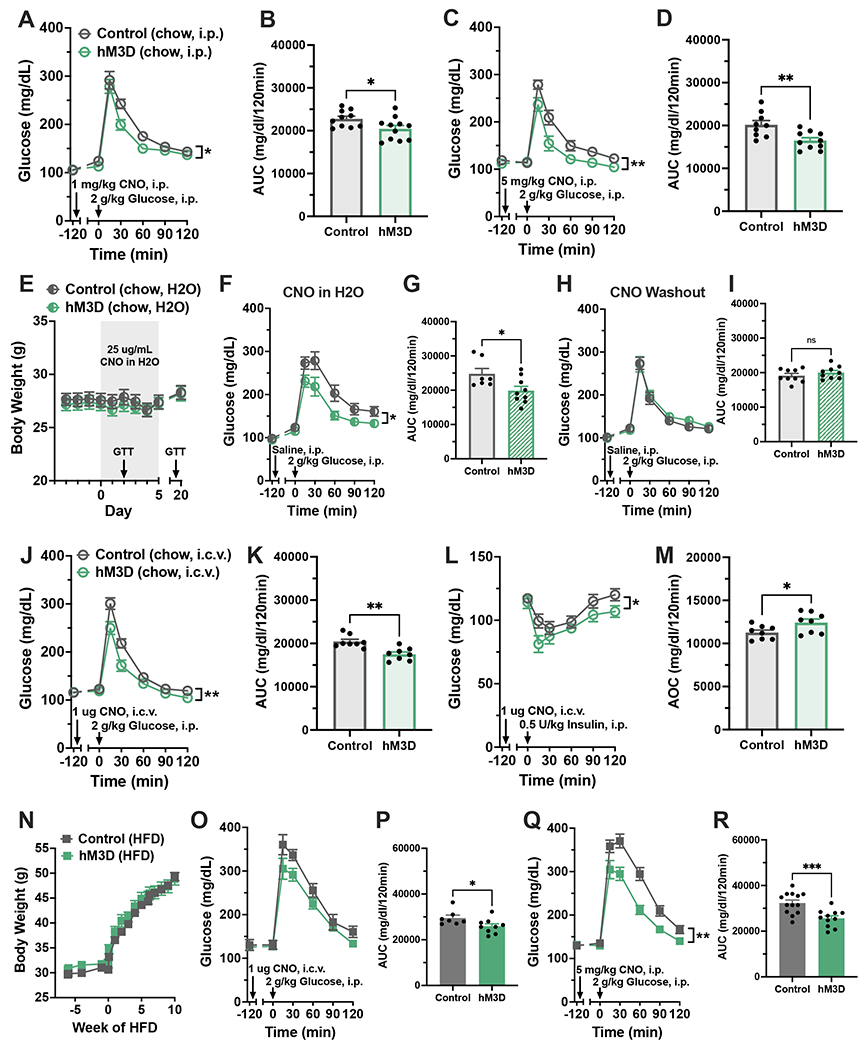
(A-M) hM3D mice and littermate controls were fed ad libitum CD. (A) GTT and (B) AUC with systemic CNO (1 mg/kg, i.p.). N=11-14/group. (C) GTT and (D) AUC with high-dose systemic CNO (5 mg/kg, i.p.), N=10-11/group. (E-I) Mice were maintained on CNO drinking water (25 μg/mL) for 14 days then returned to normal water. N=9/group. (E) Body weights during treatment. Arrows indicate dates of GTTs in F and H. (F) GTT and (G) AUC following 2 days of CNO water. (H) GTT and (I) AUC after 7 days of normal water. (J) GTT and (K) AUC, and (L) ITT and (M) area over the curve (AOC) after central CNO treatment (1μg, i. c.v.), N=8/group. (N-R) hM3D mice and littermate controls were fed ad libitum HFD. (N) Body weights over 10 weeks of HFD. (O) GTT and (P) AUC after 4 weeks HFD with central CNO (1 μg, i.c.v.), N=8-10/group. (Q) GTT and (R) AUC after 8 weeks HFD with systemic CNO (5 mg/kg, i.p.), N=11-14/group.
All values are mean ± SEM. (A, C, F, H, J, L, O, Q) Two-way ANOVA. (B, D, G, I, K, M, P, R) Student’s t-test. * p < 0.05, ** p < 0.01, *** p < 0.001.
Recent analyses of Cx3cr1CreER-based marker mice have shown that some populations of long-lived macrophages in the periphery as well as perivascular macrophages of the CNS have sufficient Cre expression to show recombination of floxed alleles.53–58 Therefore, we performed two control experiments to verify that the chemogenetic effect is linked to CNS microglia rather than other myeloid cells. First, we compared different routes of CNO administration. Low-dose CNO treatment delivered centrally (1 μg, i.c.v.; Figures 5J and 5K) but not systemically (1 μg, i.p.; Figures S6A and S6B) improved glucose tolerance in CD-fed hM3D mice compared to controls, supporting a specific role for CNS myeloid cells in enhancing glucose disposal. This intervention also improved insulin sensitivity (Figures 5L and 5M), the opposite response to that obtained with microglial silencing using minocycline treatment in rats (Figures S3A–S3C). The second control experiment involved breeding hM3Dfl/+ mice with the Tmem119-CreER line55,58,59 (based on the microglial-restricted expression of Tmem119) to generate a distinct mouse model of microglial-specific chemogenetic activation (Tmem-Gq). As expected, chow-fed Tmem-Gq mice and littermate controls (Ctrl) did not differ in glucose tolerance in the absence of CNO (Figure S7A and S7B). After CNO dosing, however, Tmem-Gq mice had improved glucose tolerance compared to Ctrl mice (Figure S7C and S7D), similar to that observed in hM3D mice. Together, these two control studies demonstrate that the improved glucose tolerance observed in hM3D animals is most likely due to the actions of microglia in the brain parenchyma rather than from signaling by peripheral myeloid cells or CNS perivascular macrophages.
CD-fed mice have homeostatic microglia at baseline, making them a logical model in which to assess the metabolic effects of microglial activation. However, they are also highly insulin sensitive and glucose tolerant, which constrains the degree to which any intervention can further improve glycemic parameters. To overcome this limitation, we returned to the hM3D model and assessed mice with established DIO, which are much more insulin resistant though already show a shift of microglia to a less homeostatic profile. As expected, hM3D mice fed a HFD gained weight at the same rate as control animals (Figure 5N) since the hM3D receptor remained inactive without CNO treatment. At 4 weeks of HFD feeding, acute central CNO administration (1 μg, i.c.v.; Figures 5O and 5P) caused an improvement in glucose tolerance that was even more pronounced with high-dose systemic CNO treatment performed after 8 weeks of HFD feeding (5 mg/kg, i.p.; Figures 5Q and 5R). These data suggest that using chemogenetics to further enhance the microglial responses to HFD feeding can offset obesity-associated glucose intolerance.
Acute chemogenetic activation of microglia rescues glucose intolerance in obese mice through classical cytokine signaling.
Microglia influence neuronal populations through multiple direct and indirect interactions, including the release of cytokines.16–19 Given the findings in the IKKβ-MGKO and A20-BMT-MGKO mice (Figures 1–4) and the upregulated inflammatory gene expression in microglia from hM3D mice injected with CNO (Figure S4H), we hypothesized that chemokines or cytokines regulated by NF-κB—namely TNFα, IL-1β, IL-6, MIP 1α and 1β—might be responsible for the ability of microglia to modulate glucose homeostasis. Notably, all of these molecules except TNF have been previously shown to improve systemic glycemia through signaling in the CNS.60–63 However, neither central administration of an IL-6 blocking antibody (IL-6ab; 100 ng, i.c.v.; Figures S8A and S8B) nor an IL-1β inhibitor (IL-1RA; 2 μg, i.c.v.; Figures S8C and S8D) prevented the improvement of glucose tolerance in CNO-treated hM3D mice. Likewise, central treatment with an antagonist to the MIP 1α/β receptor CCR5 (CCR5ant (maraviroc); 500 ng, i.c.v.; Figures S8E and S8F) did not alter glucose tolerance. In contrast, inhibiting TNFα signaling through central administration of etanercept (TNFnab, a sTNFRII-Fc fusion protein; 2 μg, i.c.v.) reversed the glycemic benefits of CNO-mediated microglial activation (Figures 6A–6C). Correspondingly, central infusion of low-dose TNFα (2 pmol, i.c.v.) increased glucose disposal in CD-fed mice (Figures 6D and 6E). Together, these data implicate TNFα as a molecular mediator linking microglia to the regulation of glucose homeostasis.
Figure 6. Microglial regulation of glucose homeostasis involves central TNF and melanocortin signaling.
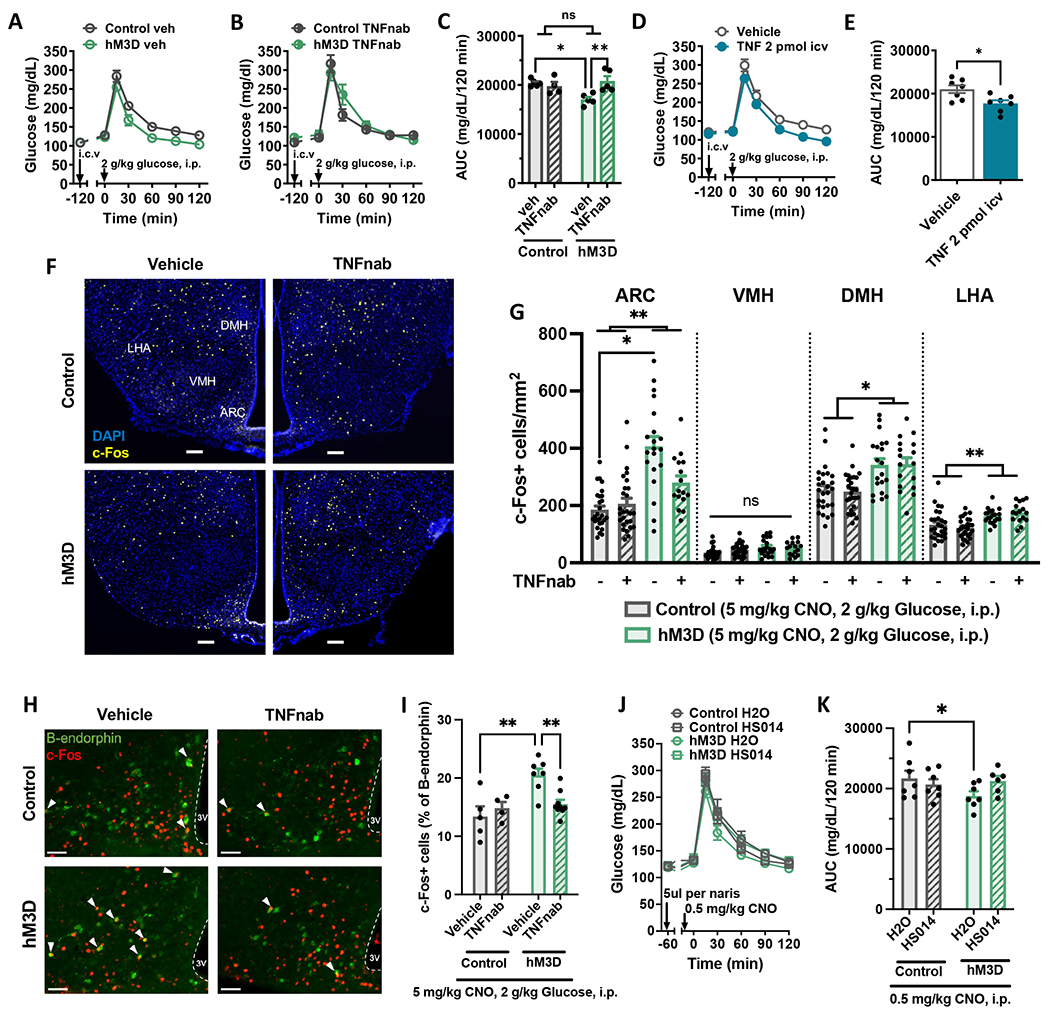
(A-B) GTT of mice administered systemic CNO (1 mg/kg, i.p.) and (A) vehicle (IgG-Fc) or (B) TNF neutralizing antibody etanercept (TNFnab) (2 μg, i.c.v.), N=5-7/group. (C) AUC of A and B. (D) GTT and (E) AUC in wild-type mice administered TNFα (2 pmol, i.c.v.) or vehicle, N=8/group. (F-I) CD-fed control and hM3D mice injected with CNO (5 mg/kg, i.p.) followed at 1 hour intervals by TNFnab (2 μg, i.c.v.) or saline vehicle, glucose (2 g/kg, i.p.), and perfusion for IHC analysis. (F) Hypothalamic immunostaining of c-Fos (yellow) and DAPI (blue). Arcuate nucleus, ARC; ventromedial hypothalamus, VMH; dorsomedial hypothalamus, DMH; lateral hypothalamic area, LHA. Scale bars = 100 μm. (G) Quantification of F. N=5-8/group, 1-6 sections/mouse. (H) Hypothalamic immunostaining of c-Fos (red) and β-endorphin (green; representing POMC neurons) in the ARC. White arrowheads indicate double-positive cells. Scale bars = 50 μm. (I) Quantification of c-Fos+ cells as a percent of β-endorphin cells from H. N=5-8/group, 4 sections/mouse. (J) GTT and (K) AUC in hM3D and control mice administered intranasal HS014 (50 μg/naris) or saline and low-dose CNO (0.5 mg/kg, i.p.), N=6-7/group.
All values are mean ± SEM. (C, K, I) Two-way ANOVA with Šidák post-hoc test. (E) Student’s t-test. (G) Mixed model with Tukey post-hoc test. * p < 0.05, ** p < 0.01.
Based on the finding of reduced hypothalamic glucose sensing in the IKKβ-MGKO mouse (Figure 3), we hypothesized that microglial activation in the hM3D model would increase the activity of hypothalamic glucoresponsive neurons via TNF action. To address this possibility, we examined hypothalamic c-Fos staining in hM3D and control mice treated with CNO to activate microglia (5 mg/kg, i.p.; 180 minutes prior to perfusion), vehicle or etanercept to block TNF action (TNFnab; 2 μg, i.c.v.; 120 minutes prior to perfusion), and glucose to mark glucoresponsive neurons (2 g/kg, i.p.; 60 minutes prior to perfusion). Compared with control mice, hM3D mice showed increased numbers of glucose-stimulated c-Fos+ neurons in both the DMH and LHA and an especially robust activation of neurons in the ARC (Figures 6F and 6G). Furthermore, central etanercept (TNFnab) administration significantly attenuated the ARC response (Figures 6F and 6G), demonstrating the involvement of TNF signaling in the enhancement of glucose sensing by chemogenetic microglial activation.
AgRP and POMC neurons are two major glucose sensing neuron subtypes in the ARC with POMC neuron activation improving systemic glucose parameters and AgRP neuron activation worsening them.64,65 Therefore, we hypothesized that POMC neurons would be represented in the population of c-Fos+ ARC glucose-sensing neurons activated by microglial inflammatory signaling. To address this possibility, hM3D and control mice were injected with CNO (5 mg/kg, i.p.) 60 minutes prior to saline or glucose (2 g/kg, i.p.) and examined for c-Fos expression in ARC POMC neurons (identified by β-endorphin expression). While saline-treated hM3D animals did not differ from controls, there was an increase in c-Fos labeling of POMC neurons in glucose-treated hM3D animals (Figure S8G and S8H). These data indicate that microglial activation enhances ARC POMC neuron glucose sensitivity. To determine whether TNF signaling is involved in this microglial-mediated priming of POMC neuron glucose sensing, we quantified c-Fos+ POMC neurons in the previously described cohort of etanercept vs vehicle-treated animals (Figures 6F and 6G). Similar to the overall ARC neuron findings, blockade of TNF signaling via TNFnab abrogated the increase in POMC-c-Fos staining induced by hM3D activation in response to glucose (Figure 6H and 6I).
Chemogenetic microglial activation concomitantly increased POMC neuron glucose responsiveness and improved systemic glucose tolerance. To determine whether increased melanocortin signaling mediated microglial effects on glucose homeostasis, we performed central administration of HS014, a selective melanocortin 4 receptor antagonist (50 ug/naris, intranasal), in hM3D and control animals treated with CNO (0.5 mg/kg, i.p.). HS014 attenuated the improvement in glucose tolerance in hM3D animals compared to saline controls supporting a potential role for POMC neurons in microglial modulation of glucose homeostasis (Figure 6J and 6K).
Acute chemogenetic activation of microglia increases first-phase insulin secretion via activation of the parasympathetic nervous system
The activation state and glucose-sensing capacity of POMC and other ARC neurons has a multitude of effects on the determinants of systemic glucose homeostasis including modulating insulin sensitivity and insulin secretion. Likewise, chronic loss of microglial inflammatory signaling alters insulin action in peripheral tissues and limits glucose-stimulated insulin secretion (Figure 2). Therefore, the mechanisms linking microglia to systemic glucose tolerance remained unclear. To address this question, we performed a frequently sampled intravenous glucose tolerance test (fsIVGTT; 1 g/kg glucose, i.v.) on a cohort of hM3D mice and controls with established DIO treated with CNO (5 mg/kg, i.p.). The fsIVGTT revealed a striking increase in insulin secretion in hM3D animals compared to controls along with a marked improvement in glucose tolerance (Figures 7A and 7B). Unlike in prior experiments (Figures 5 and 6), there was a significant difference in basal glucose values (Figure 7A), possibly related to the additional handling stress. Minimal modeling performed on the glucose and insulin data from the fsIVGTT indicated that the improved glucose tolerance in hM3D mice primarily resulted from the large increase in the acute insulin response to glucose (AIRg), or first phase insulin secretion, rather than changes in insulin sensitivity or glucose disposal per se (Figure 7C – 7E). Indeed, we observed enhanced glucose stimulated insulin secretion (GSIS) in CD-fed hM3D mice treated with CNO (5 mg/kg, i.p.) 8 minutes after i.p. glucose administration but not at 4, 15 or 30 minutes post-glucose load (Figure S9A – S9D; data not shown). Together these data demonstrate that the predominant effect of microglial signaling on the determinants of glucose tolerance is to increase pancreatic first phase insulin secretion.
Figure 7. Chemogenetic microglial activation increases first-phase insulin secretion via a parasympathetically-mediated process.
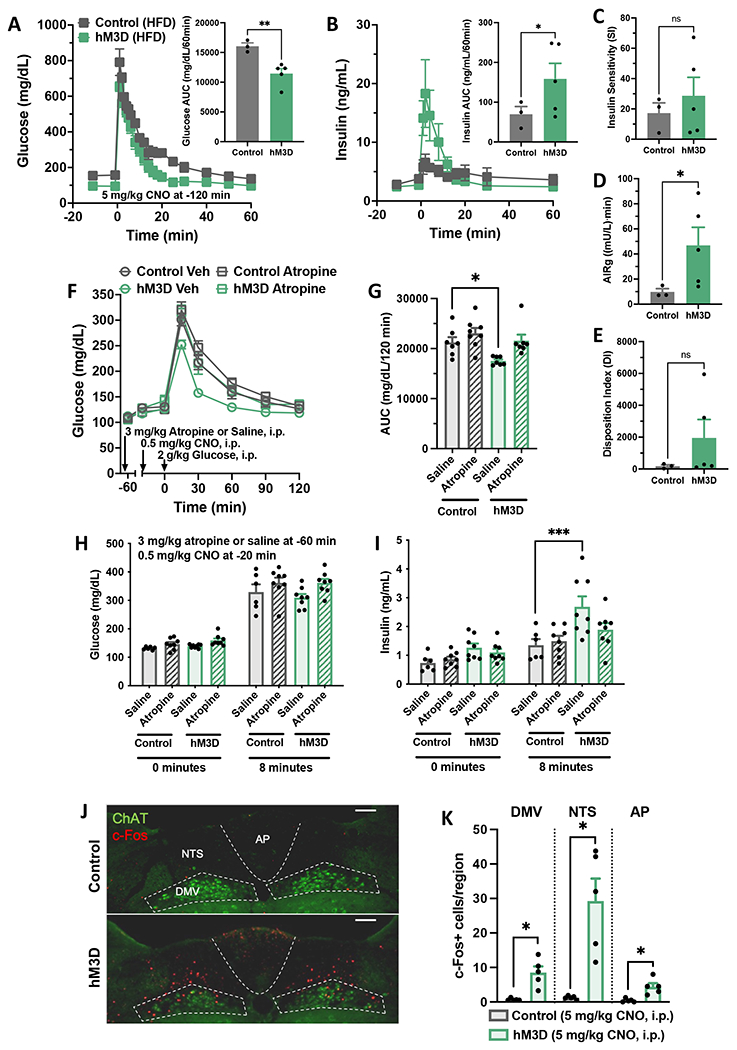
(A-E) Frequently sampled intravenous glucose tolerance testing (fsIVGTTs) was performed on 12-week HFD-fed control and hM3D mice treated with systemic CNO (5 mg/kg, i.p.). (A) fsIVGTT glucose and (B) insulin with AUC insets. (C-E) Minimal model parameters calculated from fsIVGTT glucose and insulin data, N=3-5/group. Acute insulin response to glucose, AIRg. (F-K) hM3D mice and littermate controls were fed ad libitum chow. (F) GTT and (G) AUC after atropine (3 mg/kg, i.p.) or saline and systemic CNO (0.5 mg/kg, i.p.), N=7-8/group. (H-I) Effect of atropine (3 mg/kg, i.p.) or saline and systemic CNO (0.5 mg/kg, i.p.) on (H) glucose and (I) insulin levels at 0 and 8 minutes post-glucose injection (2 g/kg, i.p.), N=9-11/group. (J) Hindbrain immunostaining of choline acetyltransferase (ChAT; green) and c-Fos (red) after systemic CNO (5 mg/kg, i.p.). Area postrema, AP; nucleus tractus solitarius, NTS; dorsal motor nucleus of the vagus, DMV. Scale bars = 100 μm. (K) Quantification of J, N=5/group, 2-4 sections/mouse. All values are mean ± SEM. (A, B, K) Student’s t-test. (C-E) Welch’s one-sided t-test. (G, I) Two-way/three-way ANOVA with Sidak post-hoc test. * p < 0.05, ** p < 0.01, *** p < 0.001.
Finally, we assessed whether the increase in glucose-stimulated insulin secretion occurred via reduced sympathetic or increased parasympathetic input to the pancreas. As expected, sympathetic nervous system activation with the alpha 2 agonist clonidine (0.01 mg/kg, i.p) worsened glucose tolerance in controls and hM3D mice; however, it did not abrogate the improvement induced by CNO treatment (0.5 mg/kg, i.p.; Figure S9E – S9G). In contrast, parasympathetic blockade using the muscarinic acetylcholine receptor antagonist atropine (3 mg/kg, i.p.) abolished the improvement in glucose tolerance produced by chemogenetic microglial activation with CNO (0.5 mg/kg, i.p.; Figure 7F and 7G). In parallel, a GSIS assay confirmed that atropine treatment (3 mg/kg, i.p.) blocked the increase in first-phase insulin secretion at 8 minutes induced by treatment with CNO (0.5 mg/kg, i.p.; Figure 7H and 7I).
Based on the involvement of parasympathetic signaling in the effect of microglial activation to enhance insulin secretion, we examined hindbrain sections from mice treated with CNO (5 mg/kg, i.p.) to quantify neuronal activation in the dorsal vagal complex (DVC) including vagal efferent neurons (marked by expression of choline acetyltransferase (ChAT)). Unlike in the hypothalamus, where neuronal c-Fos levels increased only after a glucose load, CNO treatment alone trigged significant neuronal activation throughout the DVC including the dorsal motor nucleus of the vagus (DMV), the nucleus tractus solitarius (NTS), and the area postrema (AP) (Figure 7J and 7K). Overall, these data suggest that microglia can enhance parasympathetic tone leading to increased first phase glucose-stimulated insulin secretion.
DISCUSSION
Microglia play an important role in obesity pathogenesis, but their impact on glucose tolerance independently of body weight has not been directly determined. Here we show with multiple cell-specific mouse models that microglial activation caused by either HFD feeding or chemogenetic induction drives an unexpected dissociation of energy metabolism and glucose homeostasis. Despite significant protection from diet-induced obesity, mice lacking microglial inflammatory signaling (IKKβ-MGKO) become more glucose intolerant than control mice during HFD feeding. Indeed, glucose-stimulated insulin secretion and insulin sensitivity, along with indicators of neuronal glucose sensing, are actually reduced in IKKβ-MGKO mice relative to controls when the groups are weight matched. Conversely, microglial-specific deletion of A20 increases microglial inflammatory signaling and weight gain yet improves glucose tolerance in mice fed either a CD or a HFD. In a microglia-specific DREADD model, hM3D, that avoids the confounding effects of body weight differences and developmental compensation, microglial activation acutely improves glucose tolerance through a parasympathetic pathway that causes a dramatic increase in glucose-stimulated insulin secretion. This effect requires TNFα and melanocortin signaling and involves enhancement of glucose sensing by POMC and other ARC neurons. Together, these data comprise key evidence that microglial activation mitigates obesity-associated glucose intolerance despite contributing to DIO susceptibility.
Despite decades of research, the link between tissue inflammation and glycemia is still controversial. Contextual features lie at the core of this argument, namely the localization and exact nature of the inflammatory signals. Fat-rich diets and obesity induce NF-κB transcriptional activity and the secretion of pro-inflammatory mediators in liver, WAT, and peripheral leukocytes.66 For example, earlier murine studies showed a clear connection between IKKβ-mediated NF-κB signaling in hepatocytes and diet-induced hepatic insulin resistance.67,68 Further, DIO mice with myeloid-specific deletion of IKKβ maintain whole body insulin sensitivity,67 implicating bone marrow-derived cells as disruptors of euglycemia. In contrast to these studies, transgenic mice with constitutively active IKKβ in cells expressing aP2—primarily adipocytes and macrophages—are protected from glucose intolerance69 while deleting IKKβ in adipocytes has a diabetogenic effect.70 Moreover, local inactivation of the NF-κB transcriptional target TNFα in adipose tissue results in severe glucose intolerance and WAT remodeling, reminiscent of lipodystrophy.71 Additionally, Liu et al. demonstrated that virally-mediated liver IKKβ gain-of-function improves glucose homeostasis in adult ob/ob and DIO mice.72 Within the CNS, inflammatory signaling through IL-1β, IL-6, and MIP1/CCR5 has been implicated in improving glycemic parameters in lean and obese mice.22,60–63 Likewise, our findings illustrate the dual potential of another classical inflammatory cytokine TNF previously known to promote insulin resistance in WAT yet able to positively impact glucose homeostasis through action in the CNS. Together, these data highlight the ongoing complexity of the inflammation-glucose tolerance debate and the need to develop a unified model for understanding the role of cellular, tissue-specific, and systemic versus CNS inflammatory signaling in diabetes pathogenesis.
Reactive glia are observed not only during the development of obesity but also in settings of altered glycemic regulation. Radiological analyses in human subjects show that gliosis correlates with insulin resistance independently of BMI.4,5,73 In rats with poorly controlled diabetes, hyperglycemia is associated with gliosis in multiple brain regions.74,75 Surprisingly, insulin-induced hypoglycemia can also trigger microglial alterations.76 Together, these results indicate that glucose levels can regulate microglial phenotype. Nevertheless, live two-photon imaging indicates that microglia retain normal surveillance functions and phagocytic capacity even under aglycemic conditions (by using glutamate as an alternative fuel)77 Moreover, microglial silencing during hypoglycemia increases blood glucose,76 similar to our findings of worsening glycemia in DIO rats treated with minocycline and the HFD-fed IKKβ-MGKO mice. Likewise, microglial IL-1β production contributes to cephalic-phase insulin secretion,22 somewhat analogous to the enhancement of first phase insulin production by DREADD-mediated microglial activation. These findings favor the hypothesis that microglia are key modulators of systemic glucose homeostasis and insulin secretion, helping to maintain euglycemia in the face of environmental perturbations.
The hM3Dq-DREADD receptor activates Gq signaling upon administration of CNO leading to a rise in intracellular calcium and—in the case of neurons—an increased frequency of action potentials.46 Though largely applied to studies of neuronal function, DREADD methodology has also been used to manipulate a variety of other cell types, both in the CNS and the periphery.78 While we and others have used the hM3Dq-DREADD in microglia as a means of cellular stimulation,48–52 this type of activation lacks the nuances of environmental adaptation known to be a characteristic of microglial function in health and disease.16–19 In this case, use of hM3D mice provided a time-locked, diet-independent method to alter microglial activation and cytokine production. The phenotypes observed with hM3D-mediated microglial activation generally paralleled the genetic A20 deletion model, but some differences in the findings may be due to the nature of the interventions. Chemogenetic activation in the hM3D model is acute and its beneficial effect on glucose tolerance involves rapid changes in autonomic tone. In contrast, the deletions of A20 and IKKβ in microglia are chronic genetic interventions that interface with diet exposure, feeding behavior, adiposity, and other elements of systemic metabolism to elicit tissue level changes that determine glycemia. Despite these differences, these two distinct approaches support the idea that microglial signaling impacts a variety of glucoregulatory neurocircuits with far-ranging metabolic consequences. Future studies are needed to disentangle the similarities and differences between DREADD-mediated microglial activation and the complexity of microglial signaling changes that occurs with HFD feeding in order to provide the foundation for developing effective microglial-targeted therapies.
Acute hM3D activation with CNO increased microglial expression of inflammatory cytokines and chemokines. Therefore, we tested a number of cytokines and chemokines downstream of the NF-κB signaling pathway to determine their involvement in the glycemic effects of chemogenetic microglial activation. Both IL6 and IL-1β have been shown to act within the hypothalamus to improve systemic glucose homeostasis,61–63 and hypothalamic IL-1β has recently been shown to mediate cephalic-phase insulin release.22 Similarly, hypothalamic CCR5 (the receptor for MIP-1 molecules) has been previously implicated in glucose regulation, with central blockade using a CCR5 antagonist impairing both central and peripheral insulin sensitivity and worsening peripheral glucose tolerance.60 Despite these prior findings, blockade of central IL-6, IL-1β, and MIP/CCR5 signaling failed to reverse the improvements in glucose tolerance elicited by microglial activation. In contrast, TNFα was identified as a putative mediator since the TNF antagonist etanercept prevented glucose improvements and reduced glucose sensing by POMC and other ARC neurons. One limitation of these findings is the possibility that some of the pharmacological inhibitors had incomplete action to suppress cytokine signaling. For example, the IL-1RA dosing used in our experiments (100 ng, i.c.v.) was over 1000-fold lower than that of Wiedemann, et al. whose high dose of IL-1RA (25 mg/kg or ~600-700 μg, i.c.v.) resulted in massive peripheral leakage (equivalent to i.p. dosing at 25 mg/kg).22 In our studies, we calibrated the antagonist dosing to avoid baseline effects on glucose tolerance in controls and to restrict their pharmacologic action to the CNS. This approach prevented confounding from peripheral effects but may have limited the degree of inhibition. Thus, we cannot formally exclude the involvement of one or more additional signaling molecules in the microglial regulation of glucose tolerance.
Despite the caveat above, TNFα was found to be required for microglial activation to promote glucose tolerance. Moreover, central TNF administration similarly enhanced peripheral glucose handling. These results were unexpected, as TNFα secretion within the WAT of obese rodents and humans is considered a significant contributor to insulin resistance.66,79,80 Nevertheless, anti-TNFα therapy has shown limited efficacy in improving glycemic parameters in individuals with obesity,81,82 perhaps as a consequence of an opposing function in the CNS. Intriguingly, work by Yi et al. shows that microglial activation and hypothalamic TNFα increase in lean mice during the fed state.83 The authors further demonstrate that TNFα acutely enhances evoked firing frequency in POMC neurons.83 Likewise, we found that chemogenetic microglial activation significantly increased POMC neuron glucose sensing (measured using c-Fos expression) in a TNF-dependent manner. Since POMC neuron glucose sensing improves glucose tolerance and increases insulin secretion,84–87 these data provide a mechanistic basis for the contribution of central TNF signaling to glucose homeostasis. Indeed, blocking melanocortin-4 receptor signaling attenuates the glycemic benefit of microglial activation, further implicating this TNF → POMC molecular pathway.
Beyond POMC neurons, the central control of glucose homeostasis involves multiple brain regions and an ever expanding list of effector cells.21,36,37,88,89 Our study implicates altered activity of hypothalamic glucose sensing neurons (particularly in the ARC) and hindbrain vagal efferent neurons in the microglial regulation of glucose homeostasis, but these results do not preclude the involvement of other neurons or non-neuronal cells. For example, astrocytes participate in systemic glucose homeostasis regulation as well as brain glucose uptake and sensing89,90 and can act downstream of microglia to amplify inflammatory signals.91,92 In addition, CNS glucose sensing is controlled by a widely distributed network of glucoregulatory neurons throughout the midbrain and hindbrain,21,37,93,94 making it highly likely that microglial regulation of glucose tolerance involves multiple neuronal subtypes beyond the hypothalamus. Indeed, we observed increased neuronal activity among populations of hindbrain neurons throughout the DVC. Region-specific targeting of microglia remains a challenge though new tools have recently been described that should help unravel the complex interactions between different glial and neuronal populations that enable the fine tuning of systemic glucose homeostasis.26,95
Our data show that acute microglial activation augments hypothalamic neuronal activity in response to glucose (“glucose-sensing”) while loss of microglial inflammatory capacity has the opposite effect. Hypothalamic neurons are well-known to modulate insulin sensitivity, altering the rates of hepatic glucose production (HGP) and glucose uptake.83,84,96 Furthermore, POMC neuron glucose sensing as well as ARC glucose sensing more generally is critically involved in the regulation of insulin secretion.86,97 Thus, microglial activation of hypothalamic neurons may influence glucose tolerance through multiple peripheral mechanisms. In support of this hypothesis, our IKKβ-MGKO mice showed increased hepatic expression of gluconeogenic enzymes, reduced muscle insulin signaling, and unaltered insulin secretion despite insulin resistance and hyperglycemia. Conversely, acute chemogenetic microglial activation modestly improved insulin sensitivity but, more strikingly, amplified first-phase insulin secretion, which appeared to be the primary driver of enhanced glucose tolerance. Notably, this effect was a result of increased parasympathetic tone, which is known to boost glucose-stimulated insulin secretion.23,24 There is prior literature linking microglial inflammatory signaling with changes in autonomic tone in models of hypertension25 and a recent study implicating microglial IL-1β in cephalic insulin release,22 but the overall impact of microglial activation on the primary determinants of glucose homeostasis (glucose-stimulated insulin secretion and insulin sensitivity) had not been previously reported. Future studies will be needed to map the specific neurocircuits linking microglial inflammatory signaling to autonomic output and insulin secretion and to determine how these pathways are altered during DIO.
Here we demonstrate that microglia, the resident CNS innate immune cells, regulate energy balance and systemic glucose homeostasis in a reciprocal fashion. Loss of IKKβ in microglia reduces body weight but worsens glucose tolerance and exacerbates insulin resistance during a HFD challenge. Using multiple in vivo approaches, we also show that microglial activation enhances glucose disposal in both lean and obese animals through a TNF and melanocortin-dependent pathway. Our models demonstrate that microglia impact several facets of glucose homeostasis including hypothalamic glucose sensing, peripheral insulin sensitivity, and pancreatic insulin secretion. In sum, these findings identify a new central node in glycemic control and support the hypothesis that some aspects of microglial pro-inflammatory activation in response to fattening diets may be metabolically beneficial. As a more complete understanding of this mechanism develops, strategies targeting specific microglial signaling pathways may serve as useful adjuncts to treatments for T2DM and other glucose-related disorders.
LIMITATIONS
The majority of our genetic and chemogenetic models have the potential to affect myeloid-lineage cells throughout the CNS and the periphery. Prior studies with the Cx3Cr1-CreERT-based system have demonstrated that peripheral macrophages largely undergo replacement with un-recombined bone marrow-derived cells, allowing this model to be used to characterize microglia. Nevertheless, small populations of long-lived CX3CR1+ tissue macrophages could contribute to the observed phenotypes though our studies using bone marrow transplantation, ICV CNO administration, and the microglia-specific Tmem119-based model make this possibility unlikely. Second, the genetic approaches we used affected microglia throughout the CNS, leaving uncertain the precise glia and neurons involved in glucose regulation. Ongoing efforts to improve methods for microglial gene transduction will assist with identifying brain regions and key microglial-neuronal interactions that mediate these effects. Third, microglia are highly plastic cells that can adopt multiple morphological, transcriptional, and functional profiles under both physiological and pathological conditions. Thus, “activation” by HFD feeding and chemogenetic induction do not cause a switch between two binary states but rather involve complex alterations to microglial phenotypes that will require future multi-omics approaches to fully characterize. Finally, our pharmacologic studies identified TNFα and POMC neurons as mediators linking microglia to systemic glucose tolerance but did not exclude the possible involvement of other signaling molecules, cell-cell interactions, and neuronal populations.
STAR METHODS
RESOURCE AVAILABILITY
Lead contact
Further information and requests for resources and reagents should be directed to and will be fulfilled by the Lead Contact, Joshua Thaler (jpthaler@uw.edu).
Materials availability
No unique reagents were generated in this study.
Data and code availability
All values used to generate the graphs and uncropped images of representative Western blots in the paper can be found in the file Data S1 – Source data. Raw data have been deposited at Mendeley Data and are publicly available as of the date of publication. DOIs are listed in the key resources table.
This paper does not report original code.
Any additional information required to reanalyze the data reported in this paper is available from the lead contact upon request.
KEY RESOURCES TABLE
| REAGENT or RESOURCE | SOURCE | IDENTIFIER |
|---|---|---|
| Antibodies | ||
| Chicken polyclonal GFP | enQuire Bioreagents | Cat# ab13970; RRID:AB_300798 |
| Donkey anti-chicken IgY (IgG) (H+L), Alexa Fluor 488 | Jackson ImmunoResearch Labs | Cat# 703-545-155; RRID:AB_2340375 |
| Donkey anti-goat IgG (H+L), Alexa Fluor 488 | Thermo Fisher Scientific | Cat# A-11055; RRID:AB_2534102 |
| Donkey anti-guinea pig IgG (H+L), Alexa Fluor 594-AffiniPure F(ab’)2 Fragment | Jackson ImmunoResearch Labs | Cat# 706-586-148; RRID:AB_2340475 |
| Donkey anti-rabbit IgG (H+L), Alexa Fluor 594 | Thermo Fisher Scientific | Cat# A-21207; RRID:AB_141637 |
| Donkey anti-rabbit IgG (H+L), Alexa Fluor 647 | Thermo Fisher Scientific | Cat# A-31573; RRID:AB_2536183 |
| Goat anti-chicken IgG (H+L), Alexa Flour 488 | Thermo Fisher Scientific | Cat# A-11039; RRID:AB_2534096 |
| Goat anti-mouse IgG (H+L), Alexa Flour 488 | Thermo Fisher Scientific | Cat# A-11001; RRID:AB_2534069 |
| Goat polyclonal choline acetyltransferase (ChAT) | Millipore | Cat# AB144P; RRID:AB_2079751 |
| Goat polyclonal Iba1 | Novus Biologicals | Cat# NB 100-1028; RRID:AB_521594 |
| Goat polyclonal mouse IL-6 | R and D Systems | Cat# AF-406-NA; RRID:AB_354478 |
| Guinea pig polyclonal insulin | Agilent (Dako) | Cat# A0564; RRID:AB_10013624 |
| Guinea pig recombinant monoclonal c-Fos | Synaptic Systems | Cat# 226 308; RRID:AB_2905595 |
| Mouse monoclonal Akt (pan) | Cell Signaling Technology | Cat# 2920; RRID:AB_1147620 |
| Mouse monoclonal TNFa | Abcam | Cat# ab1793; RRID:AB_302615 |
| Normal donkey serum | Jackson ImmunoResearch Labs | Cat# 017-000-121; RRID:AB_2337258 |
| Normal goat IgG | R and D Systems | Cat# AB-108-C; RRID:AB_354267 |
| Rabbit anti-guinea pig IgG (H+L) | Abcam | Cat# ab102356; RRID:AB_10712011 |
| Rabbit monoclonal HA | Cell Signaling Technology | Cat# 3724; RRID:AB_1549585 |
| Rabbit monoclonal Phospho-Akt (Ser473) | Cell Signaling Technology | Cat# 4060; RRID:AB_2315049 |
| Rabbit polyclonal B-endorphin | Phoenix Pharmaceuticals | Cat# H-022-33; RRID:AB_2314007 |
| Rabbit polyclonal c-Fos | Abcam | Cat# ab190289; RRID:AB_2737414 |
| Rabbit polyclonal Iba1 | FUJIFILM Wako Shibayagi | Cat# 019-19741; RRID:AB_839504 |
| Rat anti-mouse CD11b FITC | Bio-Rad | Cat# MCA711F; RRID:AB_323464 |
| Rat anti-mouse seroblock FcR | Bio-Rad | Cat# BUF041B; RRID:AB_605399 |
| Recombinant human IgG1 Fc | R and D Systems | Cat# 110-HG-100; RRID:AB_276244 |
| Goat anti-rabbit conjugated HRP | ThermoFisher | Cat# 31460; RRID:AB_228341 |
| Mouse monoclonal anti-beta actin | Cell Signaling Technology | Cat# 58169; RRID:AB_2750839 |
| Goat anti-rabbit conjugated HRP | Abcam | Cat# ab6721; RRID:AB_955447 |
| Chemicals, Peptides, and Recombinant Proteins | ||
| Atropine Sulfate Salt Monohydrate | Sigma-Aldrich | Cat# A0257 |
| Bond Polymer Refine Detection | Leica Biosystems | Cat# DS9800 |
| Bond Primary Antibody Diluent | Leica Biosystems | Cat# AR9352 |
| Clonidine Hydrochloride | Sigma-Aldrich | Cat# C7897 |
| Clozapine N-oxide (CNO) dihydrochloride (water soluble) | Hello Bio | Cat# HB6149 |
| Clozapine N-Oxide (CNO) | Tocris | Cat# 4936 |
| DAPI (4’,6-Diamidino-2-Phenylindole, dihydrochloride) | Thermo Fisher Scientific | Cat# D1306 |
| 50% Dextrose Injection, USP | Hospira, Inc. | N/A |
| Dimethyl Sulfoxide (DMSO) | Sigma-Aldrich | Cat# D1435 |
| Etanercept, Enbrel | Amgen | N/A |
| Gibco Dulbecco’s Phosphate-Buffered Saline (DPBS) | Thermo Fisher Scientific | Cat# 14040-117 |
| Gibco Fetal Bovine Serum | Thermo Fisher Scientific | Cat# 10082-147 |
| Gibco GlutaMAX Supplement | Thermo Fisher Scientific | Cat# 35050-061 |
| Gibco MEM, high glucose | Thermo Fisher Scientific | Cat# A14518-01 |
| Gibco MEM, no glutamine, no phenol red | Thermo Fisher Scientific | Cat# 51200-038 |
| Gibco Penicillin-Streptomycin-Glutamine (100x) | Thermo Fisher Scientific | Cat# 10378-016 |
| Halt Phosphatase Inhibitor Cocktail | Thermo Fisher Scientific | Cat# 78420 |
| Halt Protease Inhibitor Cocktail | Thermo Fisher Scientific | Cat# 78430 |
| 4-Hydroxytamoxifen | Sigma-Aldrich | Cat# H7904 |
| Insulin, Humulin-R | Eli Lilly | Cat# HI-213 |
| Invitrogen Fura Red, AM | Thermo Fisher Scientific | Cat# F3021 |
| Lipopolysaccharides (LPS) from Escherichia coli O55:B5 | Sigma-Aldrich | Cat# L6529 |
| Maraviroc | Tocris Bioscience | Cat# 3756 |
| 2-Mercaptoethanol | Sigma-Aldrich | Cat# 3148 |
| Novocastra Peroxidase Block | Leica Biosystems | Cat# RE7101-CE |
| Percoll Centrifugation Media | Cytiva | Cat# 17089101 |
| Pierce ECL 2 Western Blotting Substrate | Thermo Scientific | Cat# PI80196 |
| Pluronic F-127 | Sigma-Aldrich | Cat# P2443 |
| Recombinant Human IL-1RA | PeproTech, Inc. | Cat# 200-01RA |
| Recombinant Mouse TNF-α | Cell Signaling Technology | Cat# 5178 |
| Recombinant Murine mCSF | PeproTech, Inc. | Cat# 315-02 |
| RIPA Lysis and Extraction Buffer | Thermo Fisher Scientific | Cat# 89900 |
| Sodium Pyruvate | Sigma-Aldrich | Cat# P5280 |
| Tamoxifen | Sigma-Aldrich | Cat# T5648 |
| Triton X-100 | Fisher Scientific | Cat# BP151-100 |
| Critical Commercial Assays | ||
| Applied Biosystems High-Capacity cDNA Reverse Transcription Kit | Thermo Fisher Scientific | Cat# 4368814 |
| Pierce BCA Protein Assay Kit | Thermo Fisher Scientific | Cat# 23227 |
| RNeasy Micro Kit | Qiagen | Cat# 74004 |
| Ultra Sensitive Mouse Insulin ELISA Kit | Crystal Chem | Cat# 90080 |
| Ultra Sensitive Rat Insulin ELISA Kit | Crystal Chem | Cat# 90060 |
| Deposited Data | ||
| Data S1 - Source Data | This Paper | DOI: |
| Experimental Models: Organisms/Strains | ||
| C57BL/6J | The Jackson Laboratory | Strain# 000664; RRID:IMSR_JAX:000664 |
| Cx3cr1CreER (EYFP) | The Jackson Laboratory | Strain# 021160; RRID:IMSR_JAX:021160 |
| Cx3cr1CreER | The Jackson Laboratory | Strain# 020940; RRID:IMSR_JAX:020940 |
| Tmem119CreER | The Jackson Laboratory | Strain# 031820; RRID:IMSR_JAX:031820 |
| hM3Dfl/fl | The Jackson Laboratory | Strain# 026220; RRID:IMSR_JAX:026220 |
| Ikbkbfl/fl | Arkan, et al. | |
| Tnfaip3fl/fl | Tavares, et al. | |
| Wistar IGS Rats | Charles River Laboratories | Strain# 003; RRID:RGD_737929 |
| Oligonucleotides | ||
| Genotyping Primers | See Table S1 | N/A |
| Real-time qPCR Primers | See Table S1 | N/A |
| Software and Algorithms | ||
| Fiji/ImageJ | Schindelin et al. | fiji.sc |
| GraphPad Prism (Version 9.5.1) | GraphPad Software | www.graphpad.com |
| JMP Pro 16.0.0 | JMP Statistical Discovery | www.jmp.com |
| Sequence Detection System (SDS) Software v2.2 | Applied Biosystems | www.thermofisher.com |
| VitalView Activity Software | Starr Life Sciences Corp. | www.starrlifesciences.com |
| WinSAAM 3.0 | Darko et al. | www.winsaam.org |
| Other | ||
| Axio Imager Light Microscope | Zeiss | www.zeiss.com |
| Bond Automated Immunostainer | Leica Biosystems | www.leicabiosystems.com |
| BZ-X800 Fluorescence Microscope | Keyence | www.keyence.com |
| Eclipse E600 Fluorescence Microscope | Nikon | www.microscope.healthcare.nikon.com |
| E-mitter Implantable Transponders (Mouse) | Starr Life Sciences Corp. | www.starrlifesciences.com |
| FreeStyle Lite Glucose Test Strips | Abbott Diabetes Care | N/A |
| FreeStyle Freedome Lite Glucose Monitor | Abbott Diabetes Care | N/A |
| High-fat diet (60% kcal fat) | Research Diets, Inc. | Cat# D12492 |
| Potter-Elvehjem Tissue Grinder, 10 mL | Wheaton | Cat# 358039 |
| Standard chow diet | LabDiet | Cat# 5053 |
| TCS SP5 Confocal Microscope | Leica Biosystems | www.leica-microsystems.com |
EXPERIMENTAL MODEL DETAILS
Animal husbandry
All procedures were performed in accordance with NIH Guidelines for Care and Use of Animals and were approved by the Institutional Animal Care and Use Committees at the University of California, San Francisco and the University of Washington. Unless otherwise specified, all rodents were group-housed and age-matched with ad libitum access to water and diet in a pathogen- and temperature-controlled room (22°C) with a 12:12h light:dark cycle (changed by the University of Washington facility to 14:10h light:dark during the hM3D studies). Mice were fed either a standard low-fat CD (5053, LabDiet) or a semi-purified HFD (60% fat kcal; D12492, Research Diets, Inc). All mouse studies used adult males from strains backcrossed onto the C57BL/6 background. Littermates of the same sex were randomly assigned to experimental groups. Trained animal care staff from the Department of Comparative Medicine conducted routine husbandry procedures (e.g., cage cleaning, feeding, watering) and checked animals daily to assess their conditions. If animals exhibited any indication of illness or distress, the laboratory staff conferred with on-site veterinary staff immediately to recommend appropriate interventions. Anesthesia for euthanasia was by isoflurane or 100 mg/kg ketamine and 10 mg/kg xylazine.
Rodent lines and experimental animals
Wistar
Adult male Wistar IGS rats were purchased from Charles River Laboratories (strain #003; RRID: RGD_737929).
C57Bl/6J
Mouse line was purchased from The Jackson Laboratory (strain #000664; RRID: IMSR_JAX:000664).
Cx3cr1CreER (EYFP)
Mouse line was purchased from The Jackson Laboratory (strain #021160; RRID: IMSR_JAX:021160).
Cx3cr1CreER
Mouse line was purchased from The Jackson Laboratory (strain #020940; RRID: IMSR_JAX:020940).
Tmem119CreER
Mouse line was purchased from The Jackson Laboratory (strain #031820; RRID: IMSR_JAX:031820).
hM3Dfl/+
The CAG-LSL-HA-Gq-DREADD-mCitrine mouse line was purchased from Jackson Laboratory (strain #026220; RRID: IMSR_JAX:026220).
Ikbkbfl/fl
Conditional IKKβ deleter mice were obtained from the laboratory of Dr. Michael Karin (Arkan et al., 2005).
Tnfaip3fl/fl
Conditional A20 deleter mice were obtained from the laboratory of Dr. Averil Ma (Tavares et al., 2010).
Cx3cr1CreER/+ (EYFP):: Ikbkbfl/fl (IKKβ-MGKO)
Heterozygous Cx3cr1-Cre (EYFP) mice were bred to be homozygous Ikbkbfl/fl. Experimental animals were generated by crossing Cx3cr1CreER/+ (EYFP):: Ikbkbfl/fl mice with Ikbkbfl/fl mice. Cx3cr1WT littermates were used as controls.
Cx3cr1CreER/+ (EYFP) :: Tnfaip3fl/fl (A20-MGKO)
Heterozygous Cx3cr1-Cre (EYFP) mice were bred to be homozygous Tnfaip3fl/fl. Experimental animals were generated by crossing Cx3cr1CreER/+ (EYFP) :: Tnfaip3fl/fl mice with Tnfaip3fl/fl mice. Cx3cr1WT littermates were used as controls.
Cx3cr1CreER/+ :: hM3Dfl/+ (hM3D)
Experimental mice were generated by breeding homozygous Cx3cr1-Cre mice to heterozygous hM3Dfl/+ mice. Cx3cr1CreER/+ littermates were used as controls.
Tmem119CreER/+ :: hM3Dfl/+ (Tmem-Gq)
Experimental mice were generated by breeding homozygous Tmem119-Cre mice to heterozygous hM3Dfl/+ mice. Tmem119CreER/+ littermates were used as controls.
Generation of experimental mice
Induction of CreER-mediated recombination
Cre-ER-mediated recombination in the IKKβ-MGKO model was induced using 2 injections of tamoxifen 48-h apart (4 mg per dose in purified corn oil, s.c.; Sigma). For the A20-BMT-MGKO mouse, recombination was elicited using 3 consecutive days of oral tamoxifen (5 mg per dose dissolved in purified corn oil, by gavage). For the hM3D model, a more prolonged tamoxifen protocol with 4 consecutive daily injections of tamoxifen (2 mg per dose in purified corn oil, i.p.) was used to increase recombination efficiency. The Tmem-Gq model demonstrated very inefficient recombination in response to the tamoxifen protocol we used with the hM3D model (4 daily injections, 2 mg/dose in purified corn oil, i.p.). An extended high-dose tamoxifen protocol (10 injections of 100 mg/kg in purified corn oil, i.p.) was used to improve recombination. For all models, control mice received the same tamoxifen regimen described above to ensure equivalent exposure. Except for the A20-BMT control and A20-BMT-MGKO mice, experiments were initiated at least 4 weeks after tamoxifen to allow for turnover and replacement of CX3CR1-expressing peripheral immune cells by newly born non-recombined monocytes derived from the bone marrow. Microglia are long-lived and replenished through clonal proliferation so they retain the recombined allele indefinitely (data not shown) .10,26–29
Bone marrow transplantation
Bone marrow chimeras were created as described previously.10 Briefly, 8-week-old A20-BMT control or A20-MG-BMTKO mice were anesthetized and individually placed in lead tubes (RPI) to shield their heads and necks from irradiation. The mice were lethally irradiated in two 5Gy doses given 3h apart and underwent bone marrow transplantation the next day by tail-vein injection with 3 x 10⁶ cells from femoral and tibial bone marrow flushed from A20 control donor mice. Mice were allowed to recover for 6 weeks, followed by dietary intervention and tamoxifen induction of CreER-mediated recombination.
Primary cell cultures
Primary cultures of cortical mixed glia from P0-2 male and female mouse pups were prepared as previously described.30 After 14 days in culture media (high glucose MEM, 10% fetal bovine serum, Glutamax, mCSF, penicillin/streptomycin; Thermo Fisher, PeproTech) flasks were shaken at 220 rpm for 6 hours at 37°C to release microglia. The cells were pelleted, washed with Dulbecco’s PBS (DPBS; Thermo Fisher) and plated onto 96-well plates. To induce recombination, all wells were treated for 48 hours with 5 μM 4-hydroxytamoxifen (4-OHT; Sigma), followed by two DPBS washes and 4-OHT-free culture media. Cells were serum starved overnight prior to treatment with serum-free media with or without LPS (100 ng/ml; Sigma) for 6 hours. Cells were then washed twice with DPBS and lysed for RNA extraction and subsequent analyses.
METHOD DETAILS
In Vivo rodent studies
Dietary interventions
Adult Wistar rats were given ad libitum HFD for the minocycline study. For studies using the Ikbkbfl/fl mouse strain, two separate feeding paradigms were performed. For the strictly ad libitum experiment, 6-week-old Ikbkbfl/fl (Ctl) and Cx3cr1CreER/+ (EYFP)::Ikbkbfl/fl (IKKβ-MGKO) mice were injected with tamoxifen (see above) and then switched to HFD or maintained on CD 4 weeks later at 10 weeks of age, with weekly body weight and food intake measurements. Glucose tolerance was assessed at week 10 of HFD. For pair feeding experiments, 10-week-old Ctl and IKKβ-MGKO mice were maintained as follows: group averages of 24-h intake of the ad libitum-fed IKKβ-MGKO mice were measured on the day prior to the pair-fed Ctl mice receiving 70% of their total daily food at 17:00 and the 30% at 09:00 the following day.98 All mice in the pair feeding study were handled twice daily with body weights and food intake recorded once daily. To avoid confounding by different timing of food intake between pair-fed and ad libitum groups, all mice were allowed free access to food for 2 days prior to glucose and insulin assessments. For A20 studies, 6 weeks after bone marrow transplantation (see details above), adult Tnfaip3fl/fl (A20-BMT Control) and Cx3cr1CreER/+ (EYFP)::Tnfaip3fl/fl (A20-BMT-MGKO) mice were maintained on CD or switched to HFD for 6 weeks. Mice were then administered tamoxifen (see above) and subjected to measures of glucose homeostasis 1 week after. For hM3D studies, cohorts of Cx3cr1CreER/+::LSL-HA-hM3Dq-Citrine (hM3D) and littermate control Cx3cr1CreER/+ mice underwent tamoxifen administration at 6 to 8 weeks old (see above). Several cohorts underwent lateral ventricular cannulation (see method below). All hM3D mice on CD diet underwent measures of glucose homeostasis at least 4 weeks after tamoxifen. For DIO studies, several CD cohorts were switched to HFD feeding at ~16-20 weeks of age and assessed beginning 4 weeks after diet start.
Chemogenetic studies of glucose homeostasis
Cohorts of CD and HFD-fed hM3D and control mice received training i.p. injections and a baseline GTT (see method below) using i.p. saline vehicle prior to clozapine N-oxide (CNO) studies. Stock CNO (Hello Bio or Tocris) was prepared in DMSO and diluted to 1% DMSO in saline to final concentrations of 0.03 mg/mL, 0.05 mg/mL, 0.1 mg/mL, or 0.5 mg/mL; mice received 10 μL/g body weight yielding 0.3 mg/kg, 0.5 mg/mL, 1 mg/kg, or 5 mg/kg doses as stated in the text and figures. On experimental days, food was removed by 9am, followed 2h later by administration of saline or CNO (0.3-5 mg/kg, i.p.). GTT, ITT, pyruvate tolerance, or glucose-stimulated insulin secretion was performed 20 min – 2 hours after CNO administration (see below for methods). Animals were allowed at least 1 week recovery between studies.
For CNO drinking water studies, we adapted a published protocol.99 CD-fed control and hM3D mice were single-housed at 12 weeks-old and trained on water bottles for 2 weeks. Baseline daily water and food intake measures were taken for 1 week and then all mice were switched to CNO in the water (25 μg/ml; dissolved at 13mg/ml in DMSO then diluted in sterile water to final cone of 0.2% DMSO). CNO water was stored at 4°C, distributed fresh to animal bottles every 1-3d, and shielded from light throughout the experiment. Mice were maintained on CNO water for 14d with GTT using i.p. saline vehicle (10 μL/g, i.p.) performed on day 2, then were returned to normal water with repeat GTT using i.p. saline vehicle on day 7 of normal water. Saline injection was given 2 hours prior to glucose to allow comparison with i.p. CNO paradigms.
Intracerebroventricular injection
Adult Wistar rats were given ad libitum HFD for 4 weeks prior to i.c.v. cannulation. 6-week-old hM3D and control mice were given tamoxifen and underwent cannula implantation at 8 weeks of age. For the TNF study, a separate cohort of 8-week-old C57Bl/6J mice underwent cannula implantation. Steel guide cannulas (Alzet, DURECT Corp.) were implanted into the lateral ventricle of mice and third ventricle of rats using standard coordinates.14,100 Animals were allowed to recover for 2 weeks and received multiple i.c.v. training injections prior to experiments. A 10 μL Hamilton syringe and sterile flexible tubing was used to inject conscious unrestrained rodents. Body weight and food intake was monitored daily throughout the experiments and animals were excluded if adverse reactions to injections occurred. For the rat studies, 3 doses of minocycline (10μg, 2 μL total per injection) or saline vehicle were administered: twice on the day prior and once on the day of the ITT (final dose 1h before insulin administration). For mouse i.c.v. CNO studies, all injections were 2 μL of volume and performed 2h prior to GTT or ITT. For cytokine inhibition studies, hM3D and control mice received CNO (1mg/kg, i.p.) at the same time as either TNFα neutralizing antibody (TNFnab; 2 μg; Etanercept; Amgen) or its vehicle (recombinant human IgG-Fc; R and D Systems); goat anti-mouse IL-6 antibody (250 ng; R and D Systems) or its vehicle (normal goat IgG; R and D Systems); recombinant human IL-1RA (100 μg; PeproTech, Inc) or its vehicle (0.1% BSA in sterile PBS); or CCR5 antagonist (500 ng; Maraviroc) or its vehicle (1% DMSO in saline). For the TNF study, wild-type mice received i.c.v. recombinant mouse TNF peptide (2 pmol; Cell Signaling Technology) or its vehicle (1% BSA in sterile PBS) administered 2h prior to GTT. Peptide and inhibitor doses used were determined according to effective ranges from published studies.101 For quantification of glucose stimulated c-Fos in hM3D mice, i.c.v. injection of TNFnab (2 μg, 1 μL total) or vehicle (sterile saline) was performed two hours prior to sacrifice (between i.p. injections of CNO 5mg/kg and glucose 2g/kg).
Glucose tolerance test
Glucose tolerance tests (GTT) were performed as described previously30 with some modifications. Animals were fasted for 4 h (09:00-13:00) or overnight (21:00-09:00, pair-feeding experiments) prior to glucose administration (D-(+)-glucose, 30% solution, 2 g/kg, i.p.; Hospira, Inc). Glucose was measured in tail blood by hand-held glucometer (Abbott Diabetes Care). Total area-under-curve (AUC) was calculated by the trapezoid rule. For parasympathetic and sympathetic antagonist studies, clonidine (0.01 mg/kg, i.p.; Sigma) or saline, and atropine (3 mg/kg, i.p.; Sigma) or saline were administered 45 minutes or 60 minutes before the administration of glucose, respectively, and low-dose CNO (0.5 mg/kg, i.p.) was administered 20 minutes before glucose.
Glucose-stimulated insulin secretion was performed as in the GTT with minor modifications. Glucose (2 mg/kg either by gavage or i.p.) was administered with collection of tail blood at 0 and either 4, 8, or 15 min for insulin ELISA.
Frequently-sampled intravenous glucose tolerance tests (fsIVGTT) were performed as previously described102 by the Mouse Metabolic and Cellular Phenotyping Core of the Diabetes Research Center at the University of Washington, VA campus. 6-month-old control and hM3D mice were placed on HFD for 12 weeks. Venous and arterial catheters were surgically placed as described,103 and mice were allowed to recover for at least 1 week prior to fsIVGTT. Catheter placement, surgical recovery, and cannula patency proved challenging in DIO animals resulting in a modest sample size (3 control, 5 hM3D animals). Animals were fasted for 4h with CNO administered 2h (5 mg/kg, i.p.) prior to glucose administration (1 g/kg, i.v.). Minimal modeling was performed using WinSAAM 3.0104 compartmental modeling program using reference code provided by Darko Stefanovski and adjustments for mouse metabolic modeling as previously described.105
Insulin tolerance test
Animals were fasted for 4h (09:00-13:00) or overnight (21:00-09:00, pair-feeding experiments) and administered insulin (Eli Lilly) at specified doses (0.5-1.5 units per body weight; i.p.). Glucose was measured in tail blood by glucometer. Area-over-curve (AOC) glucose levels were calculated by the trapezoid rule.
Pyruvate tolerance test
Animals were fasted 6 hours (09:00-15:00) and administered pyruvate (2 g/kg, i.p.; Sigma). Glucose was measured in tail blood by glucometer.
Energy balance and body composition
To measure short term food intake in IKKβ-MGKO AL and Ctl PF mice, food intake was determined 4h into the dark cycle on at least 3 separate occasions during the pair feeding regimen. For food intake studies in hM3D mice, CD-fed animals had food removed 4h prior to the start of the dark cycle and were injected with saline or CNO 30 minutes prior to dark cycle onset and food return. Food and body weight were determined at 0 and 24h. 3d later, mice were crossed over to the opposite treatment and the measurements repeated.
Body composition analysis including fat mass and lean mass measurements was performed at the NIDDK-funded Nutrition Obesity Research Center (NORC) Energy Balance Core at the University of Washington using EchoMRI in awake, conscious mice. For the pair feeding study, mice were sacrificed after 14 weeks of HFD with immediate weighing of gonadal fat pads.
Ambulatory activity
Ambulatory activity was assessed with assistance from the NORC Energy Balance Core. To quantify the effect of chemogenetic microglial activation on activity, adult hM3D mice underwent implantation of transponders (Starr Life Sciences Corp) in the peritoneal cavity. Briefly, mice were anesthetized using isofluorane and the abdominal region was shaved. After sterilization with 70 % EtOH and betadine solution, a 3/4-inch incision was made in the skin and peritoneal membrane, and the transponder inserted into the peritoneal cavity. The wound was closed with sutures. The animals were treated with Buprenex and allowed 1 week recovery before single housing in a reverse light-cycle room (12:12 hour light/dark cycle starting at 01:00). After 1 week of acclimation to handling and i.p. injections, mice were injected with either saline or CNO (1 mg/kg; i.p.) 2h after dark cycle onset. Transponder signals enabled activity counts to be sensed every minute by a receiver positioned underneath each cage and analyzed using VitalView software (Starr Life Sciences Corp). For graphical presentation, activity traces were smoothed by plotting averages of 10 minutes per data point. Binned activity counts were computed as the mean ± SEM of all values obtained throughout each 30 min period post-injection.
Method details
Plasma analyses
Plasma insulin was measured by ELISA in mice and rats following manufacturer guidelines (Crystal Chem).
Microglial isolation
Microglia were isolated from whole brains of adult control and HM3D mice. Two hours after an i.p. injection of CNO (1 mg/kg), mice were anaesthetized and transcardially perfused with ice cold PBS. The brains were removed and held in ice-cold PBS for the remainder of the sacrifice. Brains were homogenized using Potter-Elvehjem tissue homogenizers (Wheaton) and then samples were centrifuged for 10 min at 4°C at 900 g. The supernatant was removed and the cells were resuspended in 33% Percoll (Cytiva) at room temperature. A PBS layer was carefully added to each tube and then samples were centrifuged for 15 min at room temp at 400 g with minimal acceleration and braking (to avoid disruption of gradient layers). Following spin, supernatant and myelin layer were removed and cell pellets were resuspended and washed in fluorescence activated cell sorting (FACS) buffer (2% fetal bovine serum in PBS) for 5 min. Samples were pelleted, resuspended, and then passed through a 70-100 μM filter. Filters were rinsed with additional FACS buffer and samples were centrifuged for 10 min at 4°C at 400 g. Supernatant was aspirated, pellets were resuspended by vortexing, and simultaneously stained for CD11b and blocked on ice for 20 min (1:1:48, CD11b:FC blocker:FACS buffer; Bio-Rad). Samples were washed 2x more with FACS buffer to remove excess antibody. Samples were held on ice, cells were stained with DAPI (1:50,000; Thermo Fisher), and immediately isolated by FACS for the live (DAPIlo) myeloid (CD11b+) population. Sorted cells were collected in RNA lysis buffer (Qiagen) with 1% β-mercaptoethanol (Sigma) and subsequently processed for qRT-PCR.
hM3D microglial calcium signaling
4-hydroxytamoxifen (4-OHT; Sigma) treated primary microglia from hM3D mice were shaken at 300 rpm for 3 hours (37 °C), plated and left to rest for 5-6 hours in a 96 well plate (2 x 10⁴ cells/well). Cells were washed with warmed 1x PBS and media was replaced overnight with MEM supplemented with 320 μM glucose, 1x GlutaMAX and 1x penicillin-streptomycin (all Thermo Fisher). Cells were loaded in the dark for lh at 37 °C with 30 μM Fura Red, AM (Thermo Fisher) made up in 0.33 % DMSO and 0.065 % Pluronic F-127 (Sigma). Cells were washed with warmed PBS before treatment with CNO. After incubation period, cells were washed with warmed PBS and treated with complete MEM supplemented with 0.1 μM CNO and taken immediately to the plate reader. The plate was incubated at 37 °C for 3.5 hours. Readings were taken every 5 minutes using an excitation of 485 nm and an emission of 675 nm. The average 675 nm reading taken from non-template wells (F0, wells incubated with Fura Red but without cells) was deducted from well readings (Ft) and this value was divided by F0.106 Data smoothed using an average of five readings per 5-minute time point and expressed as a ratio of saline (Ft-F0)/F0 at 0 hours.106 Data was binned over 30 minutes and analyzed for significance compared to saline treated time-matched controls.
Immunohistochemistry
Anesthetized mice were transcardially perfused with ice cold PBS and then 4% paraformaldehyde, followed by dissection of tissues which were then postfixed overnight (4°C). Brain, liver, pancreas, retina, and spleen were immersed in 30% sucrose for 48 hours, embedded in optimal cutting compound (OTC), and immediately frozen on dry ice and stored at −80°C. Floating sections were cut on a cryostat, blocked for 1 hour with 2.5-4% normal donkey serum in PBS containing 0.5% Triton X-100 (Fisher Scientific), and incubated with primary antibodies overnight at 4°C. Primary antibodies used were Iba1 (1:1000 rabbit, FUJIFILM Wako; 1:1000 goat, Novus Biologicals), GFP (1:2000-5000 chicken, enQuire Bioreagents), HA (1:1000 rabbit, Cell Signaling Technology), TNF (1:300 mouse, Abcam), c-Fos (1:4000 rabbit, Abcam; 1:5000 guinea pig, Synaptic Systems), β-endorphin (1:5000 rabbit, Phoenix Pharmaceuticals) and choline acetyltransferase (1:600 goat, Millipore). Sections were then incubated for 1-2h at room temperature with the appropriate secondary antibodies (1:500 dilutions; see key resources table; Invitrogen or Jackson ImmunoResearch Labs). Sections were briefly stained with DAPI (1:10,000; Thermo Fisher) and brushed onto glass slides. Images were captured on a Nikon Eclipse E600 fluorescence microscope, a Keyence BZ-X800 fluorescence microscope, or a Leica TCS SP5 confocal microscope.
The Histology and Imaging Core of the University of Washington Diabetes Research Center (DRC) performed the immunohistochemistry staining for insulin on pancreatic sections. All immunohistochemistry staining was performed on formalin-fixed paraffin embedded mouse pancreas tissues. First, the slides were baked for 30 minutes at 60°C and deparaffinized on the Leica Bond Automated Immunostainer. All subsequent steps were performed at room temperature. Blocking consisted of peroxidase block (Leica) for 5 minutes. Additional blocking occurred with 10% normal goat serum (NGS) in TBS for 20 minutes. The anti-mouse insulin antibody (1:4000 guinea pig, Agilent) was diluted in primary antibody diluent (Leica) and applied for 30 minutes. The secondary antibody (1:1500 unconjugated rabbit anti-guinea pig, Abcam) was diluted in 5% NGS and TBS and incubated for 8 minutes. Next a horse radish peroxidase-conjugated tertiary antibody (goat polyclonal anti-rabbit IgG, Abcam) was applied for 8 minutes. Antibody complexes were visualized using Leica bond polymer refine (DAB, 3,3’-diaminobenzidine) detection 2X for 10 minutes. Tissues were counterstained with hematoxylin for 4 minutes followed by two rinses in water and dehydrated through graded alcohol to xylene. Slides were mounted with a synthetic mounting media and images were acquired with a Zeiss Axio Imager brightfield microscope. Unless otherwise specified all reagents were obtained from Leica Microsystems.
Histological quantification
Iba1+ cells were counted manually from matched sections within prespecified regions of interest using ImageJ software. Microglial cell size was determined using a thresholding protocol (ImageJ) followed by densitometric quantification. TNF immunoreactivity (ir) was measured by converting images to binary and applying a minimum threshold to normalize non-specific staining, followed by analysis of mean pixel intensity in the specified region of interest. For IKKβ-MGKO glucose-responsive neuron quantification, c-Fos-positive cells were counted manually in defined hypothalamic nuclei from anatomically matched sections between −1.22 mm to −2.30 mm from bregma (Paxinos Mouse Brain Atlas). For quantification of glucose-stimulated c-Fos and β-endorphin in hM3D mice, 4-7 sections/mouse were stained and imaged from −1.4 mm to −2.1 mm from bregma, and regions of interest (ROIs) were defined based on DAPI staining for hypothalamic nuclei of interest (ARC, VMH, DMH, and LHA). Binary masks of c-Fos and β-endorphin images were created, thresholded, size filtered for minimum and maximum particle size, and counted using the analyze particles tool in Fiji, ImageJ.107 For the c-Fos analysis in Figure 6F and 6G, cells were counted as particles per μm2 per ROI and sections were scored for GFP fluorescence by a drug and genotype-blinded researcher to determine recombination efficiency with exclusion of hM3D sections with low GFP from the final analysis. For c-Fos and β-endorphin analyses in Figures 6H – 6I and S8G – S8H, double-labeled cells were manually counted in the ARC of matched sections from −1.4 to −2.1 bregma. For hindbrain c-Fos analysis matched medulla sections were picked and ROIs (for DMV, NRS, and AP) were drawn based on a combination of ChAT and DAPI staining. c-Fos positive cells were automatically counted as particles per ROI (Fiji, ImageJ).107 Insulin immunoreactivity in pancreatic islets was measured by dividing the total pixel area positive for insulin by the hematoxylin-positive total tissue area.
Western blotting
Mice were injected i.p. with insulin (5 U/kg body weight; Eli Lilly) or saline and sacrificed by CO2 asphyxiation 15 minutes later. Liver, skeletal muscle (tibialis anterior), and epididymal fat tissues were collected and immediately frozen on dry ice. Phospho-Akt (Ser473) and total Akt were analyzed by standard immunoblotting procedures. Frozen samples were homogenized by probe sonication in ice-cold RIPA buffer containing protease and phosphatase inhibitors (Thermo Fisher). Protein concentration was determined by BCA assay (Thermo Fisher). Samples were loaded (20 μg protein per well) onto SDS-PAGE and electrophoresed for 1 hour at 120 volts. Proteins were transferred onto PVDF membranes for 1 hour at 120V using a BioRAD submerged electrophoresis apparatus. Membranes were blocked for 1 hour in 5% bovine serum albumin (BSA) and tris-buffered saline with 0.1% Tween-20 (TBST), incubated overnight with primary antibodies (rabbit anti-pAkt Ser473; mouse anti-total Akt; beta actin (all Cell Signaling Technology)) at 4°C with gentle rocking, and incubated at room temperature with secondary antibody (goat anti-rabbit conjugated HRP, ThermoFisher) for 2 hours. Membranes were treated with ECL reagent (Thermo Fisher) for 1 min and visualized using the BioRAD ChemDoc digital imaging system.
Real-time quantitative PCR
For RNA extraction, animals were anesthetized using CO2 and rapidly decapitated. Liver tissue was rapidly removed, and hypothalamic blocks were dissected, immediately frozen on dry ice and storage at −80°C until RNA extraction. Total RNA was extracted using Trizol or RNeasy micro kit according to manufacturer’s instructions (Qiagen) and reverse-transcribed with High-Capacity cDNA Reverse Transcription Kit (Applied Biosystems). Transcript levels were measured by semiquantitative real-time PCR on an ABI Prism 7900 HT (Applied Biosystems) machine and SYBR green detection of amplicons. Data was analyzed using the sequence detection system software (SDS version 2.2; Applied Biosystems) and relative mRNA abundance was normalized to 18S. Primers were designed using NCBI Primer3, see Table S1 for sequences.
QUANTIFICATION AND STATISTICAL ANALYSIS
Analyses were performed using GraphPad Prism and JMP Pro 16.0.0 software. Data are presented as mean ± SEM. Sample size is annotated within figure legends. Two-group comparisons used unpaired two-tail Student’s t tests or Welch’s t tests if groups had unequal variance. For minimal model parameters, one-sided Welch’s t tests were used. For within-subjects crossover experiments paired Student’s t tests were used. For comparisons of more than two groups or for GTT/ITT analyses, two-way and three-way ANOVA or linear mixed models were used with repeated measures when appropriate, followed by Bonferroni, Šidák, or Tukey post-hoc testing. Relationships between glucose AUC and fat mass were compared by linear regression. P values < 0.05 were considered significant.
Supplementary Material
HIGHLIGHTS.
Loss of microglial IKKβ in obesity limits weight gain but worsens glucose tolerance
Stimulating microglial inflammatory signaling improves glucose tolerance
TNF and melanocortin signaling are required for improved glucose tolerance
Microglial activation induces parasympathetic enhancement of insulin secretion
ACKNOWLEDGMENTS
This work was supported by the American Diabetes Association (Pathway Award 1-14-ACE-51 to JPT), the NIDDK (K08 DK088872 and R01 DK119754 to JPT; R01 DK103175 to SKK; T32 DK007247 to JDD, KMN, and AWJ; and F32 DK108473 to JDD), American Heart Association fellowships to KMN and AN, and a UCSF Diabetes Family Fund Award to MV. Services and support were provided by the Nutrition Obesity Research Center (DK035816) and Diabetes Research Center (DK017047) at the University of Washington. Minimal modeling code and technical support for fsIVGTT analysis was provided by Darko Stefanovski.
Footnotes
Publisher's Disclaimer: This is a PDF file of an unedited manuscript that has been accepted for publication. As a service to our customers we are providing this early version of the manuscript. The manuscript will undergo copyediting, typesetting, and review of the resulting proof before it is published in its final form. Please note that during the production process errors may be discovered which could affect the content, and all legal disclaimers that apply to the journal pertain.
DECLARATION OF INTERESTS
The authors have no competing interests.
REFERENCES
- 1.Ávalos Y, Kerr B, Maliqueo M, and Dorfman M (2018). Cell and molecular mechanisms behind diet-induced hypothalamic inflammation and obesity. Journal of neuroendocrinology 30, e12598. 10.1111/jne.12598. [DOI] [PubMed] [Google Scholar]
- 2.Berkseth KE, Guyenet SJ, Melhorn SJ, Lee D, Thaler JP, Schur EA, and Schwartz MW (2014). Hypothalamic gliosis associated with high-fat diet feeding is reversible in mice: a combined immunohistochemical and magnetic resonance imaging study. Endocrinology 155, 2858–2867. 10.1210/en.2014-1121. [DOI] [PMC free article] [PubMed] [Google Scholar]
- 3.Douglass JD, Dorfman MD, and Thaler JP (2017). Glia: silent partners in energy homeostasis and obesity pathogenesis. Diabetologia 60, 226–236. 10.1007/s00125-016-4181-3. [DOI] [PMC free article] [PubMed] [Google Scholar]
- 4.Schur EA, Melhorn SJ, Oh S-K, Lacy JM, Berkseth KE, Guyenet SJ, Sonnen JA, Tyagi V, Rosalynn M, Leon B, et al. (2015). Radiologic evidence that hypothalamic gliosis is associated with obesity and insulin resistance in humans. Obesity 23, 2142–2148. 10.1002/oby.21248. [DOI] [PMC free article] [PubMed] [Google Scholar]
- 5.Thaler JP, Yi C-X, Schur EA, Guyenet SJ, Hwang BH, Dietrich MO, Zhao X, Sarruf DA, Izgur V, Maravilla KR, et al. (2012). Obesity is associated with hypothalamic injury in rodents and humans. The Journal of clinical investigation 122, 153–162. 10.1172/JCI59660. [DOI] [PMC free article] [PubMed] [Google Scholar]
- 6.Valdearcos M, Xu AW, and Koliwad SK (2015). Hypothalamic inflammation in the control of metabolic function. Annual review of physiology 77, 131–160. 10.1146/annurev-physiol-021014-071656. [DOI] [PubMed] [Google Scholar]
- 7.Valdearcos M, Myers MG, and Koliwad SK (2019). Hypothalamic microglia as potential regulators of metabolic physiology. Nature metabolism 1, 314–320. 10.1038/s42255-019-0040-0. [DOI] [PubMed] [Google Scholar]
- 8.Gao Y, Ottaway N, Schriever SC, Legutko B, García-Cáceres C, la Fuente E, Mergen C, Bour S, Thaler JP, Seeley RJ, et al. (2014). Hormones and diet, but not body weight, control hypothalamic microglial activity. Glia 62, 17–25. 10.1002/glia.22580. [DOI] [PMC free article] [PubMed] [Google Scholar]
- 9.Valdearcos M, Robblee MM, Benjamin DI, Nomura DK, Xu AW, and Koliwad SK (2014). Microglia dictate the impact of saturated fat consumption on hypothalamic inflammation and neuronal function. Cell Rep 9, 2124–2138. 10.1016/j.celrep.2014.11.018. [DOI] [PMC free article] [PubMed] [Google Scholar]
- 10.Valdearcos M, Douglass JD, Robblee MM, Dorfman MD, Stifler DR, Bennett ML, Gerritse I, Fasnacht R, Barres BA, Thaler JP, et al. (2017). Microglial Inflammatory Signaling Orchestrates the Hypothalamic Immune Response to Dietary Excess and Mediates Obesity Susceptibility. Cell Metabolism 26. 10.1016/j.cmet.2017.05.015. [DOI] [PMC free article] [PubMed] [Google Scholar]
- 11.Kim JD, Yoon NA, Jin S, and Diano S (2019). Microglial UCP2 Mediates Inflammation and Obesity Induced by High-Fat Feeding. Cell Metabolism 30, 952–962.e5. 10.1016/j.cmet.2019.08.010. [DOI] [PMC free article] [PubMed] [Google Scholar]
- 12.Gao Y, Vidal-Itriago A, Kalsbeek MJ, Layritz C, García-Cáceres C, Tom RZ, Eichmann TO, Vaz FM, Houtkooper RH, Wei N, et al. (2017). Lipoprotein Lipase Maintains Microglial Innate Immunity in Obesity. Cell reports 20, 3034–3042. 10.1016/j.celrep.2017.09.008. [DOI] [PubMed] [Google Scholar]
- 13.Wang X-L, Wolff SEC, Korpel N, Milanova I, Sandu C, Rensen PCN, Kooijman S, Cassel J-C, Kalsbeek A, Boutillier A-L, et al. (2020). Deficiency of the Circadian Clock Gene Bmal1 Reduces Microglial Immunometabolism. Frontiers in immunology 11, 586399. 10.3389/fimmu.2020.586399. [DOI] [PMC free article] [PubMed] [Google Scholar]
- 14.Dorfman MD, Krull JE, Douglass JD, Fasnacht R, Lara-Lince F, Meek TH, Shi X, Damian V, Nguyen HT, Matsen ME, et al. (2017). Sex differences in microglial CX3CR1 signalling determine obesity susceptibility in mice. Nature communications 8, 14556. 10.1038/ncomms14556. [DOI] [PMC free article] [PubMed] [Google Scholar]
- 15.Niraula A, Fasnacht RD, Ness KM, Frey JM, Cuschieri SA, Dorfman MD, and Thaler JP (2023). Prostaglandin PGE2 Receptor EP4 Regulates Microglial Phagocytosis and Increases Susceptibility to Diet-Induced Obesity. Diabetes 72, 233–244. 10.2337/db21-1072. [DOI] [PMC free article] [PubMed] [Google Scholar]
- 16.Salter MW, and Stevens B (2017). Microglia emerge as central players in brain disease. Nature medicine 23, 1018–1027. 10.1038/nm.4397. [DOI] [PubMed] [Google Scholar]
- 17.Colonna M, and Butovsky O (2017). Microglia Function in the Central Nervous System During Health and Neurodegeneration. Annual Review of Immunology 35, 441–468. 10.1146/annurev-immunol-051116-052358. [DOI] [PMC free article] [PubMed] [Google Scholar]
- 18.Prinz M, Jung S, and Priller J (2019). Microglia Biology: One Century of Evolving Concepts. Cell 179, 292–311. 10.1016/J.CELL.2019.08.053. [DOI] [PubMed] [Google Scholar]
- 19.Prinz M, Masuda T, Wheeler MA, and Quintana FJ (2021). Microglia and Central Nervous System–Associated Macrophages—From Origin to Disease Modulation. Annual Review of Immunology 39, 251–277. 10.1146/annurev-immunol-093019-110159. [DOI] [PMC free article] [PubMed] [Google Scholar]
- 20.Paolicelli RC, Sierra A, Stevens B, Tremblay M-E, Aguzzi A, Ajami B, Amit I, Audinat E, Bechmann I, Bennett M, et al. (2022). Microglia states and nomenclature: A field at its crossroads. Neuron 110, 3458–3483. 10.1016/j.neuron.2022.10.020. [DOI] [PMC free article] [PubMed] [Google Scholar]
- 21.Myers MG, Affinati AH, Richardson N, and Schwartz MW (2021). Central nervous system regulation of organismal energy and glucose homeostasis. Nature Metabolism 3, 737–750. 10.1038/s42255-021-00408-5. [DOI] [PubMed] [Google Scholar]
- 22.Wiedemann SJ, Trimigliozzi K, Dror E, Meier DT, Molina-Tijeras JA, Rachid L, Le Foll C, Magnan C, Schulze F, Stawiski M, et al. (2022). The cephalic phase of insulin release is modulated by IL-1β. Cell Metabolism 34, 991–1003.e6. 10.1016/j.cmet.2022.06.001. [DOI] [PubMed] [Google Scholar]
- 23.Mirzadeh Z, Faber CL, and Schwartz MW (2022). Central Nervous System Control of Glucose Homeostasis: A Therapeutic Target for Type 2 Diabetes? Annu. Rev. Pharmacol. Toxicol 62, 55–84. 10.1146/annurev-pharmtox-052220-010446. [DOI] [PMC free article] [PubMed] [Google Scholar]
- 24.Faber CL, Deem JD, Campos CA, Taborsky GJ, and Morton GJ (2020). CNS control of the endocrine pancreas. Diabetologia 63, 2086–2094. 10.1007/s00125-020-05204-6. [DOI] [PMC free article] [PubMed] [Google Scholar]
- 25.Wang M, Pan W, Xu Y, Zhang, Wan, and Jiang H (2022). Microglia-Mediated Neuroinflammation: A Potential Target for the Treatment of Cardiovascular Diseases. JIR Volume 15, 3083–3094. 10.2147/JIR.S350109. [DOI] [PMC free article] [PubMed] [Google Scholar]
- 26.Dumas AA, Borst K, and Prinz M (2021). Current tools to interrogate microglial biology. Neuron 109, 2805–2819. 10.1016/j.neuron.2021.07.004. [DOI] [PubMed] [Google Scholar]
- 27.Goldmann T, Wieghofer P, Müller PF, Wolf Y, Varol D, Yona S, Brendecke SM, Kierdorf K, Staszewski O, Datta M, et al. (2013). A new type of microglia gene targeting shows TAK1 to be pivotal in CNS autoimmune inflammation. Nature neuroscience 16, 1618–1626. 10.1038/nn.3531. [DOI] [PubMed] [Google Scholar]
- 28.Parkhurst CN, Yang G, Ninan I, Savas JN, Yates JR 3rd, Lafaille JJ, Hempstead BL, Littman DR, and Gan W-B (2013). Microglia promote learning-dependent synapse formation through brain-derived neurotrophic factor. Cell 155, 1596–1609. 10.1016/j.cell.2013.11.030. [DOI] [PMC free article] [PubMed] [Google Scholar]
- 29.Yona S, Kim KW, Wolf Y, Mildner A, Varol D, Breker M, Strauss-Ayali D, Viukov S, Guilliams M, Misharin A, et al. (2013). Fate Mapping Reveals Origins and Dynamics of Monocytes and Tissue Macrophages under Homeostasis. Immunity 38, 79–91. 10.1016/j.immuni.2012.12.001. [DOI] [PMC free article] [PubMed] [Google Scholar]
- 30.Douglass JD, Dorfman MD, Fasnacht R, Shaffer LD, and Thaler JP (2017). Astrocyte IKKβ/NF-κB signaling is required for diet-induced obesity and hypothalamic inflammation. Molecular Metabolism 6, 366–373. 10.1016/j.molmet.2017.01.010. [DOI] [PMC free article] [PubMed] [Google Scholar]
- 31.Kleinridders A, Schenten D, Konner AC, Belgardt BF, Mauer J, Okamura T, Wunderlich FT, Medzhitov R, Bruning JC, Könner AC, et al. (2009). MyD88 signaling in the CNS is required for development of fatty acid-induced leptin resistance and diet-induced obesity. Cell metabolism 10, 249–259. 10.1016/j.cmet.2009.08.013. [DOI] [PMC free article] [PubMed] [Google Scholar]
- 32.Zhang X, Zhang G, Zhang H, Karin M, Bai H, and Cai D (2008). Hypothalamic IKKβ/NF-κB and ER Stress Link Overnutrition to Energy Imbalance and Obesity. Cell 135, 61–73. 10.1016/j.cell.2008.07.043. [DOI] [PMC free article] [PubMed] [Google Scholar]
- 33.Zhang Y, Reichel JM, Han C, Zuniga-Hertz JP, and Cai D (2017). Astrocytic Process Plasticity and IKKβ/NF-κB in Central Control of Blood Glucose, Blood Pressure, and Body Weight. Cell metabolism 25, 1091–1102.e4. 10.1016/j.cmet.2017.04.002. [DOI] [PMC free article] [PubMed] [Google Scholar]
- 34.Ferre T, Riu E, Franckhauser S, Agudo J, and Bosch F (2003). Long-term overexpression of glucokinase in the liver of transgenic mice leads to insulin resistance. Diabetologia 46, 1662–1668. 10.1007/s00125-003-1244-z. [DOI] [PubMed] [Google Scholar]
- 35.Torres TP, Catlin RL, Chan R, Fujimoto Y, Sasaki N, Printz RL, Newgard CB, and Shiota M (2009). Restoration of Hepatic Glucokinase Expression Corrects Hepatic Glucose Flux and Normalizes Plasma Glucose in Zucker Diabetic Fatty Rats. Diabetes 58, 78–86. 10.2337/db08-1119. [DOI] [PMC free article] [PubMed] [Google Scholar]
- 36.Ruud J, Steculorum SM, and Brüning JC (2017). Neuronal control of peripheral insulin sensitivity and glucose metabolism. Nature Communications 8, 15259. 10.1038/ncommsl5259. [DOI] [PMC free article] [PubMed] [Google Scholar]
- 37.Steinbusch L, Labouèbe G, and Thorens B (2015). Brain glucose sensing in homeostatic and hedonic regulation. Trends in Endocrinology & Metabolism 26, 455–466. 10.1016/j.tem.2015.06.005. [DOI] [PubMed] [Google Scholar]
- 38.Dunn-Meynell AA, Routh VH, Kang L, Gaspers L, and Levin BE (2002). Glucokinase is the likely mediator of glucosensing in both glucose-excited and glucose-inhibited central neurons. Diabetes 51, 2056–2065. 10.2337/DIABETES.51.7.2056. [DOI] [PubMed] [Google Scholar]
- 39.Roncero I, Alvarez E, Chowen JA, Sanz C, Rábano A, Vázquez P, and Blázquez E (2004). Expression of glucose transporter isoform GLUT-2 and glucokinase genes in human brain. J. Neurochem 88, 1203–1210. 10.1046/j.l471-4159.2003.02269.x. [DOI] [PubMed] [Google Scholar]
- 40.Stanley S, Domingos AI, Kelly L, Garfield A, Damanpour S, Heisler L, and Friedman J (2013). Profiling of Glucose-Sensing Neurons Reveals that GHRH Neurons Are Activated by Hypoglycemia. Cell Metabolism 18, 596–607. 10.1016/J.CMET.2013.09.002. [DOI] [PubMed] [Google Scholar]
- 41.Toda C, Kim JD, Impellizzeri D, Cuzzocrea S, Liu Z-W, and Diano S (2016). UCP2 Regulates Mitochondrial Fission and Ventromedial Nucleus Control of Glucose Responsiveness. Cell 164, 872–883. 10.1016/J.CELL.2016.02.010. [DOI] [PMC free article] [PubMed] [Google Scholar]
- 42.Tavares RM, Turer EE, Liu CL, Advincula R, Scapini P, Rhee L, Barrera J, Lowell CA, Utz PJ, Malynn BA, et al. (2010). The ubiquitin modifying enzyme A20 restricts B cell survival and prevents autoimmunity. Immunity 33, 181–191. 10.1016/j.immuni.2010.07.017. [DOI] [PMC free article] [PubMed] [Google Scholar]
- 43.Banerjee J, Dorfman MD, Fasnacht R, Douglass JD, Wyse-Jackson AC, Barria A, and Thaler JP (2021). CX3CL1 action on microglia protects from diet-induced obesity by restoring POMC neuronal excitability and melanocortin system activity impaired by high-fat diet feeding. bioRxiv, 2021.11.08.467521. 10.1101/2021.11.08.467521. [DOI] [PMC free article] [PubMed] [Google Scholar]
- 44.Garrido-Mesa N, Zarzuelo A, and Gálvez J (2013). Minocycline: Far beyond an antibiotic. 10.1111/bph.l2139. [DOI] [Google Scholar]
- 45.Yrjänheikki J, Keiäanen R, Pellikka M, Hökfelt T, and Koistinaho J (1998). Tetracyclines inhibit microglial activation and are neuroprotective in global brain ischemia. Proceedings of the National Academy of Sciences of the United States of America. 10.1073/pnas.95.26.15769. [DOI] [PMC free article] [PubMed] [Google Scholar]
- 46.Roth BL (2016). DREADDs for Neuroscientists. Neuron 89, 683–694. 10.1016/j.neuron.2016.01.040. [DOI] [PMC free article] [PubMed] [Google Scholar]
- 47.Bossuyt J, Van Den Herrewegen Y, Nestor L, Buckinx A, De Bundel D, and Smolders I (2023). Chemogenetic modulation of astrocytes and microglia: State-of-the-art and implications in neuroscience. Glia, glia.24390. 10.1002/glia.24390. [DOI] [PubMed] [Google Scholar]
- 48.Binning W, Hogan-Cann AE, Yae Sakae D, Maksoud M, Ostapchenko V, Al-Onaizi M, Matovic S, Lu WY, Prado MAM, Inoue W, et al. (2020). Chronic hM3Dq signaling in microglia ameliorates neuroinflammation in male mice. Brain, Behavior, and Immunity 88, 791–801. 10.1016/j.bbi.2020.05.041. [DOI] [PubMed] [Google Scholar]
- 49.Grace PM, Wang X, Strand KA, Baratta M, Zhang Y, Galer EL, Yin H, Maier SF, and Watkins LR (2018). DREADDed microglia in pain: Implications for spinal inflammatory signaling in male rats. Experimental Neurology 304, 125–131. 10.1016/j.expneurol.2018.03.005. [DOI] [PMC free article] [PubMed] [Google Scholar]
- 50.Saika F, Matsuzaki S, Kobayashi D, Ideguchi Y, Nakamura TY, Kishioka S, and Kiguchi N (2020). Chemogenetic Regulation of CX3CR1-Expressing Microglia Using Gi-DREADD Exerts Sex-Dependent Anti-Allodynic Effects in Mouse Models of Neuropathic Pain. Frontiers in Pharmacology 11. 10.3389/fphar.2020.00925. [DOI] [PMC free article] [PubMed] [Google Scholar]
- 51.Saika F, Matsuzaki S, Kishioka S, and Kiguchi N (2021). Chemogenetic activation of cx3cr1-expressing spinal microglia using gq-dreadd elicits mechanical allodynia in male mice. Cells 10. 10.3390/cellsl0040874. [DOI] [PMC free article] [PubMed] [Google Scholar]
- 52.Yi MH, Liu YU, Liu K, Chen T, Bosco DB, Zheng J, Xie M, Zhou L, Qu W, and Wu LJ (2021). Chemogenetic manipulation of microglia inhibits neuroinflammation and neuropathic pain in mice. Brain, Behavior, and Immunity 92, 78–89. 10.1016/j.bbi.2020.11.030. [DOI] [PMC free article] [PubMed] [Google Scholar]
- 53.Masuda T, Amann L, Sankowski R, Staszewski O, Lenz M, d’Errico P, Snaidero N, Costa Jordão MJ, Böttcher C, Kierdorf K, et al. (2020). Novel Hexb-based tools for studying microglia in the CNS. Nat Immunol 21, 802–815. 10.1038/s41590-020-0707-4. [DOI] [PubMed] [Google Scholar]
- 54.Goldmann T, Wieghofer P, Jordão MJC, Prutek F, Hagemeyer N, Frenzel K, Amann L, Staszewski O, Kierdorf K, Krueger M, et al. (2016). Origin, fate and dynamics of macrophages at central nervous system interfaces. Nat Immunol 17, 797–805. 10.1038/ni.3423. [DOI] [PMC free article] [PubMed] [Google Scholar]
- 55.Faust TE, Feinberg PA, O’Connor C, Kawaguchi R, Chan A, Strasburger H, Masuda T, Amann L, Knobeloch K-P, Prinz M, et al. (2023). A comparative analysis of microglial inducible Cre lines (Neuroscience) 10.1101/2023.01.09.523268. [DOI] [PMC free article] [PubMed] [Google Scholar]
- 56.McKinsey GL, Lizama CO, Keown-Lang AE, Niu A, Santander N, Larpthaveesarp A, Chee E, Gonzalez FF, and Arnold TD (2020). A new genetic strategy for targeting microglia in development and disease. eLife 9, e54590. 10.7554/eLife.54590. [DOI] [PMC free article] [PubMed] [Google Scholar]
- 57.Patel AA, Ginhoux F, and Yona S (2021). Monocytes, macrophages, dendritic cells and neutrophils: an update on lifespan kinetics in health and disease. Immunology 163, 250–261. 10.1111/imm.13320. [DOI] [PMC free article] [PubMed] [Google Scholar]
- 58.Bedolla A, Mckinsey G, Ware K, Santander N, Arnold T, and Luo Y (2023). Finding the right tool: a comprehensive evaluation of microglial inducible cre mouse models (Neuroscience) 10.1101/2023.04.17.536878. [DOI] [Google Scholar]
- 59.Kaiser T, and Feng G (2019). Tmem119-EGFP and Tmem119-CreERT2 Transgenic Mice for Labeling and Manipulating Microglia. eNeuro 6, ENEURO.0448-18.2019. 10.1523/ENEUR0.0448-18.2019. [DOI] [PMC free article] [PubMed] [Google Scholar]
- 60.Chou S-Y, Ajoy R, Changou CA, Hsieh Y-T, Wang Y-K, and Hoffer B (2016). CCL5/RANTES contributes to hypothalamic insulin signaling for systemic insulin responsiveness through CCR5. Scientific Reports 6, 37659. 10.1038/srep37659. [DOI] [PMC free article] [PubMed] [Google Scholar]
- 61.Rey A, Roggero E, Randolf A, Mahuad C, McCann S, Rettori V, and Besedovsky HO (2006). IL-1 resets glucose homeostasis at central levels. Proceedings of the National Academy of Sciences 103, 16039–16044. 10.1073/pnas.0607076103. [DOI] [PMC free article] [PubMed] [Google Scholar]
- 62.Rey A, Verdenhalven M, Lörwald AC, Meyer C, Hernangómez M, Randolf A, Roggero E, König AM, Heverhagen JT, Guaza C, et al. (2016). Brain-borne IL-1 adjusts glucoregulation and provides fuel support to astrocytes and neurons in an autocrine/paracrine manner. Molecular Psychiatry 21, 1309–1320. 10.1038/mp.2015.174. [DOI] [PubMed] [Google Scholar]
- 63.Timper K, Denson JL, Steculorum SM, Heilinger C, Engström-Ruud L, Wunderlich CM, Rose-John S, Wunderlich FT, and Brüning JC (2017). IL-6 Improves Energy and Glucose Homeostasis in Obesity via Enhanced Central IL-6 trans-Signaling. Cell Reports 19, 267–280. 10.1016/j.celrep.2017.03.043. [DOI] [PubMed] [Google Scholar]
- 64.Üner AG, Keçik O, Quaresma PGF, De Araujo TM, Lee H, Li W, Kim HJ, Chung M, Bjørbæk C, and Kim Y-B (2019). Role of POMC and AgRP neuronal activities on glycaemia in mice. Sci Rep 9, 13068. 10.1038/s41598-019-49295-7. [DOI] [PMC free article] [PubMed] [Google Scholar]
- 65.Choi JH, and Kim M-S (2022). Homeostatic Regulation of Glucose Metabolism by the Central Nervous System. Endocrinol Metab 37, 9–25. 10.3803/EnM.2021.1364. [DOI] [PMC free article] [PubMed] [Google Scholar]
- 66.Saltiel AR, and Olefsky JM (2017). Inflammatory mechanisms linking obesity and metabolic disease. 10.1172/JCI92035. [DOI] [PMC free article] [PubMed] [Google Scholar]
- 67.Arkan MC, Hevener AL, Greten FR, Maeda S, Li Z-W, Long JM, Wynshaw-Boris A, Poli G, Olefsky J, and Karin M (2005). IKK-beta links inflammation to obesity-induced insulin resistance. Nature medicine 11, 191–198. 10.1038/nmll85. [DOI] [PubMed] [Google Scholar]
- 68.Cai D, Yuan M, Frantz DF, Melendez PA, Hansen L, Lee J, and Shoelson SE (2005). Local and systemic insulin resistance resulting from hepatic activation of IKK-beta and NF-kappaB. Nat Med 11, 183–190. 10.1038/nmll66. [DOI] [PMC free article] [PubMed] [Google Scholar]
- 69.Jiao P, Feng B, Ma J, Nie Y, Paul E, Li Y, and Xu H (2012). Constitutive Activation of IKKβ in Adipose Tissue Prevents Diet-Induced Obesity in Mice. Endocrinology 153, 154–165. 10.1210/en.2011-1346. [DOI] [PubMed] [Google Scholar]
- 70.Park S-H, Liu Z, Sui Y, Helsley RN, Zhu B, Powell DK, Kern PA, and Zhou C (2016). IKKβ Is Essential for Adipocyte Survival and Adaptive Adipose Remodeling in Obesity. Diabetes 65, 1616–1629. 10.2337/dbl5-1156. [DOI] [PMC free article] [PubMed] [Google Scholar]
- 71.Wernstedt Asterholm I, Tao C, Morley TS, Wang QA, Delgado-Lopez F, Wang Z, and Scherer PE (2014). Adipocyte inflammation is essential for healthy adipose tissue expansion and remodeling. Cell metabolism 20, 103–118. 10.1016/j.cmet.2014.05.005. [DOI] [PMC free article] [PubMed] [Google Scholar]
- 72.Liu J, Ibi D, Taniguchi K, Lee J, Herrema H, Akosman B, Mucka P, Salazar Hernandez MA, Uyar MF, Park SW, et al. (2016). Inflammation Improves Glucose Homeostasis through IKKB-XBP1s Interaction. Cell 167, 1052–1066.e18. 10.1016/j.cell.2016.10.015. [DOI] [PMC free article] [PubMed] [Google Scholar]
- 73.Berkseth KE, Rubinow KB, Melhorn SJ, Webb MF, Rosalynn B, De Leon M, Marck BT, Matsumoto AM, Amory JK, Page ST, and Schur EA (2018). Hypothalamic Gliosis by MRI and Visceral Fat Mass Negatively Correlate with Plasma Testosterone Concentrations in Healthy Men. Obesity 26, 1898–1904. 10.1002/oby.22324. [DOI] [PMC free article] [PubMed] [Google Scholar]
- 74.García-Cáceres C, Lechuga-Sancho A, Argente J, Frago LM, and Chowen JA (2008). Death of hypothalamic astrocytes in poorly controlled diabetic rats is associated with nuclear translocation of apoptosis inducing factor. Journal of neuroendocrinology 20, 1348–1360. 10.1111/j.1365-2826.2008.01795.x. [DOI] [PubMed] [Google Scholar]
- 75.Nagayach A, Patro N, and Patro I (2014). Experimentally induced diabetes causes glial activation, glutamate toxicity and cellular damage leading to changes in motor function. Frontiers in cellular neuroscience 8, 355. 10.3389/fncel.2014.00355. [DOI] [PMC free article] [PubMed] [Google Scholar]
- 76.Winkler Z, Kuti D, Polyák Á, Juhász B, Gulyás K, Lénart N, Dénes Á, Ferenczi S, and Kovács KJ (2019). Hypoglycemia-activated Hypothalamic Microglia Impairs Glucose Counterregulatory Responses. Scientific reports 9, 6224. 10.1038/s41598-019-42728-3. [DOI] [PMC free article] [PubMed] [Google Scholar]
- 77.Bernier L-P, York EM, Kamyabi A, Choi HB, Weilinger NL, and MacVicar BA (2020). Microglial metabolic flexibility supports immune surveillance of the brain parenchyma. Nature Communications 11, 1559. 10.1038/s41467-020-15267-z. [DOI] [PMC free article] [PubMed] [Google Scholar]
- 78.Wang L, Zhu L, Meister J, Bone DBJ, Pydi SP, Rossi M, and Wess J (2021). Use of DREADD Technology to Identify Novel Targets for Antidiabetic Drugs. Annual Review of Pharmacology and Toxicology 61, 421–440. 10.1146/annurev-pharmtox-030220-121042. [DOI] [PubMed] [Google Scholar]
- 79.Hotamisligil GS, Shargill NS, and Spiegelman BM (1993). Adipose expression of tumor necrosis factor-alpha: direct role in obesity-linked insulin resistance. Science 259, 87–91. [DOI] [PubMed] [Google Scholar]
- 80.Hotamisligil GS, Arner P, Caro JF, Atkinson RL, and Spiegelman BM (1995). Increased adipose tissue expression of tumor necrosis factor-alpha in human obesity and insulin resistance. J Clin Invest 95, 2409–2415. 10.1172/JCI117936. [DOI] [PMC free article] [PubMed] [Google Scholar]
- 81.Dominguez H, Storgaard H, Rask-Madsen C, Steffen Hermann T, Ihlemann N, Baunbjerg Nielsen D, Spohr C, Kober L, Vaag A, and Torp-Pedersen C (2005). Metabolic and Vascular Effects of Tumor Necrosis Factor-α Blockade with Etanercept in Obese Patients with Type 2 Diabetes. Journal of Vascular Research 42, 517–525. 10.1159/000088261. [DOI] [PubMed] [Google Scholar]
- 82.Paquot N, Castillo MJ, Lefèbvre PJ, and Scheen AJ (2000). No Increased Insulin Sensitivity after a Single Intravenous Administration of a Recombinant Human Tumor Necrosis Factor Receptor: Fc Fusion Protein in Obese Insulin-Resistant Patients1. The Journal of Clinical Endocrinology & Metabolism 85, 1316–1319. 10.1210/jcem.85.3.6417. [DOI] [PubMed] [Google Scholar]
- 83.Yi C-X, Walter M, Gao Y, Pitra S, Legutko B, KÄlin S, Layritz C, García-Cáceres C, Bielohuby M, Bidlingmaier M, et al. (2017). TNFα drives mitochondrial stress in POMC neurons in obesity. Nature communications 8, 15143. 10.1038/ncommsl5143. [DOI] [PMC free article] [PubMed] [Google Scholar]
- 84.Hill JW, Elias CF, Fukuda M, Williams KW, Berglund ED, Holland WL, Cho Y-R, Chuang J-C, Xu Y, Choi M, et al. (2010). Direct insulin and leptin action on pro-opiomelanocortin neurons is required for normal glucose homeostasis and fertility. Cell metabolism 11, 286–297. 10.1016/j.cmet.2010.03.002. [DOI] [PMC free article] [PubMed] [Google Scholar]
- 85.Parton LE, Ye CP, Coppari R, Enriori PJ, Choi B, Zhang C-Y, Xu C, Vianna CR, Balthasar N, Lee CE, et al. (2007). Glucose sensing by POMC neurons regulates glucose homeostasis and is impaired in obesity. Nature 449, 228–232. 10.1038/nature06098. [DOI] [PubMed] [Google Scholar]
- 86.Ramírez S, Gómez-Valadés AG, Schneeberger M, Varela L, Haddad-Tóvolli R, Altirriba J, Noguera E, Drougard A, Flores-Marténez Á, Imbernón M, et al. (2017). Mitochondrial Dynamics Mediated by Mitofusin 1 Is Required for POMC Neuron Glucose-Sensing and Insulin Release Control. Cell Metabolism 25, 1390–1399.e6. 10.1016/j.cmet.2017.05.010. [DOI] [PubMed] [Google Scholar]
- 87.Jais A, and Brüning JC (2022). Arcuate Nucleus-Dependent Regulation of Metabolism—Pathways to Obesity and Diabetes Mellitus. Endocrine Reviews 43, 314–328. 10.1210/endrev/bnab025. [DOI] [PMC free article] [PubMed] [Google Scholar]
- 88.Elizondo-Vega R, Cortes-Campos C, Barahona MJ, Oyarce KA, Carril CA, García-Robles MA, and Garcia-Robles MA (2015). The role of tanycytes in hypothalamic glucosensing. Journal of Cellular and Molecular Medicine 19, 1471–1482. 10.1111/jcmm.12590. [DOI] [PMC free article] [PubMed] [Google Scholar]
- 89.Garcia-Caceres C, Quarta C, Varela L, Gao Y, Gruber T, Legutko B, Jastroch M, Johansson P, Ninkovic J, Yi C-XX, et al. (2016). Astrocytic Insulin Signaling Couples Brain Glucose Uptake with Nutrient Availability. Cell 166, 867–880. 10.1016/j.cell.2016.07.028. [DOI] [PMC free article] [PubMed] [Google Scholar]
- 90.Fernandez AM, Martinez-Rachadell L, Navarrete M, Pose-Utrilla J, Davila JC, Pignatelli J, Diaz-Pacheco S, Guerra-Cantera S, Viedma-Moreno E, Palenzuela R, et al. (2022). Insulin regulates neurovascular coupling through astrocytes. Proc. Natl. Acad. Sci. U.S.A 119, e2204527119. 10.1073/pnas.2204527119. [DOI] [PMC free article] [PubMed] [Google Scholar]
- 91.Liddelow SA, Guttenplan KA, Clarke LE, Bennett FC, Bohlen CJ, Schirmer L, Bennett ML, Münch AE, Chung W-S, Peterson TC, et al. (2017). Neurotoxic reactive astrocytes are induced by activated microglia. Nature. 10.1038/nature21029. [DOI] [PMC free article] [PubMed] [Google Scholar]
- 92.Rothhammer V, Borucki DM, Tjon EC, Takenaka MC, Chao CC, Ardura-Fabregat A, Lima KA, Gutiérrez-Vázquez C, Hewson P, Staszewski O, et al. (2018). Microglial control of astrocytes in response to microbial metabolites. Nature 557, 724–728. 10.1038/s41586-018-0119-x. [DOI] [PMC free article] [PubMed] [Google Scholar]
- 93.Horst KW, Lammers NM, Trinko R, Opland DM, Figee M, Ackermans MT, Booij J, Munckhof P, Schuurman PR, Fliers E, et al. (2018). Striatal dopamine regulates systemic glucose metabolism in humans and mice. Science Translational Medicine 10, eaar3752. 10.1126/scitranslmed.aar3752. [DOI] [PubMed] [Google Scholar]
- 94.Jansen AS, Hoffman JL, and Loewy AD (1997). CNS sites involved in sympathetic and parasympathetic control of the pancreas: a viral tracing study. Brain research 766, 29–38. [DOI] [PubMed] [Google Scholar]
- 95.Maes ME, Colombo G, Schulz R, and Siegert S (2019). Targeting microglia with lentivirus and AAV: Recent advances and remaining challenges. Neuroscience letters 707, 134310. 10.1016/j.neulet.2019.134310. [DOI] [PMC free article] [PubMed] [Google Scholar]
- 96.Pozo M, and Claret M (2018). Hypothalamic Control of Systemic Glucose Homeostasis: The Pancreas Connection. Trends in Endocrinology & Metabolism 29, 581–594. 10.1016/J.TEM.2018.05.001. [DOI] [PubMed] [Google Scholar]
- 97.Ma Y, Ratnasabapathy R, Izzi-Engbeaya C, Nguyen-Tu M-S, Richardson E, Hussain S, De Backer I, Holton C, Norton M, Carrat G, et al. (2018). Hypothalamic arcuate nucleus glucokinase regulates insulin secretion and glucose homeostasis. Diabetes Obes Metab 20, 2246–2254. 10.1111/dom.l3359. [DOI] [PMC free article] [PubMed] [Google Scholar]
- 98.Tschöp MH, Speakman JR, Arch JRS, Auwerx J, Brüning JC, Chan L, Eckel RH, Farese RV, Galgani JE, Hambly C, et al. (2012). A guide to analysis of mouse energy metabolism. Nat Methods 9, 57–63. 10.1038/nmeth.l806. [DOI] [PMC free article] [PubMed] [Google Scholar]
- 99.Ewbank SN, Campos CA, Chen JY, Bowen AJ, Padilla SL, Dempsey JL, Cui JY, and Palmiter RD (2020). Chronic Gq signaling in AgRP neurons does not cause obesity. Proc. Natl. Acad. Sci. U.S.A 117, 20874–20880. 10.1073/pnas.2004941117. [DOI] [PMC free article] [PubMed] [Google Scholar]
- 100.Thaler JP, Choi SJ, Sajan MP, Ogimoto K, Nguyen HT, Matsen M, Benoit SC, Wisse BE, Farese RV, and Schwartz MW (2009). Atypical Protein Kinase C Activity in the Hypothalamus Is Required for Lipopolysaccharide-Mediated Sickness Responses. Endocrinology 150, 5362–5372. 10.1210/en.2009-0509. [DOI] [PMC free article] [PubMed] [Google Scholar]
- 101.Nilsberth C, Elander L, Hamzic N, Norell M, Lönn J, Engström L, and Blomqvist A (2009). The Role of Interleukin-6 in Lipopolysaccharide-Induced Fever by Mechanisms Independent of Prostaglandin E2. Endocrinology 150, 1850–1860. 10.1210/en.2008-0806. [DOI] [PubMed] [Google Scholar]
- 102.Morton GJ, Matsen ME, Bracy DP, Meek TH, Nguyen HT, Stefanovski D, Bergman RN, Wasserman DH, and Schwartz MW (2013). FGF19 action in the brain induces insulin-independent glucose lowering. J. Clin. Invest 123, 4799–4808. 10.1172/JCI70710. [DOI] [PMC free article] [PubMed] [Google Scholar]
- 103.Ayala JE, Bracy DP, Malabanan C, James FD, Ansari T, Fueger PT, McGuinness OP, and Wasserman DH (2011). Hyperinsulinemic-euglycemic Clamps in Conscious, Unrestrained Mice. JoVE, 3188. 10.3791/3188. [DOI] [PMC free article] [PubMed] [Google Scholar]
- 104.Stefanovski D, Moate PJ, and Boston RC (2003). WinSAAM: a windows-based compartmental modeling system. Metabolism 52, 1153–1166. 10.1016/S0026-0495(03)00144-6. [DOI] [PubMed] [Google Scholar]
- 105.Alonso LC, Watanabe Y, Stefanovski D, Lee EJ, Singamsetty S, Romano LC, Zou B, Garcia-Ocaña A, Bergman RN, and O’Donnell CP (2012). Simultaneous Measurement of Insulin Sensitivity, Insulin Secretion, and the Disposition Index in Conscious Unhandled Mice. Obesity 20, 1403–1412. 10.1038/oby.2012.36. [DOI] [PMC free article] [PubMed] [Google Scholar]
- 106.Wendt ER, Ferry H, Greaves DR, and Keshav S (2015). Ratiometric Analysis of Fura Red by Flow Cytometry: A Technique for Monitoring Intracellular Calcium Flux in Primary Cell Subsets. PLoS ONE 10, e0119532. 10.1371/journal.pone.0119532. [DOI] [PMC free article] [PubMed] [Google Scholar]
- 107.Schindelin J, Arganda-Carreras I, Frise E, Kaynig V, Longair M, Pietzsch T, Preibisch S, Rueden C, Saalfeld S, Schmid B, et al. (2012). Fiji: an open-source platform for biological-image analysis. Nat Methods 9, 676–682. 10.1038/nmeth.2019. [DOI] [PMC free article] [PubMed] [Google Scholar]
Associated Data
This section collects any data citations, data availability statements, or supplementary materials included in this article.
Supplementary Materials
Data Availability Statement
All values used to generate the graphs and uncropped images of representative Western blots in the paper can be found in the file Data S1 – Source data. Raw data have been deposited at Mendeley Data and are publicly available as of the date of publication. DOIs are listed in the key resources table.
This paper does not report original code.
Any additional information required to reanalyze the data reported in this paper is available from the lead contact upon request.
KEY RESOURCES TABLE
| REAGENT or RESOURCE | SOURCE | IDENTIFIER |
|---|---|---|
| Antibodies | ||
| Chicken polyclonal GFP | enQuire Bioreagents | Cat# ab13970; RRID:AB_300798 |
| Donkey anti-chicken IgY (IgG) (H+L), Alexa Fluor 488 | Jackson ImmunoResearch Labs | Cat# 703-545-155; RRID:AB_2340375 |
| Donkey anti-goat IgG (H+L), Alexa Fluor 488 | Thermo Fisher Scientific | Cat# A-11055; RRID:AB_2534102 |
| Donkey anti-guinea pig IgG (H+L), Alexa Fluor 594-AffiniPure F(ab’)2 Fragment | Jackson ImmunoResearch Labs | Cat# 706-586-148; RRID:AB_2340475 |
| Donkey anti-rabbit IgG (H+L), Alexa Fluor 594 | Thermo Fisher Scientific | Cat# A-21207; RRID:AB_141637 |
| Donkey anti-rabbit IgG (H+L), Alexa Fluor 647 | Thermo Fisher Scientific | Cat# A-31573; RRID:AB_2536183 |
| Goat anti-chicken IgG (H+L), Alexa Flour 488 | Thermo Fisher Scientific | Cat# A-11039; RRID:AB_2534096 |
| Goat anti-mouse IgG (H+L), Alexa Flour 488 | Thermo Fisher Scientific | Cat# A-11001; RRID:AB_2534069 |
| Goat polyclonal choline acetyltransferase (ChAT) | Millipore | Cat# AB144P; RRID:AB_2079751 |
| Goat polyclonal Iba1 | Novus Biologicals | Cat# NB 100-1028; RRID:AB_521594 |
| Goat polyclonal mouse IL-6 | R and D Systems | Cat# AF-406-NA; RRID:AB_354478 |
| Guinea pig polyclonal insulin | Agilent (Dako) | Cat# A0564; RRID:AB_10013624 |
| Guinea pig recombinant monoclonal c-Fos | Synaptic Systems | Cat# 226 308; RRID:AB_2905595 |
| Mouse monoclonal Akt (pan) | Cell Signaling Technology | Cat# 2920; RRID:AB_1147620 |
| Mouse monoclonal TNFa | Abcam | Cat# ab1793; RRID:AB_302615 |
| Normal donkey serum | Jackson ImmunoResearch Labs | Cat# 017-000-121; RRID:AB_2337258 |
| Normal goat IgG | R and D Systems | Cat# AB-108-C; RRID:AB_354267 |
| Rabbit anti-guinea pig IgG (H+L) | Abcam | Cat# ab102356; RRID:AB_10712011 |
| Rabbit monoclonal HA | Cell Signaling Technology | Cat# 3724; RRID:AB_1549585 |
| Rabbit monoclonal Phospho-Akt (Ser473) | Cell Signaling Technology | Cat# 4060; RRID:AB_2315049 |
| Rabbit polyclonal B-endorphin | Phoenix Pharmaceuticals | Cat# H-022-33; RRID:AB_2314007 |
| Rabbit polyclonal c-Fos | Abcam | Cat# ab190289; RRID:AB_2737414 |
| Rabbit polyclonal Iba1 | FUJIFILM Wako Shibayagi | Cat# 019-19741; RRID:AB_839504 |
| Rat anti-mouse CD11b FITC | Bio-Rad | Cat# MCA711F; RRID:AB_323464 |
| Rat anti-mouse seroblock FcR | Bio-Rad | Cat# BUF041B; RRID:AB_605399 |
| Recombinant human IgG1 Fc | R and D Systems | Cat# 110-HG-100; RRID:AB_276244 |
| Goat anti-rabbit conjugated HRP | ThermoFisher | Cat# 31460; RRID:AB_228341 |
| Mouse monoclonal anti-beta actin | Cell Signaling Technology | Cat# 58169; RRID:AB_2750839 |
| Goat anti-rabbit conjugated HRP | Abcam | Cat# ab6721; RRID:AB_955447 |
| Chemicals, Peptides, and Recombinant Proteins | ||
| Atropine Sulfate Salt Monohydrate | Sigma-Aldrich | Cat# A0257 |
| Bond Polymer Refine Detection | Leica Biosystems | Cat# DS9800 |
| Bond Primary Antibody Diluent | Leica Biosystems | Cat# AR9352 |
| Clonidine Hydrochloride | Sigma-Aldrich | Cat# C7897 |
| Clozapine N-oxide (CNO) dihydrochloride (water soluble) | Hello Bio | Cat# HB6149 |
| Clozapine N-Oxide (CNO) | Tocris | Cat# 4936 |
| DAPI (4’,6-Diamidino-2-Phenylindole, dihydrochloride) | Thermo Fisher Scientific | Cat# D1306 |
| 50% Dextrose Injection, USP | Hospira, Inc. | N/A |
| Dimethyl Sulfoxide (DMSO) | Sigma-Aldrich | Cat# D1435 |
| Etanercept, Enbrel | Amgen | N/A |
| Gibco Dulbecco’s Phosphate-Buffered Saline (DPBS) | Thermo Fisher Scientific | Cat# 14040-117 |
| Gibco Fetal Bovine Serum | Thermo Fisher Scientific | Cat# 10082-147 |
| Gibco GlutaMAX Supplement | Thermo Fisher Scientific | Cat# 35050-061 |
| Gibco MEM, high glucose | Thermo Fisher Scientific | Cat# A14518-01 |
| Gibco MEM, no glutamine, no phenol red | Thermo Fisher Scientific | Cat# 51200-038 |
| Gibco Penicillin-Streptomycin-Glutamine (100x) | Thermo Fisher Scientific | Cat# 10378-016 |
| Halt Phosphatase Inhibitor Cocktail | Thermo Fisher Scientific | Cat# 78420 |
| Halt Protease Inhibitor Cocktail | Thermo Fisher Scientific | Cat# 78430 |
| 4-Hydroxytamoxifen | Sigma-Aldrich | Cat# H7904 |
| Insulin, Humulin-R | Eli Lilly | Cat# HI-213 |
| Invitrogen Fura Red, AM | Thermo Fisher Scientific | Cat# F3021 |
| Lipopolysaccharides (LPS) from Escherichia coli O55:B5 | Sigma-Aldrich | Cat# L6529 |
| Maraviroc | Tocris Bioscience | Cat# 3756 |
| 2-Mercaptoethanol | Sigma-Aldrich | Cat# 3148 |
| Novocastra Peroxidase Block | Leica Biosystems | Cat# RE7101-CE |
| Percoll Centrifugation Media | Cytiva | Cat# 17089101 |
| Pierce ECL 2 Western Blotting Substrate | Thermo Scientific | Cat# PI80196 |
| Pluronic F-127 | Sigma-Aldrich | Cat# P2443 |
| Recombinant Human IL-1RA | PeproTech, Inc. | Cat# 200-01RA |
| Recombinant Mouse TNF-α | Cell Signaling Technology | Cat# 5178 |
| Recombinant Murine mCSF | PeproTech, Inc. | Cat# 315-02 |
| RIPA Lysis and Extraction Buffer | Thermo Fisher Scientific | Cat# 89900 |
| Sodium Pyruvate | Sigma-Aldrich | Cat# P5280 |
| Tamoxifen | Sigma-Aldrich | Cat# T5648 |
| Triton X-100 | Fisher Scientific | Cat# BP151-100 |
| Critical Commercial Assays | ||
| Applied Biosystems High-Capacity cDNA Reverse Transcription Kit | Thermo Fisher Scientific | Cat# 4368814 |
| Pierce BCA Protein Assay Kit | Thermo Fisher Scientific | Cat# 23227 |
| RNeasy Micro Kit | Qiagen | Cat# 74004 |
| Ultra Sensitive Mouse Insulin ELISA Kit | Crystal Chem | Cat# 90080 |
| Ultra Sensitive Rat Insulin ELISA Kit | Crystal Chem | Cat# 90060 |
| Deposited Data | ||
| Data S1 - Source Data | This Paper | DOI: |
| Experimental Models: Organisms/Strains | ||
| C57BL/6J | The Jackson Laboratory | Strain# 000664; RRID:IMSR_JAX:000664 |
| Cx3cr1CreER (EYFP) | The Jackson Laboratory | Strain# 021160; RRID:IMSR_JAX:021160 |
| Cx3cr1CreER | The Jackson Laboratory | Strain# 020940; RRID:IMSR_JAX:020940 |
| Tmem119CreER | The Jackson Laboratory | Strain# 031820; RRID:IMSR_JAX:031820 |
| hM3Dfl/fl | The Jackson Laboratory | Strain# 026220; RRID:IMSR_JAX:026220 |
| Ikbkbfl/fl | Arkan, et al. | |
| Tnfaip3fl/fl | Tavares, et al. | |
| Wistar IGS Rats | Charles River Laboratories | Strain# 003; RRID:RGD_737929 |
| Oligonucleotides | ||
| Genotyping Primers | See Table S1 | N/A |
| Real-time qPCR Primers | See Table S1 | N/A |
| Software and Algorithms | ||
| Fiji/ImageJ | Schindelin et al. | fiji.sc |
| GraphPad Prism (Version 9.5.1) | GraphPad Software | www.graphpad.com |
| JMP Pro 16.0.0 | JMP Statistical Discovery | www.jmp.com |
| Sequence Detection System (SDS) Software v2.2 | Applied Biosystems | www.thermofisher.com |
| VitalView Activity Software | Starr Life Sciences Corp. | www.starrlifesciences.com |
| WinSAAM 3.0 | Darko et al. | www.winsaam.org |
| Other | ||
| Axio Imager Light Microscope | Zeiss | www.zeiss.com |
| Bond Automated Immunostainer | Leica Biosystems | www.leicabiosystems.com |
| BZ-X800 Fluorescence Microscope | Keyence | www.keyence.com |
| Eclipse E600 Fluorescence Microscope | Nikon | www.microscope.healthcare.nikon.com |
| E-mitter Implantable Transponders (Mouse) | Starr Life Sciences Corp. | www.starrlifesciences.com |
| FreeStyle Lite Glucose Test Strips | Abbott Diabetes Care | N/A |
| FreeStyle Freedome Lite Glucose Monitor | Abbott Diabetes Care | N/A |
| High-fat diet (60% kcal fat) | Research Diets, Inc. | Cat# D12492 |
| Potter-Elvehjem Tissue Grinder, 10 mL | Wheaton | Cat# 358039 |
| Standard chow diet | LabDiet | Cat# 5053 |
| TCS SP5 Confocal Microscope | Leica Biosystems | www.leica-microsystems.com |