

Abstract
The SREB (Super-conserved Receptors Expressed in Brain) family of orphan G protein-coupled receptors is highly conserved in vertebrates and consists of three members: SREB1 (orphan designation GPR27), SREB2 (GPR85), and SREB3 (GPR173). SREBs are associated with processes ranging from neuronal plasticity to reproductive control. Relatively little is known about similarities across the entire family, or how mammalian gene expression patterns compare to non-mammalian vertebrates. In fish, this system may be particularly complex, as some species have gained a fourth member (SREB3B) while others have lost genes. To better understand the system, the present study aimed to: 1) use qPCR to characterize sreb and related gene expression patterns in the brains of three fish species with different systems, and 2) identify possible differences in transcriptional regulation among the receptors, using upstream transcription factor binding sites across 70 ray-finned fish genomes. Overall, regional patterns of sreb expression were abundant in forebrain-related areas. However, some species-specific patterns were detected, such as abundant expression of receptors in zebrafish (Danio rerio) hypothalamic-containing sections, and divergence between sreb3a and sreb3b in pufferfish (Dichotomyctere nigroviridis). In addition, a gene possibly related to the system (dkk3a) was spatially correlated with the receptors in all three species. Genomic regions upstream of sreb2 and sreb3b, but largely not sreb1 or sreb3a, contained many highly conserved transcription factor binding sites. These results provide novel information about expression differences and transcriptional regulation across fish that may inform future research to better understand these receptors.
Keywords: SREB1, (GPR27), SREB2 (GPR85), SREB3 (GPR173), Phoenixin, DKK3, Brain
Graphical Abstract

1. Introduction
The Super-conserved Receptors Expressed in Brain (SREB) are a family of highly conserved G protein-coupled receptors (GPCRs) that were first discovered over twenty years ago in human and mouse expressed sequence tag databases (O’Dowd et al., 1998; Hellebrand et al., 2000; Matsumoto et al., 2000). In mammals, the SREB family consists of three members that are largely considered orphan receptors with no validated endogenous ligands: SREB1 (orphan receptor GPR27), SREB2 (GPR85), and SREB3 (GPR173) (Staübert et al., 2022; Yañez-Guerra et al., 2022). Some possible ligands for SREB3 were recently identified, including proteolytic cleavage products of gonadotropin-releasing hormone (GnRH-(1-5)) and mitochondrial respiratory chain chaperone protein SMIM20 (phoenixin, PNX) (Larco et al., 2013; Yosten et al., 2013; Stein et al., 2016). In addition, cholecystokinin may function as an SREB3 ligand (He et al., 2023). However, all of these remain unconfirmed. Recent pharmacological assays using PNX did not exhibit binding to SREB3, and receptor deorphanization requires reproducibility of binding at physiologically relevant concentrations in at least two independent settings (Davenport et al., 2013; Laschet et al., 2018; Yañez-Guerra et al., 2022). This has not been accomplished to date for any of these potential ligands. As such, SREBs remain difficult to study despite considerable research attention and potential use as GPCRs for therapeutic targets in medicine (Hauser et al., 2017; Khan et al., 2017; Bayrak et al., 2022).
Despite having no validated endogenous ligands, each SREB is independently associated with medically relevant conditions. For instance, SREB1 is associated with insulin regulation in pancreatic β-cells, while SREB2 affects neurogenesis and schizophrenia-like behaviors in mice (Matsumoto et al., 2008; Chen et al., 2012; Ku et al., 2012; Chopra et al., 2020). Variant SREB2 alleles in humans are associated with psychiatric conditions such as autism spectrum disorder (Fujita-Jimbo et al., 2015). SREB3-mediated actions have mostly been studied in the context of GnRH-(1-5) and PNX, where these effects seem to require the receptor (Larco et al., 2013; Yosten et al., 2013). These studies highlight diverse roles for SREB3, including GnRH neuron migration, appetite regulation, and control of reproduction (Larco et al., 2013; Stein et al., 2016; Nguyen et al., 2019; McIlwraith et al., 2022).
Although there are some differences in SREB expression patterns across peripheral tissues, all three receptors are characterized by extensive expression throughout the mammalian central nervous system (Matsumoto et al., 2000). Human SREB1 and SREB2 mRNA are particularly abundant within the basal ganglia of the forebrain, while SREB3 levels are greatest within the cerebellum and cerebral cortex (Matsumoto et al., 2000). These receptors were also found to localize in gray matter areas, not white matter, and expression was restricted to neurons (Matsumoto et al., 2005). Neuronal patterns within the forebrain were also highly conserved across human, monkey, and rat (Matsumoto et al., 2005).
The SREB system is far less studied in non-mammalian vertebrates. Recent work has highlighted dynamic gain or loss of SREBs in a variety of clades that suggest added system complexity (Breton et al., 2021; Staübert et al., 2022). In particular, some fishes have gained a fourth SREB member (SREB3B) that is only present in Protacanthopterygii (Breton et al., 2021). As such, many highly-derived fishes exhibit a total of four SREBs, while less-derived teleosts like the zebrafish (Danio rerio) only exhibit the three as in mammals. In addition, one order (Cyprinodontiformes) has lost the mammalian-like sreb3 gene (termed sreb3a here) but still retained the novel sreb3b (Breton et al., 2021). There is also evidence of possible functional divergence for sreb3b, as expression patterns across fish were closer to sreb2 than sreb3a, and 17β-estradiol treatment of spotted scat (Scatophagus argus) hypothalamic cells induced different transcriptional responses between sreb3a and sreb3b (Breton et al., 2021; Jiang et al., 2022). Overall, these systems in fish are poorly understood, and there is no information to date about how sreb3b is spatially distributed in the teleost brain, or how transcriptional regulation may differ among the receptors.
The purposes of the present study were to characterize regional sreb expression in the fish brain, compare these patterns across multiple species with different systems, and conduct a preliminary analysis of transcription factor binding sites in proximal promoter regions. To do this, three species were used for brain gene expression analyses: 1) the zebrafish (D. rerio), which exhibits a similar system to mammals (sreb1, sreb2, and sreb3a), 2) the mummichog (Fundulus heteroclitus), a cyprinodontiform that has gained the novel receptor but lost the mammalian-like ortholog (sreb1, sreb2, and sreb3b), and 3) the green-spotted pufferfish (Dichotomyctere nigroviridis), which is a highly-derived teleost with all four genes (sreb1, sreb2, sreb3a, and sreb3b). These spatial patterns were also compared to other genes associated with the SREB system, including the potential ligand PNX (smim20/pnx) (Yosten et al., 2013; McIlwraith and Belsham, 2018; Wang et al., 2019; Rajeswari and Unniappan, 2020), and several genes previously associated with PNX treatment in pufferfish hypothalamus (Breton et al. 2022). All genes were used in quantitative PCR (qPCR) surveys across several brain sections in each species. A comparative genomics study was also conducted to identify highly conserved transcription factor binding sites unique to each receptor, using upstream genomic regions of 70 publicly available ray-finned fish genomes.
2. Materials and Methods
2.1. Animal use approval and fish sampling
Adult wild-type AB line zebrafish and wild origin adult mummichog (Northeast Creek, Mount Desert Island, ME, USA) were maintained by the MDI Biological Laboratory (MDIBL, Bar Harbor, ME, USA) and sampled there under approved guidelines by the MDIBL Institutional Animal Care and Use Committee in September 2022 (IACUC #22-01). Adult wild origin pufferfish were imported through a local wholesaler (Segrest Farms, Inc.) and maintained in a freshwater flow through system at the University of Florida (UF) Tropical Aquaculture Laboratory (Ruskin, FL, USA). Pufferfish were sampled at UF in March 2022 under approved guidelines by the UF IACUC (#202011293). Gonads in all species were visually observed during sampling to assess reproductive staging. Zebrafish and pufferfish were mature with either spermiating testes or vitellogenic ovaries. Male mummichogs were also mature with spermiating testes, but females were more variable and exhibited both pre-vitellogenic and early vitellogenic ovaries. All experiments were performed with approval of the University of Maine at Farmington (UMF) Grant Coordination Committee and in accordance with MDIBL and UF IACUC ethical guidelines and regulations for vertebrate animal use. All experiments were conducted in compliance with ARRIVE guidelines.
Zebrafish (n = 5; two females 0.85 ± 0.01 g, and three males 0.39 ± 0.05 g) and mummichog (n = 6; three females 4.3 ± 0.5 g, and three males 3.3 ± 0.4 g) were euthanized by immersion in a 1:500 2-phenoxyethanol solution for 30 min. Sex was confirmed by gonadal observations. Due to small sizes, each brain was divided into three sections using previously established protocols (Breton et al., 2015). Briefly, an anterior forebrain section was sampled that contained the telencephalon and olfactory bulbs (TEL+OL). A posterior forebrain and midbrain section was collected that contained the optic tectum, hypothalamus, and inferior lobes (HYP+MB) (Bloch et al., 2019). A hindbrain (HB) section was also obtained that consisted of the cerebellum, pons, and medulla oblongata.
Pufferfish (n = 6; three females 19.1 ± 3.5 g, and three males 16.4 ± 3.5 g) were euthanized at UF using an overdose of neutral buffered tricaine methanesulfonate (MS-222, 200 mg/L), and sex was confirmed by gonadal observation. Due to larger sizes, pufferfish brains were divided into a total of four sections to better identify patterns within more distinct regions: 1) anterior forebrain (TEL+OL), 2) hypothalamus and inferior lobes (HYP), 3) midbrain (MB), and 4) the cerebellum (CER). Brain sections from all three species were preserved in RNALater (Ambion, Inc., Austin, TX, USA), transported immediately to UMF, and stored at −80°C until RNA extractions.
2.2. RNA extractions and cDNA synthesis
RNA extractions were performed on all brain sections using Tri Reagent (Sigma-Aldrich, St. Louis, MO, USA) and standard phenol/chloroform procedures. Total RNA quantity and quality were assessed using a spectrophotometer and 1.0% agarose gel electrophoresis. Most RNA samples exhibited high quality (absorbance at 260 nm /280 nm ~ 2.0, and 260 nm /230 nm > 2.0), except for one female zebrafish HB and one female pufferfish MB, which were removed from further analyses. A total of 2.5 μg RNA/sample was used for all species, except for pufferfish CER, which exhibited lower quantities (mean 1.9 μg RNA/sample). All samples were treated with ezDNase and a 5 min incubation at 37 °C to remove genomic DNA contamination, followed by cDNA synthesis using the Superscript IV VILO kit with standard procedures (Invitrogen, Carlsbad, CA, USA).
2.3. Quantitative PCR (qPCR) analyses
To assess gene expression patterns related to the SREB system, species-specific qPCR assays were designed for two commonly used reference genes (18S rRNA and eef1a), all sreb genes (sreb1, sreb2, sreb3a, and sreb3b), PNX (smim20/pnx), and three likely downstream effect genes (dickkopf WNT signaling pathway inhibitor 3a, dkk3a; dihydropyrimidine dehydrogenase b, dpydb; and transforming growth factor β3, tgfb3). These downstream genes were chosen based on prior work where quantifiable qPCR expression changes were detected in pufferfish hypothalamic sections following PNX treatment (Breton et al., 2022). Primers for zebrafish eef1a were designed by McCurley and Callard (2008), while most other zebrafish and all pufferfish primers were previously designed by our group (Breton et al., 2021, 2022). Zebrafish primers for dkk3a, dpydb, and tgfb3 were designed using publicly available nucleotide sequences through the National Center for Biotechnology Information (NCBI) (GenBank accession nos. NM_001159283, NM_212893, and NM_194386, respectively) and NCBI Primer-BLAST. Mummichog primers were similarly designed for sreb1, sreb2, sreb3b, smim20/pnx, dkk3a, dpydb, tgfb3, 18S rRNA, and eef1a using accession nos. XM_012873806, XM_021324685, XM_036140736, XM_012867669, XM_012873005, XM_021308731, XM_012851801, M91180.1, and AY430091, respectively. All primer sets were verified for intended product amplification using standard PCR protocols and 2.0% agarose gel electrophoresis (Breton et al., 2019). Primer sets and product sizes are provided in Table 1.
Table 1.
Species used (zebrafish, Danio rerio; mummichog, Fundulus heteroclitus; pufferfish, Dichotomyctere nigroviridis), gene names, primer sequences, product sizes (bp), Mean Ct values, and PCR efficiencies (%) for all qPCR assays. Mean Ct refers to the 1/40 diluted standard curve point in each assay. Zebrafish eef1a primers were designed by McCurley and Callard (2008).
| Species | Gene | Sequence (5′-3′) | bp | Mean Ct | PCR efficiency (%) |
|---|---|---|---|---|---|
| Zebrafish | sreb1 | F - CTGGCGTCTTTGGGTCTCAT R - TGGAGCGAGCTGTCTTTCAG |
86 | 27.89 | 99.4 |
| sreb2 | F - CTTCCTGCTGGACCTCTGTG R - GTCCAGGCTGAGCCATTCTT |
93 | 26.70 | 91.5 | |
| sreb3a | F - TTTCATGGACCTGGAGCCAC R - CTGGTTGTGCAAGTTCTGCC |
111 | 25.94 | 94.2 | |
| smim20/pnx | F - TGAAGACTACAAGCAAGTGCAGA R - AGGGATCAGACCAGACCTTCA |
92 | 26.66 | 94.1 | |
| dkk3a | F - CACCAAAGACGAGGAGTGCT R - TGACAGATGGTTCCTGCGTC |
93 | 24.20 | 105.4 | |
| dpydb | F: GGAGCATCTGTCTTGCAGGT R: ATCGTGCAGCTCCTCTATGC |
120 | 30.08 | 90.0 | |
| tgfb3 | F - GGATTCGGCAAGGACAGACA R - GCAGTAGGGCAGGTCATTGT |
126 | 24.58 | 97.8 | |
| 18S rRNA | F - AAACGGCTACCACATCCAAG R - TTACAGGGCCTCGAAAGAGA |
109 | 7.97 | 95.9 | |
| eef1a | F - CTTCTCAGGCTGACTGTGC R - CCGCTAGCATTACCCTCC |
358 | 12.58 | 104.4 | |
| Mummichog | sreb1 | F - ACCGTCATTAGTGTGAGCCG R - CGGCAATCCGCTCATAAAGC |
138 | 27.14 | 109.5 |
| sreb2 | F - CCGTCATTTGCATGGTGTGG R - GAGTCGTTTGCCCTGAAGGA |
133 | 27.76 | 88.8 | |
| sreb3b | F - AAAGGGGTCTGAATGGAGCG R - CAAGGGTATTGGGTCCGCTT |
97 | 24.29 | 101.6 | |
| smim20/pnx | F - GAGGTCCAGAAGGTGAACCG R - TTCTGCAGGCTTGAACGGAT |
93 | 22.45 | 105.6 | |
| dkk3a | F - ACTGATGAGCACTCTGTGCC R - CCCACAGTCGTCATTCGTGA |
126 | 21.73 | 102.9 | |
| dpydb | F - GTGGTGATTGTTTTGGGGGC R - GACGGCTCTGATGTTGGTGA |
120 | 25.38 | 105.0 | |
| tgfb3 | F - CAGAGGGCTGAAGGTGGATG R - CCCCCTGCCTTTGGTTATGT |
99 | 26.11 | 106.0 | |
| 18S rRNA | F: GGCCGTTCTTAGTTGGTGGA R: TTGCTCAATCTCGTGTGGCT |
150 | 7.99 | 91.1 | |
| eef1a | F - CTGAGATGGGAAAGGGCTCC R - CAGAGCGATGTCGATGGTGA |
92 | 17.19 | 94.7 | |
| Pufferfish | sreb1 | F - CTTCCTGCTCTTCTGCGTCA R - CGCACGTACACACGTTCATC |
89 | 22.77 | 102.1 |
| sreb2 | F - ACTCCTTGGGCTTCATGCTC R - GGCTAACAGCAGGCACAAAC |
129 | 20.49 | 102.0 | |
| sreb3a | F - GCACGTACAAGTTCATCCGC R - GCATTAGCATGAAGCCCAGC |
90 | 31.15 | 90.0 | |
| sreb3b | F - TCACGGTGTGGATGAGCTTC R - GCAGCACTTTCCTCAGGTCT |
81 | 23.02 | 97.0 | |
| smim20/pnx | F: GACGGAATCAACCAGGCAGA R: GGAATCATTTTCCGGCAGGC |
82 | 25.15 | 89.7 | |
| dkk3a | F - TGAGGAGACGGAGAGCATCA R - GCCTCTCCTCTGGTTGCATT |
150 | 22.96 | 101.7 | |
| dpydb | F - AGAGCGGTTCCAGAGGAGAT R - GACAGAACTGTAACCCGGCA |
118 | 35.10 | 89.4 | |
| tgfb3 | F - GCTCTACCAGATCGTGAGGC R - ATTGCTGCCTCGGTTCATCA |
148 | 27.74 | 94.2 | |
| 18S rRNA | F - CGCTACTACCGATTGGATGG R - GTAATGATCCTTCCGCAGGT |
163 | 16.99 | 89.4 | |
| eef1a | F - TGAGGCCGGTATCTCCAAGA R - AAACGTGCCTGACTGTAGGG |
132 | 14.18 | 104.7 |
All qPCR assays were performed with a StepOne Plus Real Time PCR System and FAST SYBR™ Green Master Mix (Applied Biosystems, Foster City, CA, USA). Reactions consisted of 10 μl total volumes with 1.33 μl diluted template (1/40 dilution) and 0.01-1.4 μM primer concentrations depending on assay. Standard qPCR cycling conditions were used and consisted of 95 °C for 10 min, followed by 40 cycles of 95 °C for 15 s and 60 °C for 1 min. All samples were assayed in duplicate, and triplicate relative standard curves were made from pooled cDNA across brain sections. Optimized linear standard curves consisted of four to six points, with approximately 90–100% PCR efficiency (Table 1) and single peak amplification in dissociation curve analysis. Standard qPCR negative controls (no template and no reverse transcriptase) exhibited no contamination.
All qPCR assays were analyzed using relative quantification with assay-specific PCR efficiency corrections. Both commonly used reference genes (18S rRNA and eef1a) exhibited significant differences among zebrafish and pufferfish brain sections and could not be used for normalization. To maintain the same normalization approach across all three species, a modified method from Adamski and colleagues (2014) was used to normalize expression values without a reference gene, where cell number (cCC) was replaced with input RNA (μg). This approach was previously used to normalize qPCR data across fish organs and produced similar relative values to other methods (Breton et al., 2021). Within the present study, mummichog data normalized using both the modified method and standard reference genes produced similar results (data not shown). For all assays, results were expressed relative to the TEL+OL stage (set to 1.0), and data were expressed as the mean ± standard error. To meet assumptions of normality, normalized qPCR data were log-transformed prior to use in one-way ANOVAs in SYSTAT12 (Systat Software Inc., San Jose, CA, USA). Tukey’s post hoc tests were used to identify significant differences among brain sections (p < 0.05).
To compare expression between genes, least squares regression analyses were conducted in SYSTAT12 using log-transformed individual qPCR data (n = 14, 18, and 23 for zebrafish, mummichog, and pufferfish, respectively). Coefficients of determination (r2) and p-values were calculated for each pairwise comparison among nine (zebrafish and mummichog) or ten (pufferfish) total genes. To visualize differences among individual samples, these data were used in principal component analyses (PCA) in SYSTAT12. Factor loading plots were also generated to broadly compare how genes influence principal components among species.
2.4. Transcription factor binding site analyses
To identify differences in transcriptional regulation among sreb genes, a preliminary analysis was conducted using upstream genomic regions in CiiiDER (Gearing et al., 2019). Many transcription factor binding site prediction programs use position frequency matrices to predict sites, which can be prone to false positives (Khamis et al., 2018, Gearing et al., 2019). Two approaches were used to mitigate this and identify highly conserved and likely functional sites: 1) fish data included 5’ regions flanking from all sreb genes in a total of 70 ray-finned fish genomes available in Ensembl version 109 (Cunningham et al., 2022), and 2) enrichment analysis was used in CiiiDER to identify statistically significant over- or under-represented sites compared to a background set of sequences (Gearing et al., 2019).
Briefly, 1,500 bp genomic regions containing likely proximal promoter sequences were manually exported from the 5’ end of each predicted sreb gene start site in Ensembl. Manual curation was necessary since sreb3a and sreb3b were commonly both labeled as sreb3 in genomes, and these genes were distinguished using synteny (see Breton et al., 2021). For some species, 5’ untranslated regions (UTRs) were annotated (e.g., zebrafish and goldfish Carassius auratus genomes), and exported promoters did not include these regions. However, many species only exhibited annotation for protein-coding sites and 5’ UTRs could not be excluded from the data. Promoter regions were likely still present in most sequences though, as sreb genes are largely single exons, and some species exhibit short 5’ UTR lengths (484, 172, and 0 bp for zebrafish sreb1, sreb2, and sreb3a, respectively). These regions were also validated as likely containing proximal promoters through browsing experimental ATAC-seq data in publicly available zebrafish and Japanese medaka (Oryzias latipes) databases (zebrafish ENCODE, Le Bras, 2020; Yang et al., 2020; and Medaka Omics Data Portal, Li et al., 2020). In zebrafish, these regions for sreb1, sreb2, and sreb3a contained 250-400 bp areas with abundant brain h3k27ac histone modifications, which are markers of enhancer activity (Zhang et al., 2020; data not shown). In medaka, elevated ATAC-seq levels (~150 bp) were also detected upstream of sreb2, and these were weaker but still present for sreb3b (data not shown). The dataset consisted of 71 sreb1, 84 sreb2, 73 sreb3a, and 53 sreb3b upstream regions (Supplementary Data). A total of eight sequences were not included due to missing data (Ns), and two others (Nothobranchius furzeri sreb3b and Larimichthys crocea sreb2) were removed due to possible overlapping genes or annotation errors.
Enrichment analyses were conducted in CiiiDER using the recommended deficit threshold for large datasets (0.15) and the curated JASPAR 2020 database of vertebrate transcription factor binding site profiles (Fornes et al., 2020). To identify highly conserved and enriched binding sites unique to each sreb, regions associated with one receptor were compared to a background of all other sequences (Ex: sreb1-related vs sreb2, sreb3a, and sreb3b-related). To reduce false positives, a p-value threshold (p ≤ 1 e−15 or 15.00 after log 10 transformation) was used to identify only highly significant over- or under-represented binding sites.
3. Results
3.1. Zebrafish, mummichog, and pufferfish qPCR patterns
Zebrafish sreb1, sreb2, and sreb3a all exhibited significantly abundant expression in HYP+MB sections, with approximately eight (p < 0.001), six (p = 0.003), and 12 (p < 0.001) fold higher levels, respectively, than TEL+OL or HB regions (Fig. 1A). Mummichog sreb1, sreb2, and sreb3b expression was more variable and no significant differences were detected, although similarly to zebrafish, greatest overall expression was observed in the HYP+MB (Fig. 1B). Pufferfish expression was more divergent, and no sreb gene exhibited peak expression in either HYP or MB sections (Fig. 1C). Instead, these receptors exhibited unique profiles. The pufferfish sreb1 gene was characterized by low expression in the hypothalamic section and approximately two fold higher levels in TEL+OL, MB, and CER (p < 0.001). Pufferfish sreb2 also exhibited low hypothalamus expression and abundant TEL+OL levels, but midbrain and cerebellar sections were intermediate (p < 0.001). Sreb3a and sreb3b exhibited abundant levels in TEL+OL sections but diverged in the cerebellum. In particular, sreb3a exhibited a 50 fold decrease in the cerebellum (p < 0.001) compared to TEL+OL, while sreb3b cerebellar expression was largely equal (p < 0.001) (Fig. 1C).
Fig. 1.
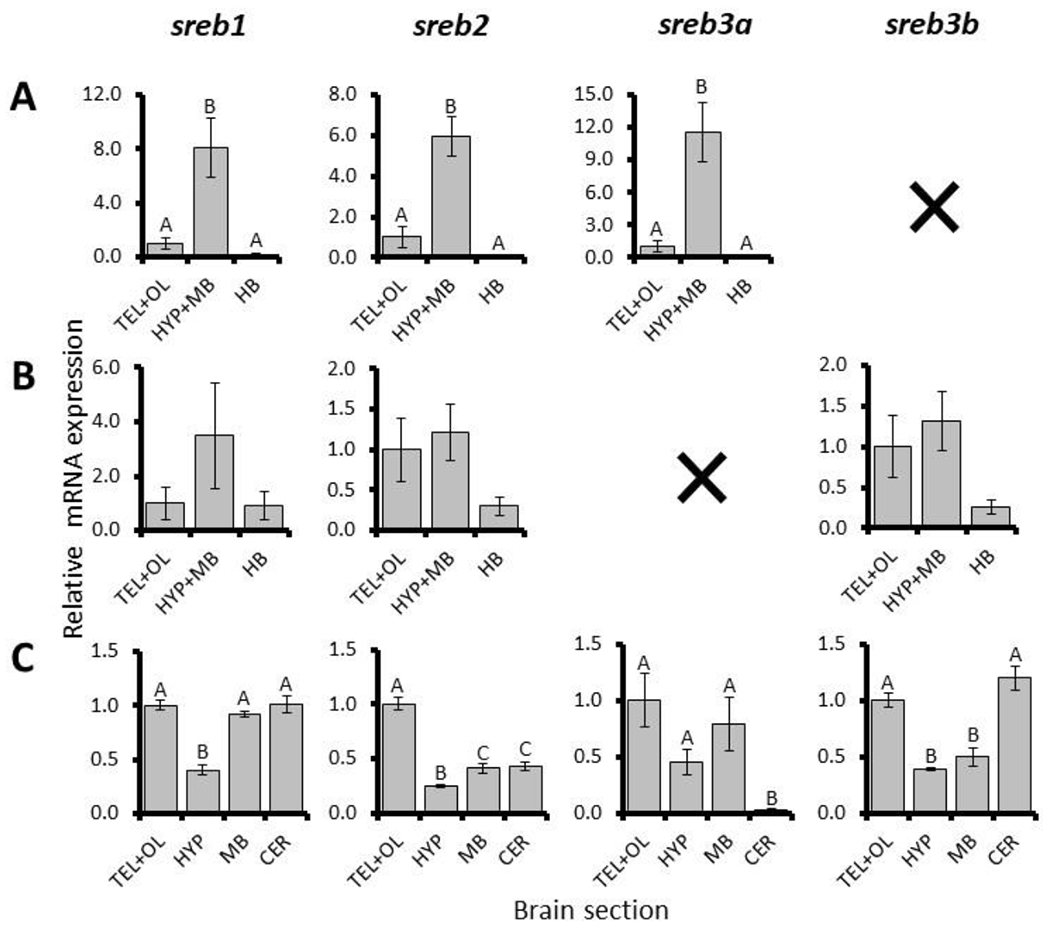
Relative mRNA expression normalized to μg input RNA of sreb genes in brain sections of (A) zebrafish (Danio rerio), (B) mummichog (Fundulus heteroclitus), and (C) pufferfish (Dichotomyctere nigroviridis). TEL+OL, HYP+MB, and HB refer to telencephalon + olfactory bulbs, hypothalamic section with midbrain, and hindbrain sections, respectively. Individual hypothalamus, midbrain, and cerebellum sections in pufferfish are indicated by HYP, MB, and CER respectively. Black ‘X’ refers to sreb3b or sreb3a gene absence in zebrafish and mummichog, respectively. Each bar represents the mean ± standard error, and significant differences (p < 0.05) are indicated by different letters.
Other genes (smim20/pnx, dkk3a, dpydb, and tgfb3) also exhibited many differences among brain sections (Fig 2). In particular, zebrafish smim20/pnx and dkk3a were similar to sreb genes and abundant in HYP+MB sections approximately two and 40 fold respectively (p = 0.013 and < 0.001). The dpydb and tgfb3 genes exhibited divergent patterns and higher variance across samples (p = 0.005 and 0.029), and they were upregulated in the hindbrain or anterior forebrain, respectively (Fig. 2A). Mummichog sreb-related genes were variable and no significant differences were detected (Fig. 2B). Pufferfish smim20/pnx and dkk3a exhibited divergent patterns compared to sreb genes, with significantly abundant cerebellar and hypothalamic expression, respectively (p <0.001) (Fig. 2C). Pufferfish dpydb expression was variable (p = 0.062), while tgfb3 exhibited significantly less expression in the cerebellum only (p < 0.001).
Fig. 2.
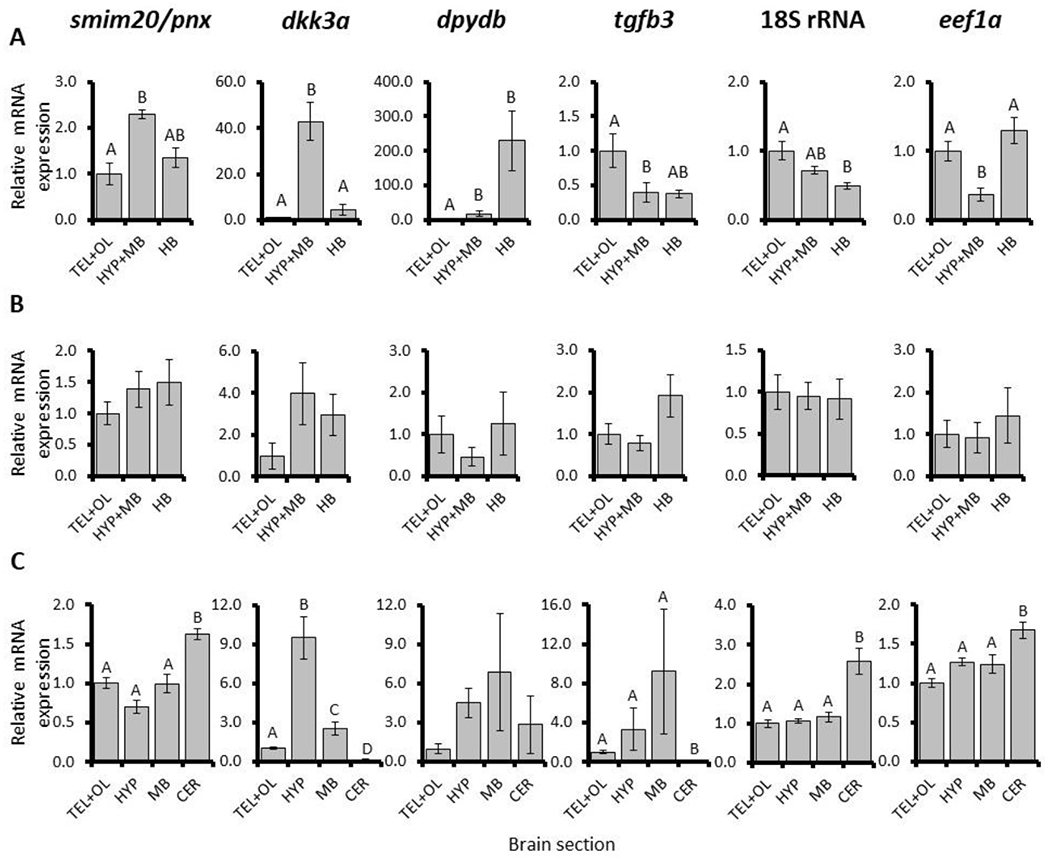
Relative mRNA expression normalized to μg input RNA of smim20 pnx, dkk3a, dpydb, tgfb3, 18S rRNA, and eef1a in brain sections of (A) zebrafish (Danio rerio), (B) mummichog (Fundulus heteroclitus), and (C) pufferfish (Dichotomyctere nigroviridis). For zebrafish and mummichog sections, TEL+OL, HYP+MB, and HB refer to telencephalon + olfactory bulbs, hypothalamus + midbrain, and hindbrain sections, respectively. For pufferfish, HYP, MB, and CER refer to hypothalamic, midbrain, and cerebellum sections, respectively. Each bar represents the mean ± standard error, and significant differences (p < 0.05) are indicated by different letters.
Many expression patterns were significantly related between genes (Table 2). All zebrafish sreb patterns were highly significant to each other in regression analyses (r2 = 0.925-0.973, p < 0.001), and both smim20/pnx and dkk3a were positively related with these receptors (r2 = 0.481-0.730, p < 0.01 or < 0.001). In contrast, zebrafish dpydb and tgfb3 did not exhibit significant regressions with any genes related to the system, except for an inverse relationship between each other (r2 = 0.345, p < 0.05). Mummichog regression analyses also exhibited largely similar results, with a high similarity between sreb2 and sreb3b (r2 = 0.970, p < 0.001) and similar patterns between these genes and both smim20/pnx and dkk3a (r2 = 0.553-0.685, p < 0.001). However, the sreb1 gene was divergent, with still significant but weaker regressions with other receptors (r2 = 0.247-0.262, p < 0.05) and no relationship to smim20/pnx or dkk3a. Some inverse regressions between dpydb and sreb1 or sreb3b were also detected. The tgfb3 gene did not exhibit associations with other mummichog genes, except for a significant positive relationship to dpydb (r2 = 0.718, p < 0.001).
Table 2.
Matrices of coefficients of determination (r2) for gene pairwise regression analyses in zebrafish (Danio rerio), mummichog (Fundulus heteroclitus), and pufferfish (Dichotomyctere nigroviridis). Dashes and parentheses indicate gene absence and negative regressions, respectively.
| Species | sreb1 | sreb2 | sreb3a | sreb3b | smim20/pnx | dkk3a | dpydb | tgfb3 | 18S rRNA | |
|---|---|---|---|---|---|---|---|---|---|---|
| Zebrafish | sreb2 | 0.925 *** | ||||||||
| sreb3a | 0.973 *** | 0.943 *** | ||||||||
| sreb3b | --- | --- | --- | |||||||
| smim20/pnx | 0.583** | 0.481** | 0.522** | --- | ||||||
| dkk3a | 0.630** | 0.566** | 0.630** | --- | 0.730 *** | |||||
| dpydb | 0.003 | 0.014 | 0.005 | --- | 0.154 | 0.092 | ||||
| tgfb3 | 0.006 | 0.001 | 0.012 | --- | 0.026 | 0.136 | (0.345*) | |||
| 18S rRNA | 0.011 | 0.022 | 0.019 | --- | 0.178 | 0.034 | (0.595**) | 0.049 | ||
| eef1a | (0.508**) | (0.426*) | (0.583**) | --- | 0.173 | (0.403*) | 0.000 | 0.176 | 0.017 | |
|
| ||||||||||
| Mummichog | sreb2 | 0.247* | ||||||||
| sreb3a | --- | --- | ||||||||
| sreb3b | 0.262* | 0.970 *** | --- | |||||||
| smim20/pnx | 0.048 | 0.577 *** | --- | 0.579 *** | ||||||
| dkk3a | 0.141 | 0.553 *** | --- | 0.585 *** | 0.685 *** | |||||
| dpydb | (0.255*) | 0.200 | --- | (0.245*) | 0.000 | 0.055 | ||||
| tgfb3 | 0.155 | 0.017 | --- | 0.028 | 0.108 | 0.049 | 0.718 *** | |||
| 18S rRNA | 0.085 | 0.037 | --- | 0.066 | 0.023 | 0.005 | 0.782 *** | 0.550 *** | ||
| eef1a | 0.220 | 0.113 | --- | 0.167 | 0.008 | 0.067 | 0.879 *** | 0.573 *** | 0.803 *** | |
|
| ||||||||||
| Pufferfish | sreb2 | 0.465 *** | ||||||||
| sreb3a | 0.010 | 0.070 | ||||||||
| sreb3b | 0.513 *** | 0.422** | 0.157 | |||||||
| smim20/pnx | 0.375** | 0.100 | (0.309**) | 0.453 *** | ||||||
| dkk3a | (0.510 *** ) | 0.124 | 0.336** | (0.682 *** ) | (0.585 *** ) | |||||
| dpydb | 0.170 | (0.175*) | 0.026 | (0.191*) | 0.106 | 0.245* | ||||
| tgfb3 | 0.106 | 0.006 | 0.201* | 0.358** | (0.359**) | 0.581 *** | (0.354**) | |||
| 18S rRNA | 0.091 | 0.005 | (0.598 *** ) | 0.231* | 0.457 *** | (0.419**) | 0.005 | (0.309**) | ||
| eef1a | 0.000 | 0.115 | (0.458 *** ) | 0.046 | 0.322** | 0.135 | 0.033 | (0.191*) | 0.642 *** | |
Asterisks (*, **, or *** + bold) indicate significance at the < 0.05, < 0.01, or < 0.001 levels, respectively.
Many pufferfish gene regression analyses differed from those in other species, and receptors were more varied with moderate relationships among sreb1, sreb2, and sreb3b (r2 = 0.422-0.513, p < 0.001) (Table 2). The sreb3a gene was not similar to any other receptor (r2 = 0.010-0.157). Smim20/pnx and dkk3a exhibited many similar patterns with sreb genes, but unlike in zebrafish and mummichog, were not uniformly observed in positive relationships across brain sections (Table 2). Instead, these two genes were negatively related to each other (r2 = 0.585, p < 0.001) and were characterized by opposite patterns when compared to sreb genes. For instance, smim20/pnx and sreb1 were positively associated among samples (r2 = 0.375), while dkk3a and sreb1 were negative (r2 = 0.510). However, neither gene exhibited any significant regressions with pufferfish sreb2 (p > 0.05). Some weaker regressions were detected among dpydb, tgfb3, and other genes. Lastly, reference genes assayed that were assumed to be unrelated to the sreb system (18S rRNA and eef1a) did exhibit relationships with other genes, but none were shared across all three species (Table 2). No significant gene expression differences were detected between sexes in any species (data not shown).
Many brain sections separated into distinct clusters in PCA, and some broad similarities were evident across species (Fig. 3). For instance, both zebrafish and mummichog genes exhibited similar patterns in gene loading plots, which describe how each gene influences the principal components. In particular, sreb genes, smim20/pnx, and dkk3a all contributed similarly to brain section clustering, while other genes differed in their contributions (Fig. 3A–B). However, brain section clustering itself exhibited some divergence between zebrafish and mummichog, with clear clusters only identified in zebrafish (Fig. 3A–B). Pufferfish brain sections also clustered in PCA similarly to zebrafish, but gene loading plots exhibited the greatest divergence among the three species (Fig. 3C).
Fig. 3.
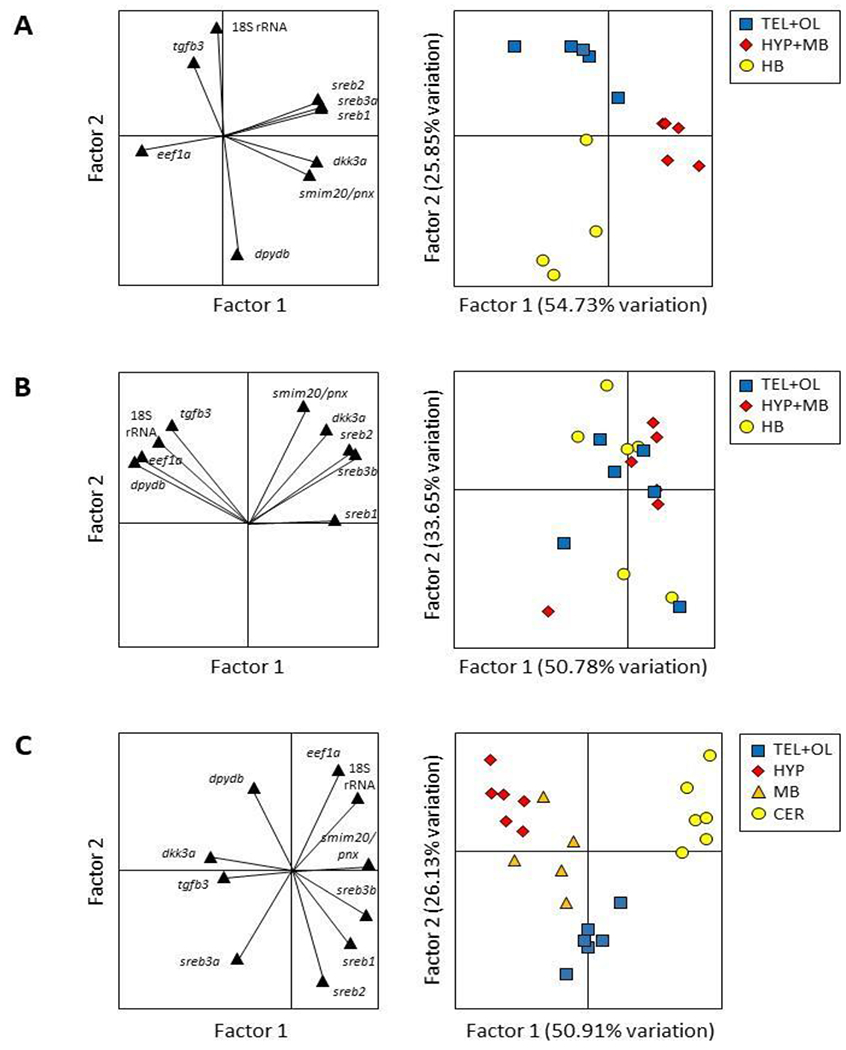
Component loading plots and principal component analyses (PCA) for (A) zebrafish (Danio rerio), (B) mummichog (Fundulus heteroclitus), and (C) pufferfish (Dichotomyctere nigroviridis) genes. Black triangles represent each gene in the loading plots, while telencephalon + olfactory bulbs (TEL+OL), hypothalamus and midbrain (HYP+MB), and hindbrain (HB) samples are represented in the zebrafish and mummichog PCAs by blue squares, red diamonds, and yellow circles, respectively. Pufferfish TEL+OL, hypothalamic section (HYP), midbrain (MB), and cerebellum (CER) are represented by blue squares, red diamonds, orange triangles, and yellow circles, respectively.
3.2. Transcription factor binding site differences
Many highly significant and conserved upstream transcription factor binding sites were unique to sreb2 and sreb3b across ray-finned fish, while sreb1 and sreb3a regions were more variable (Fig. 4). In particular, sreb2-related regions were characterized by 17 uniquely overrepresented sites, including those corresponding to eight members of the T-box family (MGA, TBR1, TBX2, TBX3, TBX6, TBX18, TBX20, TBX21), three members of the Krüppel-like family (KLF1, KLF6, KLF10), three members of the Sox family (SOX3, SOX4, SOX10), and three others (SCRT1, TCF7, TCF7L2). One additional transcription factor site (ZFX) was significantly under-represented. The sreb3b regions exhibited 13 unique and significantly overrepresented sites, including those for three members of the Snail family (SNAI1, SNAI2, SNAI3), three RFX members (RFX1, RFX3, RFX7), and seven others (EGR1, FIGLA, HOXA5, HOXB7, MYOD1, PTF1A, ZFP42). In contrast, genomic regions neighboring sreb1 and sreb3a were not as highly conserved, with only two transcription factors sites underrepresented (SOX3, SOX4) or one overrepresented (TFE3), respectively.
Fig. 4.
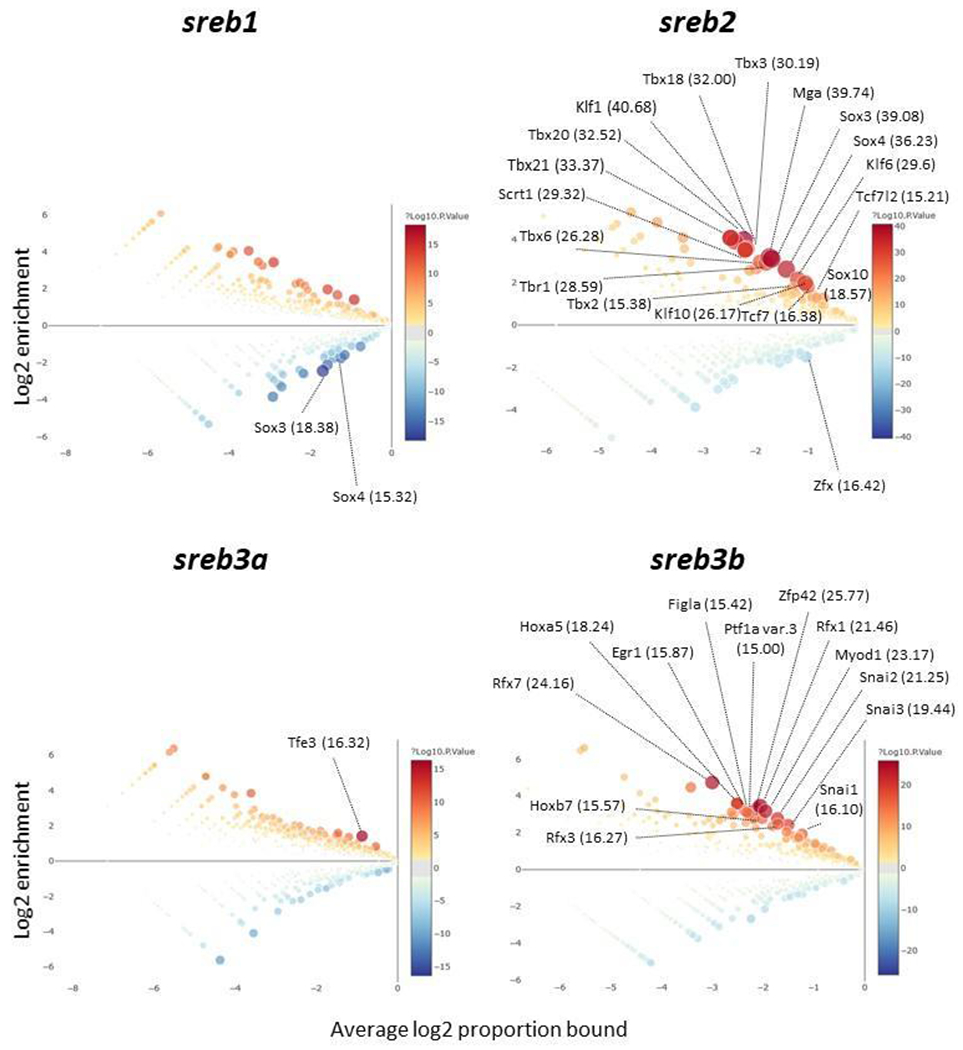
Enrichment analyses in CiiiDER (Gearing et al., 2019) to identify transcription factor binding sites enriched in genomic regions upstream of sreb1 (top left), sreb2 (top right), sreb3a (bottom left), and sreb3b (bottom right). All ray-finned fish species available in Ensembl version 109 were used with 1,500 base pair (bp) upstream regions from each annotated gene start site (see Supplementary Data). Genomic regions for each gene were compared to all others to identify significantly enriched (red circles) or reduced (blue circles) potential sites. Larger circle sizes and darker colors reflect greater significance, and gray circles refer to transcription factor binding sites that are not significantly enriched. Circles with greater average log2 proportion bound values are more ubiquitous in the region. Binding sites with ≥ 15 significance on the −log10(p-value) scale (p < 1e−15) are labeled in parentheses with transcription factor names.
4. Discussion
Brain sreb expression patterns in fish were overall abundant in many forebrain-associated sections. These results are somewhat similar to patterns identified in mammals (Matsumoto et al., 2000, 2005). The conservation of some patterns in the vertebrate brain may support evidence for similar functions across both mammals and fish, which has been identified for roles related to appetite regulation and hypothalamic control of reproduction through the GnRH system (Stein et al., 2016; Wang et al., 2018, 2019; Rajeswari and Unniappan, 2020, Rajeswari et al., 2020; McIlwraith et al., 2022). Indeed, GnRH signaling may be important in these processes, as GnRH-(1-5) may function as a ligand for SREB3, and PNX acts through GnRH to mediate learning and memory (Larco et al., 2013, Treen et al., 2016; Jiang et al., 2015). It has been suggested that the PNX/SREB3 system may compensate for a lack of hypophysiotropic GnRH in zebrafish (Whitlock et al., 2019; Ceriani et al., 2021), which is possibly reflected in the present study where particularly elevated sreb3a expression was detected in zebrafish hypothalamic-containing sections. However, more research is required to better understand these processes, as similar patterns were also evident for zebrafish sreb1 and sreb2.
Most sreb patterns within each species were highly similar to each other. Although redundant functions among these receptors are largely unknown, this has been suggested in prior research where sreb2 knockout mice were viable and exhibited relatively mild phenotypes with no malformations (Matsumoto et al., 2008). There is some evidence of overlapping roles among the receptors in glucose metabolism and neural plasticity (Chopra et al., 2020; Rajeswari et al., 2020; Dolanc et al., 2022; Breton et al., 2022), but few studies have focused on understanding functions across the entire family. This is also complicated by complexity across vertebrate evolution, where gene loss is exhibited in many vertebrate clades, ranging from the loss of sreb1 in some mammals to sreb3 in birds (Staübert et al., 2022). These differences are also evident in fish, where sreb1 and sreb3a are lost in some groups, while the novel sreb3b is gained (Breton et al., 2021). In the present study, there was some evidence for divergence between sreb3a and sreb3b in pufferfish. Brain patterns for pufferfish sreb3a were unique, with no significant relationship to other receptors and dramatic downregulation in overall expression (see Table 1). In contrast, sreb3b was similar to other receptors and expressed at high levels, which more closely matches patterns in other species. Genomic data from across fish evolution also reinforce some similarity between sreb3b and sreb2 (Breton et al., 2021).
The sreb2 and sreb3b genes, unlike other receptors, also shared high conservation of their respective upstream genomic regions. Both were unique from other receptors and exhibited sites with possible roles in development or cell fate. For instance, sreb2 regions exhibited abundant sites for T-box family members, which are commonly associated with brain, limb, and heart development (Wilson and Conlon, 2002; Abrahams et al., 2010; Mihalas and Hevner, 2017). Krüppel-like transcription factor sites were also abundant and are associated with neuronal development and cardiac maintenance (Pearson et al., 2008). Sox family members are involved in the maintenance or early differentiation of neurons (Sarkar and Hochedlinger, 2013; Moreno, 2020). Additionally, sites were abundant for SCRT1, which is associated with both neuron migration and pancreatic β-cell proliferation (Itoh et al., 2013; Sobel et al., 2021). Overall, the highly conserved presence of these sites reinforce roles for fish sreb2 in neuronal development, which will require more research to investigate specific functions.
Upstream regions of sreb3b exhibited a different suite of highly conserved transcription factor binding sites, including multiple Snail and RFX family members. Abundant RFX1, 3, and 7 sites were conserved across fish, which collectively may be involved in cerebellum patterning (Sugiaman-Trapman et al., 2018). The presence of sites for both HOXA5 and HOXB7 also support roles in the adult hindbrain (Sanglioglu et al., 1998; Hutlet et al., 2016). The Snail family consists of highly conserved transcriptional repressors involved in development and carcinogenesis. They act to initiate epithelial-mesenchyme transitions and induce migratory behavior (De Craene et al., 2005; Katoh and Katoh, 2005). The over-representation of Snail members in sreb3b regions may be related to these roles, which will need to be more fully investigated. The EGR1 transcription factor sites may also reinforce this, as this factor is both a regulator of cell proliferation and the extracellular matrix (Havis and Duprez, 2020; Wang et al., 2021). Although additional research is needed to better understand these processes, prior work in the PNX/SREB3 system has identified similar functions in regulating cell migration (Larco et al., 2013; Breton et al., 2022).
Several other sites were also unique to sreb3b regions, including those for the skeletal muscle determining MYOD1 and the oocyte-specific factor in the germline alpha (FIGLA) (Berkes and Tapscott, 2005; Joshi et al., 2007). Peripheral tissue roles for sreb3b are overall not well-studied. However, this receptor likely functions in the vertebrate ovary to promote ovarian development (Nguyen et al., 2019; Rajeswari and Unniappan, 2020). The presence of conserved ZFP42 sites also highlights a connection to reproduction, as this transcription factor is a highly conserved pluripotency marker in the germline (Guallar et al., 2021). Regarding muscle determination, sreb3b-specific expression, but not sreb3a, was previously detected in spotted scat skeletal muscle (Jiang et al., 2022). While these peripheral roles will require more investigation, these analyses highlight how some functions may be highly conserved across fish. A summary of the enriched sites and possible roles is provided in Table 3.
Table 3.
Summary of significantly over- or under-enriched transcription factor binding sites unique to sreb1, sreb2, sreb3a, or sreb3b upstream genomic regions across 70 ray-finned fish genomes. Possible roles for transcription factors based on associated literature are provided.
| Gene | Transcription factors | Enriched | Possible roles |
|---|---|---|---|
| sreb1 | SOX3, SOX4 | Under | Neuron progenitor identity (Pevny and Placzek, 2005; Bergsland et al., 2006) |
| sreb2 | MGA, TBR1, TBX2, TBX3, TBX6, TBX18, TBX20, TBX21 | Over | Brain, limb, and heart development (Abrahams et al., 2010; Mihalas and Hevner, 2017) |
| KLF1, KLF6, KLF10 | Over | Neuron development and cardiac maintenance (Pearson et al., 2008) | |
| SOX3, SOX4, SOX10 | Over | Neuron development and maintenance (Sarkar and Hochedlinger, 2013; Moreno, 2020) | |
| TCF7, TCF7L2 | Over | Mediate canonical Wnt/β-catenin signaling (Jin and Liu, 2008; Yi et al., 2019) | |
| SCRT1 | Over | Neuron migration and pancreatic β cell proliferation (Itoh et al., 2013; Sobel et al., 2021) | |
| ZFX | Under | Promote cell proliferation (Ni et al., 2020) | |
| sreb3a | TFE3 | Over | Glucose and lipid metabolism (Li et al. 2023) |
| sreb3b | RFX1, RFX3, RFX7 | Over | Cerebellum-specific brain patterning (Sugiaman-Trapman et al., 2018) |
| SNAI1, SNAI2, SNAI3 | Over | Epithelial-mesenchyme transition and cell migration (De Craene et al., 2005; Katoh and Katoh, 2005) | |
| HOXA5, HOXB7 | Over | Cerebellar neural circuit formation (Sanlioglu et al., 1998; Hutlet et al., 2016) | |
| EGR1 | Over | Regulator of proliferation and extracellular matrix (Havis and Duprez, 2020; Wang et al., 2021) | |
| FIGLA | Over | Regulation of ovarian folliculogenesis (Joshi et al., 2007) | |
| MYOD1 | Over | Skeletal muscle cell differentiation (Berkes and Tapscott, 2005) | |
| PTF1A var. 3 | Over | Pancreas, forebrain, and hindbrain development (Jin and Xiang, 2019) | |
| ZFP42 | Over | Stem cell self-renewal and pluripotency (Guallar et al., 2012) |
Another conserved pattern was the spatial relationship between sreb genes and dickkopf WNT signaling pathway inhibitor 3a (dkk3a). At least some association involving dkk3a was retained across all three fish species. This gene functions in mammals to inhibit the canonical WNT/β-catenin pathway, thereby acting as a potent tumor suppressor that downregulates cell growth (Veeck and Dahl, 2012; Lee et al., 2020). The gene is also upregulated in mesenchymal lineages during development to mediate the epithelial-mesenchyme transition (Monaghan et al., 1999; Veeck and Dahl, 2012). These roles could also operate through SREB systems, as pufferfish exhibited a significant decrease in hypothalamic dkk3a following PNX treatment (Breton et al., 2022). This association did differ in zebrafish and mummichog though, which instead exhibited positive relationships with the receptors. There is moderate evidence to support anti-proliferative effects of these receptors, as overexpression in mice resulted in brain size decreases, and one receptor may promote differentiation in bone cells (Matsumoto et al., 2008; Gu et al., 2021). The dkk3a gene may be a downstream mediator of the system, but it warrants further investigation and functional research to better understand these roles.
5. Conclusions
Overall, fish exhibited abundant sreb expression in forebrain-related regions, but not all patterns were highly conserved. Zebrafish hypothalamic-containing sections exhibited particularly elevated expression of the receptor family, and sreb3a and sreb3b patterns diverged in pufferfish. Across many fish genomes, both sreb2 and sreb3b upstream genomic regions were also unique among the receptors, with highly conserved binding sites for many transcription factors. Additionally, one possible downstream mediator of PNX signaling, dkk3a, was spatially correlated to these receptors in all three fish species. Further research using in situ hybridizations will be needed to more fully assess spatial expression patterns in specific hypothalamic nuclei related to reproduction in fish. In addition, functional approaches will be critical to assess specific transcription factor and dkk3a roles in these systems. Overall, this research highlights novel future directions to better understand vertebrate SREBs.
Supplementary Material
Highlights:
Sreb gene expression was abundant in forebrain regions in fish.
Sreb3a and sreb3b exhibited different expression patterns in a pufferfish species.
Sreb2 and sreb3b genomic regions exhibited unique and conserved transcription factor binding sites.
Expression patterns for dkk3a exhibited similarity to sreb receptors in all species studied.
Acknowledgements
Research reported in this project was supported by an Institutional Development Award (IDeA) from the National Institute of General Medical Sciences of the National Institutes of Health under grant number P20GM103423. Support was also provided by a Maine-INBRE Research Resources Core grant and the University of Maine at Farmington. We thank Alexandra Ceurvorst and Chris Smith from the MDI Biological Laboratory (MDIBL) for assistance with animal sampling. We also thank Heath Fuqua and Joel Graber from MDIBL for help with comparative genomics approaches, as well as Benjamin King from the University of Maine for assistance with transcription factor binding site analyses.
Footnotes
Publisher's Disclaimer: This is a PDF file of an unedited manuscript that has been accepted for publication. As a service to our customers we are providing this early version of the manuscript. The manuscript will undergo copyediting, typesetting, and review of the resulting proof before it is published in its final form. Please note that during the production process errors may be discovered which could affect the content, and all legal disclaimers that apply to the journal pertain.
Declaration of interests
The authors declare that they have no known competing financial interests or personal relationships that could have appeared to influence the work reported in this paper.
References
- Abrahams A, Parker MI, Prince S 2010. The T-box transcription factor Tbx2: its role in development and possible implication in cancer. IUBMB Life 62, 92–102. 10.1002/iub.275. [DOI] [PubMed] [Google Scholar]
- Adamski MG, Gumann P, Baird AE 2014. A method for quantitative analysis of standard and high-throughput qPCR expression data based on input sample quantity. PloS One 9, e103917. 10.1371/journal.pone.0103917. [DOI] [PMC free article] [PubMed] [Google Scholar]
- Bayrak A, Hanson J, Laufer S, Pillaiyar T, 2022. Super-conserved receptors expressed in the brain: biology and medicinal chemistry efforts. Future Med. Chem 14, 899–913. 10.4155/fmc-2022-0006. [DOI] [PubMed] [Google Scholar]
- Bergsland M, Werme M, Malewicz M, Perlmann T, Muhr J 2006. Genes Dev. 20, 3475–3486. 10.1101/gad.403406. [DOI] [PMC free article] [PubMed] [Google Scholar]
- Berkes CA, Tapscott SJ 2005. MyoD and the transcriptional control of myogenesis. Sem. Cell Dev. Biol 16, 585–595. 10.1016/j.semcdb.2005.07.006. [DOI] [PubMed] [Google Scholar]
- Billert M, Kołodziejski PA, Strowski MZ, Nowak KW, Skrzypski M 2019. Phoenixin-14 stimulates proliferation and insulin secretion in insulin producing INS-1E cells. Biochim. Biophys. Acta – Mol. Cell Res 1866, 118533. 10.1016/j.bbamcr.2019.118533. [DOI] [PubMed] [Google Scholar]
- Bloch S, Thomas M, Colin I, Galant S, Machado E, Affaticati P, Jenett A, Yamamoto K 2019. Mesencephalic origin of the inferior lobe in zebrafish. BMC Biol. 17, 22. 10.1186/s12915-019-0631-y. [DOI] [PMC free article] [PubMed] [Google Scholar]
- Breton TS, DiMaggio MA, Sower SA and Berlinsky DL 2015. Brain aromatase (cyp19a1b) and gonadotropin releasing hormone (gnrh2 and gnrh3) expression during reproductive development and sex change in black sea bass (Centropristis striata). Comp. Biochem. Physiol. Part A: Mol. Integr. Physiol 181, 45–53. 10.1016/j.cbpa.2014.11.020. [DOI] [PubMed] [Google Scholar]
- Breton TS, Kenter LW, Greenlaw K, Montgomery J, Goetz GW, Berlinsky DL, Luckenbach JA 2019. Initiation of sex change and gonadal gene expression in black sea bass (Centropristis striata) exposed to exemestane, an aromatase inhibitor. Comp. Biochem. Physiol. Part A: Mol. Integr. Physiol 228, 51–61. 10.1016/j.cbpa.2018.10.024. [DOI] [PMC free article] [PubMed] [Google Scholar]
- Breton TS, Sampson WGB, Clifford B, Phaneuf AM, Smidt I, True T, Wilcox AR, Lipscomb T, Murray C, DiMaggio MA 2021. Characterization of the G protein-coupled receptor family SREB across fish evolution. Sci Rep 11, 12066. 10.1038/s41598-021-91590-9. [DOI] [PMC free article] [PubMed] [Google Scholar]
- Breton TS, Murray CA, Huff SR, Phaneuf AM, Tripp BM, Patuel SJ, Martyniuk CM, DiMaggio MA 2022. Phoenixin-14 alters transcriptome and steroid profiles in female green-spotted puffer (Dichotomyctere nigroviridis). Sci Rep 12, 9454. 10.1038/s41598-022-13695-z. [DOI] [PMC free article] [PubMed] [Google Scholar]
- Ceriani R, Calfún C, Whitlock KE 2021. phoenixin (smim20), a gene coding for a novel reproductive ligand, is expressed in the brain of adult zebrafish. Gene Expr. Patterns 39, 119164. 10.1016/j.gep.2020.119164. [DOI] [PubMed] [Google Scholar]
- Chen Q, Kogan JH, Gross AK, Zhou Y, Walton NM, Shin R, Heusner CL, Miyake S, Tajinda K, Tamura K, Matsumoto M 2012. SREB2/GPR85, a schizophrenia risk factor, negatively regulates hippocampal adult neurogenesis and neurogenesis-dependent learning and memory. Eur. J. Neurosci 36, 2597–2608. 10.1111/j.1460-9568.2012.08180.x. [DOI] [PMC free article] [PubMed] [Google Scholar]
- Chopra DG, Yiv N, Hennings TG, Zhang Y, Ku GM, 2020. Deletion of Gpr27 in vivo reduces insulin mRNA but does not result in diabetes. Sci. Rep 10, 5629. 10.1038/s41598-020-62358-4. [DOI] [PMC free article] [PubMed] [Google Scholar]
- Cunningham F, Allen JE, Allen J, Alvarez-Jarreta J, Amode MR, Armean IM, Austine-Orimoloye O, Azov AG, Barnes I, Bennett R, Berry A 2022. Ensembl 2022. Nucl. Acids Res 50, pp.D988–D995. 10.1093/nar/gkab1049. [DOI] [PMC free article] [PubMed] [Google Scholar]
- Davenport AP, Alexander SP, Sharman JL, Pawson AJ, Benson HE, Monaghan AE, Liew WC, Mpamhanga CP, Bonner TI, Neubig RR, Pin JP, Spedding M, Harmar AJ 2013. International Union of Basic and Clinical Pharmacology. LXXXVIII. G protein-coupled receptor list: recommendations for new pairings with cognate ligands. Pharmacol. Rev 65, 967–986. 10.1124/pr.112.007179. [DOI] [PMC free article] [PubMed] [Google Scholar]
- De Craene B, Van Roy F, Berx G 2005. Unraveling signalling cascades for the Snail family of transcription factors. Cell. Signal 17, 535–547. 10.1016/j.cellsig.2004.10.011. [DOI] [PubMed] [Google Scholar]
- Dolanc D, Zorec TM, Smole Z, Maver A, Horvat A, Pillaiyar T, Trkov Bobnar S, Vardjan N, Kreft M, Chowdhury HH, Zorec R 2022. The activation of GPR27 increases cytosolic L-lactate in 3T3 embryonic cells and astrocytes. Cells 11, 1009. 10.3390/cells11061009. [DOI] [PMC free article] [PubMed] [Google Scholar]
- Fornes O, Castro-Mondragon JA, Khan A, Van der Lee R, Zhang X, Richmond PA, Modi BP, Correard S, Gheorghe M, Baranaţić D, Santana-Garcia W 2020. JASPAR 2020: update of the open-access database of transcription factor binding profiles. Nucl. Acids Res 48, D87–D92. 10.1093/nar/gkz1001. [DOI] [PMC free article] [PubMed] [Google Scholar]
- Fujita-Jimbo E, Tanabe Y, Yu Z, Kojima K, Mori M, Li H, Iwamoto S, Yamagata T, Momoi MY, Momoi T 2015. The association of GPR85 with PSD-95-neuroligin complex and autism spectrum disorder: a molecular analysis. Mol. Autism 6, 1–10. 10.1186/s13229-015-0012-5. [DOI] [PMC free article] [PubMed] [Google Scholar]
- Gearing LJ, Cumming HE, Chapman R, Finkel AM, Woodhouse IB, Luu K, Gould JA, Forster SC, Hertzog PJ 2019. CiiiDER: A tool for predicting and analysing transcription factor binding sites. PLoS One 14, e0215495. doi: 10.1371/journal.pone.0215495. [DOI] [PMC free article] [PubMed] [Google Scholar]
- Gu Z, Xie D, Ding R, Huang C, Qiu Y 2021. GPR173 agonist phoenixin 20 promotes osteoblastic differentiation of MC3T3-E1 cells. Aging 13, 4976. 10.18632/aging.103717. [DOI] [PMC free article] [PubMed] [Google Scholar]
- Guallar D, Pérez-Palacios R, Climent M, Martínez-Abadiá I, Larraga A, Fernández-Juan M, Vallejo C, Muniesa P, Schoorlemmer J, 2012. Expression of endogenous retroviruses is negatively regulated by the pluripotency marker Rex1/Zfp42. Nucl. Acids Res 40, 8993–9007. 10.1093/nar/gks686. [DOI] [PMC free article] [PubMed] [Google Scholar]
- Hauser AS, Attwood MM, Rask-Andersen M, Schiáth HB, Gloriam DE, 2017. Trends in GPCR drug discovery: new agents, targets and indications. Nat. Rev. Drug Discov 16, 829–842. 10.1038/nrd.2017.178. [DOI] [PMC free article] [PubMed] [Google Scholar]
- Havis E, Duprez D, 2020. EGR1 transcription factor is a multifaceted regulator of matrix production in tendons and other connective tissues. Int. J. Mol. Sci 21, 1664. 10.3390/ijms21051664. [DOI] [PMC free article] [PubMed] [Google Scholar]
- He L, Shi H, Zhang G, Peng Y, Ghosh A, Zhang M, Hu X, Liu C, Shao Y, Wang S and Chen L, 2023. A novel CCK receptor GPR173 mediates potentiation of GABAergic inhibition. J. Neurosci 43, 2305–2325. 10.1523/JNEUROSCI.2035-22.2023. [DOI] [PMC free article] [PubMed] [Google Scholar]
- Hellebrand S, Schaller HC, Wittenberger T, 2000. The brain-specific G-protein coupled receptor GPR85 with identical protein sequence in man and mouse maps to human chromosome 7q31. Biochim. Biophys. Acta 1493, 269–272. 10.1016/S0167-4781(00)00182-2. [DOI] [PubMed] [Google Scholar]
- Hutlet B, Theys N, Coste C, Ahn M-T, Doshishti-Agolli K, Lizen B, Gofflot F 2014. Systematic expression analysis of Hox genes at adulthood reveals novel patterns in the central nervous system. Brain Struct. Funct 221, 1223–1243. 10.1007/s00429-014-0965-8. [DOI] [PubMed] [Google Scholar]
- Itoh Y, Moriyama Y, Hasegawa T, Endo TA, Toyoda T, Gotoh Y 2013. Scratch regulates neuronal migration onset via an epithelial-mesenchymal transition-like mechanism. Nat. Neurosci 16, 416–425. 10.1038/nn.3336. [DOI] [PubMed] [Google Scholar]
- Jiang JH, He Z, Peng YL, Jin WD, Wang Z, Mu LY, Chang M, Wang R 2015. Phoenixin-14 enhances memory and mitigates memory impairment induced by Aβ1-42 and scopolamine in mice. Brain Res, 1629, 298–308. 10.1016/j.brainres.2015.10.030. [DOI] [PubMed] [Google Scholar]
- Jiang M, Liu J, Jiang D, Pan Q, Shi H, Huang Y, Zhu C, Li G, Deng S 2022. Characterization and expression analysis of gpr173a and gpr173b revealed their involvement in reproductive regulation in spotted scat (Scatophagus argus). Aquacult. Rep 25, 101239. 10.1016/j.aqrep.2022.101239. [DOI] [Google Scholar]
- Jin T, Liu L 2008. The Wnt signaling pathway effector TCF7L2 and type 2 diabetes mellitus. Mol. Endocrinol 22, 2383–2392. 10.1210/me.2008-0135. [DOI] [PubMed] [Google Scholar]
- Jin K, Xiang M, 2018. Transcription factor Ptf1a in development, diseases and reprogramming. Cell. Mol. Life Sci 76, 921–940. 10.1007/s00018-018-2972-z. [DOI] [PMC free article] [PubMed] [Google Scholar]
- Joshi S, Davies H, Sims LP, Levy SE, Dean J 2007. Ovarian gene expression in the absence of FIGLA, an oocyte-specific transcription factor. BMC Dev. Biol 7, 1–13. 10.1186/1471-213X-7-67. [DOI] [PMC free article] [PubMed] [Google Scholar]
- Katoh M, Katoh M, 2003. Identification and characterization of human SNAIL3 (SNAI3) gene in silico. Intl. J. Mol. Med 11, 383–388. 10.3892/ijmm.11.3.383. [DOI] [PubMed] [Google Scholar]
- Khamis AM, Motwalli O, Oliva R, Jankovic BR, Medvedeva YA, Ashoor H, Essack M, Gao X, Bajic VB 2018. A novel method for improved accuracy of transcription factor binding site prediction. Nucl. Acids Res 46, e72–e72. doi: 10.1093/nar/gky237. [DOI] [PMC free article] [PubMed] [Google Scholar]
- Khan MZ, He L, 2017. Neuro-psychopharmacological perspective of Orphan receptors of Rhodopsin (class A) family of G protein-coupled receptors. Psychopharmacol. 234, 1181–1207. 10.1007/s00213-017-4586-9. [DOI] [PubMed] [Google Scholar]
- Ku GM, Pappalardo Z, Luo CC, German MS, McManus MT, 2012. An siRNA screen in pancreatic beta cells reveals a role for Gpr27 in insulin production. PLoS Genetics 8, e1002449. 10.1371/journal.pgen.1002449. [DOI] [PMC free article] [PubMed] [Google Scholar]
- Larco DO, Semsarzadeh NN, Cho-Clark M, Mani SK, Wu JT 2013. The novel actions of the metabolite GnRH-(1-5) are mediated by a G protein-coupled receptor. Front. Endocrinol 4, 83. 10.3389/fendo.2013.00083. [DOI] [PMC free article] [PubMed] [Google Scholar]
- Laschet C, Dupuis N, Hanson J 2018. The G protein-coupled receptors deorphanization landscape. Biochem. Pharmacol 153, 62–74. 10.1016/j.bcp.2018.02.016. [DOI] [PubMed] [Google Scholar]
- Le Bras A 2021. A genome-wide map of regulatory elements in zebrafish. Lab Anim. 50, 17–17. 10.1038/s41684-020-00695-7. [DOI] [Google Scholar]
- Lee EJ, Nguyen QTT, Lee M 2020. Dickkopf-3 in human malignant tumours: a clinical viewpoint. Anticancer Res. 40, 5969–5979. 10.21873/anticanres.14617. [DOI] [PubMed] [Google Scholar]
- Li Y, Liu Y, Yang H, Zhang T, Naruse K, Tu Q, 2020. Dynamic transcriptional and chromatin accessibility landscape of medaka embryogenesis. Genom. Res 30, 924–937. 10.1101/gr.258871.119. [DOI] [PMC free article] [PubMed] [Google Scholar]
- Li X, Chen Y, Gong S, Chen X, Liu H, Li X, Hao J 2023. Emerging roles of TFE3 in metabolic regulation. Cell Death Discov. 9, 93. 10.1038/s41420-023-01395-0. [DOI] [PMC free article] [PubMed] [Google Scholar]
- Matsumoto M, Saito T, Takasaki J, Kamohara M, Sugimoto T, Kobayashi M, Tadokoro M, Matsumoto SI, Ohishi T, Furuichi K, 2000. An evolutionarily conserved G-protein coupled receptor family, SREB, expressed in the central nervous system. Biochem. Biophys. Res. Comm 272, 576–582. 10.1006/bbrc.2000.2829. [DOI] [PubMed] [Google Scholar]
- Matsumoto M, Beltaifa S, Weickert CS, Herman MM, Hyde TM, Saunders RC, Lipska BK, Weinberger DR, Kleinman JE 2005. A conserved mRNA expression profile of SREB2 (GPR85) in adult human, monkey, and rat forebrain. Mol. Brain Res 138, 58–69. 10.1016/j.molbrainres.2005.04.002. [DOI] [PubMed] [Google Scholar]
- Matsumoto M, Straub RE, Marenco S, Nicodemus KK, Matsumoto SI, Fujikawa A, Miyoshi S, Shobo M, Takahashi S, Yarimizu J, Yuri M, Hiramoto M, Morita S, Yokota H, Sasayama T, Terai K, Yoshino M, Miyake A, Callicott JH, Egan MF, Meyer-Lindberg A, Kempf L, Honea R, Vakkalanka RK, Takasaki J, Kamohara M, Soga T, Hiyama H, Ishii H, Matsuo A, Nishimura S, Matsuoka N, Kobori M, Matsushime H, Katoh M, Furuichi K, Weinberger DR 2008. The evolutionarily conserved G protein-coupled receptor SREB2/GPR85 influences brain size, behavior, and vulnerability to schizophrenia. Proc. Natl. Acad. Sci 105, 6133–6138. 10.1073/pnas.0710717105. [DOI] [PMC free article] [PubMed] [Google Scholar]
- McCurley AT, Callard GV 2008. Characterization of housekeeping genes in zebrafish: male-female differences and effects of tissue type, developmental stage and chemical treatment. BMC Mol. Biol 9, 102. 10.1186/1471-2199-9-102. [DOI] [PMC free article] [PubMed] [Google Scholar]
- McIlwraith EK, Belsham DD 2018. Phoenixin: uncovering its receptor, signaling and functions. Acta Pharmacol. Sin 39, 774–778. 10.1038/aps.2018.13. [DOI] [PMC free article] [PubMed] [Google Scholar]
- McIlwraith EK, Loganathan N, Belsham DD 2019. Regulation of Gpr173 expression, a putative phoenixin receptor, by saturated fatty acid palmitate and endocrine-disrupting chemical bisphenol A through a p38-mediated mechanism in immortalized hypothalamic neurons. Mol. Cell. Endocrinol 485, 54–60. 10.1016/j.mce.2019.01.026. [DOI] [PubMed] [Google Scholar]
- McIlwraith EK, Zhang N, Belsham DD 2022. The regulation of phoenixin: A fascinating multidimensional peptide. J. Endo. Soc 6, bvab192. 10.1210/jendso/bvab192. [DOI] [PMC free article] [PubMed] [Google Scholar]
- Mihalas AB and Hevner RF, 2017. Control of neuronal development by T-box genes in the brain. Curr. Top. Dev. Biol 122, 279–312. 10.1016/bs.ctdb.2016.08.001. [DOI] [PubMed] [Google Scholar]
- Monaghan AP, Kioschis P, Wu W, Zuniga A, Bock D, Poustka A, Delius H, Niehrs C 1999. Dickkopf genes are co-ordinately expressed in mesodermal lineages. Mech. Dev 87, 45–56. 10.1016/S0925-4773(99)00138-0. [DOI] [PubMed] [Google Scholar]
- Moreno CS SOX4: The unappreciated oncogene. Semin. Cancer Biol 67, 57–64. 10.1016/j.semcancer.2019.08.027. [DOI] [PMC free article] [PubMed] [Google Scholar]
- Nguyen XP, Nakamura T, Osuka S, Bayasula B, Nakanishi N, Kasahara Y, Muraoka A, Hayashi S, Nagai T, Murase T, Goto M 2019. Effect of the neuropeptide phoenixin and its receptor GPR173 during folliculogenesis. Reprod. 158, 25–34. 10.1530/REP-19-0025. [DOI] [PubMed] [Google Scholar]
- Ni W, Perez AA, Schreiner S, Nicolet CM, Farnham PJ 2020. Characterization of the ZFX family of transcription factors that bind downstream of the start site of CpG island promoters. Nucl. Acids Res 48, 5986–6000. 10.1093/nar/gkaa384. [DOI] [PMC free article] [PubMed] [Google Scholar]
- O’Dowd BF, Nguyen T, Marchese A, Cheng R, Lynch KR, Heng HH, Kolakowski LF Jr, George SR, 1998. Discovery of three novel G-protein-coupled receptor genes. Genomics, 47, 310–313. 10.1006/geno.1998.5095. [DOI] [PubMed] [Google Scholar]
- Pearson R, Fleetwood J, Eaton S, Crossley M, Bao S, 2008. Krüppel-like transcription factors: a functional family. Intl. J. Biochem. Cell Biol 40, 1996–2001. 10.1016/j.biocel.2007.07.018. [DOI] [PubMed] [Google Scholar]
- Pevny L, Placzek M 2005. SOX genes and neural progenitor identity. Curr. Opin. Neurobiol 15, 7–13. 10.1016/j.conb.2005.01.016. [DOI] [PubMed] [Google Scholar]
- Rajeswari JJ, Unniappan S 2020. Phoenixin-20 stimulates mRNAs encoding hypothalamo-pituitary-gonadal hormones, is pro-vitellogenic, and promotes oocyte maturation in zebrafish. Sci. Rep 10, 1–19. 10.1038/s41598-020-63226-x. [DOI] [PMC free article] [PubMed] [Google Scholar]
- Rajeswari JJ, Blanco AM, Unniappan S 2020. Phoenixin-20 suppresses food intake, modulates glucoregulatory enzymes, and enhances glycolysis in zebrafish. Am. J. Physiol. Reg. Integr. Comp. Physiol 318, R917–R928. 10.1152/ajpregu.00019.2020. [DOI] [PMC free article] [PubMed] [Google Scholar]
- Sanlioglu S, Zhang X, Baader SL, Oberdick J 1998. Regulation of a purkinje cell–specific promoter by homeodomain proteins: repression by engrailed-2 vs. synergistic activation by hoxa5 and hoxb7. J. Neurobiol 36, 559–571. 10.1002/(SICI)1097-4695(19980915)36:4<559::AID-NEU9>3.0.CO;2-V. [DOI] [PubMed] [Google Scholar]
- Sarkar A, Hochedlinger K 2013. The sox family of transcription factors: versatile regulators of stem and progenitor cell fate. Cell Stem Cell 12, 15–30. 10.1016/j.stem.2012.12.007. [DOI] [PMC free article] [PubMed] [Google Scholar]
- Sobel J, Guay C, Elhanani O, Rodriguez-Trejo A, Stoll L, Menoud V, Jacovetti C, Walker MD, Regazzi R 2021. Scrt1, a transcriptional regulator of β-cell proliferation identified by differential chromatin accessibility during islet maturation. Sci. Rep 11, 8800. 10.1038/s41598-021-88003-2. [DOI] [PMC free article] [PubMed] [Google Scholar]
- Sugiaman-Trapman D, Vitezic M, Jouhilahti EM, Mathelier A, Lauter G, Misra S, Daub CO, Kere J, Swoboda P 2018. Characterization of the human RFX transcription factor family by regulatory and target gene analysis. BMC Genom. 19, 1–15. 10.1186/s12864-018-4564-6. [DOI] [PMC free article] [PubMed] [Google Scholar]
- Stäubert C, Wozniak M, Dupuis N, Laschet C, Pillaiyar T, Hanson J, 2022. Superconserved receptors expressed in the brain: Expression, function, motifs and evolution of an orphan receptor family. Pharmacol. Ther 240, 108217. 10.1016/j.pharmthera.2022.108217. [DOI] [PubMed] [Google Scholar]
- Stein LM, Tullock CW, Mathews SK, Garcia-Galiano D, Elias CF, Samson WK, Yosten GL 2016. Hypothalamic action of phoenixin to control reproductive hormone secretion in females: importance of the orphan G protein-coupled receptor Gpr173. Am. J. Physiol. Regul 311, R489–R496. 10.1152/ajpregu.00191.2016. [DOI] [PMC free article] [PubMed] [Google Scholar]
- Treen AK, Luo V, Belsham DD 2016. Phoenixin activates immortalized GnRH and kisspeptin neurons through the novel receptor GPR173. Mol. Endocrinol 30, 872–888. 10.1210/me.2016-1039. [DOI] [PMC free article] [PubMed] [Google Scholar]
- Wang M, Deng SP, Chen HP, Jiang DN, Tian CX, Yang W, Wu TL, Zhu CH, Zhang Y, Li GL 2018. Phoenixin participated in regulation of food intake and growth in spotted scat, Scatophagus argus. Comp. Biochem. Physiol. Part B Biochem. Mol. Biol 226, 36–44. 10.1016/j.cbpb.2018.07.007. [DOI] [PubMed] [Google Scholar]
- Wang M, Chen HP, Zhai Y, Jiang DN, Liu JY, Tian CX, Wu TL, Zhu CH, Deng SP, Li GL 2019. Phoenixin: Expression at different ovarian development stages and effects on genes ralated to reproduction in spotted scat, Scatophagus argus. Comp. Biochem. Physiol. Part B: Biochem. Mol. Biol 228, 17–25. 10.1016/j.cbpb.2018.10.005. [DOI] [PubMed] [Google Scholar]
- Wang B, Guo H, Yu H, Chen Y, Xu H, Zhao G, 2021. The role of the transcription factor EGR1 in cancer. Front. Oncol 11, 642547. doi: 10.3389/fonc.2021.642547. [DOI] [PMC free article] [PubMed] [Google Scholar]
- Whitlock KE, Postlethwait J, Ewer J 2019. Neuroendocrinology of reproduction: is gonadotropin-releasing hormone (GnRH) dispensable?. Front. Neuroendocrinol 53, 100738. 10.1016/j.yfrne.2019.02.002. [DOI] [PMC free article] [PubMed] [Google Scholar]
- Veeck J, Dahl E 2012. Targeting the Wnt pathway in cancer: the emerging role of Dickkopf-3. Biochim. Biophys. Acta Rev. Cancer 1825, 18–28. 10.1016/j.bbcan.2011.09.003. [DOI] [PubMed] [Google Scholar]
- Wilson V, Conlon FL 2002. The T-box family. Genom. Biol 3, 1–7. 10.1186/gb-2002-3-6-reviews3008. [DOI] [PMC free article] [PubMed] [Google Scholar]
- Yañez-Guerra LA, Thiel D, Jékely G, 2022. Premetazoan origin of neuropeptide signaling. Mol. Biol. Evol 39, msac051. 10.1093/molbev/msac051. [DOI] [PMC free article] [PubMed] [Google Scholar]
- Yang H, Luan Y, Liu T, Lee HJ, Fang L, Wang Y, Wang X, Zhang B, Jin Q, Ang KC, Xing X, Wang J, Xu J, Song F, Sriranga I, Khunsriraksakul C, Salameh T, Li D, Choudhary MNK, Topczewski J, Wang K, Gerhard GS, Hardison RC, Wang T, Cheng KC, Yue F 2020. A map of cis-regulatory elements and 3D genome structures in zebrafish. Nature 588, 37–343. 10.1038/s41586-020-2962-9. [DOI] [PMC free article] [PubMed] [Google Scholar]
- Ye B, Li L, Xu Haodong, Chen Y, F Li. 2019. Opposing roles of TCF7/LEF1 and TCF7L2 in cyclin D2 and Bmp4 expression and cardiomyocyte cell cycle control during late heart development. Lab. Invest 99, 807–818. 10.1038/s41374-019-0204-2. [DOI] [PMC free article] [PubMed] [Google Scholar]
- Yosten GL, Lyu RM, Hsueh AJ, Avsian-Kretchmer O, Chang JK, Tullock CW, Dun SL, Dun N and Samson WK 2013. A novel reproductive peptide, phoenixin. J. Neuroendocrinol 25, 206–215. 10.1111/j.1365-2826.2012.02381.x. [DOI] [PMC free article] [PubMed] [Google Scholar]
- Zhang T, Zhang Z, Dong Q, Xiong J, Zhu B 2020. Histone H3K27 acetylation is dispensable for enhancer activity in mouse embryonic stem cells. Genom. Biol 21, 1–7. 10.1186/s13059-020-01957-w. [DOI] [PMC free article] [PubMed] [Google Scholar]
Associated Data
This section collects any data citations, data availability statements, or supplementary materials included in this article.