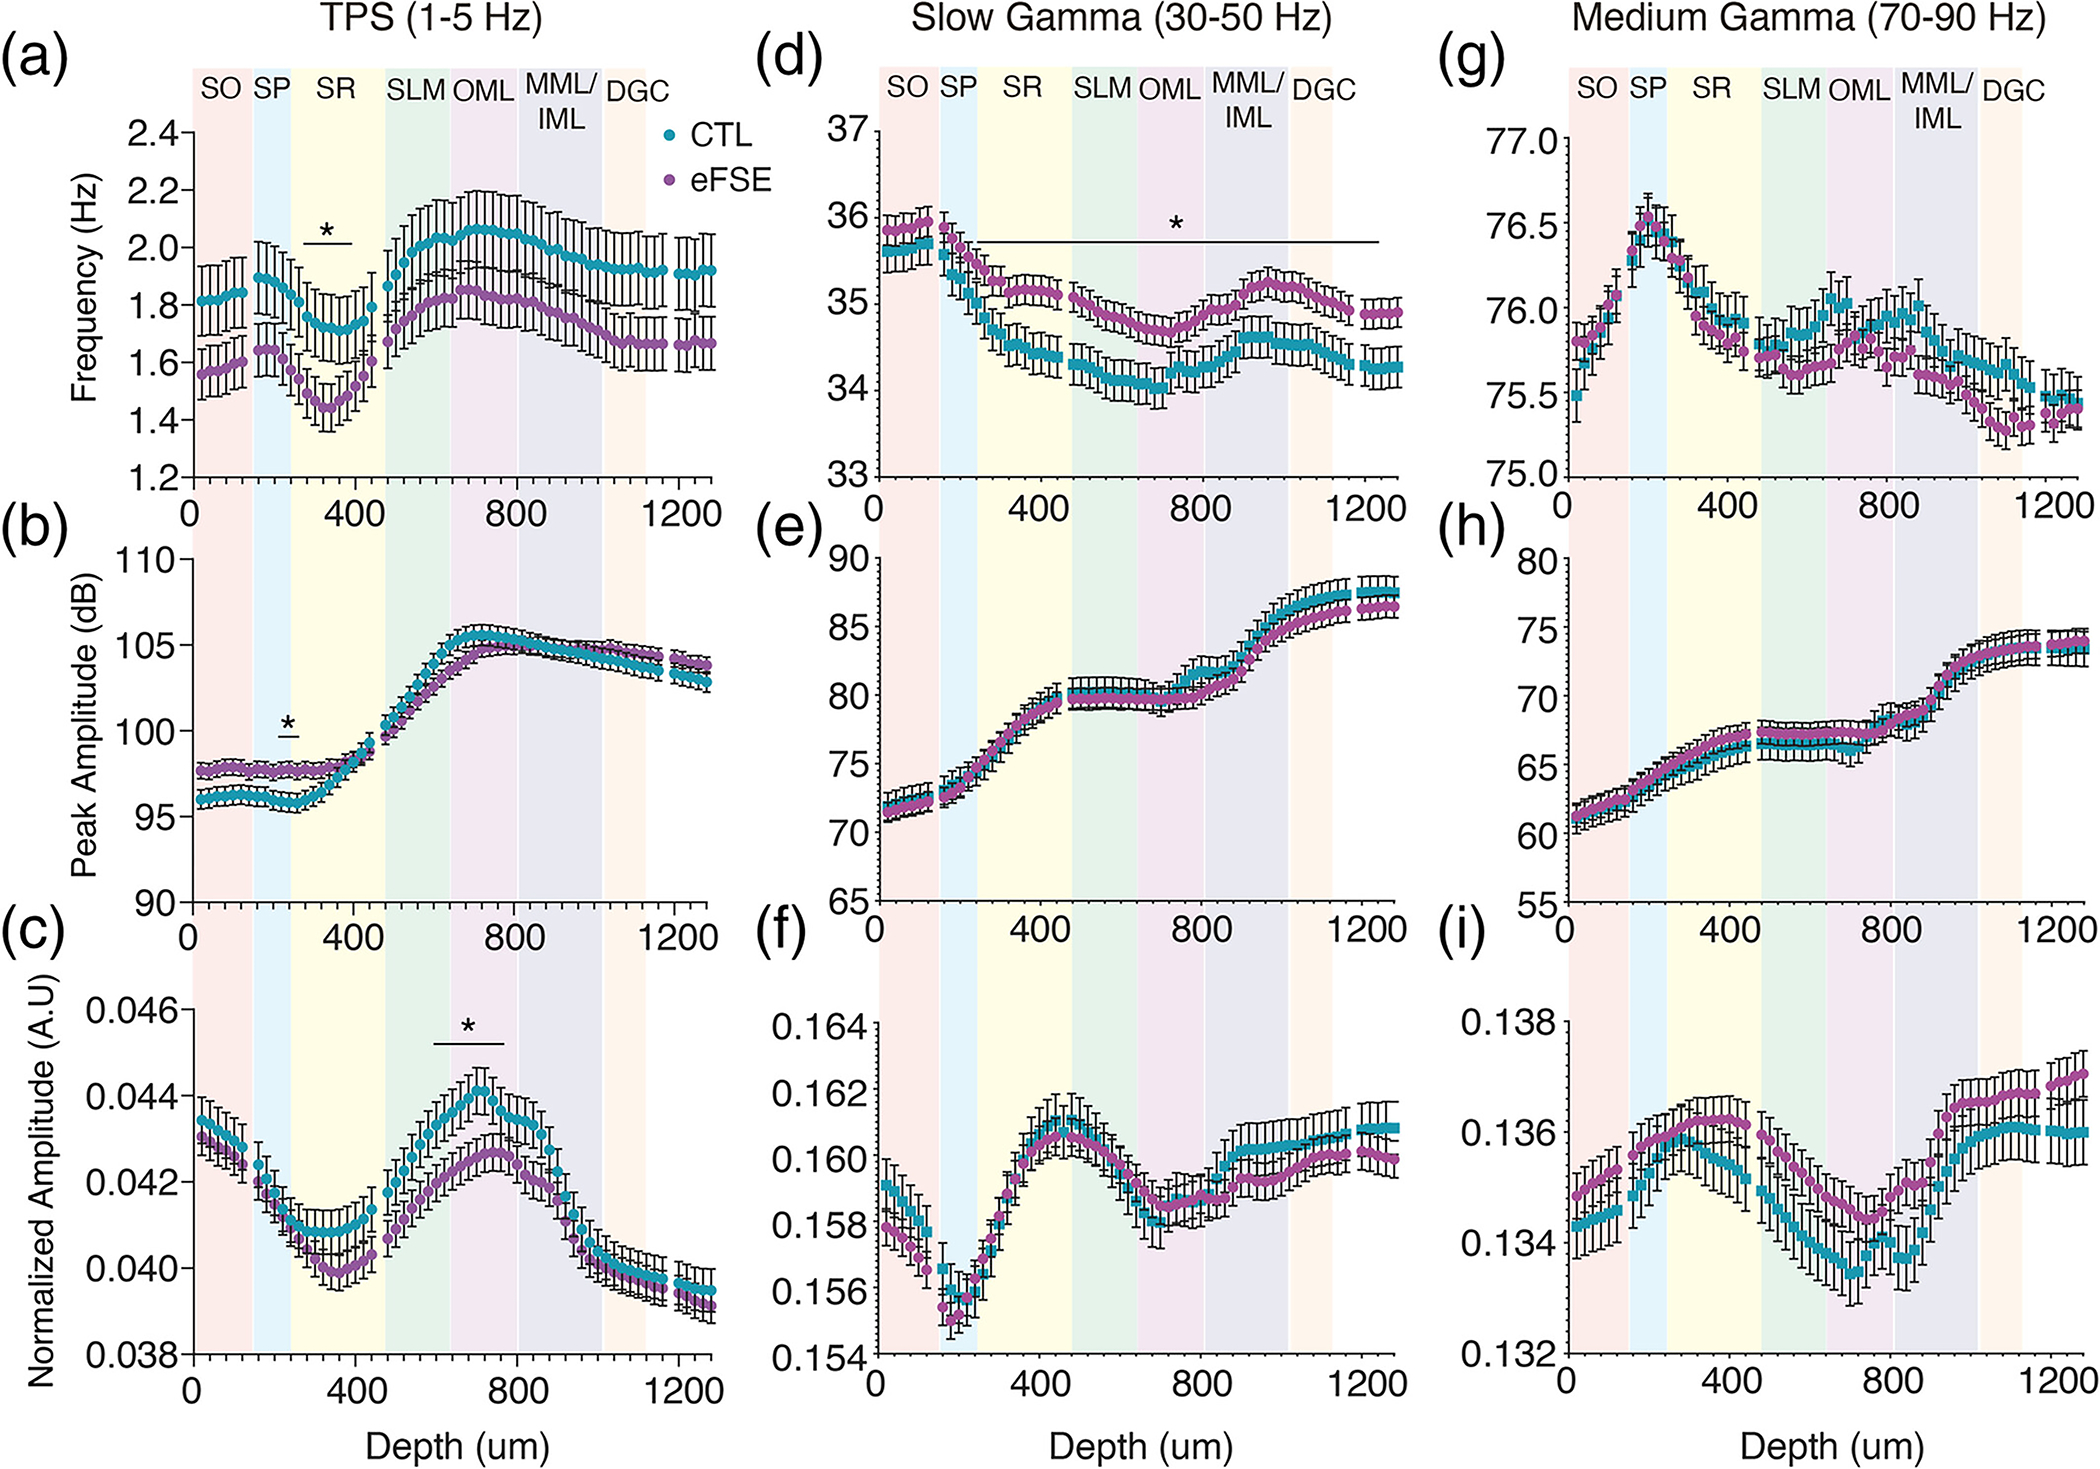
FIGURE 7.

CTL and eFSE mean spectral properties as a function of depth shows specific alterations of hippocampal oscillations. Frequency, peak amplitude, and normalized amplitude of: (a)–(c) LFPs filtered at slow theta (1–5 Hz); (d)–(f) slow gamma (30–50 Hz); and (g)–(i) medium gamma (70–90 Hz). Slow theta peak and normalized power were similar between CTL and eFSE rats. In eFSE rats, theta frequencies were slower at 1–5 Hz and faster at 30–50 Hz oscillations by depth. Normalized 1–5 Hz LFP amplitude was lower in eFSE animals than CTL between SLM and OML, consistent with Figure 6. Slow oscillations are largest in the SLM-OML region while gamma oscillations are largest in SR and the MML-DGC regions.
