Abstract
This longitudinal study examines the association between bedroom nighttime temperature and sleep quality in a sample of community dwelling older adults. Using wearable sleep monitors and environmental sensors, we assessed sleep duration, efficiency, and restlessness over an extended period within participants’ homes while controlling for potential confounders and covariates. Our findings demonstrated that sleep was most efficient and restful when nighttime ambient temperature ranged between 20–25°C, with a clinically relevant 5–10% drop in sleep efficiency when the temperature increased from 25°C to 30°C. The associations were primarily nonlinear, and substantial between-subject variations were observed. These results highlight the potential to enhance sleep quality in older adults by optimizing home thermal environments and emphasize the importance of personalized temperature adjustments based on individual needs and circumstances. Additionally, our study underscores the potential impact of climate change on sleep quality in older adults, particularly those with lower socioeconomic status, and supports increasing their adaptive capacity in the face of a changing climate.
Keywords: Sleep, Older adults, Temperature, Wearable, Environment
INTRODUCTION
Background/rationale
Older adults often experience inadequate, restless, and disrupted sleep (henceforth, poor sleep) which in turn influences many outcomes related to their health and wellbeing such as cognitive and physical function, mood and affect, irritability and reaction to stress, productivity, diabetes management, and risk of cardiovascular diseases1–12. Indeed, poor sleep is disproportionately more common among older adults4,13. Meanwhile, research on its causes has been mostly focused on physiological and behavioral factors despite evidence suggesting that the environment the person sleeps in can be as influential. As a result, while numerous medical and behavioral interventions have been developed to improve outcomes related to sleep, the potential of environmental interventions have been largely overlooked.
Within this context, the link between home ambient temperature and sleep within older adults is a potential target for improving sleep. In laboratory-based studies, the ambient thermal environment has been shown to exert a strong causal relationship to the timing and quality of sleep14–16. Although establishing a causal relationship is challenging outside the lab, evidence suggests that naturally occurring changes in ambient temperature also impact sleep, especially when the built environment does not adequately protect individuals from variations in outdoor temperature. For example, Yetish et al. investigated sleep in three preindustrial societies and reported ambient temperature as a “major regulator” of sleep duration and timing 17. Within a modern built environment, housing and its heating and cooling systems can, at least in theory, decouple indoor temperature from that of the outdoor thermal environment. However, the extent to which one can maintain a comfortable and sleep-promoting home temperature depends on the housing itself 18–24, ability to afford heating and cooling 25–27, ability to perceive a thermal discomfort 28,29, and adequate physical and cognitive function to take adaptive measures (e.g., changing thermostat setpoint, opening windows), all of which can decline with age30–32. As a result, even within a modern built environment, there exist correlations between sleep and outdoor temperature 33,34. Meanwhile, climate change can contribute to poor sleep by increasing the frequency and intensity of both hot and cold weather events 35,36. Therefore, if it is established that natural variations in home temperature have a meaningful impact on sleep within community-dwelling older adults, environmental interventions can be used to improve their sleep and perhaps make them more resilient to a changing climate. With the rapid growth in use of smart home thermostats and health tracking wearable devices, technology now enables large-scale longitudinal studies on the relationships between home ambient temperature and sleep, as well as environmental interventions such as cloud-to-home optimization of ambient temperature to promote sleep 37. Unfortunately, this potential has been mostly overlooked because it is not clear whether, and to what extent, ambient temperature within older adults’ own homes, which unlike lab settings is controlled and selected by the individual, impacts their sleep. Past observational studies demonstrate a relationship between home ambient temperature and outcomes related to sleep among older adults38–42. However, these studies often monitor subjects for short periods of time and do not capture factors related to subjects’ physiology, physical and cognitive function, and socioeconomic status that are potential confounders and covariates. As a result, while they provide invaluable insight into the potential impact of home ambient temperature on sleep in older adults, they do not establish a link that is independent from other environmental, physiological, socioeconomic, or functional factors. For example, it is not clear to what extent the observed associations are due to differences in socioeconomic status, which is a potential confounder. Further, past studies have not considered the potential between-individual differences in sleep due to differences in physiology, behavior, and adaptive capacity. Addressing these knowledge gaps, which is the main goal of the present study, requires observing the individual over a longer term and a comprehensive baseline characterization of their health and function.
Our objective was to investigate whether nighttime ambient temperature influences sleep in community-dwelling older adults living within a modern built environment. We hypothesized that there exist relationships between bedroom nighttime ambient temperature and time-synced outcomes related to quality and duration of sleep (namely, sleep efficiency, total sleep time, and number of movements during sleep) that are independent of other influential environmental, physiological, and functional factors. Further, we aimed to conduct a within-subject analysis to investigate between-person differences in these relationships.
METHODS
Study Design
We conducted a longitudinal observational study with rolling enrollment to monitor, over long periods of time, the home ambient temperature and outcomes related to sleep within a sample of community dwelling older adults.
Setting
This was a single-site study conducted in Boston, MA, USA (42.3601° N, 71.05 W, The Köppen-Geiger climate classification Dfa). Boston is a coastal city, with warm and humid summers, cold and stormy winters, and relatively cool spring and fall seasons. The recruitment period was October 2021-September 2022. Participants slept in their own homes and came from a variety of housing types ranging from small subsidized housing apartments to large single-family detached homes. Data collection started on Oct 28th, 2021, when the first subject entered the study and continued through Feb 28th, 2023.
Participants and Protocol
Participants were community-dwelling older adults who met the following inclusion criteria: 1) At least 65 years old 2) Willing to follow study protocols for the duration of the study 3) Living in the greater Boston metropolitan area 4) Access to a stable internet connection within their home. Exclusion criteria were established to ensure safety and optimize compliance, while minimizing confounds due to overt disease or conditions that may significantly influence study outcomes. They included: 1) Plans to leave their current place of residence within two consecutive years from the time of enrollment, 2) Spending most of their time away from home, 3) Any acute or unstable medical condition, 4) Self-reported physician-diagnosed dementia, or likely inability to understand the study protocol and/or safely adhere to study procedures, 5) Self-reported inability to ambulate without the assistance of another person, and 6) Self-report of physician-diagnosed sleep apnea.
We advertised the study through flyers in several senior living facilities as well as community senior centers. We advertised in two subsidized and two private senior housing sites, and a senior community center. Participants identified as eligible through our phone screen were visited in their own home for an in-person screening and baseline health assessment. Individuals who met all inclusion and exclusion criteria read and signed an informed consent form approved by Advarra Institutional Review Board (protocol ID: Pro00047567). During the same visit, medical history questionnaires were completed along with physical and cognitive assessments. After the initial assessments, we installed environmental sensors in participants’ bedrooms and living rooms and linked a wearable ring heart rate, activity, and sleep monitor (Ouraring; Oura, Finland) to their smartphones. Those who did not have a smartphone were provided one by the study team. We explained all elements of the study to participants and asked them to 1) Keep environmental sensors connected and plugged-in and 2) Wear the wearable device continuously and charge it twice a week. Participants remained in the study for 12 months, or through the end of our data collection period.
Variables
The outcome variables were sleep efficiency (SE, ratio of time spent asleep to time spent in bed) and sleep restlessness (RSTLS, ratio of time spent tossing and turning to time spent asleep), as well as total sleep time (TST). SE and RSTLS are related to the quality of sleep. A low SE is associated with more frequent and/or longer awake periods throughout the night while a high RSTLS means more tosses and turns per hour of sleep. Poor sleep quality is therefore often associated with a low SE and/or a high RSTLS. The exposure variable was nighttime average ambient temperature. Our goal was to isolate, to the extent possible, the impact of exposure variable on outcome measures. Therefore, as shown in figure 1, we constructed an a priori structural causal graph based on known and measured between- and within- subject sources of variations in sleep. We considered cognitive and physical function, health status, and biological sex as sources of between-subject variation in sleep. Socio-economic status and cognitive and physical function can also influence both sleep quality and the home ambient temperature and are therefore considered as possible confounders (methods of measurement described below). Within each subject, length of the day (i.e., number of hours between sunrise and sunset) and nighttime ambient humidity (measured by our environmental sensor) can influence sleep directly and/or indirectly. Further, we included the social calendar (i.e., weekend vs. weekday) as a covariate.
Figure 1.
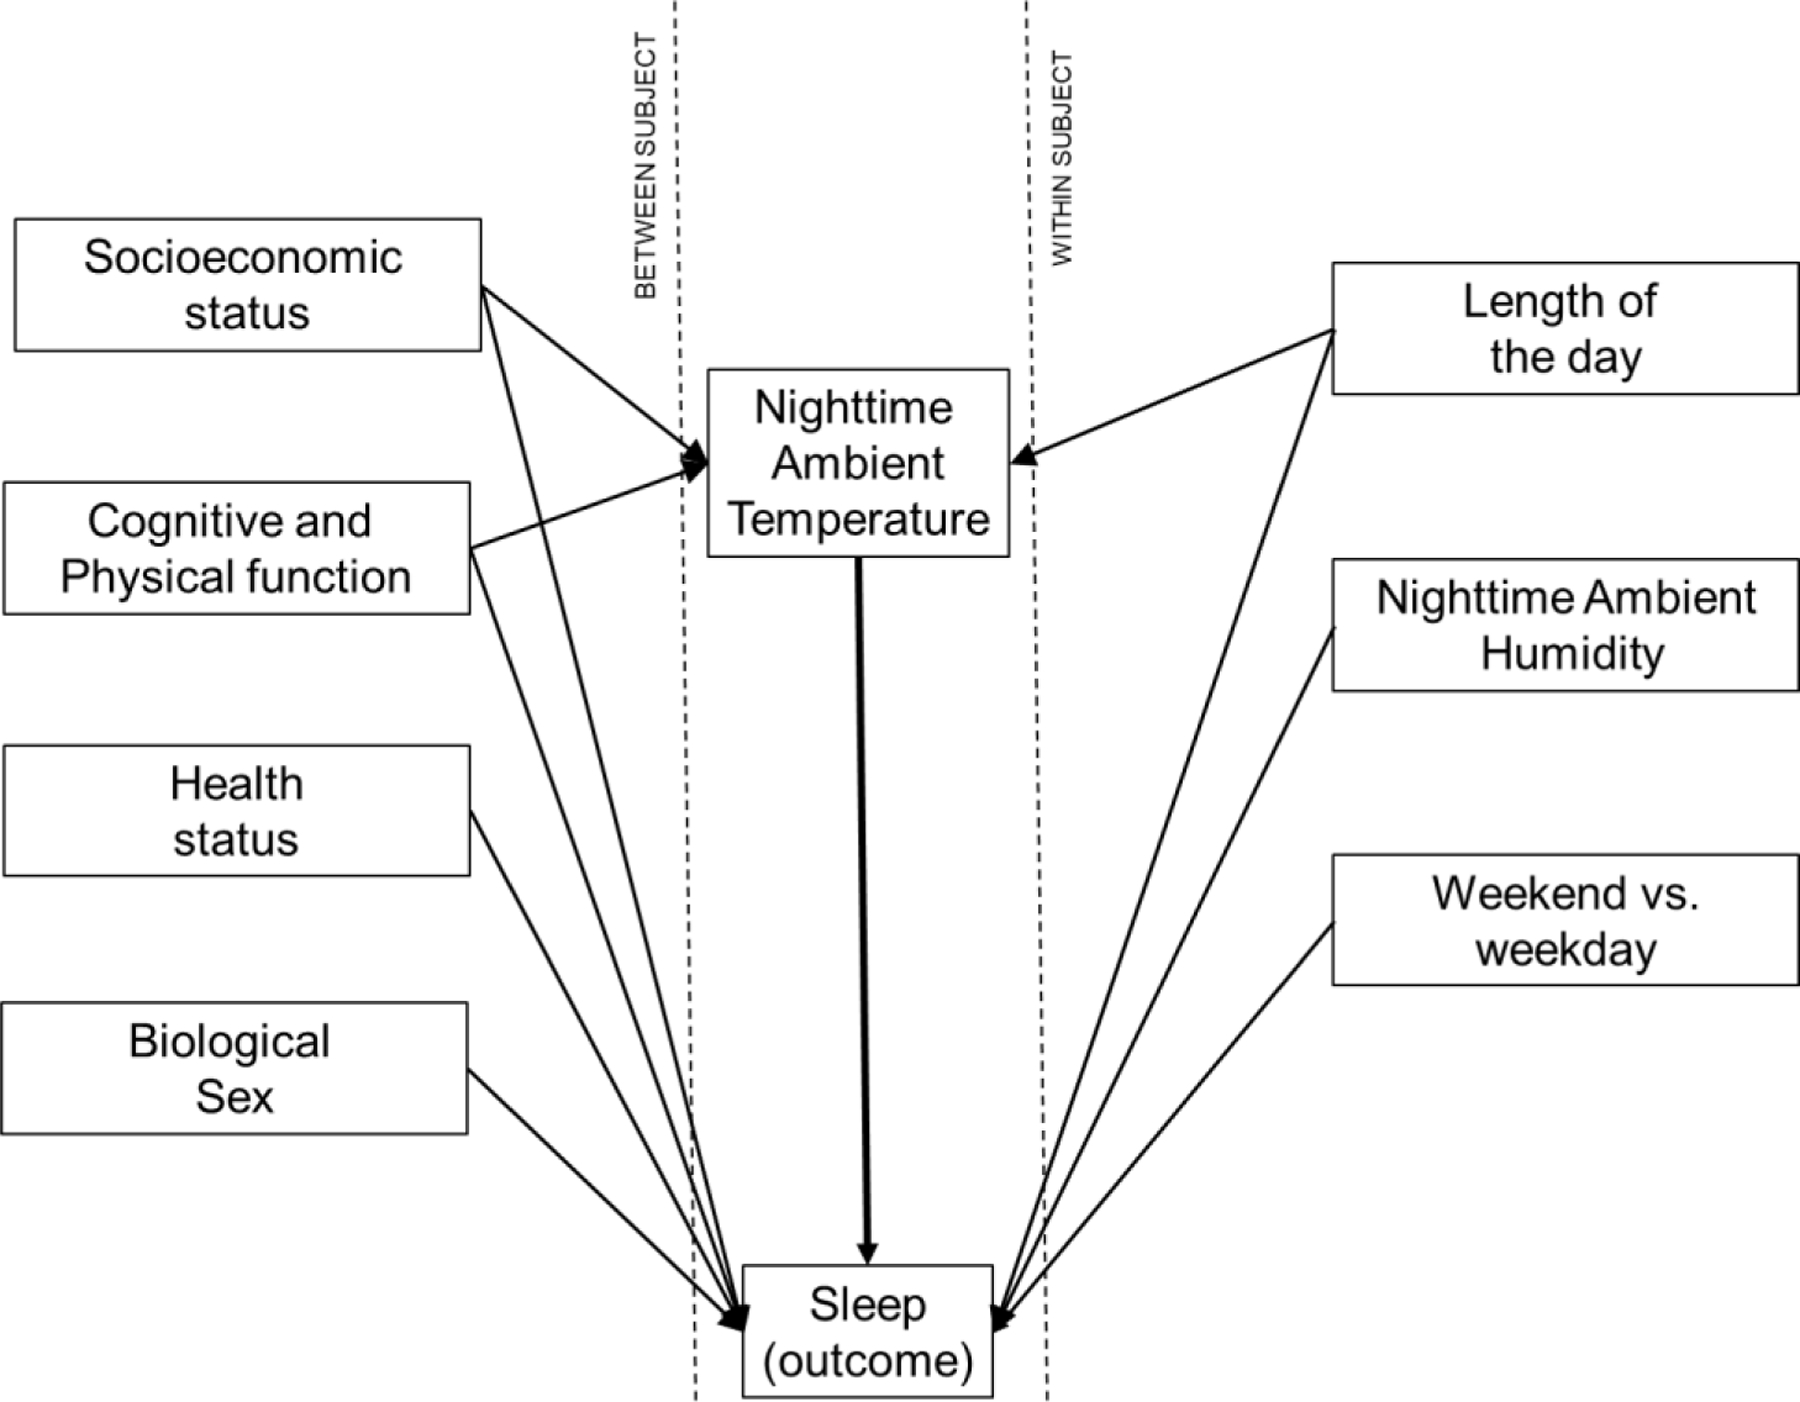
Concept model showing measured between- and within- subject sources of variations in sleep. Nighttime Ambient Temperature is the exposure variable.
Measurements and sources of data
Ambient temperature and humidity:
We used the Netatmo smart air quality monitor (Netatmo, France) to continuously measure indoor air temperature and relative humidity. We installed two sensors in each home: one in the bedroom and one in the living room. We asked participants to not move the sensors from their original location and always keep them plugged in. We used Netatmo’s Application Programming Interface (API) to record temperature and humidity every 15 minutes and upload acquired data to cloud storage.
Sleep:
We used a wearable ring device worn in the finger (Ouraring, Oura, Finland) to measure outcomes related to sleep. Ouraring uses different biological signals in its sleep detection algorithm. It measures heart rate, heart rate variability, respiration, skin temperature (measured at the ring), and movement, via infrared photoplethysmography (PPG), negative temperature coefficient (NTC), and a 3-D accelerometer43. Several studies have tested and validated Ouraring against polysomnography, which is the gold-standard in sleep detection. These studies show that Ouraring’s 2-stage sleep-wake accuracy and ability to correctly identify sleep efficiency is 89 – 94%43. Each participant received an appropriately sized ring to wear continuously on their finger and was instructed to charge it once every 3 to 4 days. To charge the ring, participants had to place it on a charger terminal for 2–3 hours. During the initial visit we explained the charging process to the participants and allowed them to practice it. We repeated this training as needed throughout the study to ensure participants remember and are able to charge the ring appropriately. We did not instruct participants to wear the ring during the day to increase battery life and minimize disruption to their daily life. We monitored the incoming data from all participants on a weekly basis and promptly addressed gaps to ensure high compliance. Data collected from the ring was transmitted to the cloud via the participant’s smartphone. We used Oura’s API to create a data stream from the device to cloud storage.
Length of the day:
We calculated length of the day using the Geosphere package in R44.
Baseline assessments:
Physical and cognitive function were represented by baseline scores on short physical performance battery 45,46 (SPPB) and Montreal Cognitive Assessment 46–48 (MOCA), and health status was represented by the Charlson comorbidity index (CCI) 49 which was calculated from our baseline health questionnaire. SPPB is a series of physical performance tests used to assess physical function and mobility in older adults and includes three main components: a balance test, a gait speed test, and a chair stand test. The timed results of each subtest are rescaled according to predefined cut-points to result in an overall score ranging from 0 (worst performance) to 12 (best performance). MoCA is used to evaluate people with memory loss or other symptoms of cognitive decline. It assesses short-term memory recall, visuospatial abilities through clock-drawing and cube copy, and orientation. CCI is a measure of comorbidities that is predictive of mortality. It includes a count of multiple conditions, such as heart disease, AIDS, or cancer. CCI scores 12 comorbidities with various weightings giving a maximum score of 24. A score of zero means that no comorbidities were found. Socioeconomic status was represented by three binary variables: living status (1= living alone, 0= living with a partner), education (1=less than 2 years of college, 0=more than two years of college), and housing type (1= living in subsidized housing, 0= private market-rate housing)
Statistical analysis
Using the timestamps in sleep and environmental data, we matched the sleep outcome of each night from each participant to the environmental data measured from their bedroom during the same night. Then, we removed outlier nights by applying the interquartile range (IQR) method of outlier detection to each participant’s sleep efficiency and total sleep time. This method involves calculating the interquartile (IQR) which is the range between the first quartile (Q1, 25th percentile) and third quartile (Q3, 75th percentile) of a dataset. Outliers are then identified and removed by excluding data points that fall below the lower bound (Q1 – 1.5IQR) or above the upper bound (Q3 + 1.5IQR). Further, using the same method, we removed nights when the indoor temperature was extremely hot or cold assuming the participant did not sleep at home that night. Finally, we removed data from nights when individual participants reported being away (e.g., due to travel). We reported descriptive results by using box plots to show the range and variation in exposure (temperature) and outcome (SE, TST, and RSTLS) variables for each participant.
Our first hypothesis was that there exists a global relationship between nighttime ambient temperature and date-synced outcomes related to sleep, independent of between-subject (sex, health status, and physical and cognitive function, and socioeconomic status) and within-subject (humidity, length day, day of week) sources of variation. To test this hypothesis, we created three regression models (one for each outcome) with all the predictors and covariates shown in figure 1. Because we expected non-linear relationships between the outcomes and environmental predictors, we used Generalized Additive Models (GAMs) 50. GAMs are a specific type of generalized linear models that can handle linear response variables that depend linearly on unknown smooth functions of some (or all) predictor variables. For a select set of variables that are assumed to have a non-linear relationship with the outcome, GAMs replace beta coefficient with “smooths” which are complex functions that capture the non-linearity in the relationships.
Model equation:
where and designate the jth observation and the ith subject. The first three terms are modeled as smooth functions (, , ) while the remaining are simple linear terms with traditional coefficients. Because the nonlinear terms in GAMs do not result in a traditional beta coefficient, we used graphics to show the relationships between dependent variable and predictors of interest while keeping other variables constant at their median. Further, we reported partial R2 51,52 values as a measure of the proportion of variance in the dependent variable that can be attributed to a specific predictor while accounting for the influence of the other predictors in the model. To calculate partial R2 for each predictor, we fit a reduced GAM without that predictor and calculated the R2 for both the full and reduced models. The partial R2 was calculated as the difference between the R2 of the full model and the reduced model. For the linear terms (MOCA, SPPB, CCI, Sex, housing type, Living Status, Weekend), we simply reported traditional Beta coefficients.
Our second goal was to investigate the within-subject relationships between nighttime ambient temperatures and sleep outcomes. We therefore replaced physiological, socioeconomic, and functional variables (the left side of figure 1) with a subject-specific intercept (participant ID). Then, we allowed each participant to have their own set of subject-specific non-linear relationships between the dependent variable and nighttime ambient temperature, nighttime relative humidity, and day length. This enabled us to study whether and how, within each participant, nighttime ambient temperature had a relationship with outcomes related to sleep.
Model equation:
where and designate the ith participant and the jth observation. Notably, each participant has their own set of smooth functions (, ). Given the nature of environmental timeseries data (ambient temperature, humidity, and length of the day), some level of collinearity between these variables is inevitable when the data are limited to a single participant. In extreme cases, this collinearity can negatively impact model performance. We therefore tested data from each participant and excluded those with extremely high correlation between the ambient temperature and humidity or length of day. Specifically, we used concurvity 53–55, which is a measure of redundancy in the feature set of GAMs. Generally, a concurvity of more than 0.8 between any two of the predictors adversely affects model performance and can lead to unstable estimates. Five (out of 50) participants who demonstrated strong correlations between ambient temperature and humidity and/or day length were excluded from the within-subject analysis. We plotted the within-subject relationship between ambient temperature and outcomes related to sleep for the remaining 45 participants to illustrate the inter-individual differences in the relationships between ambient temperature and outcomes of interest.
RESULTS
Participants
Figure 3 shows the recruitment diagram. Out of the 65 participants who were screened, 53 enrolled in the study, and 50 were included in our analysis. Table 2 shows the characteristics of our sample as well as the number of data points collected. After removing the outliers, on average, we had 212 (±96.3, range: 31–358) nights of measured sleep and environmental data from each participant. In total, our analysis included 10903 person-nights of data.
Figure 3.
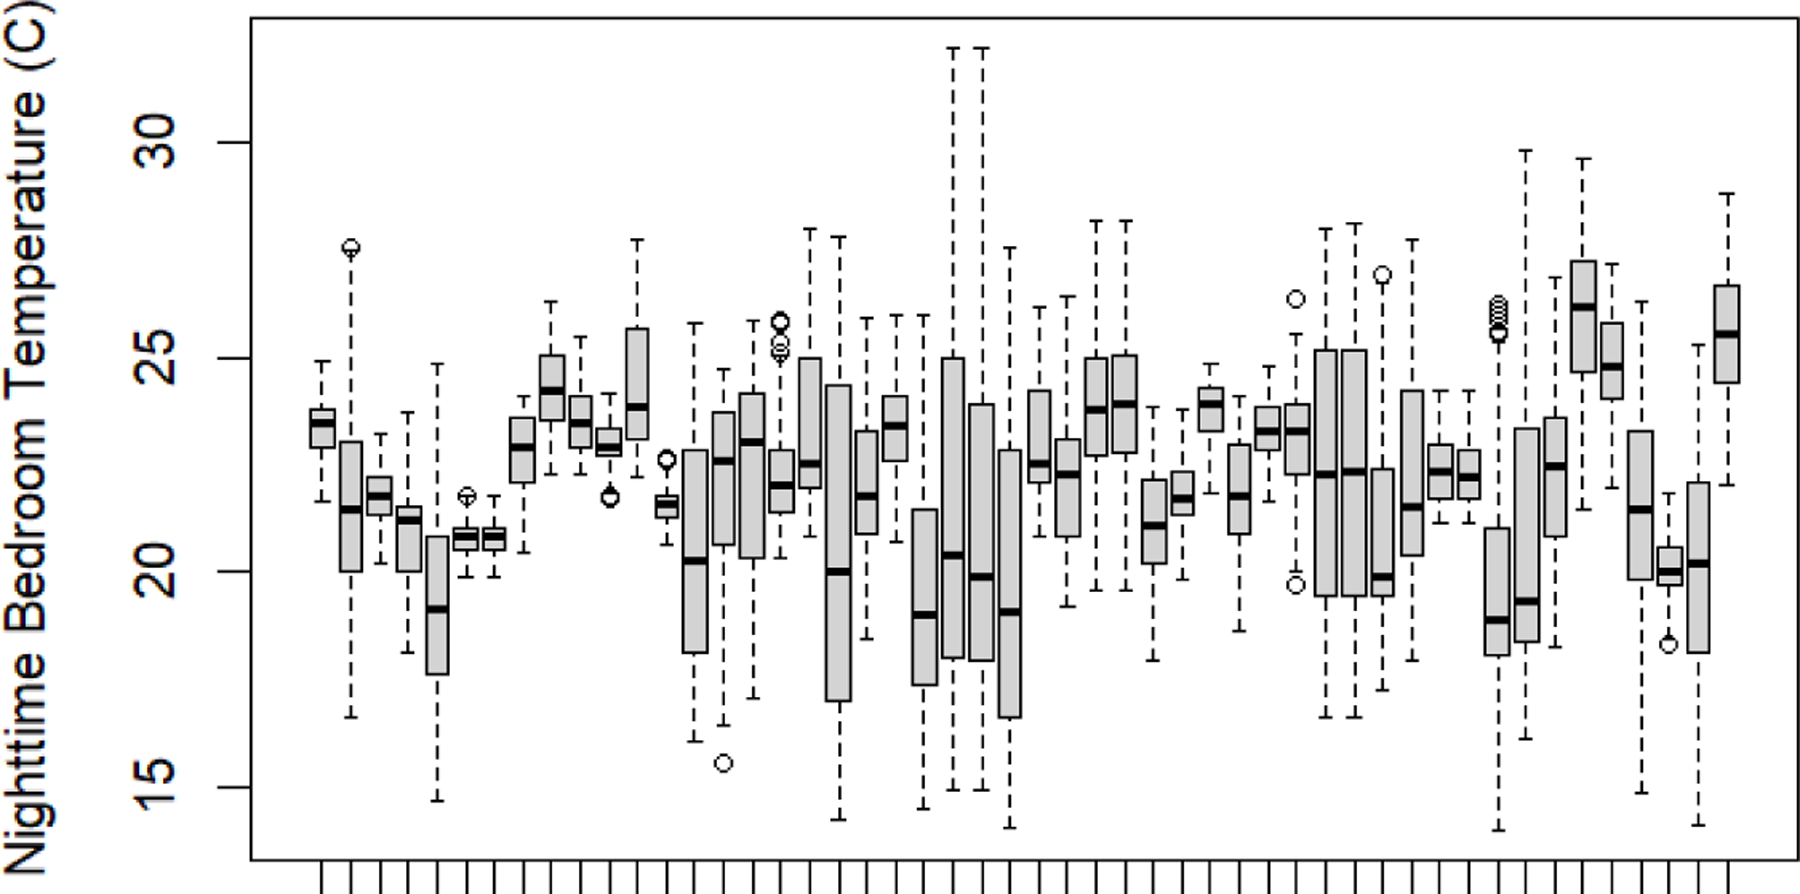
Nighttime bedroom temperature by participant. Each box includes all the data from a specific participant.
Table 2.
Results of the fully adjusted regression analysis on data from all participants (10,903 person-nights of data from 50 participants). TST is total sleep time, SE is sleep efficiency, and RSTLS is sleep restlessness. We did not report coefficients for environmental variables because they were modeled as non-linear predictors. Their predicted impact on outcomes is presented graphically in figure 7.
| variable | Observed Range | TST | SE | RSTLS | |||
|---|---|---|---|---|---|---|---|
| Partial R2 |
Partial R2 |
Partial R2 |
|||||
| Nighttime temperature (°C) | 14 – 32.2 | NA | 0.05 | NA | 0.11 | NA | 0.1 |
| Nighttime relative humidity (%) | 16 – 79 | NA | 0.03 | NA | 0.08 | NA | 0.03 |
| Day length (hours) | 9.1 – 15.3 | NA | 0.01 | NA | 0.08 | NA | 0.08 |
| SPPB score | 0 (not able to take the test) - 12 | 3.44 | 0.04 | 0.32 | 0.05 | 0.06 | 0.03 |
| MOCA score | 13 – 30 | −1.02 | 0.01 | −0.04 | 0.00 | −0.02 | 0.01 |
| CCI score | 2 – 13 | −0.71 | 0.00 | −0.28 | 0.02 | −0.05 | 0.01 |
| Sex | (0=male, 1=female) | 57.92 | 0.32 | 0.02 | 0.00 | −0.37 | 0.02 |
| Living alone | (0=no, 1=yes) | −15.08 | 0.04 | −4.57 | 0.42 | 1.18 | 0.38 |
| Housing type | (0=private, 1=subsidized) | −9.96 | 0.21 | −1.71 | 0.21 | 0.78 | 0.21 |
| Education | (1= less than 2y of college) | −55.63 | 0.19 | −4.45 | 0.15 | 0.57 | 0.03 |
| Weekend | (0=no, 1=yes) | 10.95 | 0.02 | −0.24 | 0.00 | −0.16 | 0.01 |
Two-sided P<0.05
Descriptive data
Figure 3 shows the observed range of nighttime bedroom temperature for each participant. Each box includes all the data from a specific participant. Figures 4–6 show the three outcomes related to sleep for each participant (each box plot represents a specific participant). These data reveal substantial differences between (the difference in means and variance between different boxes) and within (the range of data within each box) subjects.
Figure 4.
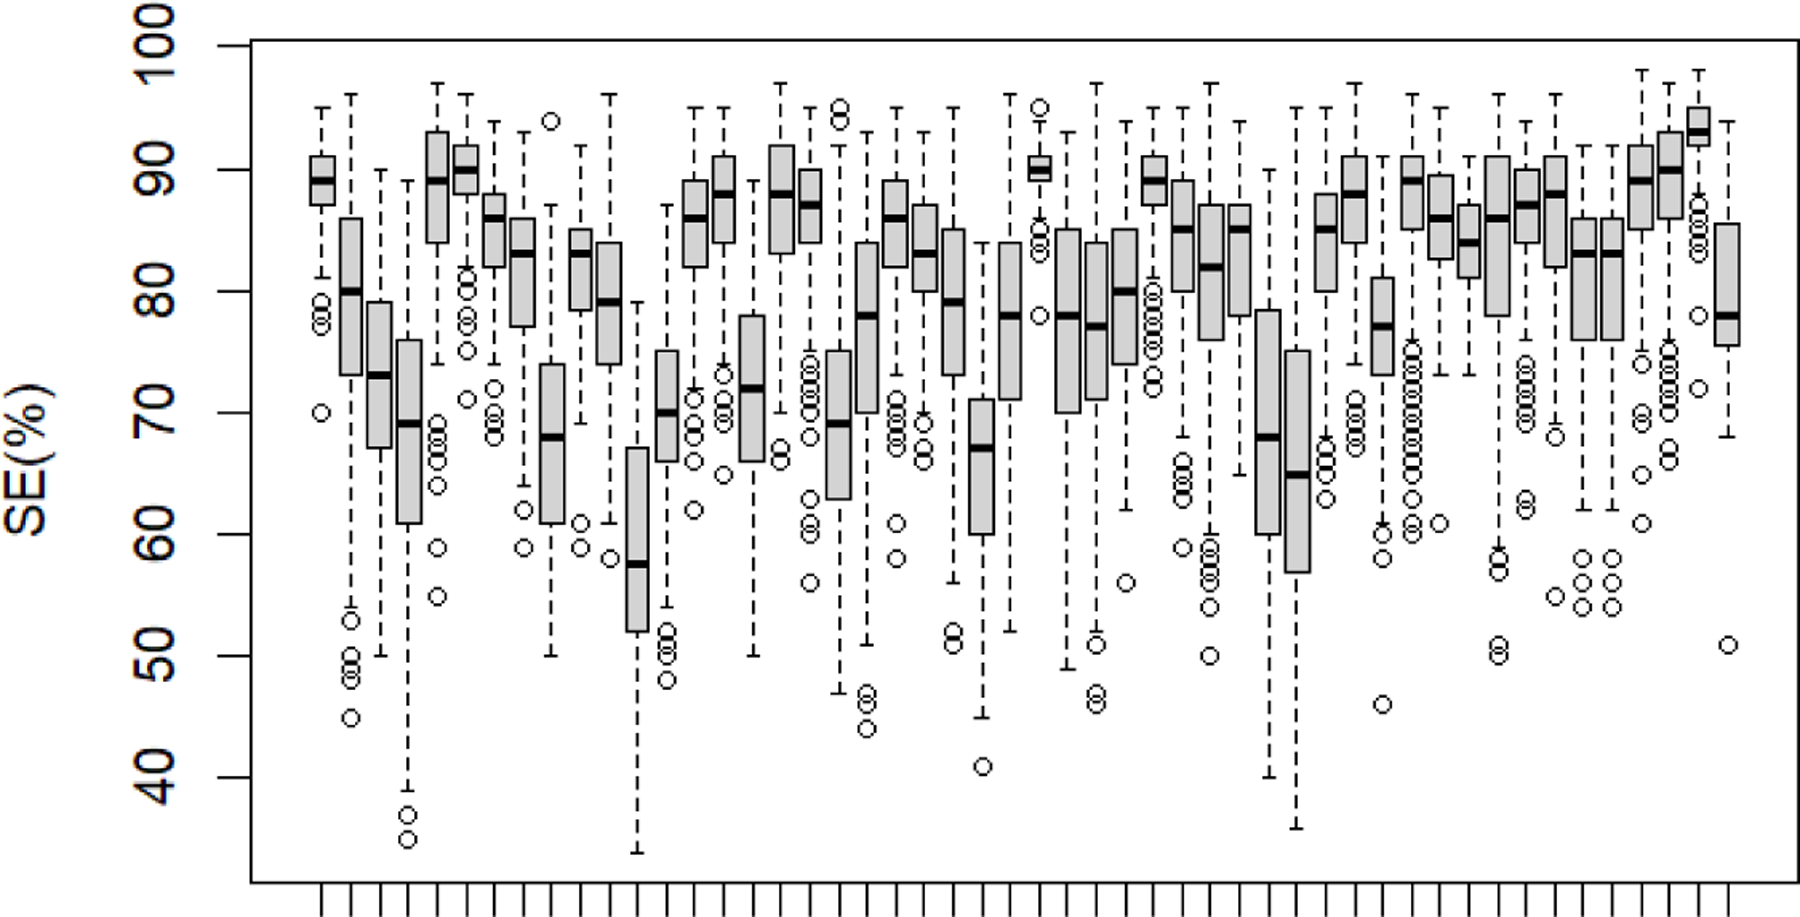
Sleep Efficiency by participant. Each box includes all the data from a specific participant.
Figure 6.
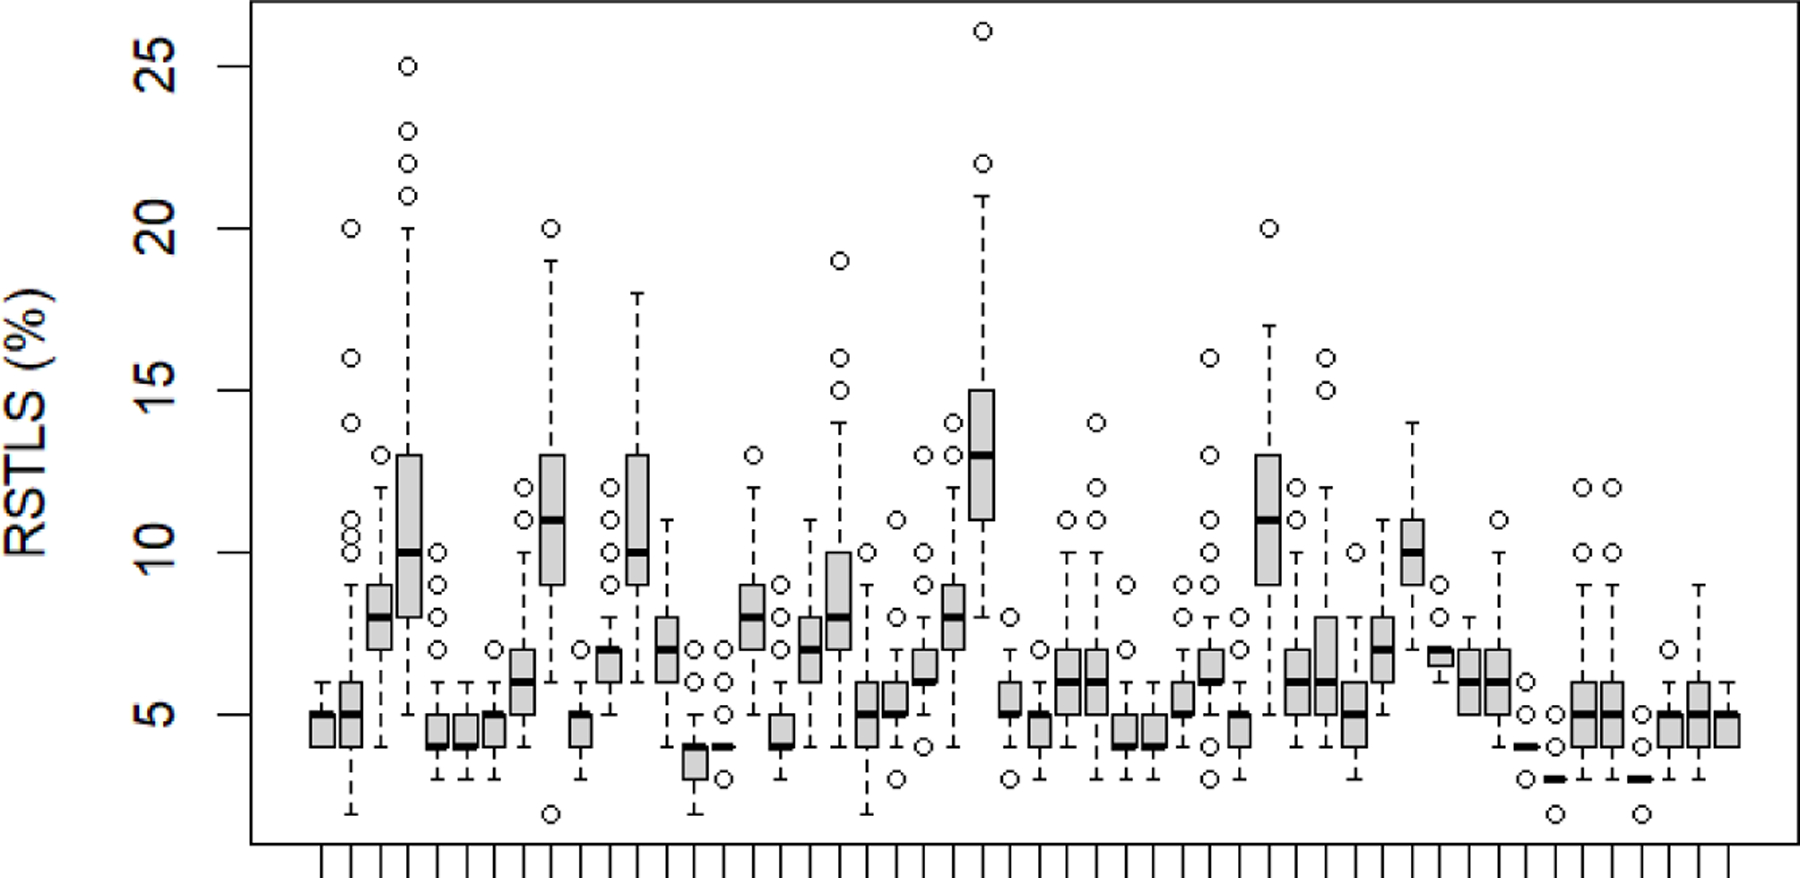
Sleep Restlessness by participant. Each box includes all the data from a specific participant. Main results
Table 2 shows the results for all three outcomes of our main regression analysis. The partial R2 shows the contribution of each variable to overall model fit (i.e., the relative importance of each variable in predicting the dependent variable). According to these partial R2 values, the most important predictors (partial R2 >0.1 and P<0.05) are as follows: (1) SE: Living alone, housing type, education, and nighttime ambient temperature (2) RSTLS: living alone, housing type, and nighttime ambient temperature, (3) TST: sex, housing type, and education. We did not report coefficients for environmental variables because we modeled them as non-linear predictors. Their predicted impact on each outcome is presented graphically in figure 7.
Figure 7.
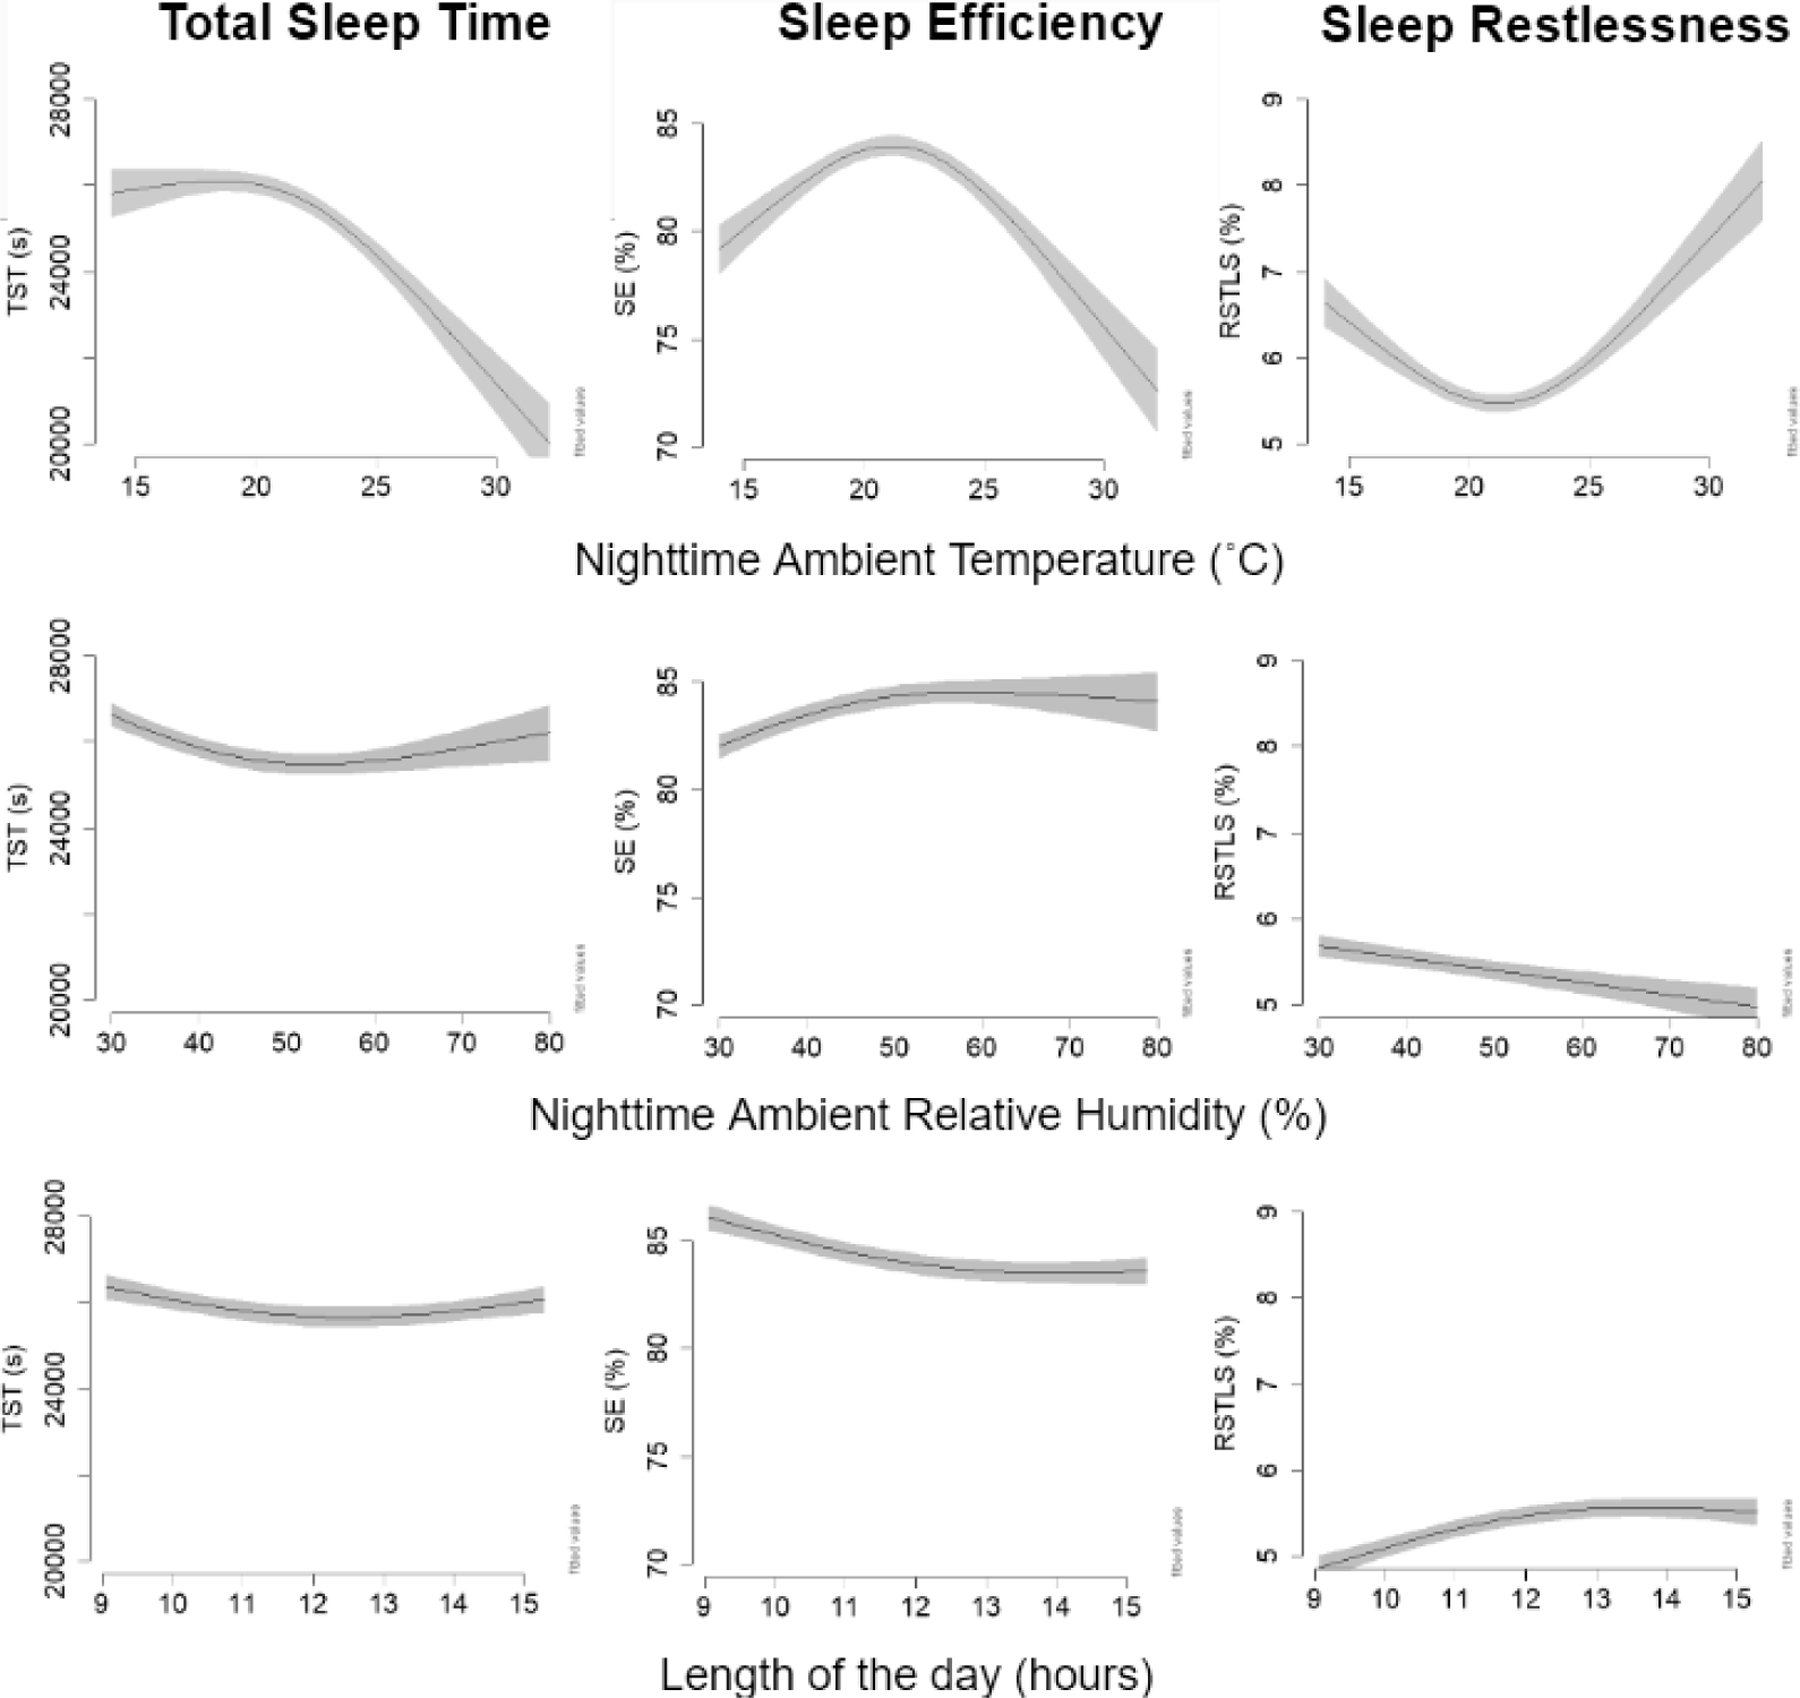
Model-predicted outcomes based on environmental variables. In creating these graphs, we used the median value of all other variables (a female with MOCA score of 25, SPPB score of 10, comorbidity score of 5, who lives in private housing, in a weekday with a day length of 12.3 hours, and bedroom nighttime humidity of 44.2%). In rows two and three, nighttime ambient temperature was set to 22 °C. TST is total sleep time, SE is sleep efficiency, and RSTLS is sleep restlessness.
These results reveal non-linear relationships between the nighttime ambient temperature and all three sleep outcomes. Model-predicted TST was unaffected by nighttime ambient temperature until 22 °C and then dropped, rather substantially, as the temperature increased. Accordingly, our model predicted a 60-minute reduction in total sleep time as temperature increased from 22 to 30 °C. SE and RSTLS, both of which are related to the quality of sleep, show a u-shape relationship. Based on our models, an 8 °C increase in nighttime ambient temperature (from 22 to 30 °C) is associated with a 10% drop in sleep efficiency. On the other hand, an 8 °C decrease in nighttime ambient temperature (from 22 to 14 °C) is associated with a 5% drop in sleep efficiency. Overall, these results indicate an optimal range of temperature, whereby sleep was most efficient and restful when nighttime ambient temperature was between 20 – 25 °C.
Based on partial R2 values reported in table 2, day length and nighttime ambient humidity were only relevant in predicting SE (second column in figure 7). SE decreases with length of the day but remains constant once it reaches 13 hours. Relative humidity shows an inverse U-shape relationship with SE whereby 50% is the optimal relative humidity. However, it should be noted that over the range of our observations, relative humidity and day length had a smaller effect on SE than ambient temperature.
Within-subject relationships
Data from five participants revealed a high degree of correlation between nighttime ambient temperature and humidity and were therefore excluded from within-subject analyses. Among the remaining 45 participants, our person-specific regression models revealed statistically significant (P<0.05) within-subject relationships between nighttime ambient temperature and TST in 29, SE in 21, and RSTLS in 30. The effect size and direction of these relationships are shown in figures 8 for SE and supplementary figures S1 and S2 for TST and RSTLS.
Figure 8.
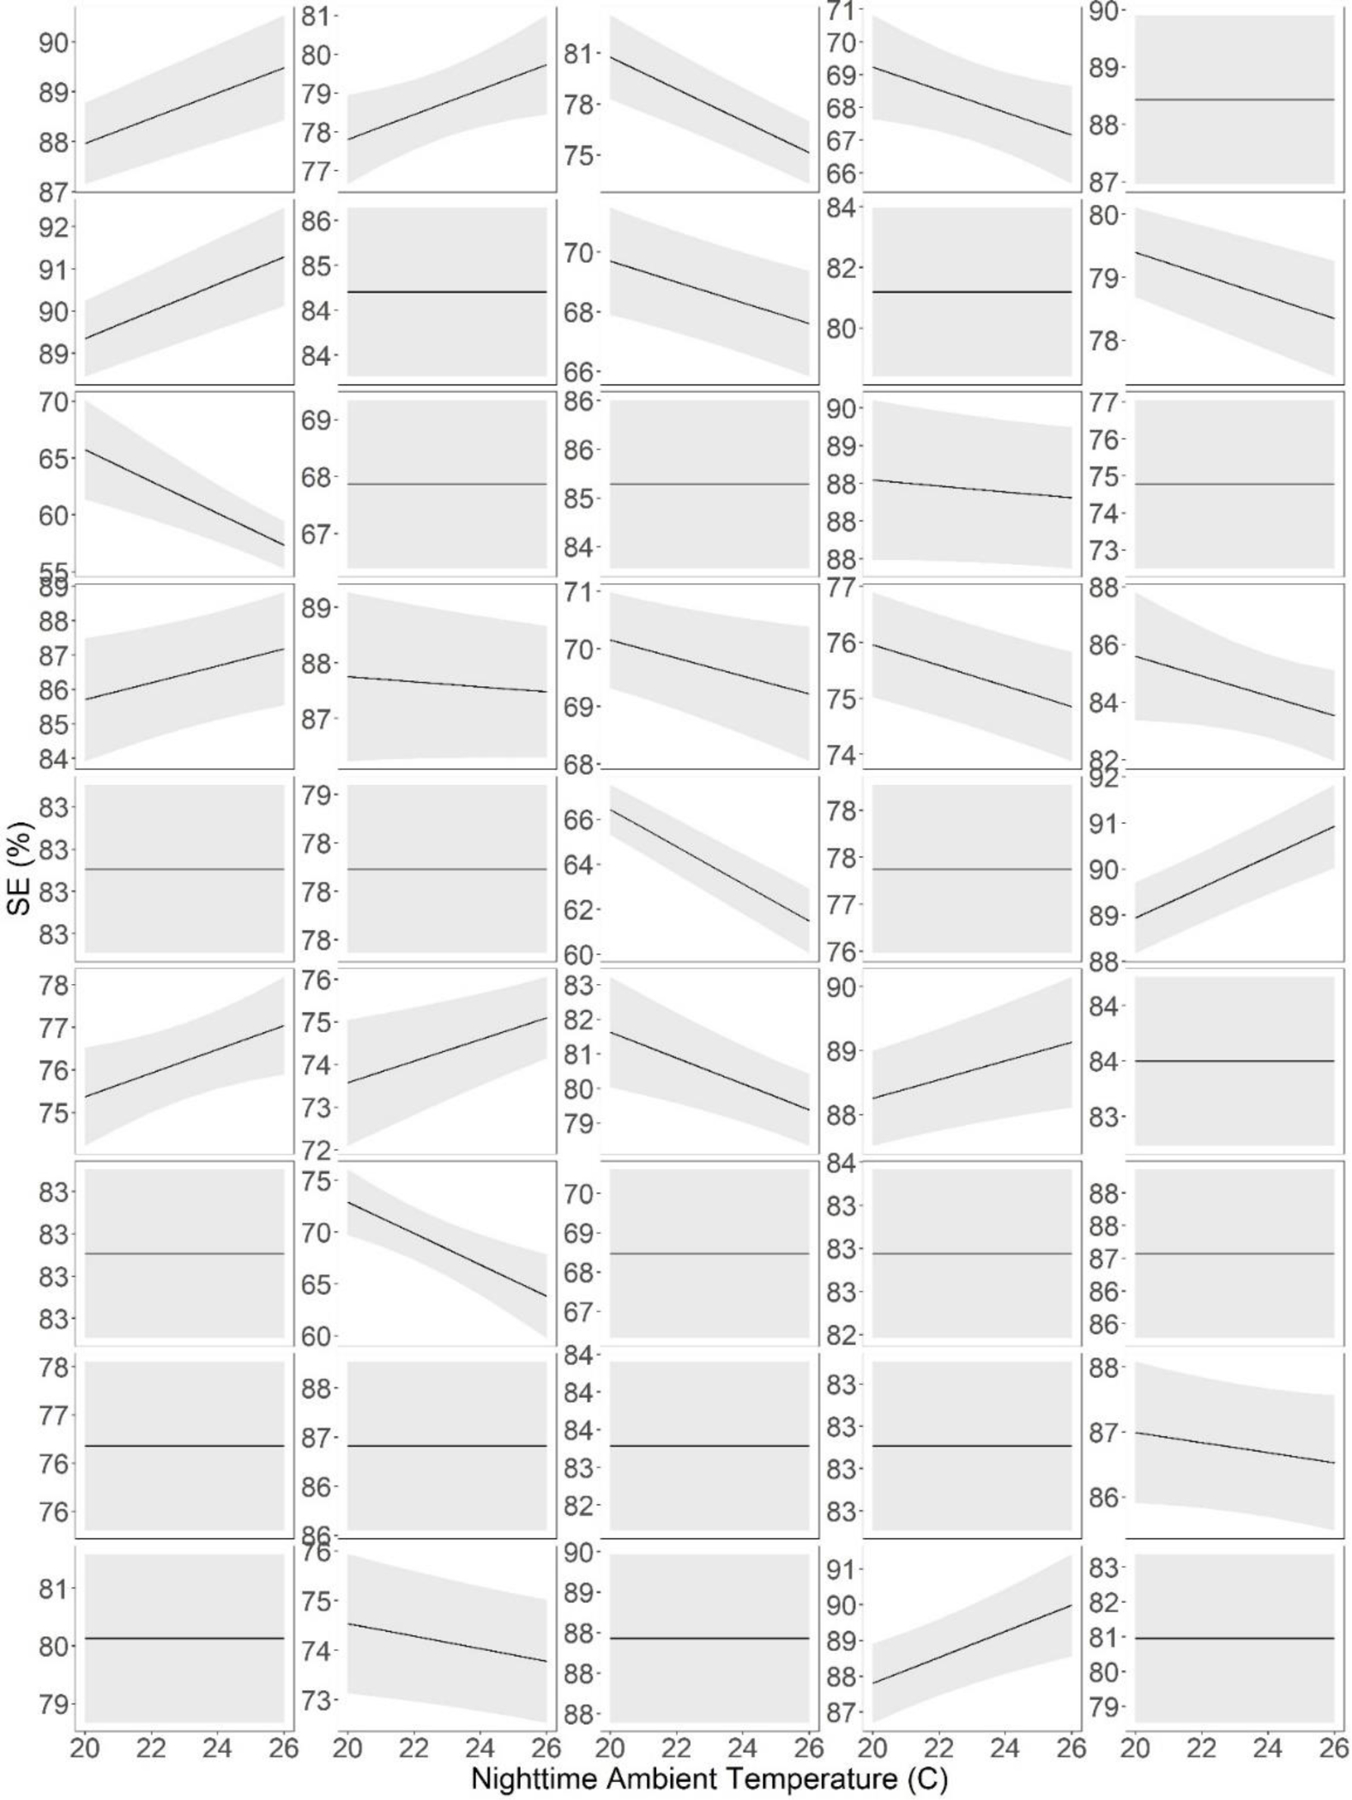
Within-subject relationships between nighttime ambient temperature and Sleep Efficiency (SE) adjusting for day of the week, nighttime relative humidity, and day length. Each panel represents data from a specific participant. Note the vertical axis varies between panels. Unlike figure 7, nighttime temperature in these graphs is limited to 20–26 because we had fewer observations outside this range from any given individual. These data suggest the strength and even the direction of relationship between ambient temperature and SE may vary between subjects.
These data show that there are substantial between-person variations in the relationship between ambient temperature and outcomes related to sleep. For all three outcomes, statistical significance, magnitude, and even the direction of the relationship with ambient temperature varies between individuals. For example, out of 21 participants who showed a statistically significant within-subject relationship between SE and nighttime ambient temperature, eight presented a positive and 14 presented a negative relationship.
DISCUSSION
Key results
The results of this study demonstrated that even in a sample of older adults with a relatively high standard of living, bedroom nighttime temperature was associated with duration, efficiency, and restlessness of sleep, even after accounting for between- and within-subject confounders and covariates. Further, our results revealed that the relationships were mostly nonlinear whereby sleep was most efficient and restful when nighttime ambient temperature is between 20 – 25 °C. At the same time, within-subject analyses revealed substantial between-subject variation in the strength, and even the direction, of the relationship between nighttime ambient temperature and outcomes related to sleep.
Interpretation
Our data suggest that the self-selected/controlled home thermal environment influences the sleep of older adults even within a sample with a relatively high standard of living. This work overcomes the limitations of previous laboratory-based studies by observing individuals over longer term and inside their own home, thus enabling us to establish associations between home ambient temperature, and objective measures of sleep, independent of other environmental, physiological, functional, and socioeconomic factors. Overall, our findings indicate an optimal range of temperature, whereby sleep was most efficient and restful when nighttime ambient temperature was between 20 – 25 °C. This is in-line with the work by Lee and Shaman, who conducted a survey of 706 adults in New York city, and reported that while the frequency of AC use (which protects occupants from exposure to high temperature) resulted in greater bedroom thermal satisfaction, setting it at low temperatures provide no additional benefits56. The effect sizes we observed were clinically relevant, especially in the case of sleep efficiency where past studies enable a comparison. We observed 5–10% drop in sleep efficiency as the nighttime ambient temperature increases from 25°C to 30°C. Based on past studies, a 5–10% drop in sleep efficiency is large enough to influence cognitive performance9, next-day activity57, next-day stress 58,59, postprandial glucose response to breakfast12, anxiety, mood, and fatigue 2. Further, the effect associated with increasing temperature from 25°C to 30°C was similar in size to that of evening alcohol and/or nicotine consumption 60 and chronic pain 61,62.
Our observations point to an exciting opportunity to potentially improve sleep within the older adult population by creating a more comfortable home thermal environment. This is also important from a climate adaptation point of view, as most cities in North America are projected to become warmer due to a combination of climate change and urban induced warming 63. An increase in frequency and intensity of hot weather events may adversely affect sleep especially in community-dwelling older adults with lower socioeconomic status. In addition to the clinical implications, data presented here also support increasing the adaptive capacity of older adults, especially in the face of a changing climate. This includes utility assistant programs that enable low-income older adults maintain a comfortable home thermal environment by lifting the financial barriers to using heating and cooling systems.
Our study also reveals the distinction between different outcomes related to sleep, and how each is influenced by environmental, physiological, or functional factors in different ways. For example, the effect of sex, education, ambient temperature, and humidity on sleep efficiency were substantially different than total sleep time. This was expected, considering decades of research showing complexity of sleep as a multifaceted phenomenon. Therefore, improving sleep quality of a patient or a population requires a thorough examination of the clinical relevance of each outcome especially within the aging population. Further research is needed to identify which outcome related to sleep has the most impact on meaningful factors related to short and long-term health and wellbeing of older adults. For example, establishing which outcome related to habitual sleep presents the strongest association with the rate of long-term cognitive decline. Understanding these links, along with the associations each outcome demonstrates with ambient variables, enables researchers and health care providers to fine tune their environmental interventions based on most important outcomes related to sleep.
Our study also highlights, via the between-subject analysis presented in table 2, that certain physiological, functional, and socioeconomic factors influence sleep to a significant extent. It is also likely that these factors influence the interaction between ambient temperature and sleep, which can be investigated with a larger sample size. This observation, in combination with our within-subject analyses justifies the need to monitor each individual and to identify their specific relationship between temperature and sleep, given their unique health status, level of function, physiology, and behavior. Technology, like wearables and environmental sensors used in this study, enables monitoring of older adults within their own home over long periods of time with relative low cost and burden. As a result, it is now possible to automate the process of adjusting temperature based on each persons’ specific needs, which can help older adults and those who, due to age-related decline in physical and cognitive function, are not able to continuously adjust their home temperature. Notably, it is also possible to identify groups who stand to benefit most from this type of intervention using functional, health, and socioeconomic characteristics that strengthen the link between ambient temperature and sleep. This suggests an opportunity to go beyond a “one-size-fits” all solution and personalize the home ambient temperature based upon specifics needs, physiology, and the behavior of the individual or a specific group. This finding is important for both the development of interventions as well as design and operation of buildings, especially large facilities where many older adults live together.
Limitations
Sample:
We characterized socioeconomic status based on housing type and education, which is a fairly coarse measure. Our initial questionnaire included a question about income, which the majority of participants refused to answer. Nevertheless, individuals in our sample had a relatively high socioeconomic status and standard of living. It is plausible that the effects observed in this study exist, perhaps even to a higher degree, within a sample that has lower socioeconomic status because they are less able to maintain a home ambient temperature that is optimal for sleep. Further, our study was conducted in only one city. Because of the differences in climate and the built environment we take caution in generalizing our findings to other cities. These important limitations can be addressed in future work by including a larger and more socio-economically diverse sample, focusing on low-income older adults, and expanding the geographic area.
Unmeasured covariates:
Sleep is a multifaceted and complicated phenomenon that is simultaneously influenced by numerous factors, many of which were not accounted for in this study (e.g., daily medication, activity, stress, noise, social interactions). These factors are often challenging to measure inside the home over the long term without disrupting the day-to-day life of older adults. On the other hand, lab-based studies that control many of these factors do not provide insight into the lived experience inside their own home. Advances in technology will provide opportunities to better control these factors while observing the individuals inside their own home. Future research can therefore build upon this work and include more covariates in order to ensure the stability of results.
Measurements:
Sleep was measured using a method which is not the gold standard for sleep detection. Ouraring has shown acceptable accuracy compared to Polysomnography and avoids intrusive and potentially sleep-disrupting instrumentation of more sophisticated methods. More specialized sleep detection tools can enable investigation of other outcomes related to sleep such as deep vs. light sleep duration.
Supplementary Material
Figure 2.
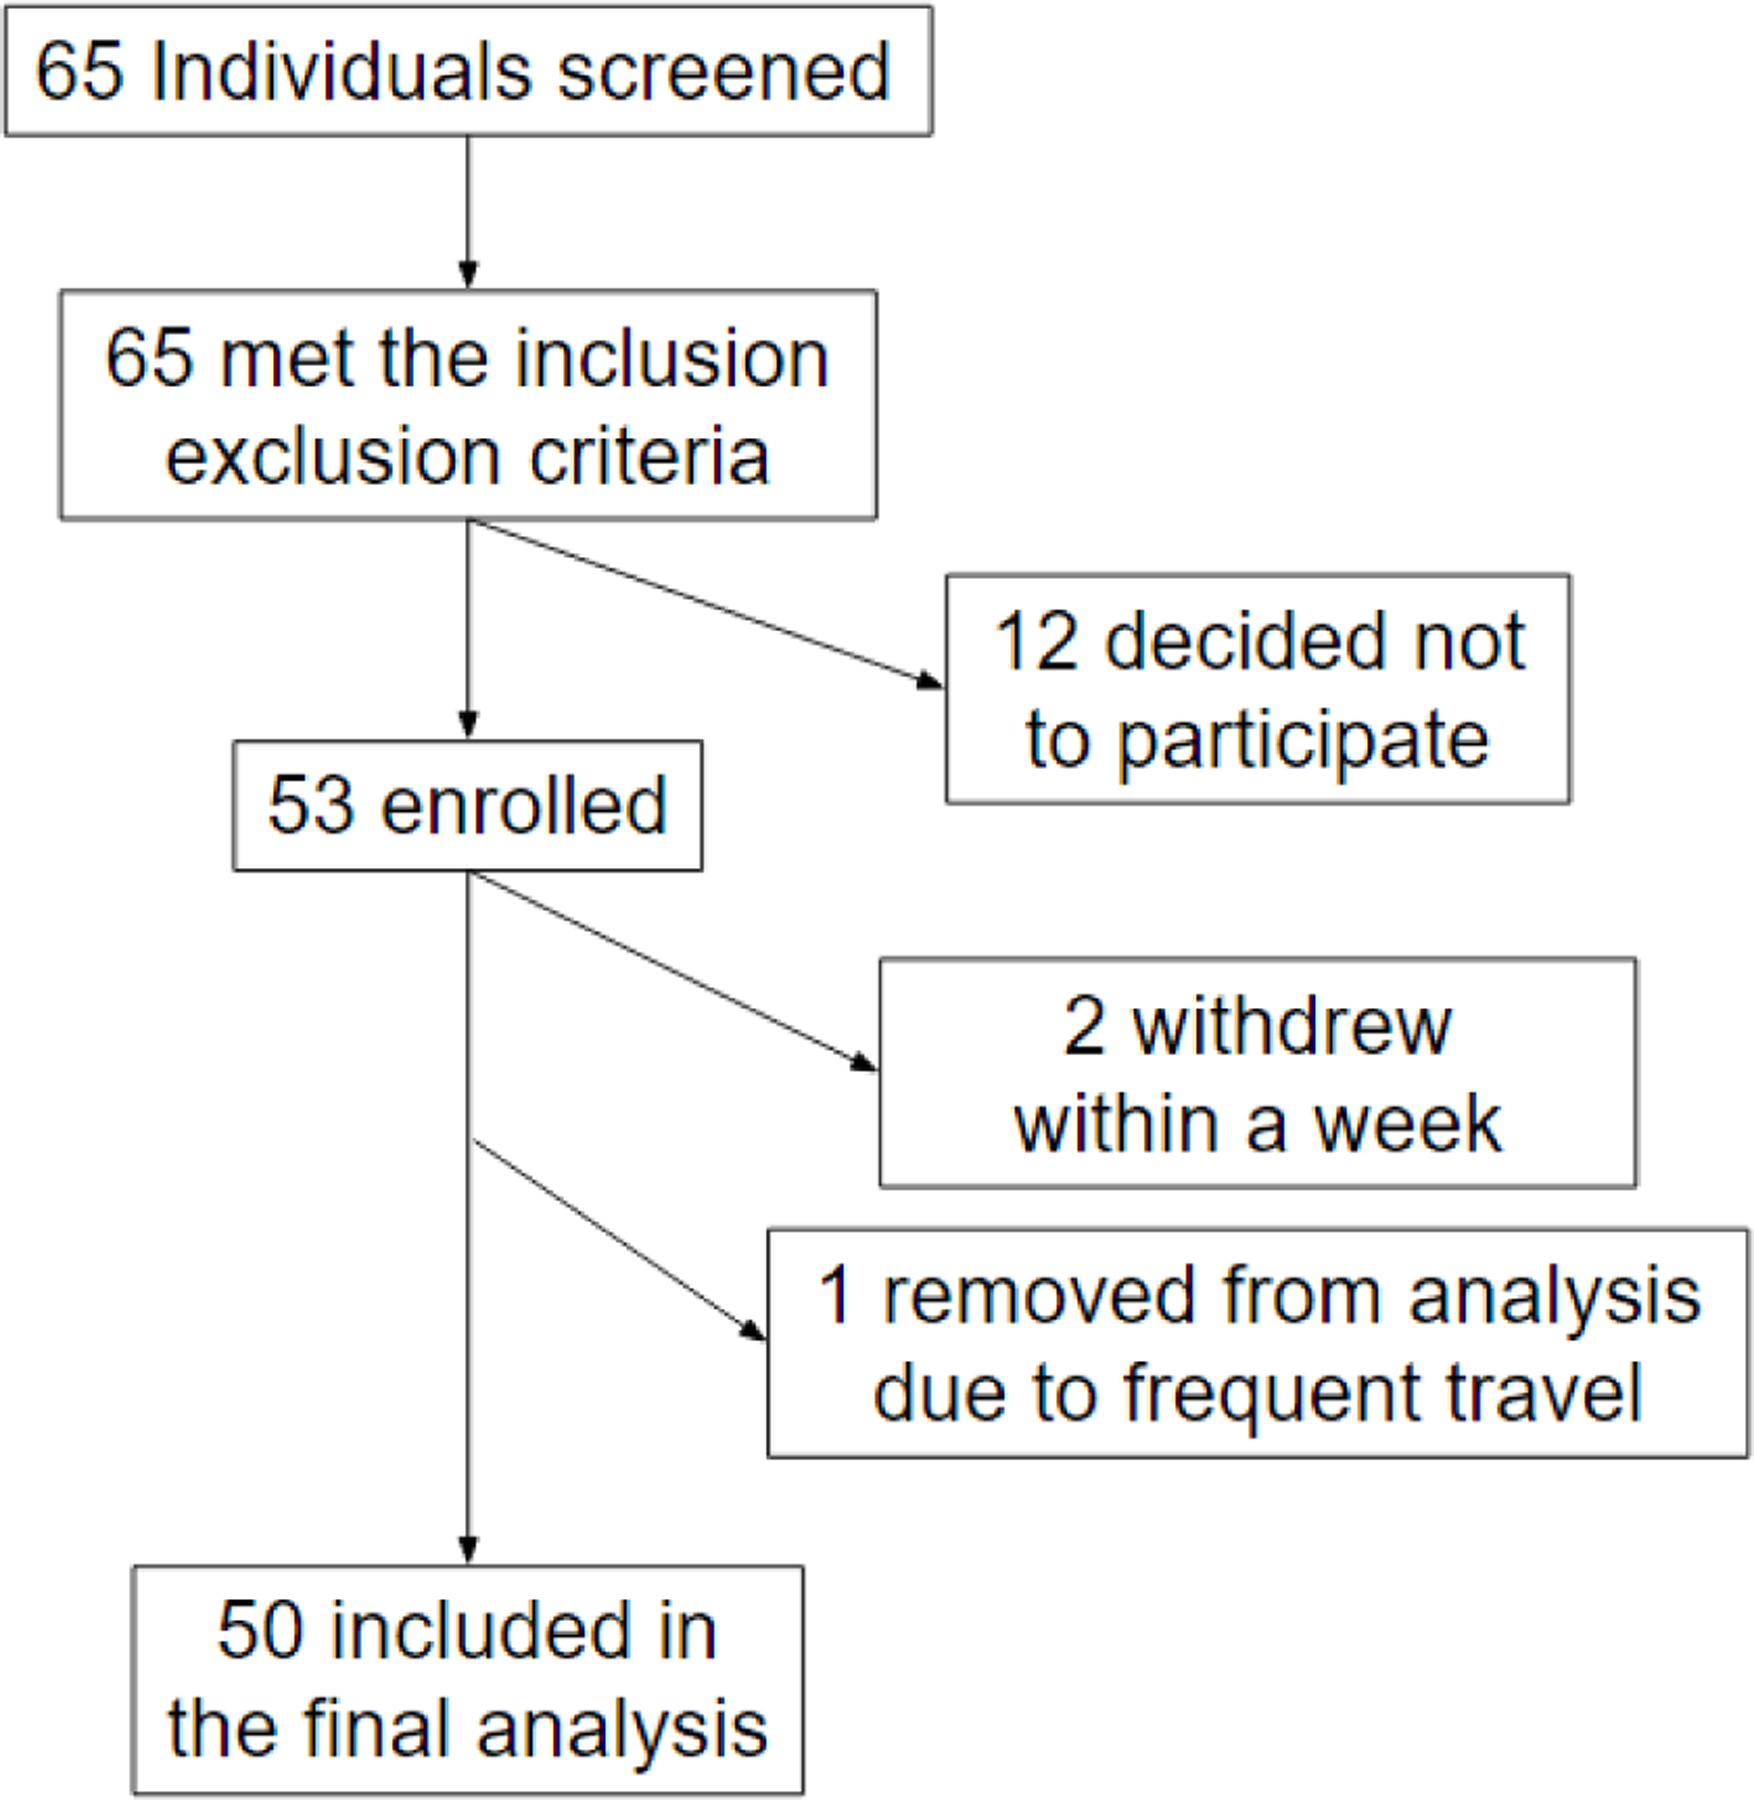
Enrollment and retention of participants
Figure 5.
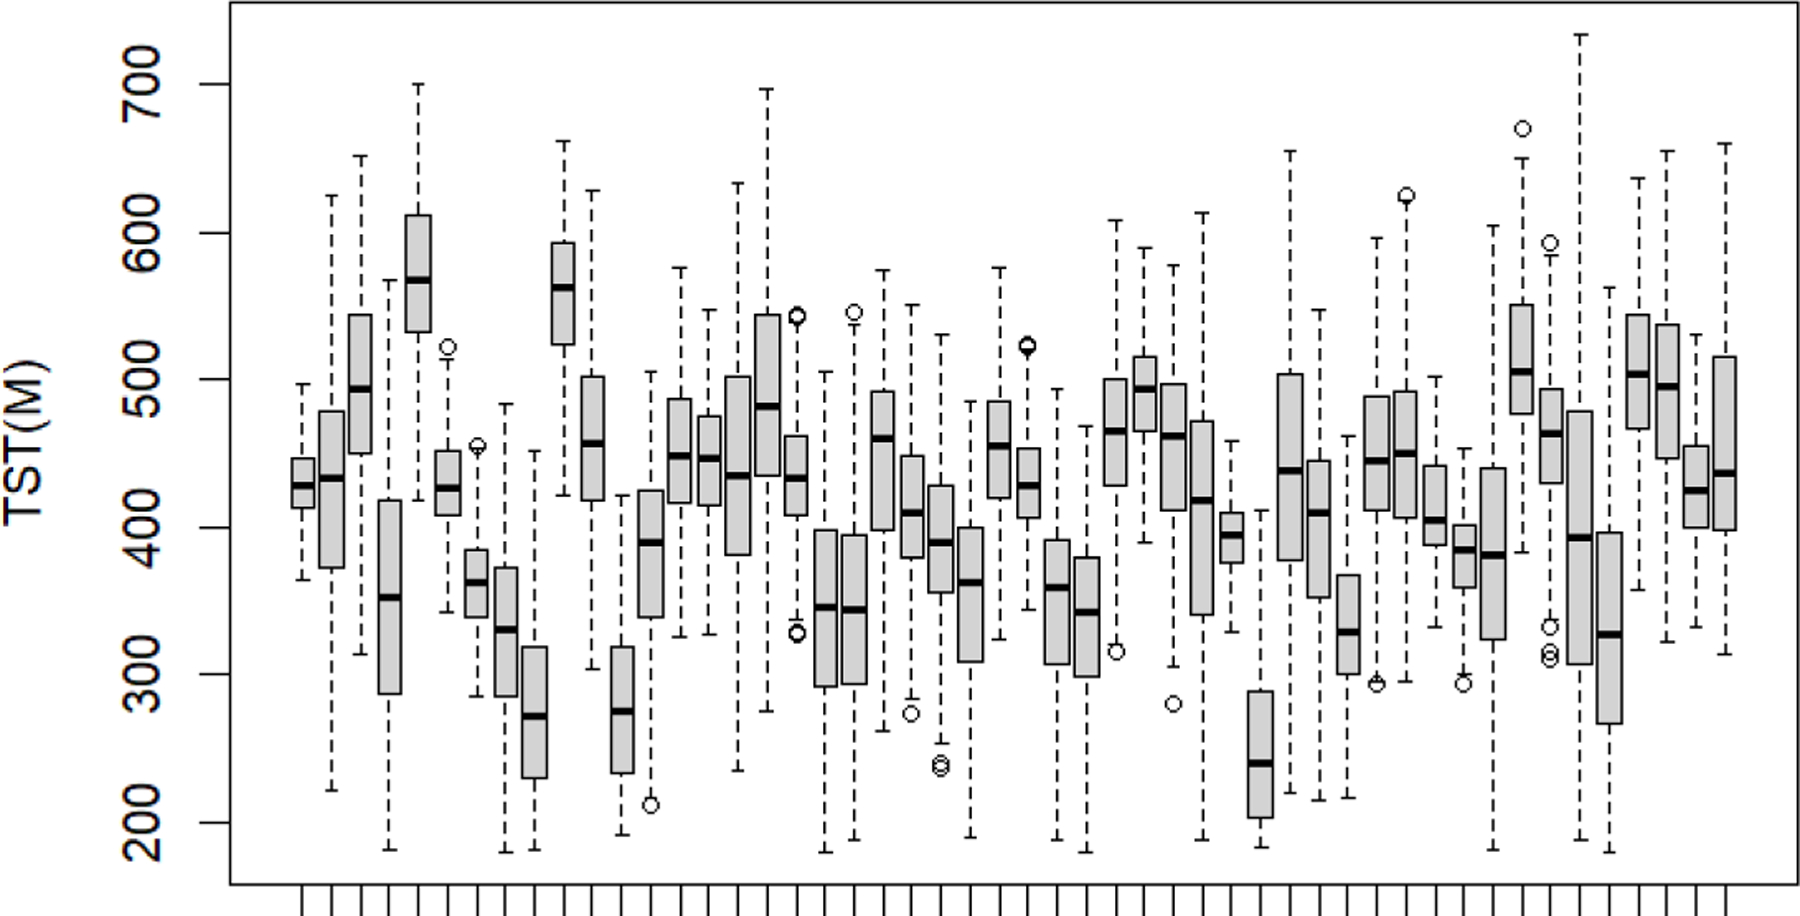
Total Sleep Time by participant. Each box includes all the data from a specific participant.
Table 1.
Participants’ characteristics
| Characteristic | Mean | SD |
|---|---|---|
| Age (y) | 79 | 7.2 |
| SPPB score (out of 12) | 9.4 | 2.44 |
| MoCA score (out of 30) | 25.6 | 3.12 |
| Comorbidity Index | 5.5 | 2.3 |
| SE (%) | 81 | 9.9 |
| TST (minutes) | 420 | 83.6 |
| RSTLS (%) | 6 | 2.4 |
| Bedroom nighttime ambient temperature | 21.8 | 2.5 |
| Biological Sex | Female: 41 Male:9 |
|
| Race | White: 46 Black:3 Non-white Latino:1 |
|
| Education | < 2y of college: 5 > 2y of college: 45 |
|
| Living Status | Alone: 30 With a partner: 20 |
|
| Housing type | Subsidized housing:14 Private housing: 36 |
|
Bedroom ambient temperature was associated with sleep in older adults.
These associations were independent of other environmental and personal factors.
Sleep quality was optimal between 20–25 °C and drops at higher and lower levels.
Substantial differences in optimal temperature were observed between subjects.
Funding and Acknowledgments
This study was supported by TMCITY foundation. Additionally, AB acknowledges support by a T32 fellowship through U.S. National Institute on Aging (T32AG023480).
Footnotes
Publisher's Disclaimer: This is a PDF file of an unedited manuscript that has been accepted for publication. As a service to our customers we are providing this early version of the manuscript. The manuscript will undergo copyediting, typesetting, and review of the resulting proof before it is published in its final form. Please note that during the production process errors may be discovered which could affect the content, and all legal disclaimers that apply to the journal pertain.
References
- 1.Hillman DR, Lack LC. Public health implications of sleep loss: the community burden. Medical Journal of Australia 2013;199:S7–S10. [DOI] [PubMed] [Google Scholar]
- 2.Buchanan DT, Cain K, Heitkemper M, et al. Sleep measures predict next-day symptoms in women with irritable bowel syndrome. Journal of Clinical Sleep Medicine 2014;10(9):1003–1009. [DOI] [PMC free article] [PubMed] [Google Scholar]
- 3.Cavuoto MG, Ong B, Pike KE, Nicholas CL, Bei B, Kinsella GJ. Objective but not subjective sleep predicts memory in community-dwelling older adults. Journal of sleep research 2016;25(4):475–485. [DOI] [PubMed] [Google Scholar]
- 4.Crowley K. Sleep and sleep disorders in older adults. Neuropsychology review 2011;21:41–53. [DOI] [PubMed] [Google Scholar]
- 5.Draganich C, Gerber D, Monden KR, et al. Disrupted sleep predicts next day agitation following moderate to severe brain injury. Brain injury 2019;33(9):1194–1199. [DOI] [PubMed] [Google Scholar]
- 6.Hasler BP, Troxel WM. Couples’ nighttime sleep efficiency and concordance: Evidence for bidirectional associations with daytime relationship functioning. Psychosomatic medicine 2010;72(8):794. [DOI] [PMC free article] [PubMed] [Google Scholar]
- 7.Jackson CL, Redline S, Emmons KM. Sleep as a potential fundamental contributor to cardiovascular health disparities. Annual review of public health 2015;36:417. [DOI] [PMC free article] [PubMed] [Google Scholar]
- 8.Johnson M, Duffy J, Dijk D, Ronda J, Dyal C, Czeisler C. Short-term memory, alertness and performance: a reappraisal of their relationship to body temperature. Journal of sleep research 1992;1(1):24–29. [DOI] [PubMed] [Google Scholar]
- 9.Miyata S, Noda A, Iwamoto K, Kawano N, Okuda M, Ozaki N. Poor sleep quality impairs cognitive performance in older adults. Journal of sleep research 2013;22(5):535–541. [DOI] [PubMed] [Google Scholar]
- 10.Nebes RD, Buysse DJ, Halligan EM, Houck PR, Monk TH. Self-reported sleep quality predicts poor cognitive performance in healthy older adults. The Journals of Gerontology: Series B 2009;64(2):180–187. [DOI] [PMC free article] [PubMed] [Google Scholar]
- 11.Tang NK, Sanborn AN. Better quality sleep promotes daytime physical activity in patients with chronic pain? A multilevel analysis of the within-person relationship. PloS one 2014;9(3):e92158. [DOI] [PMC free article] [PubMed] [Google Scholar]
- 12.Tsereteli N, Vallat R, Fernandez-Tajes J, et al. Impact of insufficient sleep on dysregulated blood glucose control under standardised meal conditions. Diabetologia 2022;65(2):356–365. [DOI] [PMC free article] [PubMed] [Google Scholar]
- 13.Ohayon MM, Carskadon MA, Guilleminault C, Vitiello MV. Meta-analysis of quantitative sleep parameters from childhood to old age in healthy individuals: developing normative sleep values across the human lifespan. Sleep 2004;27(7):1255–1273. [DOI] [PubMed] [Google Scholar]
- 14.Lan L, Pan L, Lian Z, Huang H, Lin Y. Experimental study on thermal comfort of sleeping people at different air temperatures. Building and Environment 2014/03/01/ 2014;73:24–31. doi: 10.1016/j.buildenv.2013.11.024 [DOI] [Google Scholar]
- 15.Lan L, Xia L, Tang J, Wyon DP, Liu H. Mean skin temperature estimated from 3 measuring points can predict sleeping thermal sensation. Building and Environment 2019/09/01/ 2019;162:106292. doi: 10.1016/j.buildenv.2019.106292 [DOI] [Google Scholar]
- 16.Fan X, Shao H, Sakamoto M, et al. The effects of ventilation and temperature on sleep quality and next-day work performance: pilot measurements in a climate chamber. Building and Environment 2022;209:108666. [Google Scholar]
- 17.Yetish G, Kaplan H, Gurven M, et al. Natural Sleep and Its Seasonal Variations in Three Pre-industrial Societies. Current Biology 2015/11/02/ 2015;25(21):2862–2868. doi: 10.1016/j.cub.2015.09.046 [DOI] [PMC free article] [PubMed] [Google Scholar]
- 18.Baniassadi A, Heusinger J, Sailor DJ. Energy efficiency vs resiliency to extreme heat and power outages: The role of evolving building energy codes. Building and Environment 7//2018;139:86–94. doi: 10.1016/j.buildenv.2018.05.024 [DOI] [Google Scholar]
- 19.Baniassadi A, Sailor DJ. Synergies and trade-offs between energy efficiency and resiliency to extreme heat–A case study. Building and Environment 2018;132:263–272. [Google Scholar]
- 20.Samuelson H, Claussnitzer S, Goyal A, Chen Y, Romo-Castillo A. Parametric energy simulation in early design: High-rise residential buildings in urban contexts. Building and Environment 2016;101:19–31. [Google Scholar]
- 21.Liao C, Akimoto M, Bivolarova MP, et al. A survey of bedroom ventilation types and the subjective sleep quality associated with them in Danish housing. Science of the Total Environment 2021;798:149209. [DOI] [PubMed] [Google Scholar]
- 22.Zuurbier M, van Loenhout JAF, le Grand A, Greven F, Duijm F, Hoek G. Street temperature and building characteristics as determinants of indoor heat exposure. Science of the Total Environment 2021;766:144376. [DOI] [PubMed] [Google Scholar]
- 23.Samuelson H, Baniassadi A, Lin A, Gonzalez PI, Brawley T, Narula T. Housing as a critical determinant of heat vulnerability and health. Science of The Total Environment 2020:137296. [DOI] [PubMed] [Google Scholar]
- 24.Quinn A, Tamerius JD, Perzanowski M, et al. Predicting indoor heat exposure risk during extreme heat events. Science of the total environment 2014;490:686–693. [DOI] [PMC free article] [PubMed] [Google Scholar]
- 25.Guo X, Huang G, Tu X, Wu J. Effects of urban greenspace and socioeconomic factors on air conditioner use: A multilevel analysis in Beijing, China. Building and Environment 2022/03/01/ 2022;211:108752. doi: 10.1016/j.buildenv.2022.108752 [DOI] [Google Scholar]
- 26.Wright MK, Hondula DM, Chakalian PM, et al. Social and behavioral determinants of indoor temperatures in air-conditioned homes. Building and Environment 2020/10/01/ 2020;183:107187. doi: 10.1016/j.buildenv.2020.107187 [DOI] [Google Scholar]
- 27.Ren X, Yan D, Wang C. Air-conditioning usage conditional probability model for residential buildings. Building and Environment 2014/11/01/ 2014;81:172–182. doi: 10.1016/j.buildenv.2014.06.022 [DOI] [Google Scholar]
- 28.Schellen L, Van Marken Lichtenbelt WD, Loomans MGLC, Toftum J, De Wit MH. Differences between young adults and elderly in thermal comfort, productivity, and thermal physiology in response to a moderate temperature drift and a steady-state condition. 10.1111/j.1600-0668.2010.00657.x. Indoor Air 2010/08/01 2010;20(4):273–283. doi: 10.1111/j.1600-0668.2010.00657.x [DOI] [PubMed] [Google Scholar]
- 29.van Hoof J, Hensen JL. Thermal comfort and older adults. Gerontechnology 2006;4(4):223–228. [Google Scholar]
- 30.Filiberto D, Wethington E, Pillemer K, Wells N, Wysocki M, Parise JT. Older people and climate change: Vulnerability and health effects. Generations 2009;33(4):19–25. [Google Scholar]
- 31.Kemp J, Després O, Pebayle T, Dufour A. Age-related decline in thermal adaptation capacities: An evoked potentials study. Psychophysiology 2014;51(6):539–545. [DOI] [PubMed] [Google Scholar]
- 32.Gaskin CJ, Taylor D, Kinnear S, Mann J, Hillman W, Moran M. Factors associated with the climate change vulnerability and the adaptive capacity of people with disability: a systematic review. Weather, Climate, and Society 2017;9(4):801–814. [Google Scholar]
- 33.Bai K-J, Liu W-T, Lin Y-C, et al. Ambient relative humidity-dependent obstructive sleep apnea severity in cold season: A case-control study. Science of The Total Environment 2023;861:160586. [DOI] [PubMed] [Google Scholar]
- 34.Hashizaki M, Nakajima H, Shiga T, Tsutsumi M, Kume K. A longitudinal large-scale objective sleep data analysis revealed a seasonal sleep variation in the Japanese population. Chronobiology international 2018;35(7):933–945. [DOI] [PubMed] [Google Scholar]
- 35.Obradovich N, Migliorini R, Mednick SC, Fowler JH. Nighttime temperature and human sleep loss in a changing climate. Science Advances 2017;3(5)doi: 10.1126/sciadv.1601555 [DOI] [PMC free article] [PubMed] [Google Scholar]
- 36.Baniassadi A, Sailor DJ, Krayenhoff ES, Broadbent AM, Georgescu M. Passive survivability of buildings under changing urban climates across eight US cities. Environmental Research Letters 2019;14(7):074028. [Google Scholar]
- 37.Baniassadi A, Yu W, Wong A, et al. Feasibility of High-Frequency Monitoring of the Home Environment and Health in Older Adults: Proof of Concept. Journal of Aging and Environment 2022:1–19. [DOI] [PMC free article] [PubMed] [Google Scholar]
- 38.Yan Y, Lan L, Zhang H, et al. Association of bedroom environment with the sleep quality of elderly subjects in summer: A field measurement in Shanghai, China. Building and Environment 2022/01/15/ 2022;208:108572. doi: 10.1016/j.buildenv.2021.108572 [DOI] [Google Scholar]
- 39.Williams AA, Spengler JD, Catalano P, Allen JG, Cedeno-Laurent JG. Building vulnerability in a changing climate: indoor temperature exposures and health outcomes in older adults living in public housing during an extreme heat event in Cambridge, MA. International journal of environmental research and public health 2019;16(13):2373. [DOI] [PMC free article] [PubMed] [Google Scholar]
- 40.Tsuzuki K, Mori I, Sakoi T, Kurokawa Y. Effects of seasonal illumination and thermal environments on sleep in elderly men. Building and Environment 2015;88:82–88. [Google Scholar]
- 41.Xiong J, Lan L, Lian Z, De Dear R. Associations of bedroom temperature and ventilation with sleep quality. Science and Technology for the Built Environment 2020;26(9):1274–1284. [Google Scholar]
- 42.Tsuzuki K, Sakoi T, Sakata Y. Effect of Seasonal Ambient Temperature on Sleep and Thermal Comfort in Older People Living in Public Elderly Facilities. Buildings 2021;11(12):574. [Google Scholar]
- 43.Altini M, Kinnunen H. The Promise of Sleep: A Multi-Sensor Approach for Accurate Sleep Stage Detection Using the Oura Ring. Sensors 2021;21(13):4302. [DOI] [PMC free article] [PubMed] [Google Scholar]
- 44.Hijmans RJ, Williams E, Vennes C, Hijmans MRJ. Package ‘geosphere’. Spherical trigonometry 2017;1(7):1–45. [Google Scholar]
- 45.Treacy D, Hassett L. The Short Physical Performance Battery. Journal of physiotherapy 2017;64(1):61–61. [DOI] [PubMed] [Google Scholar]
- 46.Freire AN, Guerra RO, Alvarado B, Guralnik JM, Zunzunegui MV. Validity and reliability of the short physical performance battery in two diverse older adult populations in Quebec and Brazil. Journal of aging and health 2012;24(5):863–878. [DOI] [PubMed] [Google Scholar]
- 47.Nasreddine ZS, Phillips NA, Bédirian V, et al. Montreal cognitive assessment. The American Journal of Geriatric Psychiatry 2003; [Google Scholar]
- 48.Smith T, Gildeh N, Holmes C. The Montreal Cognitive Assessment: validity and utility in a memory clinic setting. The Canadian Journal of Psychiatry 2007;52(5):329–332. [DOI] [PubMed] [Google Scholar]
- 49.Roffman C, Buchanan J, Allison G. Charlson comorbidities index. Journal of physiotherapy 2016;62(3) [DOI] [PubMed] [Google Scholar]
- 50.Wood SN. Generalized additive models: an introduction with R CRC press; 2017. [Google Scholar]
- 51.Zhang D A coefficient of determination for generalized linear models. The American Statistician 2017;71(4):310–316. [Google Scholar]
- 52.Cameron AC, Windmeijer FA. An R-squared measure of goodness of fit for some common nonlinear regression models. Journal of econometrics 1997;77(2):329–342. [Google Scholar]
- 53.Amodio S, Aria M, D’Ambrosio A. On concurvity in nonlinear and nonparametric regression models. Statistica 2014;74(1):85–98. [Google Scholar]
- 54.He S, Mazumdar S, Arena VC. A comparative study of the use of GAM and GLM in air pollution research. Environmetrics: The official journal of the International Environmetrics Society 2006;17(1):81–93. [Google Scholar]
- 55.Morlini I On multicollinearity and concurvity in some nonlinear multivariate models. Statistical Methods and Applications 2006;15(1):3–26. [Google Scholar]
- 56.Lee WV, Shaman J. Heat-coping strategies and bedroom thermal satisfaction in New York City. Science of the total environment 2017;574:1217–1231. [DOI] [PMC free article] [PubMed] [Google Scholar]
- 57.Slavish DC, Dietch JR, Kane HS, et al. Daily stress and sleep associations vary by work schedule: A between-and within-person analysis in nurses. Journal of Sleep Research 2022:e13506. [DOI] [PMC free article] [PubMed] [Google Scholar]
- 58.Vigoureux TF, Lee S. Individual and joint associations of daily sleep and stress with daily well-being in hospital nurses: an ecological momentary assessment and actigraphy study. Journal of Behavioral Medicine 2021;44:320–332. [DOI] [PubMed] [Google Scholar]
- 59.Heiland EG, Ekblom Ö, Bojsen-Møller E, Larisch L-M, Blom V, Ekblom MM. Bidirectional, day-to-day associations between objectively-measured physical activity, sedentary behavior, and sleep among office workers. International Journal of Environmental Research and Public Health 2021;18(15):7999. [DOI] [PMC free article] [PubMed] [Google Scholar]
- 60.Spadola CE, Guo N, Johnson DA, et al. Evening intake of alcohol, caffeine, and nicotine: night-to-night associations with sleep duration and continuity among African Americans in the Jackson Heart Sleep Study. Sleep 2019;42(11) [DOI] [PMC free article] [PubMed] [Google Scholar]
- 61.Lunde L-H, Pallesen S, Krangnes L, Nordhus IH. Characteristics of sleep in older persons with chronic pain: a study based on actigraphy and self-reporting. The Clinical journal of pain 2010;26(2):132–137. [DOI] [PubMed] [Google Scholar]
- 62.Blågestad T, Pallesen S, Lunde L-H, Sivertsen B, Nordhus I-H, Grønli J. Sleep in older chronic pain patients: a comparative polysomnographic study. The Clinical journal of pain 2012;28(4):277–283. [DOI] [PubMed] [Google Scholar]
- 63.Krayenhoff ES, Moustaoui M, Broadbent AM, Gupta V, Georgescu M. Diurnal interaction between urban expansion, climate change and adaptation in US cities. Nature Climate Change 2018;8(12):1097. [Google Scholar]
Associated Data
This section collects any data citations, data availability statements, or supplementary materials included in this article.


