Abstract
This article highlights important performance metrics to consider when evaluating models developed for supervised classification or regression tasks using clinical data. We detail the basics of confusion matrices, receiver operating characteristic curves (ROC curves), F1 scores, precision recall curves, mean squared error, and other considerations when evaluating model performance. In this era defined by rapid proliferation of advanced prediction models, familiarity with various performance metrics beyond AUROC and the nuances of evaluating models’ value upon implementation is essential to ensure effective resource allocation and optimal patient care delivery.
This article details different metrics to evaluate clinical prediction model performance. In a era defined by rapid proliferation of advanced prediction models, familiarity with various performance metrics beyond AUROC and the nuances of evaluating models’ value upon implementation is essential to ensure effective resource allocation and optimal patient care delivery.
Introduction
Class imbalance (relatively few cases compared with controls), differing disease prevalence across populations, and algorithmic fairness necessitate a robust strategy to evaluate performance of clinical prediction models. This article highlights important performance metrics to consider when evaluating models developed for supervised classification or regression tasks using clinical data.
Classification
Confusion Matrices
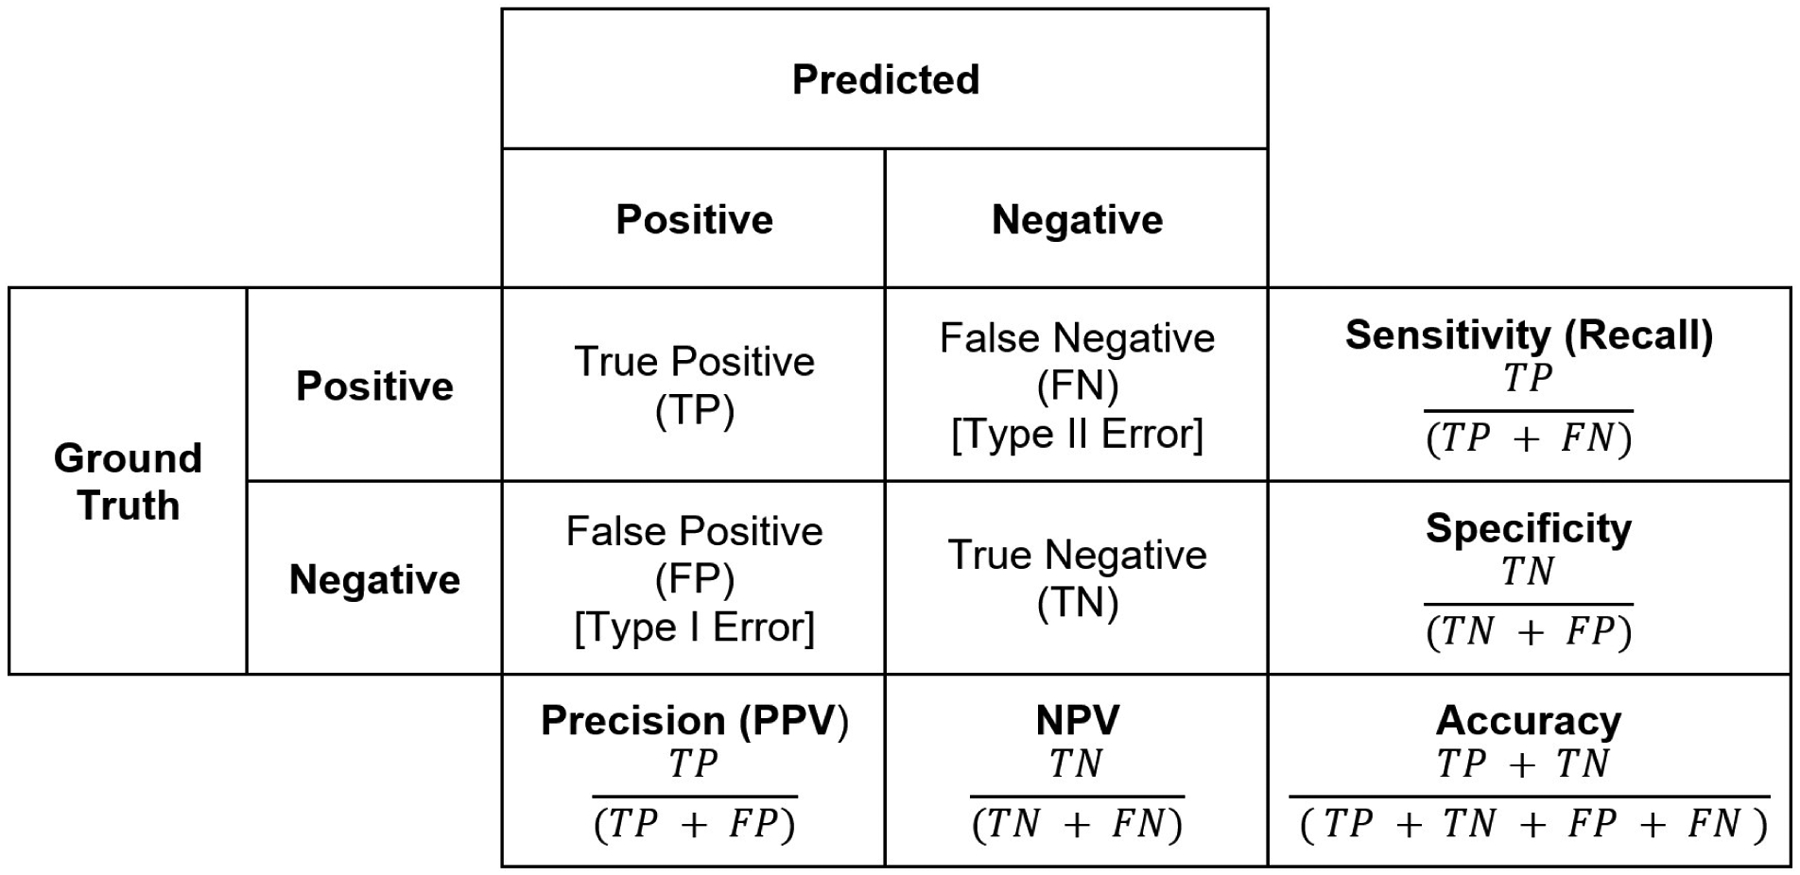
Classification tasks constitute predicting classes, such as disease or no disease. For binary classification tasks, confusion matrices facilitate calculating common discrimination performance metrics.1 Discrimination denotes a model’s ability to differentiate positives from negatives (i.e. patients with and without disease). Confusion matrices represent absolute truths as rows and predicted classifications as columns (Figure 1), delineating the number of true positives, false positives (type-I error), true negatives, and false negatives (type-II error). These values derive sensitivity (recall), specificity, positive predictive value (precision), negative predictive value, and accuracy. It is important to note that accuracy can be a misleading metric for imbalanced datasets: in a dataset with only 1% positive cases, a model that always predicts negatives would have 99% accuracy.
Figure 1. Confusion Matrix.

This matrix allows for calculation of key model metrics such as sensitivity/recall, specificity, precision, and accuracy.
Receiver Operating Characteristic Curve
Area under the receiver operating characteristic (AUROC) is one of the most commonly-reported discrimination metrics in prediction tool literature. Using variable probability thresholds between 0.0 and 1.0 for a model to classify subjects as positives or negatives, the receiver operating characteristic curve plots the true positive rate (sensitivity) on the Y-axis and the false positive rate (1 - specificity) on the X-axis.2 A perfect model would have 100% sensitivity (detects every positive case) and 100% specificity (detects no false positive cases), yet perfect models with AUROC of 1 are exceedingly rare. The receiver operating characteristic curve can guide choosing the optimal decision threshold to classify and positives and negatives; the optimal threshold would be both model and problem-specific.
The AUROC notes the probability that a model predicts a randomly-selected positive to have a higher probability being positive than a randomly-selected negative, but is commonly interpreted in simplistic fashion: a higher AUROC denotes better performance. While this is an acceptable intuition (AUROC of 0.5 denotes a model whose predictions are no better than flipping a coin, while an AUROC indicates perfect discrimination), the AUROC may overestimate performance in imbalanced datasets.3 If true negatives outnumber true positives, a model’s AUROC can be high simply by “correctly” predicting that the majority of negatives to be negative. Especially in imbalanced datasets, the AUROC alone is an insufficient representation of model discrimination, and should be interpreted with caution. Of note, an AUROC lower than 0.5 likely reflects indicate dataset mislabeling positives and negatives and should prompt further investigation.
F1 score and Area Under the Precision Recall Curves
An adjunct discrimination metric to the AUROC for imbalanced datasets is the F1 score. The F1 score represents the harmonic mean between precision (positive predictive value) and recall (sensitivity), reflecting not only the quantity of errors a model makes, but also the type of error (i.e. false positives or false negatives).2 Similar to the AUROC, area under the precision and recall curve (AUPRC) constitutes the area under a curve generated using variable model decision thresholds to plot precision (Y-axis) against recall (X-axis).4 While the “baseline” AUROC value is 0.5, the “baseline” AUPRC represents the prevalence of positive cases in the study population and is typically lower than 0.5.
Regression
Mean Squared Error
Regression tasks constitute predicting a continuous outcome, such as the mmHg drop in blood pressure in response to a drug. Mean squared error (MSE) is a common metric to estimate regression model performance. The MSE is calculated by squaring the difference between a model’s predicted and observed (true) value, summing across all observed-predicted pairs, and dividing by the total number of observations.5 The squaring function ensures that all errors are positive and that large error values are penalized more than small errors. An MSE closer to 0 indicates a model with more accurate predictions, but a more interpretable metric may be the root mean squared error (RMSE; the square root of MSE), which quantifies error using the original data’s measurement units.
Other Considerations When Evaluating Model Performance
Calibration
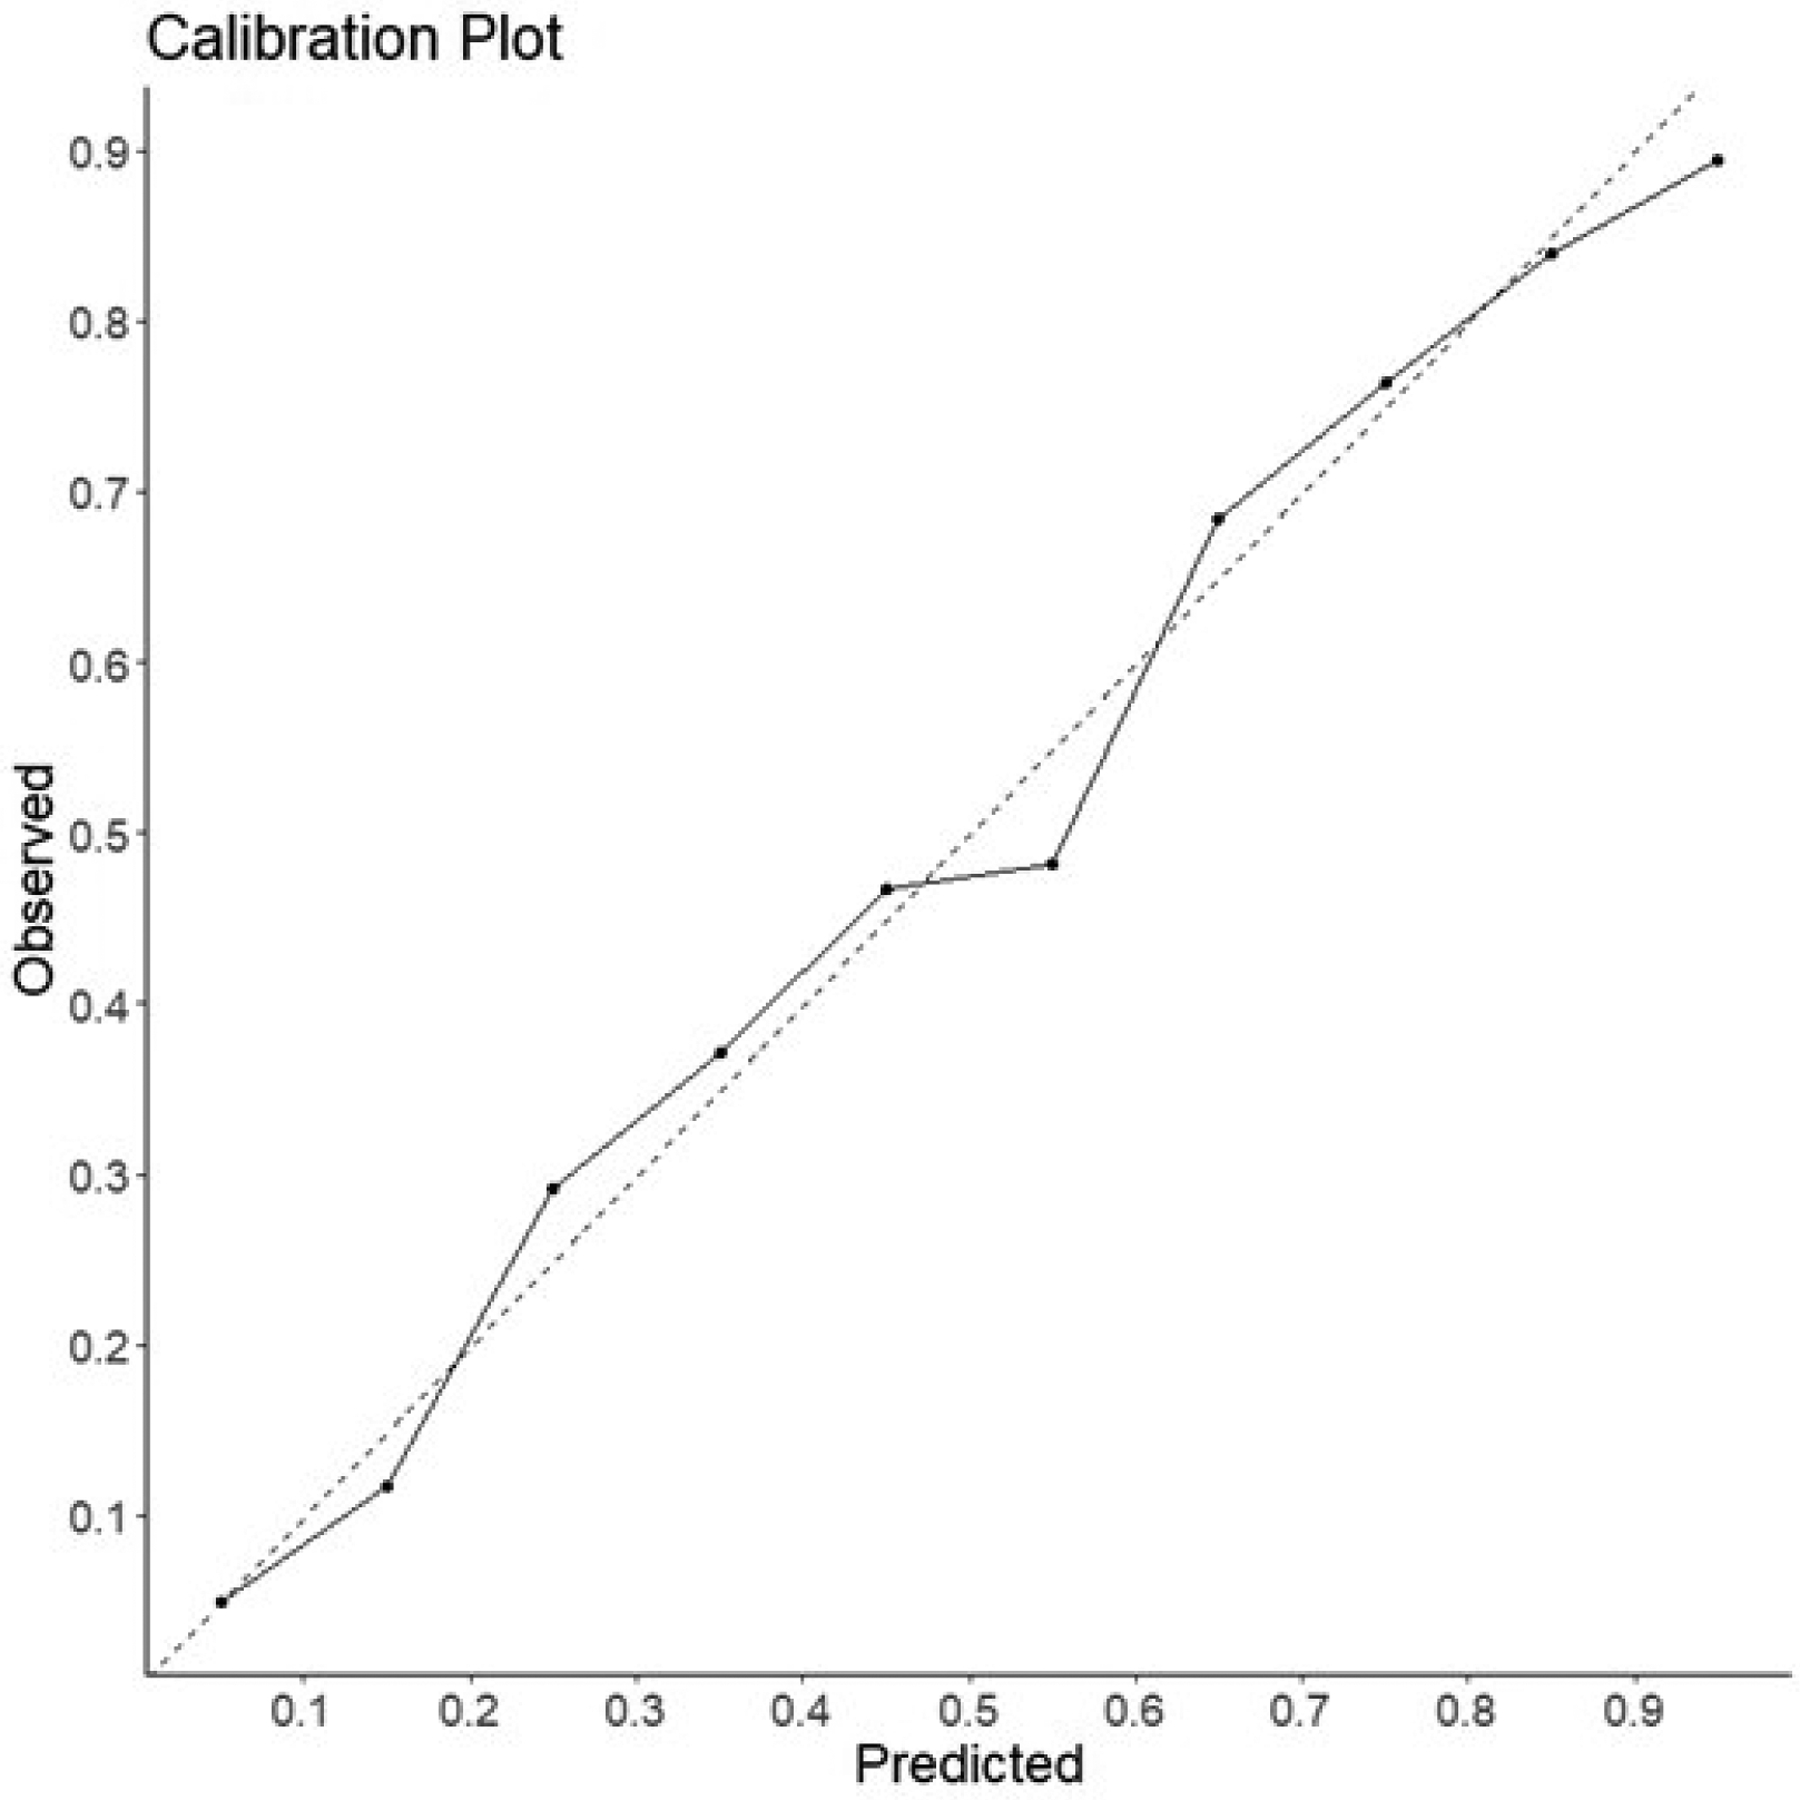
Calibration is another important, yet often-overlooked prediction model performance metric. Calibration is a measure of how well predicted probabilities reflect the true underlying probabilities of a study population.6 Calibration can be visualized using a calibration plot (Figure 2). This plot is created by taking a model’s predicted probabilities for a collection of samples with known outcomes. These samples are then separated into a defined number of bins (commonly 10 bins, [0–10%], [10–20%], etc). For each bin, the percentage of positive events is plotted on the y-axis relative to the center of each bin on the x-axis. The closer the plotted points are to a diagonal line plotted in the center of the graph, the better calibrated the model.
Figure 2: Calibration Plot.

These plots provide a visual example of predicted probablity relative to event rate in a collection of samples. Samples are divided into 10 bins based on their predicted probablity([0–10%], [10–20%], …). For each bin, the percentage of positive events is plotted on the y-axis relative to the center of each bin on the x-axis. The diagnol dashed line represents a perfectly calibrated model for reference.
It is important to note that discrimination and calibration performance are not necessarily correlated. For example, a model that globally predicts risk to be higher than observed for both cases and controls may have high discrimination but poor calibration performance. Most clinical decisions are made based on estimated risk; reporting calibration performance is essential.7
Algorithmic Fairness
Prediction models may have high discrimination and calibration performance, yet exhibit bias. For example, models trained on data that themselves encapsulate systematically poor treatment of certain racial/ethnic, gender or socioeconomic groups, simply learn this bias and could amplify discriminatory practices. Algorithmic fairness is a fast-growing field of machine learning that aims to improve how we evaluate and adjust for bias in pre-specified groups.8 While metrics such as equalized odds and demographic parity can be used to assess systematically poor model performance among certain groups, using these metrics to optimize models during training requires caution. For example, training a model to maximize equalized odds rather than F1 scores could yield poor performance across all groups.9
Net Benefit Analysis and Decision Curves
High-performing models are not necessarily useful. Useful prediction models should facilitate making better clinical decisions when deployed. Depending on the performance metric that is optimized, high-performing models could even cause inadvertent harm upon implementation. For example, a highly-sensitive cancer diagnostic tool could facilitate early detection of cancers, but false positives could lead to more unnecessary biopsies, anxiety, and healthcare costs.
Net benefit analysis is one way to evaluate the value of new prediction models upon implementation.10 Simply put; net benefit is the benefit derived from the implementation of a model (true positives/n) minus the harm from implementation (false positives/n). To put harm on the same scale as benefit, harm must be multiplied by an exchange rate. In a clinical scenario in which a positive test from a model would prompt a biopsy, the exchange rate would be determined by the number of biopsies leading to a positive diagnosis divided by the accepted number of unnecessary biopsies. The calculated net benefit can be used to compare different prediction models comparison or to create a decision curve. Decision curves plot calculated net benefit of a model across a range of probability thresholds (i.e. the level of predicted risk output by a model that is considered to be positive and warrants intervention). Decision curves facilitate visualizing which specific recommendation (e.g. prediction model output, intervening on everyone, intervening on no one) would yield the highest net benefit across variable probability thresholds.
Conclusion
No single metric should be used in isolation to evaluate the performance of a clinical prediction model. Depending on the clinical task, a unique set of metrics must assess and communicate the advantages and drawbacks of using a model to inform clinical decision-making. Clinicians must also remember that high model performance does not equate to usefulness. In this era defined by rapid proliferation of advanced prediction models, familiarity with various performance metrics beyond AUROC and the nuances of evaluating models’ value upon implementation is essential to ensure effective resource allocation and optimal patient care delivery.
Funding/Support:
EGR - Doris Duke Charitable Foundation Clinical Scientist Development Award, NIH NHLBI 5K01HL14863903
Footnotes
Publisher's Disclaimer: This is a PDF file of an unedited manuscript that has been accepted for publication. As a service to our customers we are providing this early version of the manuscript. The manuscript will undergo copyediting, typesetting, and review of the resulting proof before it is published in its final form. Please note that during the production process errors may be discovered which could affect the content, and all legal disclaimers that apply to the journal pertain.
Conflicts of Interest/Disclosure:
Authors have no relevant conflicts of interest to disclose.
References
- 1.Ting KM. Confusion Matrix. In: Sammut C, Webb GI, eds. Encyclopedia of Machine Learning. Boston, MA: Springer US; 2010:209–209. [Google Scholar]
- 2.Powers D Evaluation: From Precision, Recall and F-Factor to ROC, Informedness, Markedness & Correlation. Mach Learn Technol. 2008;2. [Google Scholar]
- 3.Movahedi F, Padman R, Antaki JF. Limitations of receiver operating characteristic curve on imbalanced data: Assist device mortality risk scores. The Journal of Thoracic and Cardiovascular Surgery. 2021. [DOI] [PMC free article] [PubMed] [Google Scholar]
- 4.Boyd K, Eng KH, Page CD. Area under the Precision-Recall Curve: Point Estimates and Confidence Intervals. In: Advanced Information Systems Engineering. Springer Berlin Heidelberg; 2013:451–466. [Google Scholar]
- 5.Kuhn M, Johnson K. Applied Predictive Modeling. New York, NY: Springer New York; 2013. [Google Scholar]
- 6.Huang Y, Jiang X, Gabriel RA, Ohno-Machado L. Calibrating predictive model estimates in a distributed network of patient data. Journal of Biomedical Informatics. 2021;117:103758. [DOI] [PubMed] [Google Scholar]
- 7.Van Calster B, Mclernon DJ, Van Smeden M, Wynants L, Steyerberg EW. Calibration: the Achilles heel of predictive analytics. BMC Medicine. 2019;17(1). [DOI] [PMC free article] [PubMed] [Google Scholar]
- 8.Rajkomar A, Hardt M, Howell MD, Corrado G, Chin MH. Ensuring Fairness in Machine Learning to Advance Health Equity. Annals of Internal Medicine. 2018;169(12):866–872. [DOI] [PMC free article] [PubMed] [Google Scholar]
- 9.Foryciarz A, Pfohl SR, Patel B, Shah N. Evaluating algorithmic fairness in the presence of clinical guidelines: the case of atherosclerotic cardiovascular disease risk estimation. BMJ Health Care Inform. 2022;29(1):e100460. [DOI] [PMC free article] [PubMed] [Google Scholar]
- 10.Vickers AJ, Van Calster B, Steyerberg EW. Net benefit approaches to the evaluation of prediction models, molecular markers, and diagnostic tests. BMJ. 2016:i6. [DOI] [PMC free article] [PubMed] [Google Scholar]


