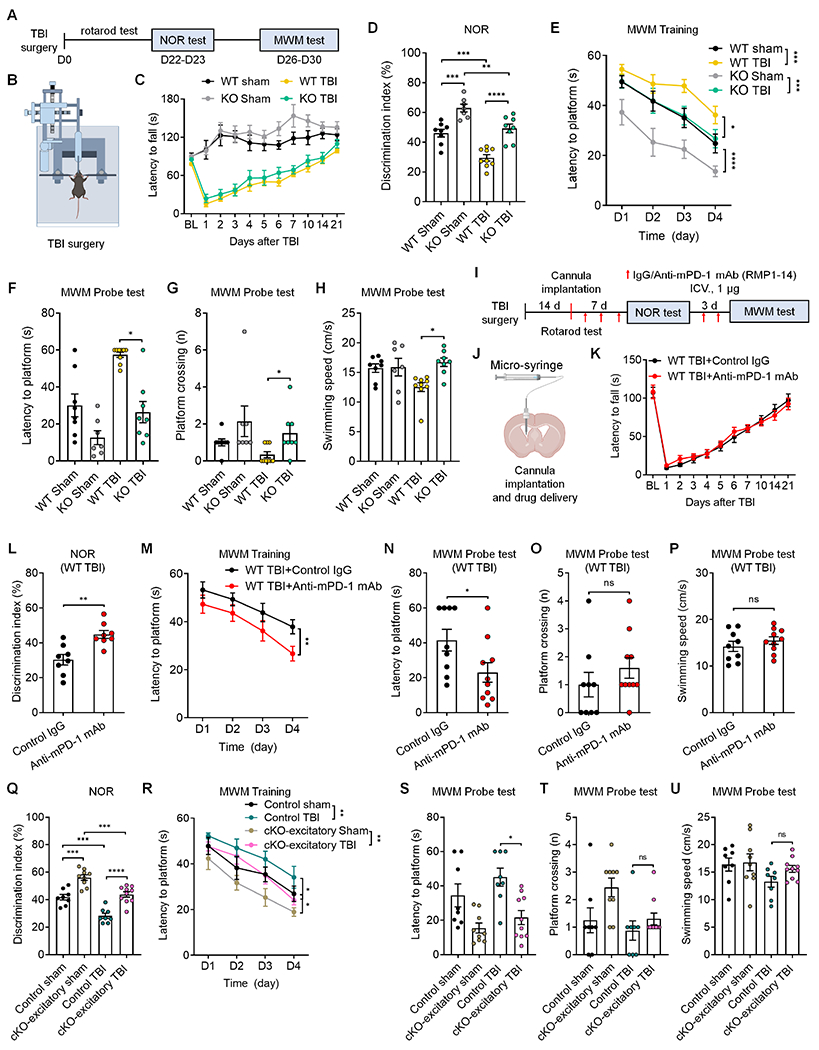
Figure 6. Suppression of PD-1 protects cognitive function after traumatic brain injury.

(A-C) Experimental paradigm (A), TBI illustration (B) and rotarod test (C) in WT mice and PD-1 KO mice with TBI or sham surgery.
(D) NOR testing shows cognitive deficits in both WT TBI mice and PD-1 KO TBI mice; but PD-1 KO TBI mice have a higher discrimination index than WT TBI mice.
(E) MWM training curves show deficits in both WT mice and PD-1 KO; but PD-1 KO mice with TBI spend less time on navigating the hidden platform location than WT mice with TBI.
(F-G) MWM probe tests for latency to platform (F) and number of platform zone crossings (G).
(H) MWM probe test shows higher swimming velocity in PD-1 KO TBI mice than WT TBI mice.
(I-K) Experimental paradigm (I), drug delivery (J) and rotarod test (K) in WT TBI mice treated with control IgG or anti-mPD-1 mAb.
(L) Discrimination index of WT TBI mice treated with control IgG and anti-mPD-1 mAb (RMP1-14) in NOR testing.
(M) Spatial learning curves during MWM training show significant improvement in WT TBI mice treated with RMP1-14 than control IgG.
(N-O) MWM probe test for latency to platform (N) and number of platform crossings (O) in control IgG and RMP1-14 treated mice.
(P) MWM probe test shows comparable swimming speed between control IgG and RMP1-14 treated TBI mice.
(Q) Discrimination index of control littermates and cKO-excitatory mice with TBI or sham surgery in NOR testing.
(R) Spatial learning curve during MWM training in control littermates and cKO-excitatory mice with TBI or sham surgery.
(S-U) MWM probe tests for latency to platform (S) and number of platform crossings (T) and swimming speed (U) in control littermates and cKO-excitatory mice with TBI or sham surgery.
Data are represented as mean ± SEM. Also see Figure S9. Sample size and statistical tests are reported in detail in Tables S1 and S5.
